Products
SentimenTrader Trading Tools
‍
Backtest Engine
My Trading Toolkit
Correlation Analysis
Seasonality
Market Prediction
Indicators & Data API
‍
Proprietary Indicators & Charts
Market Data API
Strategies & Scanner
‍
50+ Trading Strategies
Smart Stock Scanner
Smart Option Scanner
Research Reports
‍
Research Solutions
Reports Library
Free Resources
Simple Backtest Calculator
Simple Seasonality Calculator
The Kelly Criterion Calculator
Sentiment Geo Map
Public Research Reports
Education
Sentiment Indicators
Technical Indicators
Pricing
Company
About
In the News
Testimonials
Client Success Stories
Contact
Log inLoginSign up
< BACK TO ALL REPORTS

Back-To-Back-To-Back Reversal

Jason Goepfert
2016-04-07
null

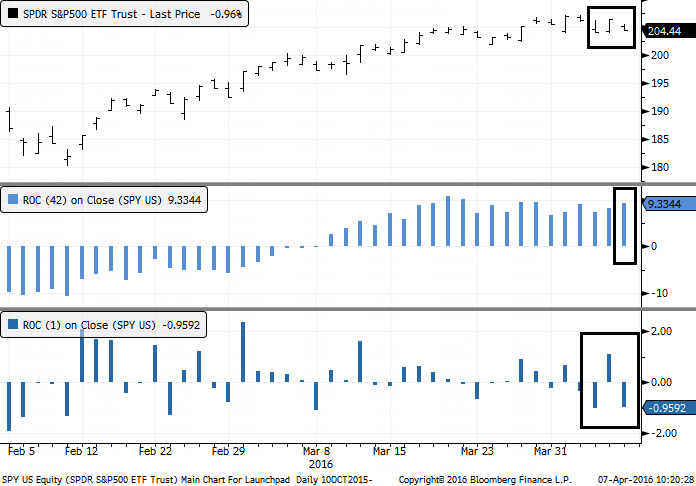
It's still early in the trading session but with a bit more weakness into the close, the S&P 500 would be on track to have back-to-back-to-back 1% reversals.

This kind of volatility after a large rally is widely considered to be a negative, as it indicates increasing uncertainty among traders and rising volatility is often a negative sign in general. In the chart, ROC stands for Rate Of Change, the percentage change over the past 42 days and 1 day, respectively.

20160407_reversal_chart

Let's go back to 1928 and look for any time the S&P had rallied at least 5% over the prior two months, and then had a 1% loss followed by 1% gain followed by 1% loss. Here are the returns going forward:

20160407_reversal_returns

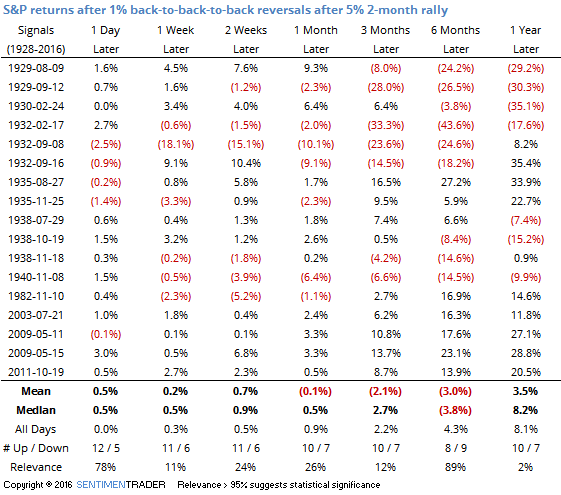
Overall returns were mixed with a negative tone. There were some large losses in the medium- to long-term but that was dominated by the 1930s. In modern markets, it wasn't so bad but the sample size is so small as to give little context. In the five times it happened since 1950, the S&P was higher six months later by at least 13% each time.

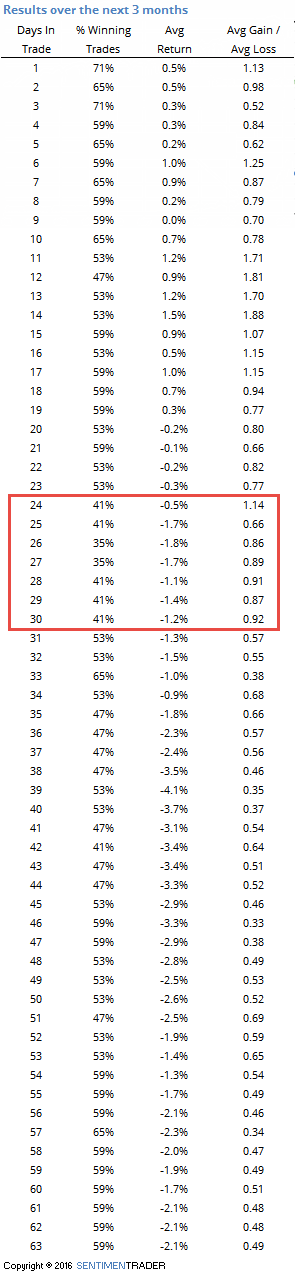
Looking at individual trading days, we can see that if there was consistent weakness, it tended to be between 24-30 days after the reversals occurred. Again, in modern markets these reversals have had less meaning, but we'd consider it a (very) minor negative when looking at the next 4-6 weeks or so.

20160407_reversal_days

PRODUCTS
SentimenTrader
Trading Tools
Indicators & Data API
‍
Strategies & Scanner
‍
Research Reports
FREE
RESOUrCES
Simple Backtest
Calculator
Simple Seasonality
Calculator
The Kelly Criterion
Calculator
Sentiment Geo Map
‍
Public Research Reports
‍
Education
Sentiment Indicators
‍
Technical Indicators
‍
Pricing
Bundle pricing
‍
FAQ
‍
Announcements
‍
COMPANY
‍
About
‍
In the News
‍
Testimonials
‍
Client Success Stories
CONTACT
‍
General Inquiries
‍
Media Inquiries
‍
Financial Professionals Inquiries
‍
© 2026 Sundial Capital Research Inc. All rights reserved.
Setsail Marketing
TermsPrivacyAffiliate Program
Risk Disclosure: The information and tools provided are for research and analytical purposes only and are not intended as investment advice. Market analysis involves uncertainty, and outcomes may differ from expectations. Users should conduct their own due diligence and consider their individual circumstances before making any financial decisions. Past performance is not necessarily indicative of future results.

Hypothetical Performance Disclosure: Hypothetical performance results have many inherent limitations, some of which are described below. No representation is being made that any account will or is likely to achieve profits or losses similar to those shown; in fact, there are frequently sharp differences between hypothetical performance results and the actual results subsequently achieved by any particular trading program. One of the limitations of hypothetical performance results is that they are generally prepared with the benefit of hindsight. In addition, hypothetical trading does not involve financial risk, and no hypothetical trading record can completely account for the impact of financial risk of actual trading. for example, the ability to withstand losses or to adhere to a particular trading program in spite of trading losses are material points which can also adversely affect actual trading results. There are numerous other factors related to the markets in general or to the implementation of any specific trading program which cannot be fully accounted for in the preparation of hypothetical performance results and all which can adversely affect trading results.

Testimonial Disclosure: Testimonials appearing on this website may not be representative of other clients or customers and is not a guarantee of future performance or success.