
Bear market probability is on the verge of plunging

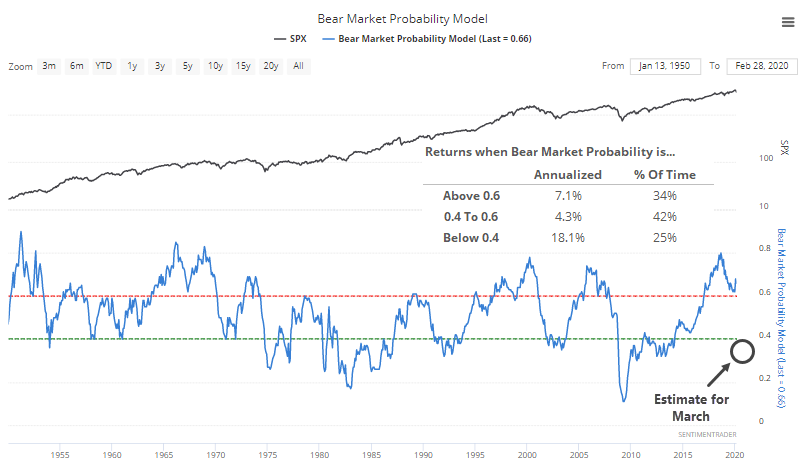
Back in the fall of 2018, we highlighted the dangerous condition of the Bear Market Probability Model. At the time, it suggested an 80% chance of a bear market ahead, one of the highest readings since 1950.
The model, outlined originally by Goldman Sachs, uses five fundamental inputs:
- U.S. Unemployment Rate
- ISM Manufacturing Index
- Yield Curve
- Inflation Rate
- P/E Ratio
Each month's reading is ranked versus all other historical readings and assigned a score. The higher the score, the higher the probability of a bear market in the months ahead.
We didn't enter a bear market after that high reading, even though stocks took a tumble over the next few months. But now that we have crashed into a bear market, it's worth exploring what kinds of conditions the model will now reflect.
Based on the latest estimates, it could plunge to below 40%.
Below, we can see every month since 1950 when the model fell below 40% for the first time in at least a year.
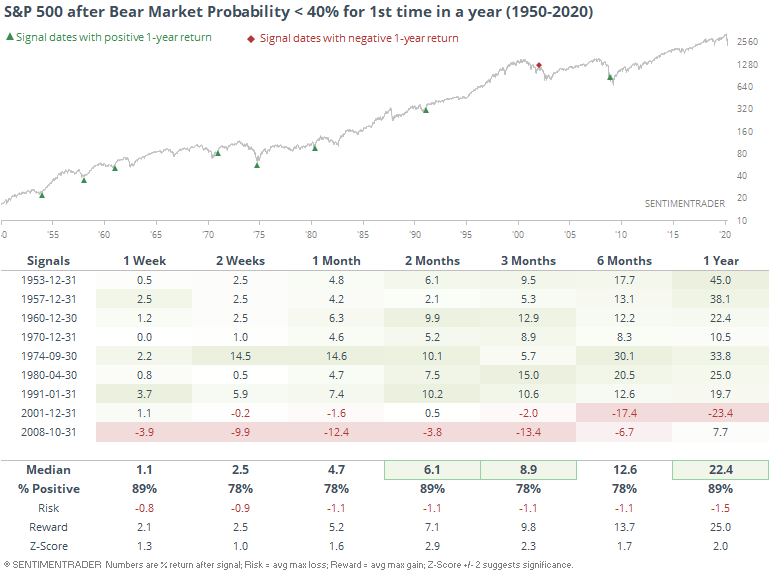
We don't know if this will happen, since many economic reports are in flux, and likely will be in the weeks ahead. And while it preceded excellent returns in prior decades, the last two signals were awfully early, so our confidence level in positive returns going forward is diminished.
One of the bigger drivers of the model is the unemployment rate, and if that climbs into the double-digits, which the St. Louis Fed thinks could be probable, then the model will almost certainly drop below 40%. Anything above 8% unemployment will push the model to an extreme. While it certainly means something in terms of human suffering, for the model's purposes, it doesn't matter much if that rate climbs to 10% or 30%. It just depends on how fast the numbers reflect current reality.
Should the rate jump, this model will plunge, and that has been a mostly positive sign for forward returns.