Products
SentimenTrader Trading Tools
‍
Backtest Engine
My Trading Toolkit
Correlation Analysis
Seasonality
Market Prediction
Indicators & Data API
‍
Proprietary Indicators & Charts
Market Data API
Strategies & Scanner
‍
50+ Trading Strategies
Smart Stock Scanner
Smart Option Scanner
Research Reports
‍
Research Solutions
Reports Library
Free Resources
Simple Backtest Calculator
Simple Seasonality Calculator
The Kelly Criterion Calculator
Sentiment Geo Map
Public Research Reports
Education
Sentiment Indicators
Technical Indicators
Pricing
Company
About
In the News
Testimonials
Client Success Stories
Contact
Log inLoginSign up
< BACK TO ALL REPORTS

Brazilian stocks on cusp of long-term recovery

Jason Goepfert
2022-02-16
The McClellan Summation Index for Brazil's Ibovespa Index is turning positive, ending a record-long streak in negative territory. Other times when internal momentum in the Ibovespa turned positive after 6 months in negative territory, it preceded remarkable long-term gains in the index.

Key points:

  • The McClellan Summation Index for Brazil's Ibovespa Index is about to turn positive
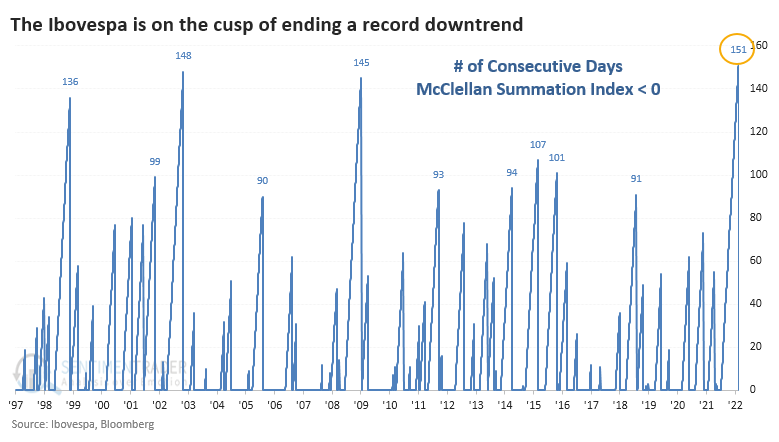
  • That will end a record-long streak in negative territory for the internal momentum indicator
  • Similar recoveries preceded short-term pullbacks, but impressive long-term gains

Internal momentum in Brazilian stocks is turning positive

The long-suffering investors in Brazil have finally gotten a reprieve, and it may last a while.

Last October, we showed how sellers were piling on Brazil. Stocks in the Ibovespa index were suffering a historic avalanche of selling pressure that subsided soon after. The Ibovespa chopped around until about a month ago and has been on a steady march higher ever since.

One of the guides we looked at was the McClellan Summation Index. It had been persistently and heavily negative for months. According to the Backtest Engine, the test we ran in October triggered a buy signal on January 21. It's now on the cusp of turning positive for the first time in more than 6 months.

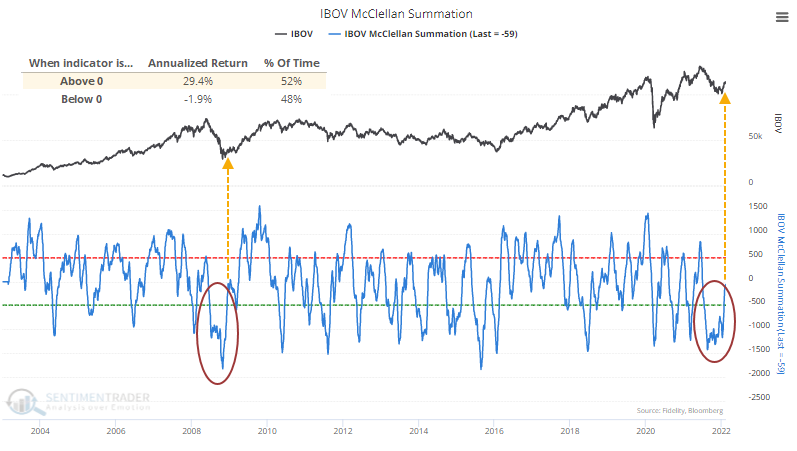
The Ibovespa has shown an extreme difference in performance depending on the position of the Summation Index. When it was above zero, the Ibovespa showed an annualized return of +29.4% since 1997. When the Summation Index was below zero, its annualized return plummeted to -1.9%.

The recovery above zero will end the longest-ever streak in negative territory dating back to at least 1997.

Similar recoveries preceded remarkable long-term gains

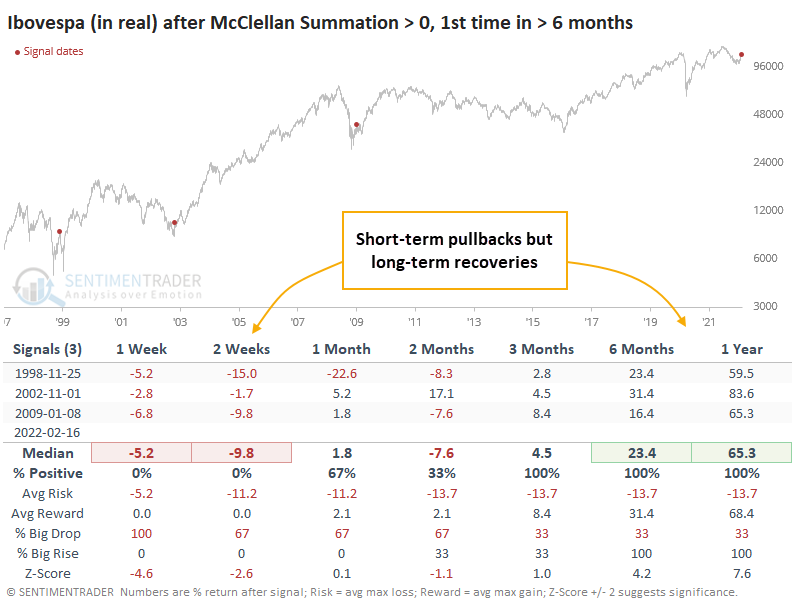
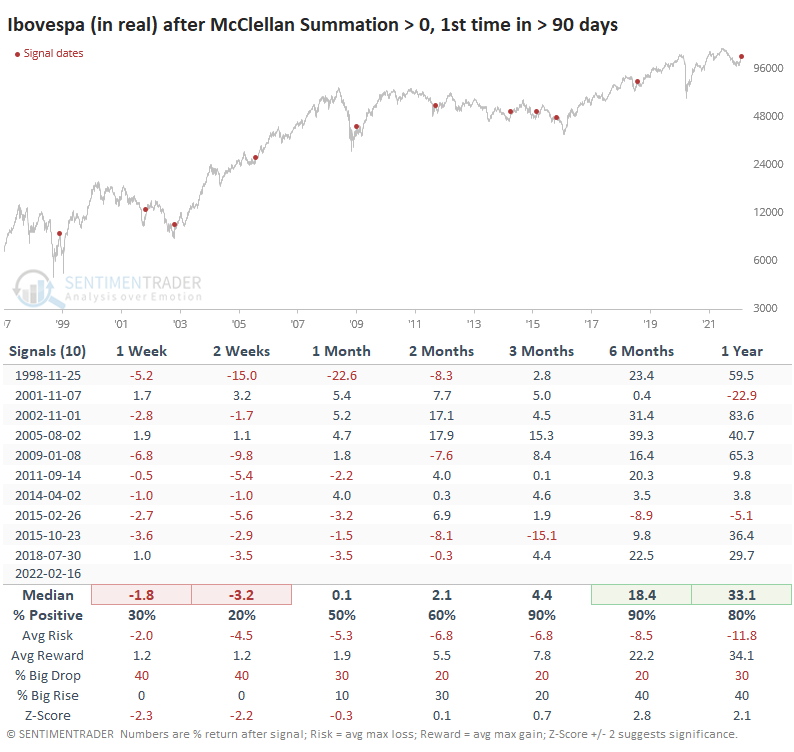
There were only a few other times when the Summation Index rose above zero for the first time in at least 6 months. Priced in reals, the Ibovespa showed a consistent tendency to settle back in the short-term (well, as much as we can determine consistency from a sample size of 3).

But all 3 also marked important long-term turning points in Brazilian stocks; the index sported double-digit gains over the next 6 months each time. A year later, the Ibovespa showed a remarkable average gain of more than 65%. I'm making the semi-safe assumption that the Summation Index is going to turn positive today, which it should.

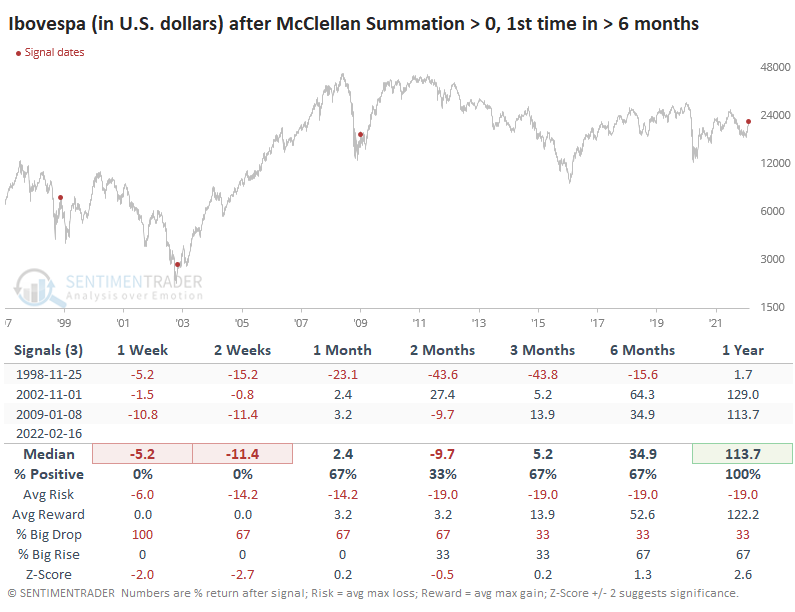
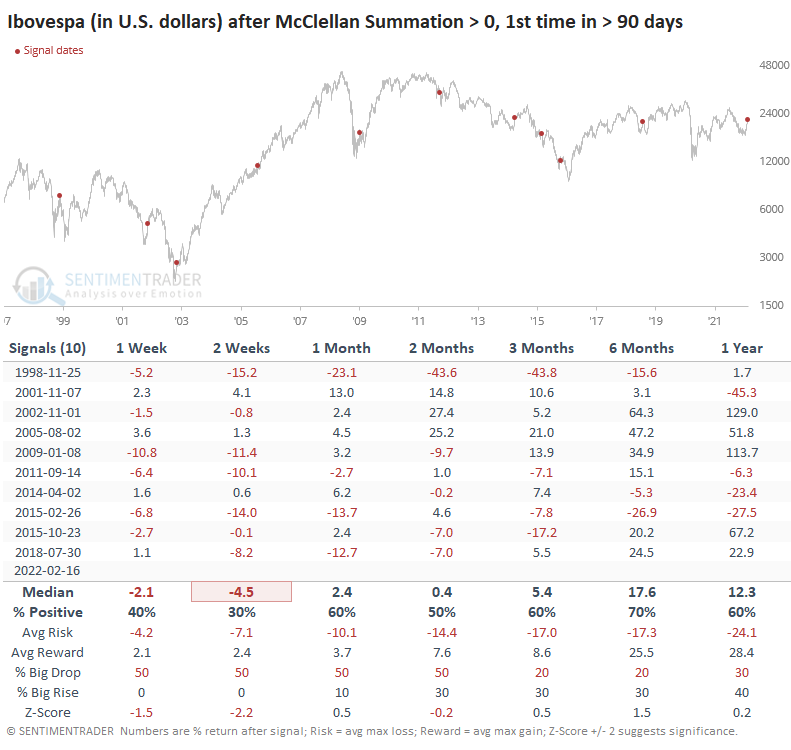
Thanks to periods of runaway inflation, the real has lost consistent ground against the U.S. dollar. When we price the Ibovespa in dollars, the McClellan Summation Index recoveries were less impressive but still positive over the next year.

Let's look at times when the Summation Index spent at least 90 days below zero (instead of at least 6 months) to get a larger sample size. After these, the Ibovespa still showed consistent short-term weakness, but returns over the next 3+ months were impressive.

The Ibovespa's returns were understandably less positive when priced in dollars but still had a long-term positive tone.

What the research tells us...

The historic level of selling pressure in Brazil's Ibovespa index last fall preceded a two-month consolidation phase. That has since resolved to the upside, and buying interest has been impressive. Long-term internal momentum indicators are now turning positive. While there are few precedents for comparison, the ones we have were consistent in hinting that we might see some short-term pullbacks as buyers take a breath, but it should indicate a much more positive long-term environment for those stocks.

PRODUCTS
SentimenTrader
Trading Tools
Indicators & Data API
‍
Strategies & Scanner
‍
Research Reports
FREE
RESOUrCES
Simple Backtest
Calculator
Simple Seasonality
Calculator
The Kelly Criterion
Calculator
Sentiment Geo Map
‍
Public Research Reports
‍
Education
Sentiment Indicators
‍
Technical Indicators
‍
Pricing
Bundle pricing
‍
FAQ
‍
Announcements
‍
COMPANY
‍
About
‍
In the News
‍
Testimonials
‍
Client Success Stories
CONTACT
‍
General Inquiries
‍
Media Inquiries
‍
Financial Professionals Inquiries
‍
© 2026 Sundial Capital Research Inc. All rights reserved.
Setsail Marketing
TermsPrivacyAffiliate Program
Risk Disclosure: The information and tools provided are for research and analytical purposes only and are not intended as investment advice. Market analysis involves uncertainty, and outcomes may differ from expectations. Users should conduct their own due diligence and consider their individual circumstances before making any financial decisions. Past performance is not necessarily indicative of future results.

Hypothetical Performance Disclosure: Hypothetical performance results have many inherent limitations, some of which are described below. No representation is being made that any account will or is likely to achieve profits or losses similar to those shown; in fact, there are frequently sharp differences between hypothetical performance results and the actual results subsequently achieved by any particular trading program. One of the limitations of hypothetical performance results is that they are generally prepared with the benefit of hindsight. In addition, hypothetical trading does not involve financial risk, and no hypothetical trading record can completely account for the impact of financial risk of actual trading. for example, the ability to withstand losses or to adhere to a particular trading program in spite of trading losses are material points which can also adversely affect actual trading results. There are numerous other factors related to the markets in general or to the implementation of any specific trading program which cannot be fully accounted for in the preparation of hypothetical performance results and all which can adversely affect trading results.

Testimonial Disclosure: Testimonials appearing on this website may not be representative of other clients or customers and is not a guarantee of future performance or success.