
Breadth momentum cools down

A lot of what we looked at from late March through May was related to thrusts in breadth and displays of historic momentum. Now that the trends in most indexes and stocks have plateaued, we're seeing those breadth and momentum figures come back toward neutral.
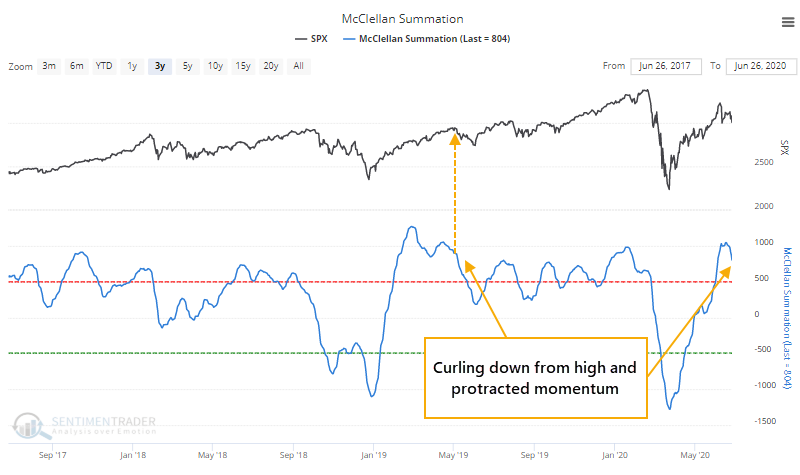
One of the better indications of this is the McClellan Summation Index. This long-term representation of momentum in advancing versus declining stocks spent several weeks above +800, thrusting above +1,000, and is now curling lower. The only time in recent years it did this was the spring of 2019 (it didn't quite make it above +1,000 earlier this year).
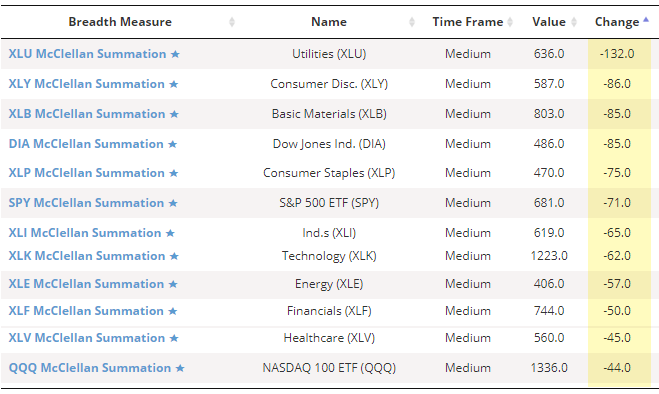
The Summation Indexes for the sectors we follow have also been coming down hard in recent days.
This is pretty much the opposite of what we saw on March 26, when the Summation Index was curling up from a very low level. That study showed consistent long-term positive implications.
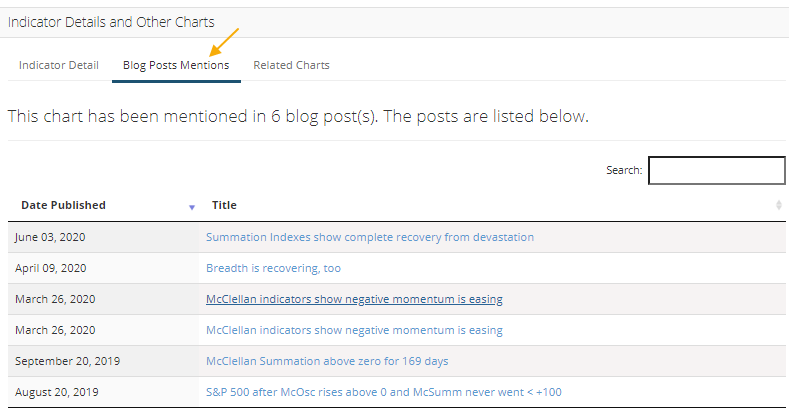
As an aside, if you want to see any recent research that we've posted about a particular indicator, pull up the chart, scroll down toward the bottom of the page and click "Blog Posts Mentions."
As far as implications go, when the Summation Index curls down from highly positive, protracted momentum, it has also been a good long-term sign.
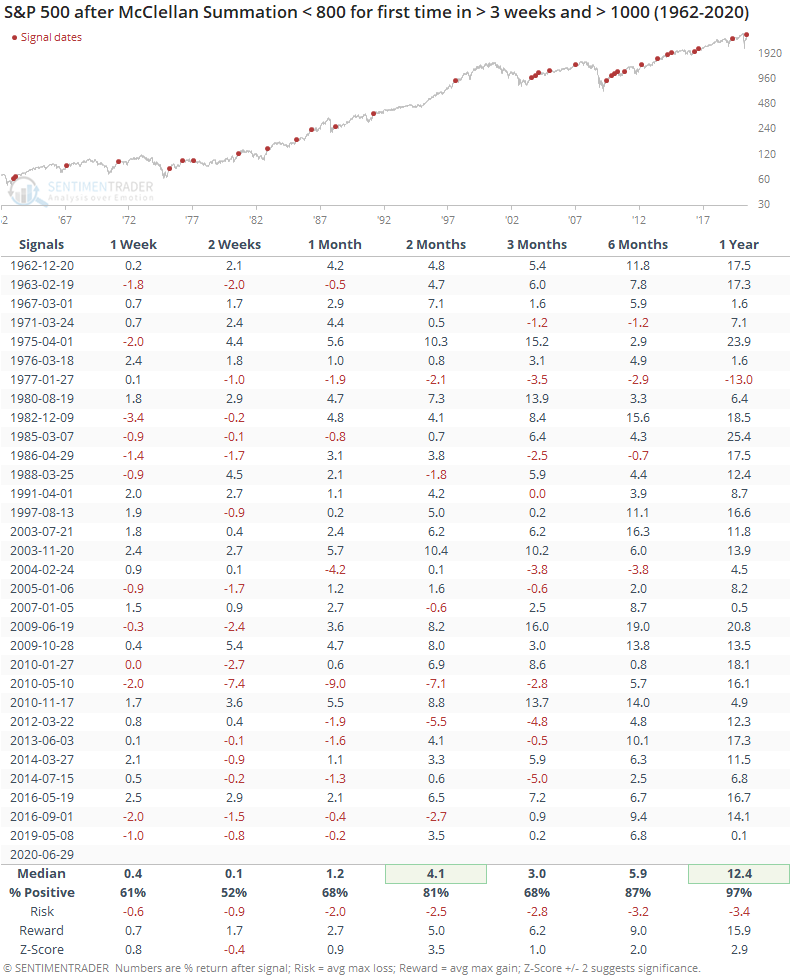
Shorter-term returns were mixed, turning positive over the medium-term, though the risk/reward still wasn't great. It wasn't until 6-12 months later that it suggested a strong bullish edge. Over the next six months, there were only a few small losses, and a year later, there was only a single loss.
Displays of extremely low breadth momentum have positive long-term implications, and displays of extremely high momentum do, too. We've seen both over the past few months.