
Breadth Momentum Crests As FX Volatility Plunges

Breadth surge has crested
After seeing a historic run in the momentum of stocks’ underlying breadth in January and February, indicators are showing diverging trends.
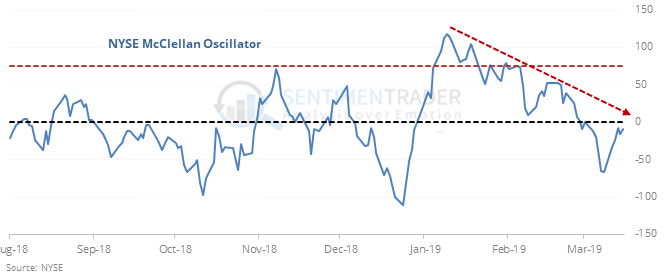
That’s to be expected after readings like January’s, and historically these “negative divergences” haven’t been so negative. Over the medium- to long-term, the S&P did very well, especially its consistency and average return. The risk/reward was decent, but not excellent.
No vol in FX
Volatility among currencies has been very low, and traders are pricing in the idea that it will continue.
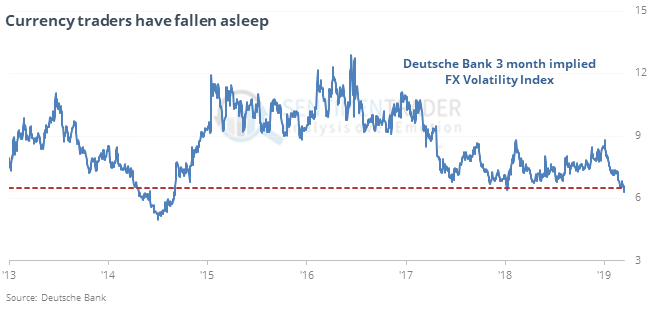
They’ve been mostly right shorter-term, not so much longer-term, as volatility in the dollar has doubled over the next year after other times it has dropped to this low of a level. It was a modest positive for commodities.
Questionable week
One of the more consistent seasonal tendencies over the past 7 years has been weakness after quarterly option expirations, especially in March. SPY has been negative during this week all 7 years. Real estate funds like IYR and VNQ have been the worst performers.
Good utilities
The McClellan Summation Index for the utilities sector has moved to an extreme, and 70% of the stocks have reached overbought levels. According to the Backtest Engine, that has preceded losses in XLU almost every time over the next 2 months.
Lagging small-caps
The S&P 500 has hit a 100-day high while the Russell 2000 is (was) more than 2% below its own 100-day day. Six months after other instances, the S&P was higher 88% of the time.
This post was an abridged version of our previous day's Daily Report. For full access, sign up for a 30-day free trial now.