Products
SentimenTrader Trading Tools
‍
Backtest Engine
My Trading Toolkit
Correlation Analysis
Seasonality
Market Prediction
Indicators & Data API
‍
Proprietary Indicators & Charts
Market Data API
Strategies & Scanner
‍
50+ Trading Strategies
Smart Stock Scanner
Smart Option Scanner
Research Reports
‍
Research Solutions
Reports Library
Free Resources
Simple Backtest Calculator
Simple Seasonality Calculator
The Kelly Criterion Calculator
Sentiment Geo Map
Public Research Reports
Education
Sentiment Indicators
Technical Indicators
Pricing
Company
About
In the News
Testimonials
Client Success Stories
Contact
Log inLoginSign up
< BACK TO ALL REPORTS

Building on a very good year

Jason Goepfert
2020-11-19
The S&P 500 is up around 10% through late November, which has tended to lead to further gains that build on momentum and seasonality. When the Nasdaq Composite gains 20% or more through this late in the year, it has also tended to keep following through.

In February, a double-digit gain for the year in the S&P would have seemed perfectly reasonable. A few weeks later, it would have seemed nearly impossible. And yet here we are.

Investment strategist Callie Cox from Ally noted that a double-digit gain in the S&P through these many days of the year has had a good record at preceding even more gains in recent decades as positive momentum builds on positive seasonality.

If we go back to 1928, then there is a long table of instances, and indeed the forward returns were impressively consistent.

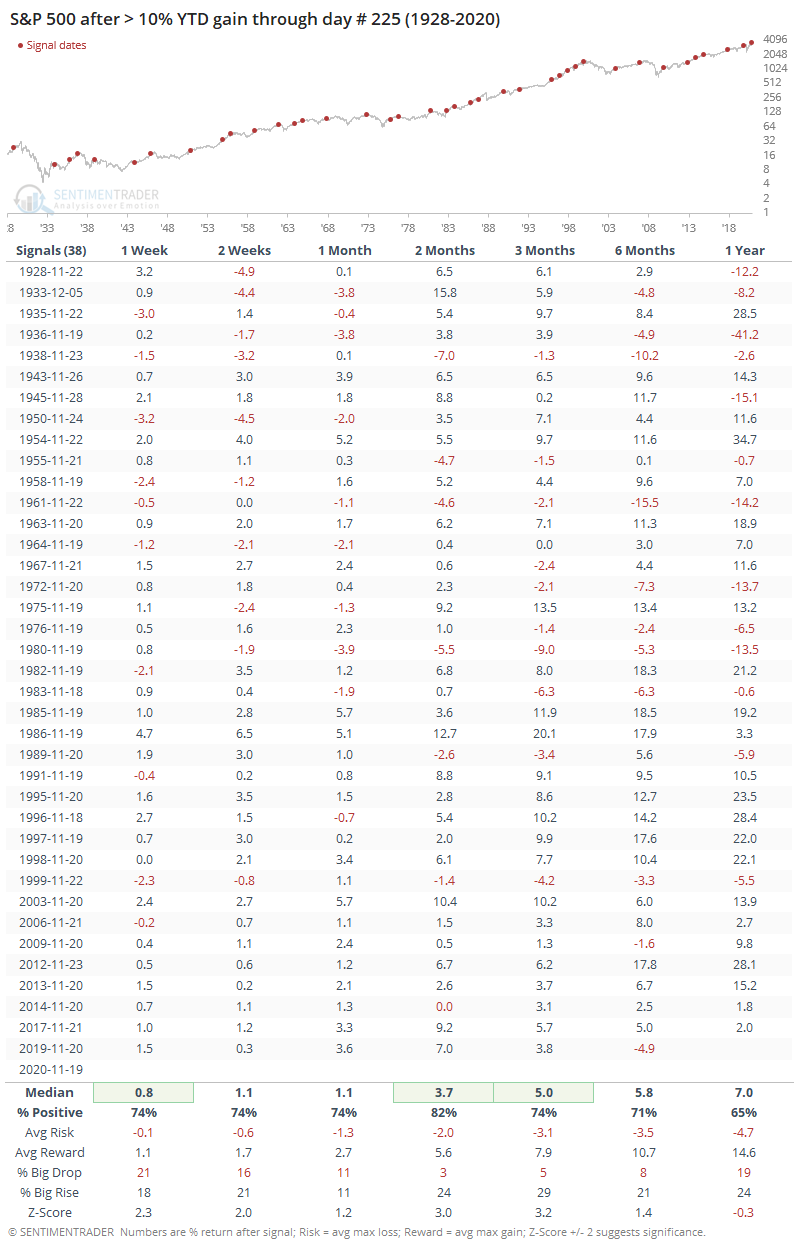
Since 1985, there was only a single loss either 2 or 4 weeks later, and both were less than -1%, so recent history has been very kind to these setups.

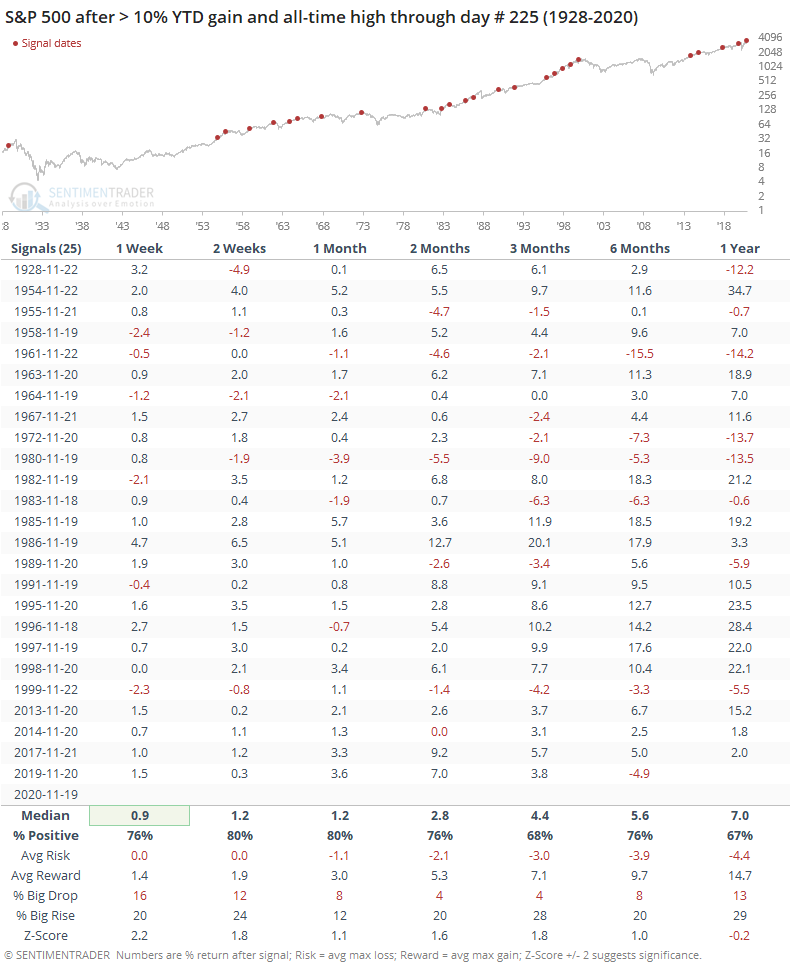
If we further stipulate that the index must have reached an all-time high at some point during the year, then it turns a little less positive, but mostly still showed gains over the next 2-4 weeks.

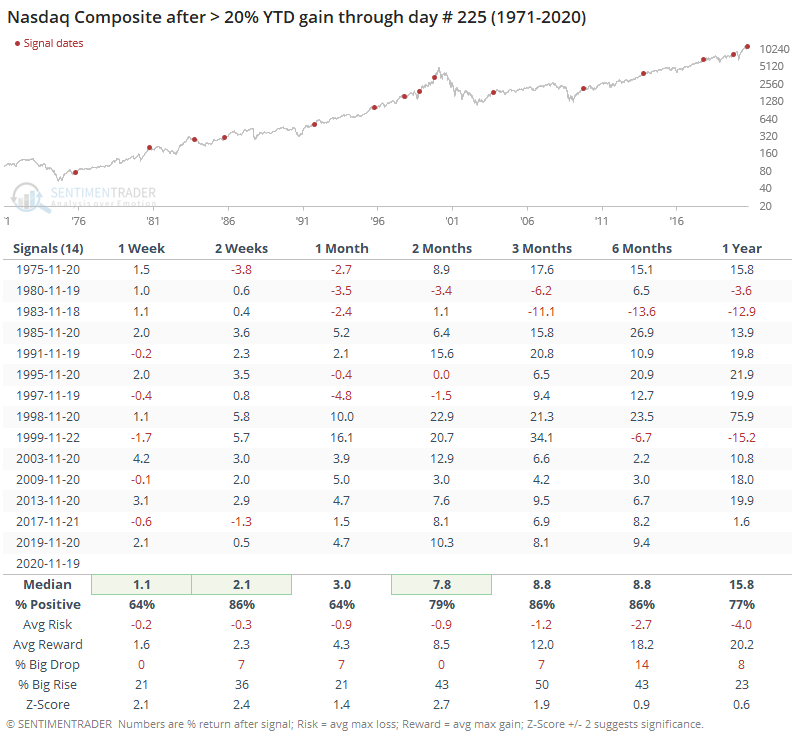
The Nasdaq has been even more impressive, with more than a 30% gain. If we relax that to a 20% gain to generate more of a sample size, then we can see that it, too, tended to continue to rally going forward.

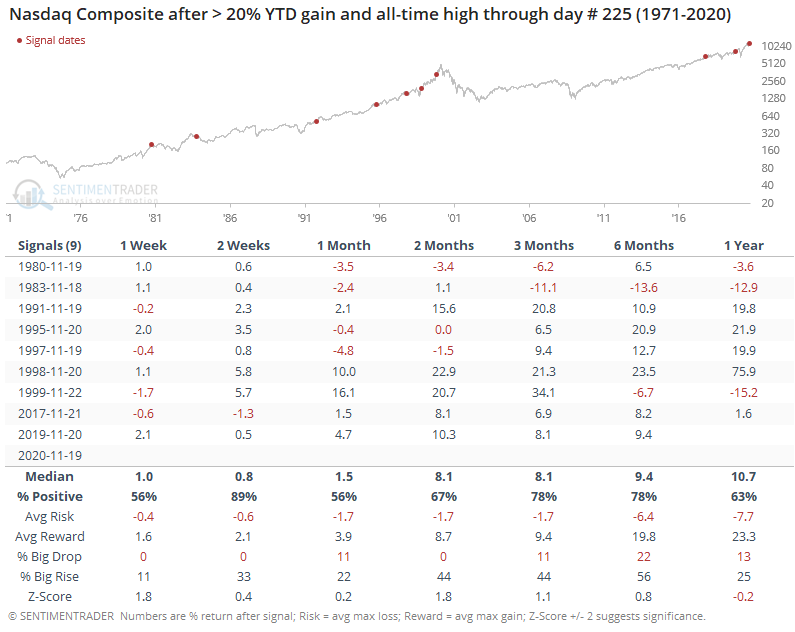
When it had also hit a fresh all-time high during the year, returns moderated somewhat like they did with the S&P, but over the next couple of weeks, there was only a single small loss that was quickly erased.

With a look at recent breadth thrusts and other signs of momentum, we've seen strong evidence that displays like the past couple of weeks have a strong tendency to persist. Seasonality is an iffy factor when it comes to stocks, but the combination of the two have been a compelling sign that the probability of a large and sustained decline seems relatively low.

PRODUCTS
SentimenTrader
Trading Tools
Indicators & Data API
‍
Strategies & Scanner
‍
Research Reports
FREE
RESOUrCES
Simple Backtest
Calculator
Simple Seasonality
Calculator
The Kelly Criterion
Calculator
Sentiment Geo Map
‍
Public Research Reports
‍
Education
Sentiment Indicators
‍
Technical Indicators
‍
Pricing
Bundle pricing
‍
FAQ
‍
Announcements
‍
COMPANY
‍
About
‍
In the News
‍
Testimonials
‍
Client Success Stories
CONTACT
‍
General Inquiries
‍
Media Inquiries
‍
Financial Professionals Inquiries
‍
© 2026 Sundial Capital Research Inc. All rights reserved.
Setsail Marketing
TermsPrivacyAffiliate Program
Risk Disclosure: The information and tools provided are for research and analytical purposes only and are not intended as investment advice. Market analysis involves uncertainty, and outcomes may differ from expectations. Users should conduct their own due diligence and consider their individual circumstances before making any financial decisions. Past performance is not necessarily indicative of future results.

Hypothetical Performance Disclosure: Hypothetical performance results have many inherent limitations, some of which are described below. No representation is being made that any account will or is likely to achieve profits or losses similar to those shown; in fact, there are frequently sharp differences between hypothetical performance results and the actual results subsequently achieved by any particular trading program. One of the limitations of hypothetical performance results is that they are generally prepared with the benefit of hindsight. In addition, hypothetical trading does not involve financial risk, and no hypothetical trading record can completely account for the impact of financial risk of actual trading. for example, the ability to withstand losses or to adhere to a particular trading program in spite of trading losses are material points which can also adversely affect actual trading results. There are numerous other factors related to the markets in general or to the implementation of any specific trading program which cannot be fully accounted for in the preparation of hypothetical performance results and all which can adversely affect trading results.

Testimonial Disclosure: Testimonials appearing on this website may not be representative of other clients or customers and is not a guarantee of future performance or success.