
Bullish Options Traders, Buying Climaxes, Silver Flow, Hedgers' Bets, Breadth

I won't be publishing a Daily Report this afternoon, so this post is being sent as a Bulletin to all users. This is similar to what is included in the premium notes published most days.
Bully Bully
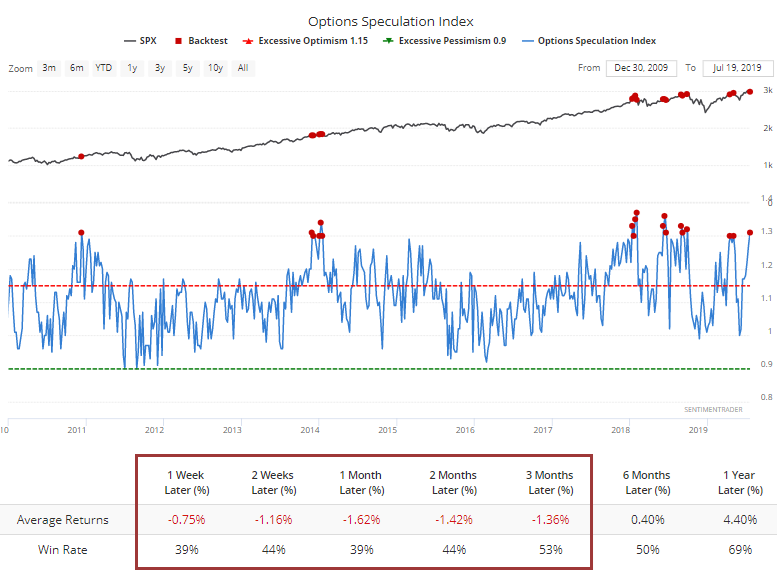
Even after a choppy week, the smallest of options traders have sustained their belief in a continued rally in stocks. So have others, enough to push the Options Speculation Index above 1.30. This means there was 30% more volume in bullish options strategies than bearish strategies last week.
After the orgy of excess in 2000, it took traders until late 2010 before they dared be this optimistic with such leveraged instruments. Since then, it has triggered several times.
Out of 18 weeks when speculation was this high, the S&P 500 suffered a negative return from 2-8 weeks later after 17 of them. That one in 2010 was the only exception, and that one’s gains evaporated during a correction in 2011.
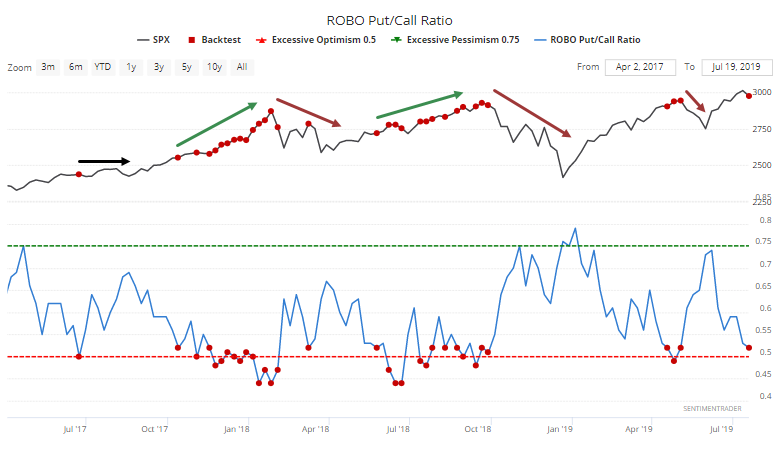
Much of this is being driven by the smallest of options traders, who continued to spend 40% of their volume buying speculative call options, which has been a consistent warning sign for the market. This has pushed the ROBO Put/Call Ratio (which stands for Retail-Only, Buy-to-Open) down to a low level.
In 2017, that didn't stop the momentous rally into year-end, though of course that was mostly reversed during the correction. Same for the summer of 2018. The last time it got this low, stocks started to peak almost immediately.
Exhausted
Last week’s push and pullback was enough to trigger a cluster of Buying Climaxes among S&P 500 stocks. A climax occurs when a stock pushes to a 52-week high during the week, then reverses enough to close the week below the prior week’s close. It suggests tired buyers.
Last week, there were more than 70 buying climaxes within the S&P, the most since January 2018.
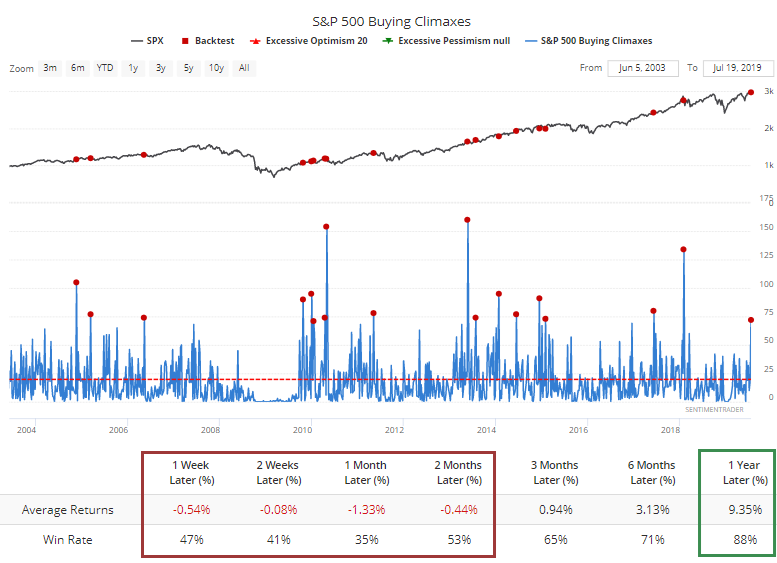 Other times the index suffered so many internal reversals, it tended to keep sliding, especially over the next month. Out of 17 weeks with more than 70 buying climaxes, the S&P was higher a month later only 6 times. The exceptions, when stocks continued to rise in the medium-term, all saw those gains evaporate longer-term.
Flow
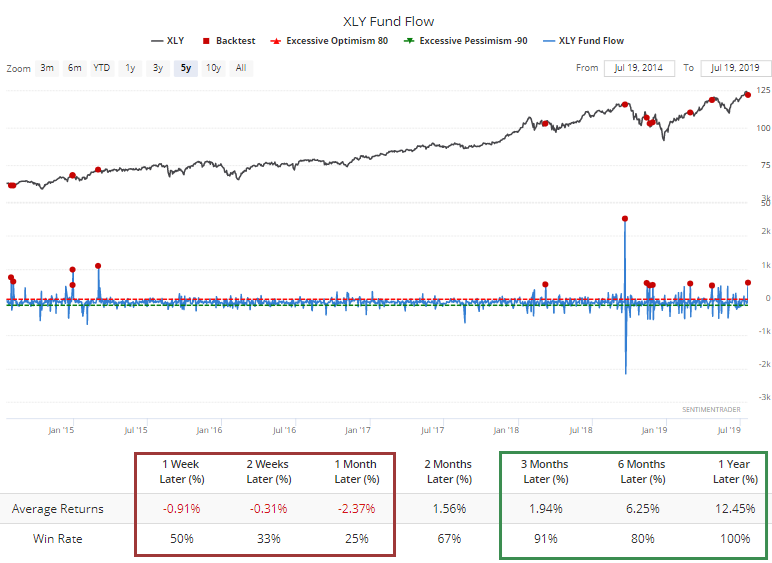
Among sectors, there weren’t many inflows/outflows worth nothing, except maybe for consumer discretionary. The XLY fund took in more than $500 on Friday alone. Fund flows are fickle things, and don’t always lead to performance like we’d expect.
For XLY, whenever it took in more than half a billion in assets in a day, It struggled over the next 2-4 weeks, for what it’s worth.
 The silver fund, SLV, has taken in an average of nearly $70 per day over the past few sessions, the most since early 2013.
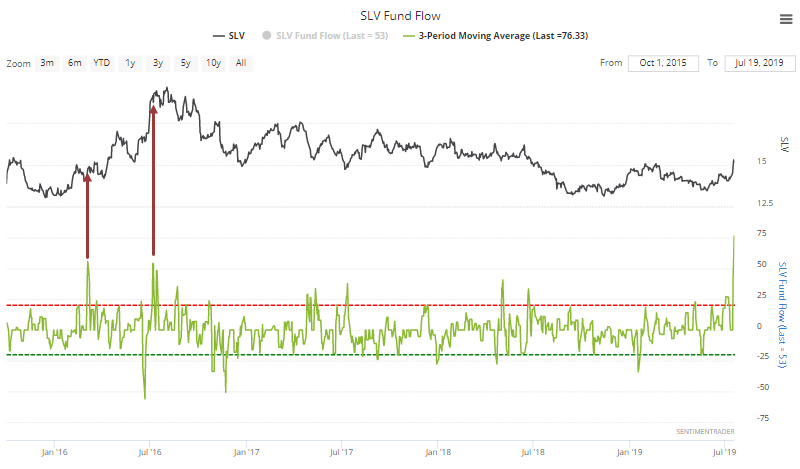
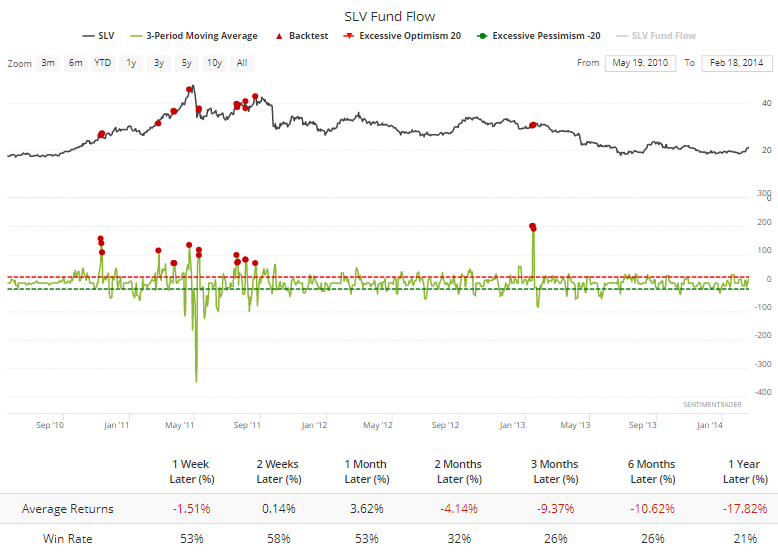
The only other times it took in this much over a multi-day period were in 2010-11. Its returns were mixed, but since it generally triggered around when silver was peaking, long-term returns were negative.
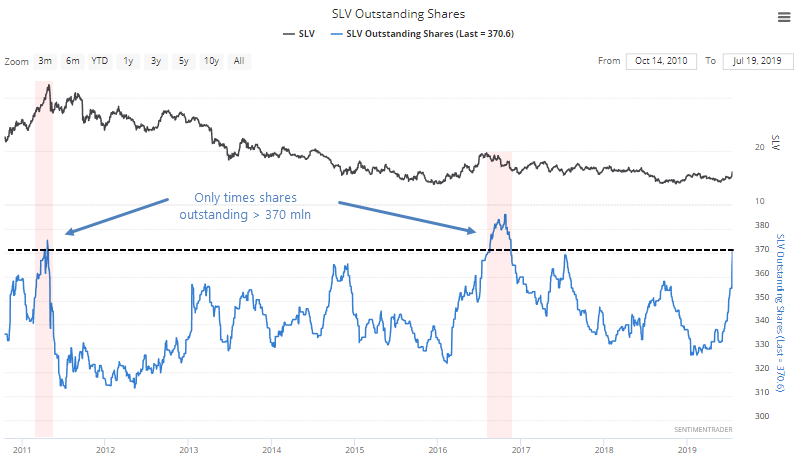
As a result of the inflow, SLV’s shares outstanding have jumped by 40 million shares over the past months. It has exceeded this amount only twice before, neither one attractive entries for new-found bulls.
Smart Money Divergence
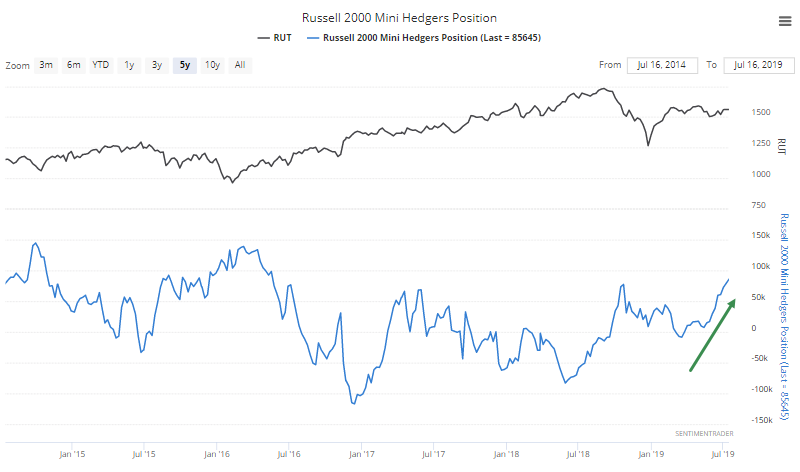
The latest Commitments of Traders report showed an unusual divergence among hedgers' positions in the major indexes. They were buying the small-cap Russell 2000 and selling the large-cap DJIA.
Usually, their positions in each contract move together, with more than a 50% correlation over the past decade leading up to this year.
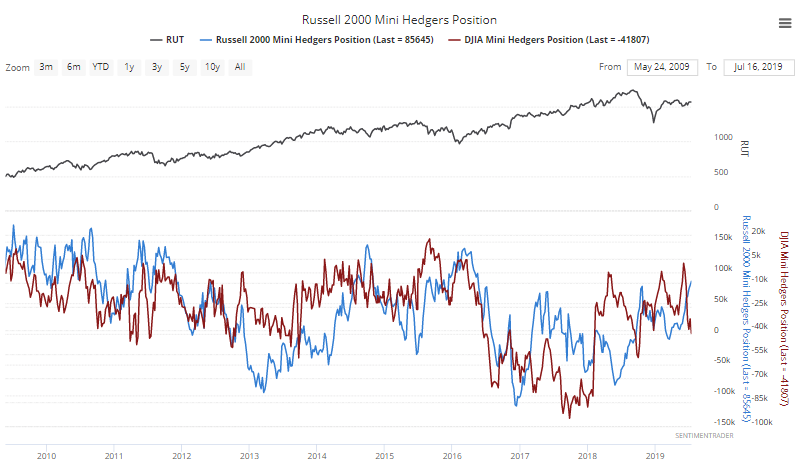
But now they're buying the Russell...
...and selling the Dow.
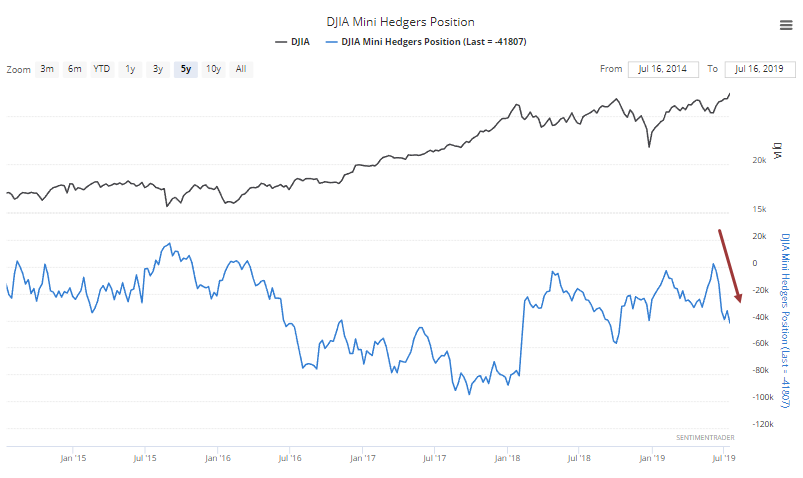
To see if this has happened before, and what it's meant, we can look at hedgers' weekly net position relative to their range over the past year. For the Russell, that's now 100%, as hedgers are the most net long they've been in the past year. For the Dow, it's only 25%, because hedgers' positions are in the bottom 25% of their range. So, the difference between them is 75%, in favor of the Russell.
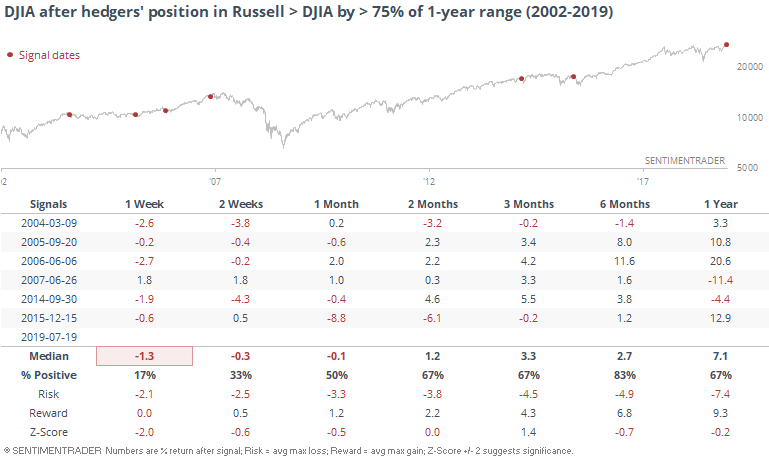
For the Dow, that has led to some weak short-term returns (to calculate returns, we're using the Friday close following each Tuesday's reporting date). Longer-term, though, the Dow did just fine.
Surprisingly, it was even less positive for the Russell than it was for the Dow.
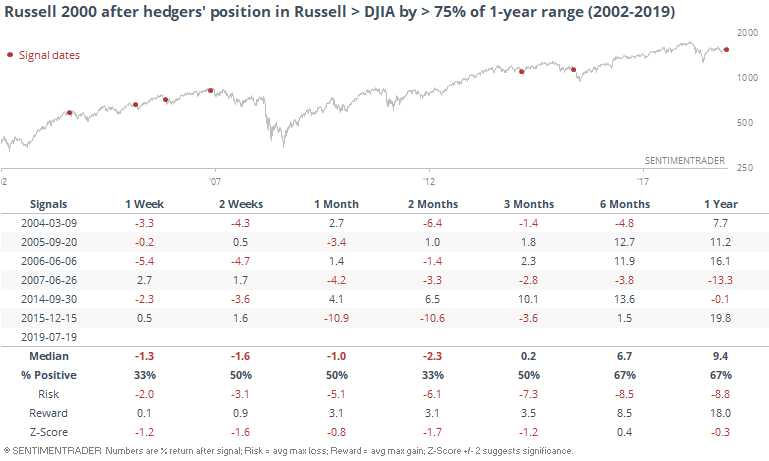
Looking at the ratio between the two, after these divergences, the Dow significantly outperformed the Russell over the next couple of months, which is opposite of what we'd expect. That's why we test, I guess.
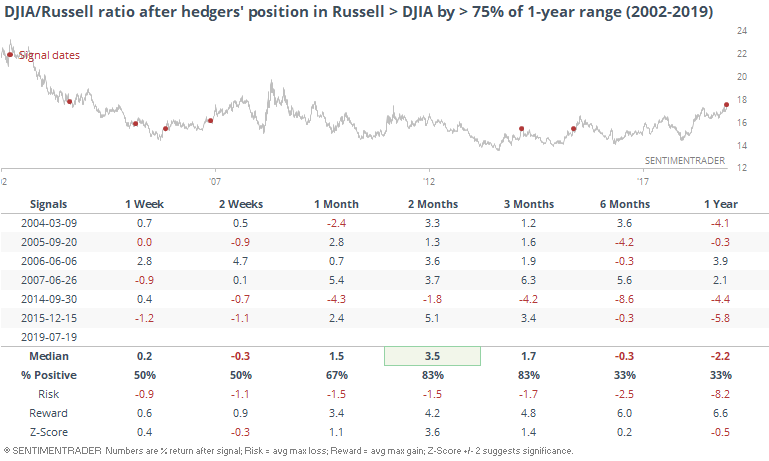
Long-term, there was some mean-reversion, with the Dow/Russell ratio falling over the next 6-12 months. That's a longer time frame than we'd typically look at with the weekly CoT data.
Speaking Of Smart Money
Last week, we saw that Dumb Money Confidence has poked above 80%, extreme enough to precede consistently weak returns for stocks. At the same time, Smart Money Confidence has dropped, and is also at/near an extreme.
Because of that, the spread between them dropped to an extremely low level and has started to curl, like it did as stocks were peaking in May.
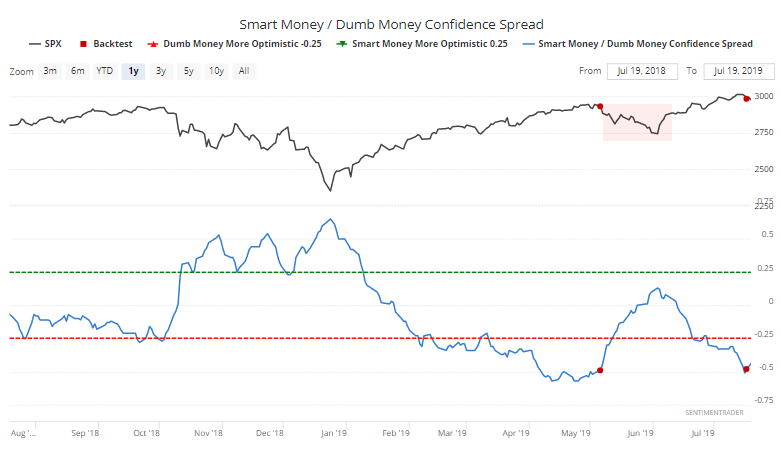
The thing I love most about the Backtest Engine is that it allows you to look at virtually every indicator on the site, not having to rely on my (or anyone else's) interpretation...or worse yet, cherry-picked opinion. When we do that for the Smart/Dumb Spread, we can look at other times it crossed back above -50% and see how stocks reacted.
NOTE: Hopefully in the next week, we'll be able to provide direct links to backtests, so you don't have to recreate all of the inputs. This will allow you to quickly test the exact same things I am, and save them to your favorite backtests if you wish, getting alerts when they trigger.
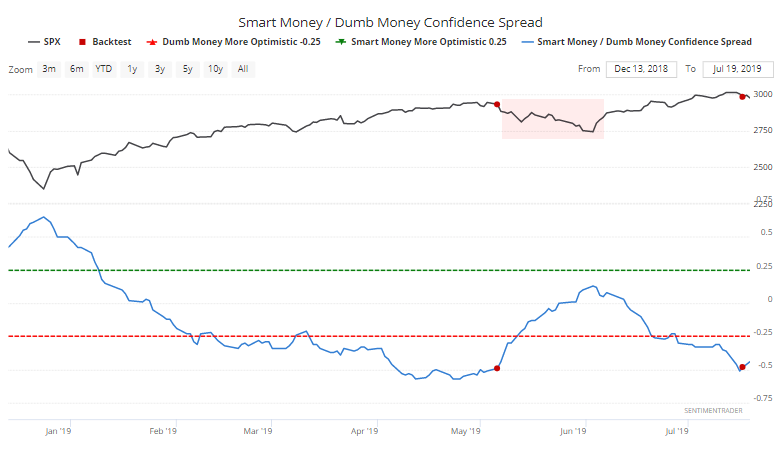
Here is what happened after the spread started to curl:
May 2019 - Several weeks of weakness.
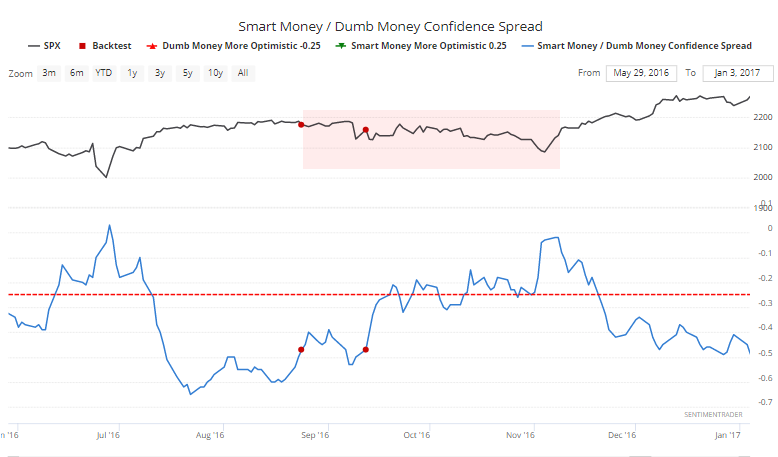
January 2017 - After the first signal in January, stocks didn't really go anywhere for weeks, then stepped higher. This was a failure of the signal as a warning sign, as there wasn't really any weakness to speak of during this super-momentum market.
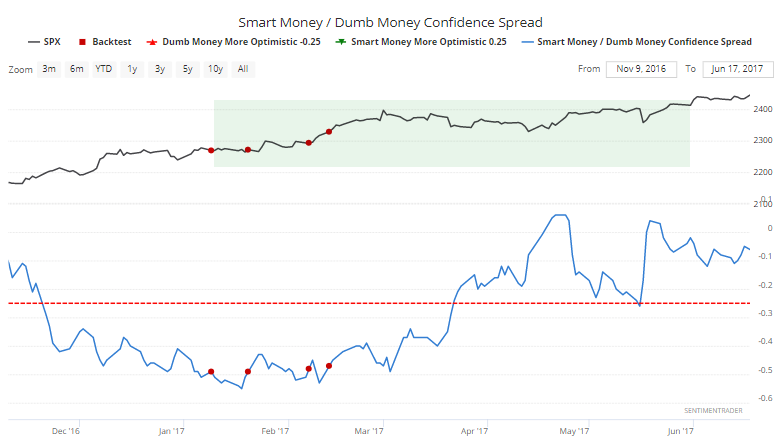
September 2016 - It successfully highlighted a damper in sentiment, with stocks struggling into the winter.
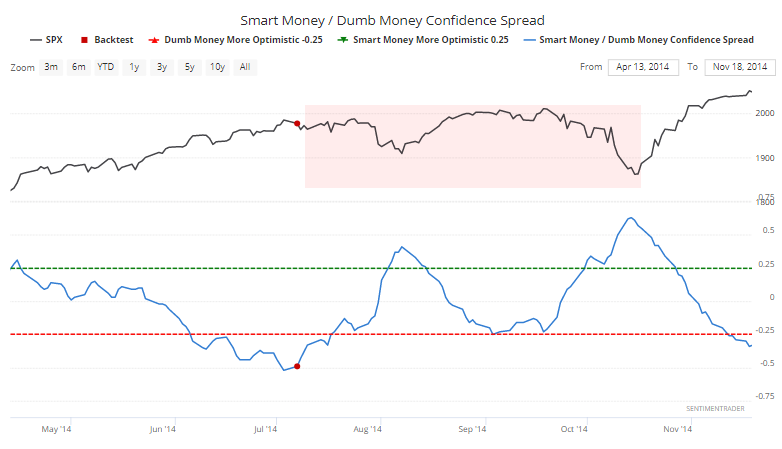
July 2014 - The spread showed that sentiment had reached an extreme and reversal, which lasted for almost the next six months, leading to mostly downside risk.
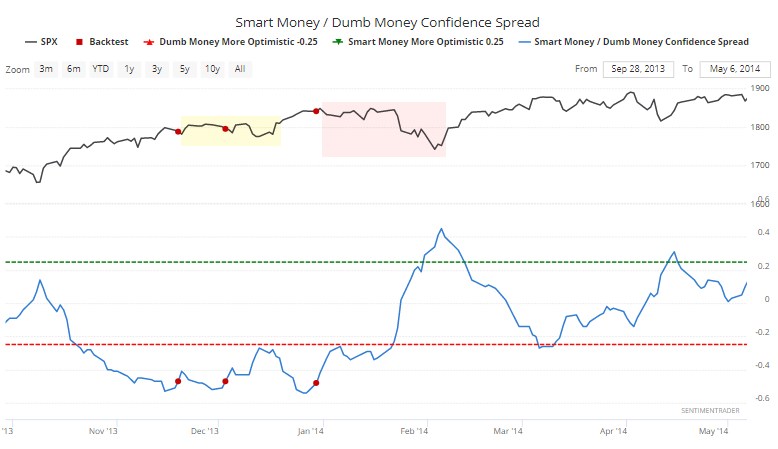
Late 2013 - early 2014 - It triggered several times during this super-momentum market. The first couple happened at the end of the year, preceded weeks of choppy conditions which ended up resolving into a quick little sprint to new highs. That morphed into another signal, which led to more meaningful downside, erasing those earlier gains. For a while, anyway.
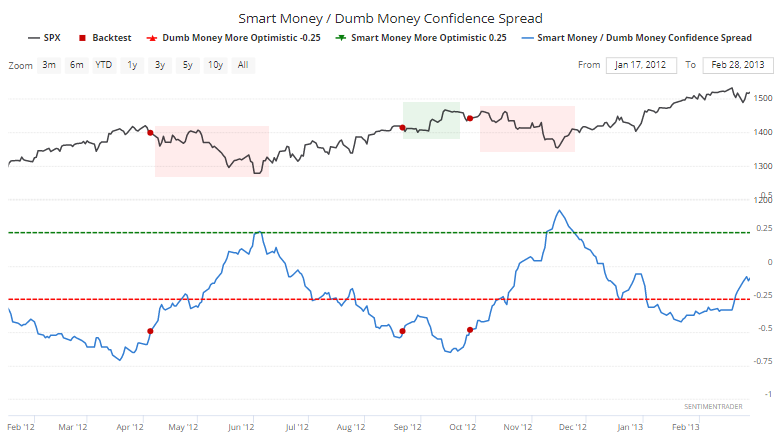
April, September 2012 - Another year when it triggered a few times. The first one was a good heads-up that "risk-off" behavior was at hand, and stocks immediately declined. It triggered again in September, leading to short-term choppy trading before another push to new highs, which triggered another signal, leading to more weakness and a temporary erasure of those earlier gains.
November 2010, February 2011 - The first signal again led to weeks of choppy trading before an impressive move to new 52-week highs during the first real prolonged thrust following the financial crisis. It triggered again in early 2011, which didn't have any immediate impact, but over the next 6 months, the upside was relatively limited versus the downside risk ahead.
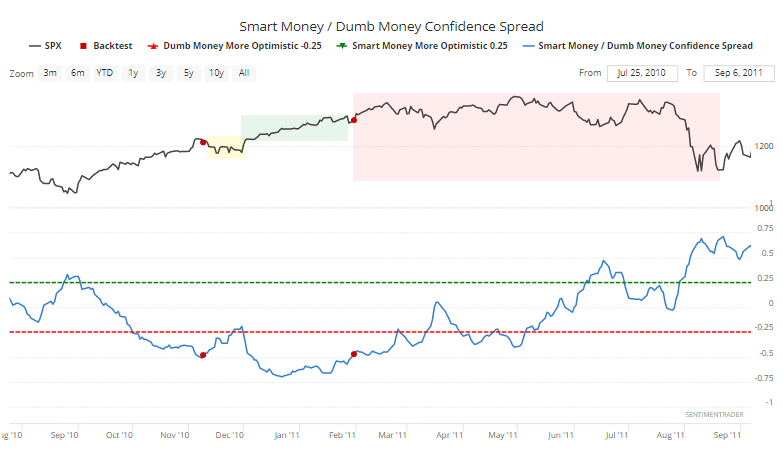
Overall, this curling up in the spread from an extreme low is a modest warning sign. Maybe not for the immediate future, but it at least signals that the risk/reward isn't that great. Almost every time it's triggered since the financial crisis, stocks have either been choppy, declined, or had their short-term gains reversed during a subsequent pullback.
Sector Breadth
Last week, we started to see some deterioration under the market, triggering a breadth warning sign that has preceded consistently weak returns. We can see that in the sector breadth conditions, with almost all of them currently with negative McClellan Oscillators and declining Summation Indexes.
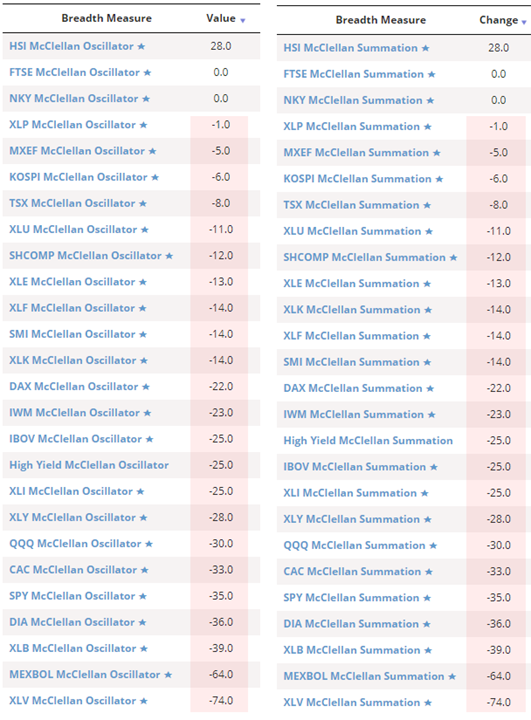
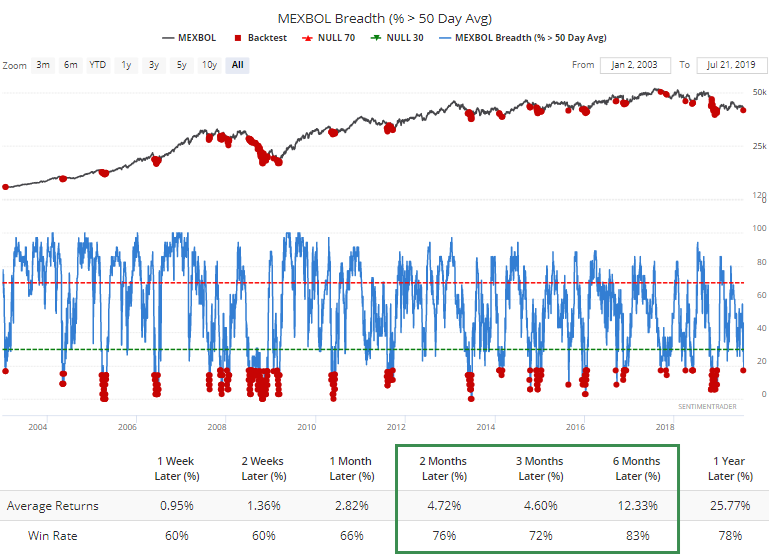
Even though most are negative, not many are truly extreme. About the only sector or index approaching those levels are Mexican stocks. Most of the readings are very low with historically positive forward returns, but not quite to a point that would strongly suggest it’s an immediate and low-risk opportunity.
Fewer than 18% of Mexbol stocks are now above their 50-day averages, for example.
 And 20% of them are oversold. Enough to be extreme, but not enough to suggest the market is washed out.
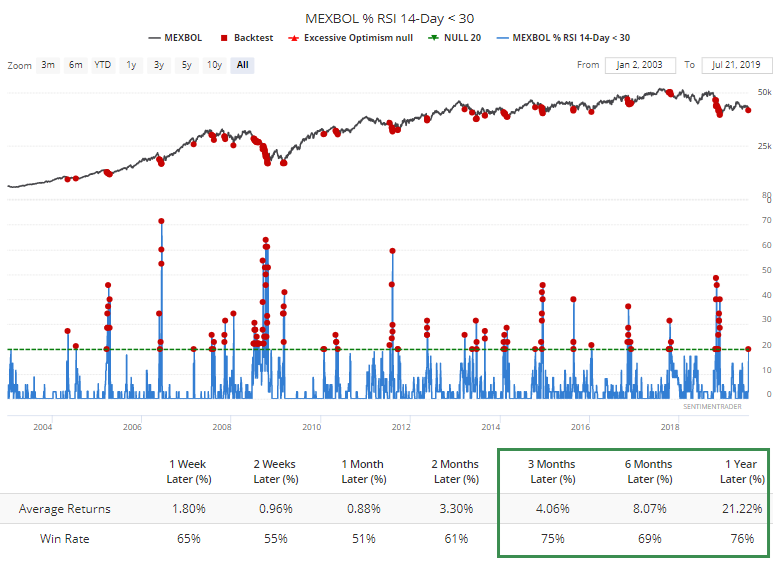 As noted in Thursday’s premium note, you could set up a study in the Backtest Engine that triggers when this rises above, say, 40%, and then be alerted to that in the nightly email digest if and when it finally triggers.