
Bullish percent index shows growing sell signals

A little over a month ago, we saw that a somewhat obscure technical measure of the market's health had generated an overwhelming number of buy signals. According to a weekend post by Arthur Hill, that has since pulled back significantly and suggests some trouble under the surface. Monday's surge will reverse some of that, but it doesn't change the fact that it had eroded significantly already.
When we've seen a huge number of buy signals from the Bullish Percent Index (BPI) before, it equated with major lows. The biggest caveats were that the sample size was tiny, and wasn't very robust - relaxing the parameters a little gave us more signals, but they weren't very impressive.
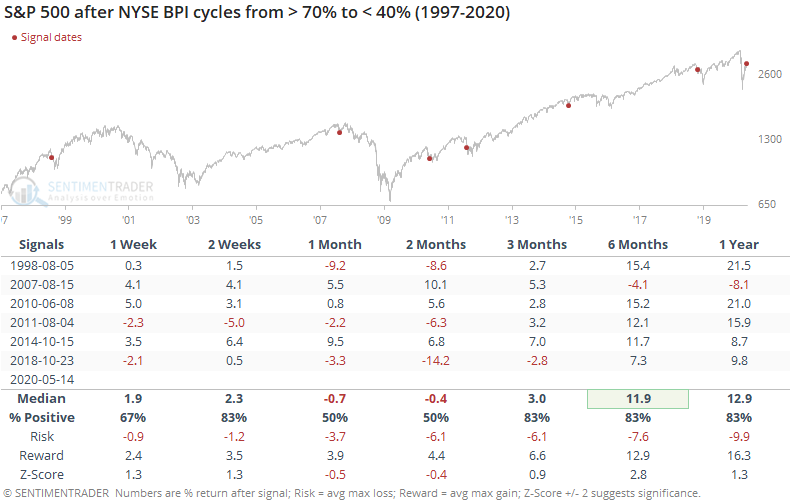
If we branch out from the S&P 500 and look at the percentage of securities on the whole NYSE that are currently on buy signals, then it has similarly collapsed, going from above 70% a few weeks ago to less than 40% as of Friday.
When we've seen this kind of cycle before, it preceded mixed returns over the medium-term.
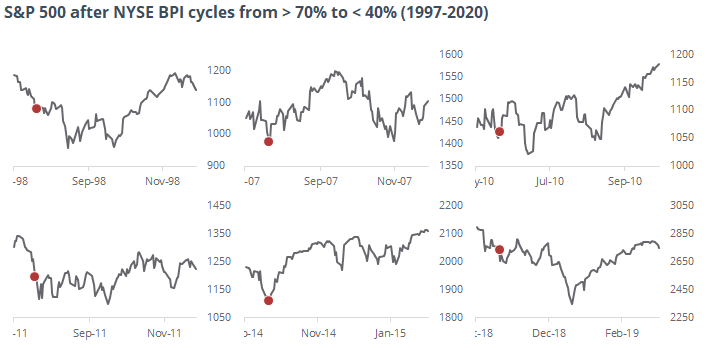
There were two times when stocks bottomed almost immediately and showed excellent gains over the next couple of months, in August 2007 and October 2014. The former soon petered, though, and rolled over into the financial crisis. The latter took a lot longer, but also gave back its gains.
Below, we can see that generally, the S&P 500's price action was choppy at best.
We don't follow the BPI on the site, but Mr. Hill's post generated quite a few questions, and it was worth following up on the post from April. There isn't enough there to consider it a negative in the Active Studies, but it is a minor suggestion that the positive thrust from March and April has run into some issues and isn't quite as positive as it suggested a six weeks ago, even with some positive price action in recent days.