
Buying interest triggers a rare breadth thrust

Key points:
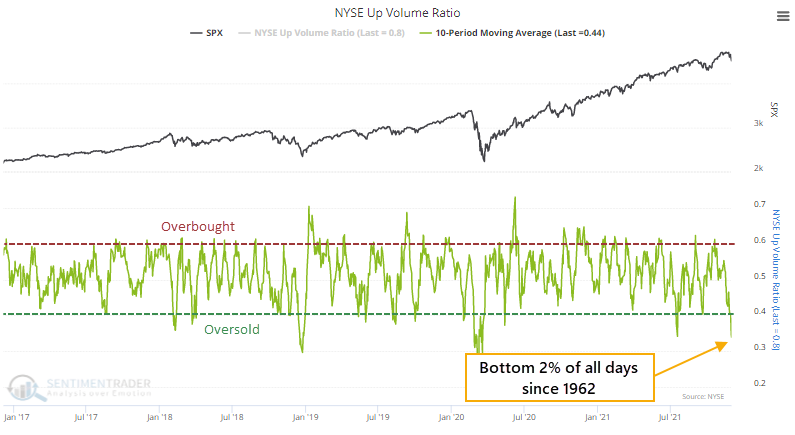
- A key indicator fell to a deeply oversold level last week, amid signs of pessimism
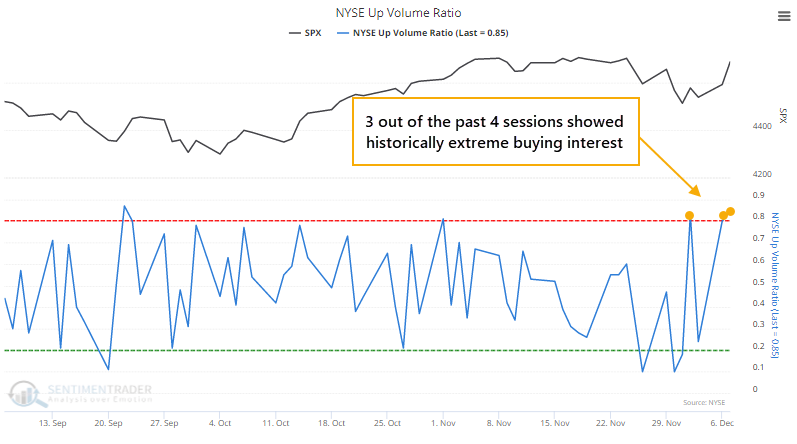
- It has since rebounded strongly on 3 out of the past 4 sessions
- These reversals have preceded strongly rising markets every time
Deeply oversold...then really, really not
At the end of November, selling pressure was concentrated enough to push the 10-day average of NYSE Up Volume below 40%. By December 1, that 10-day average dropped to 34%, oversold enough to be in the bottom 2% of all days since 1962.
Since then, it's been a buying frenzy. Out of the last 4 sessions, 3 saw more than 80% of volume focused on advancing securities.
The reversal from oversold conditions to persistent and heavily skewed buying interest has triggered a breadth thrust with an excellent track record.
We spent a lot of time last March/April/May looking at breadth thrusts from various vantage points. The market didn't necessarily record "official" thrust signals as outlined by Marty Zweig or others. As noted at the time, that didn't mean investors' sudden interest in buying was invalidated.
And here we are again.
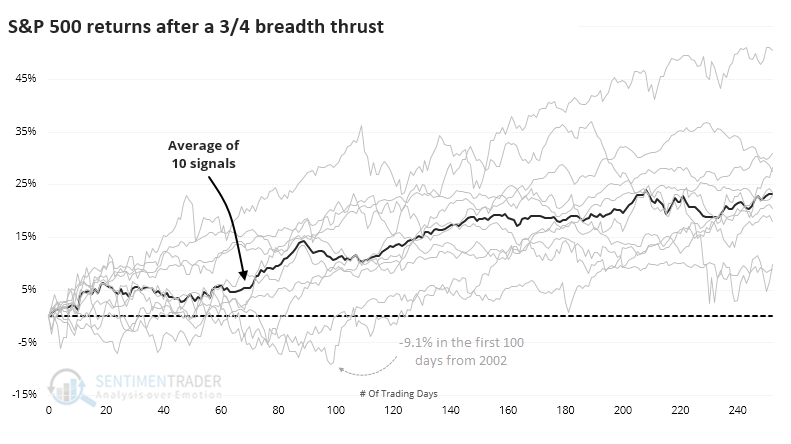
3/4 breadth thrusts following an oversold signal led to excellent returns
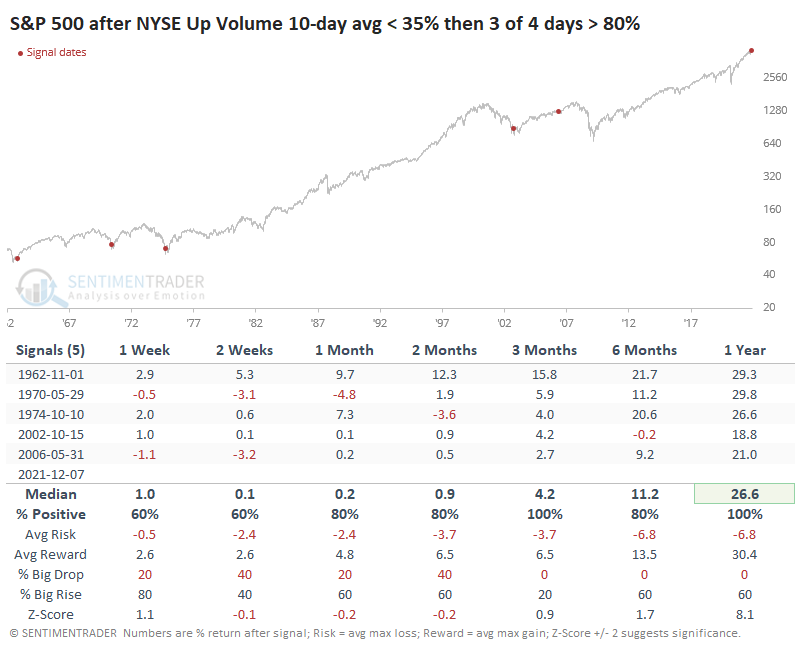
After the 10-day average of Up Volume fell below 35%, we've now had 3 out of 4 days with impressively skewed volume. Since 1962, this has only happened five other times, all leading to gains of at least 18.8% over the next year. The risk/reward was tilted heavily to the "reward" side.
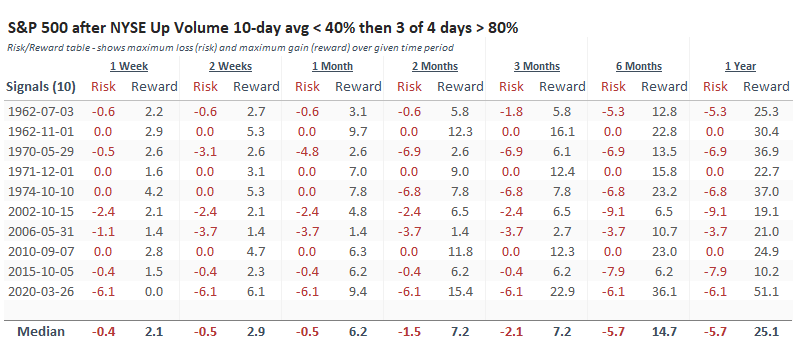
Even though price action after those signals was consistent, it's hard to have much confidence in such a small sample size. If we relax the oversold condition to a 10-day average below 40% (instead of 35%), we double the sample size.
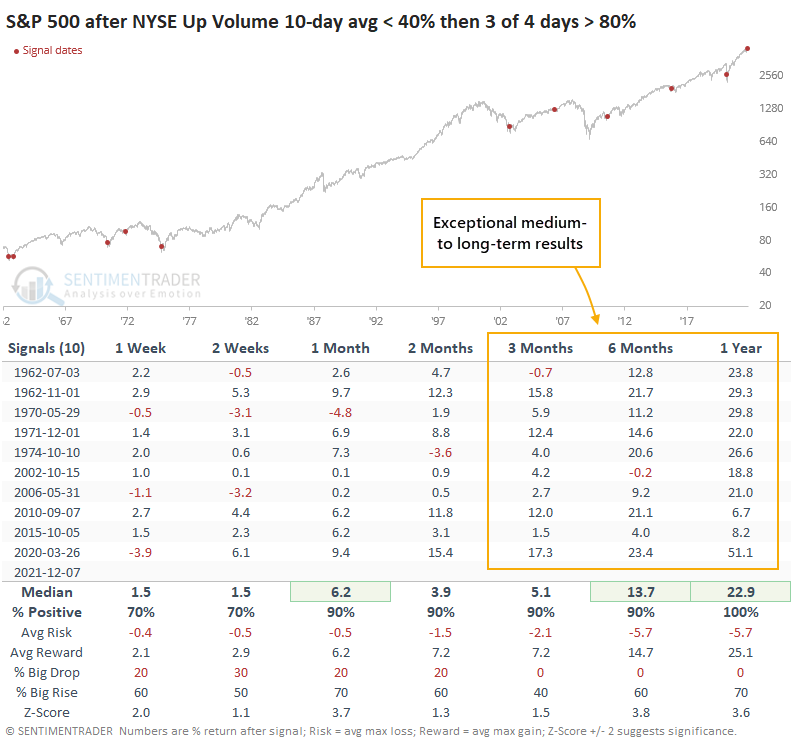
Granted, the sample is still painfully small, but the consistency in future returns is compelling. The chart below shows the price path of the S&P 500 in the year following each of the signals. After 125 days, almost exactly 6 months, there were no negative returns. A few of them saw modest drawdowns, mostly 5% or less, within the first 100 days, with the worst one being from October 2002.
Even though the 6-12 month returns were excellent, it's hard to hold if there is a lot of pain to get there. But the Risk/Reward Table shows the S&P's remarkable long-term performance. At its best point over the next year, the index gained at least 10% every time, with an average of more than 25%. But at no time with the following year, across any of the signals, did the S&P decline more than -10%.
What the research tells us...
The market environment for the S&P 500 remained healthy despite its recent wobbles, even though the environment for the broader market was sketchy (and still is). There have been some signs of pessimism, with a wide spread between Smart and Dumb Money Confidence. Often, it takes more of a shakeout for investors to come back, but we seem to be in a different world.
Out of all the signals, indicators, and strategies we've looked at over the past 20 years, among the most consistently successful has been breadth thrusts in both directions. The fact that we're seeing the nascent signs of one now, following a modest extreme in sentiment, suggests higher prices in the months ahead, as hard as that idea is to swallow in an overvalued market.