
Buying the Dips in SPY doesn't have to be rocket science

Key Points
- In a perfect world, buying dips in an ongoing uptrend should be a winning strategy
- Finding the "exactly right" moment to buy is an admirable goal, but real-world trading tends to be a lot messier than most of us would hope
- Ultimately, position sizing and risk management are just as (maybe more?) important than market timing
SPY Breadth Signal
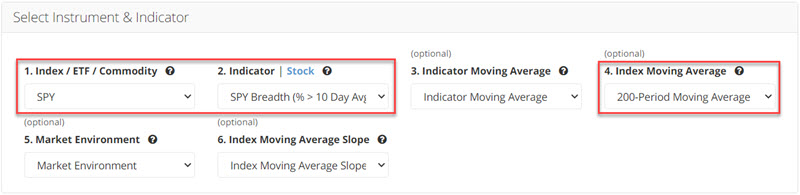
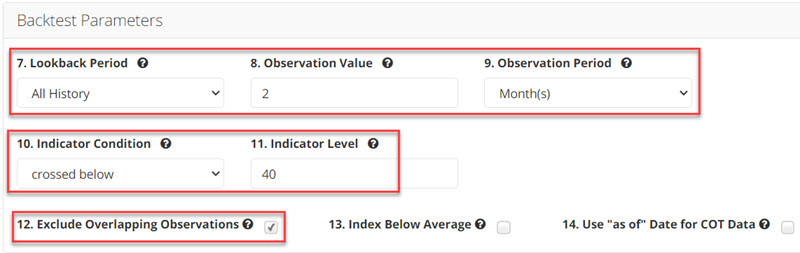
Let's consider the potential for using a simple breadth-based indicator to play the long side using shares of ETF ticker SPY (SPDR S&P 500 ETF Trust ). The rules we will use are:
- SPY > 200-day moving average
- SPY Breadth (% > 10 Day Avg) crosses below 40%
- For the first time in 2 months
The first condition filters for an objective "uptrend." The second condition objectively identifies a pullback in the overall index. The input screens appear below. You can run this test by clicking here.
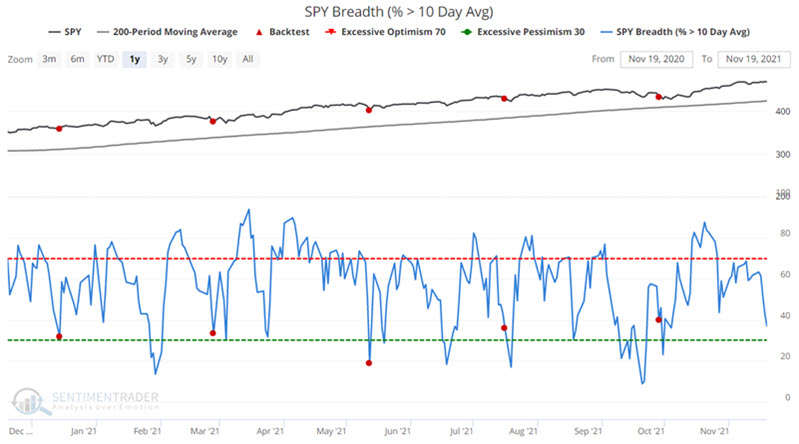
The Signals
The signals generated by the rules above appear in the chart below.
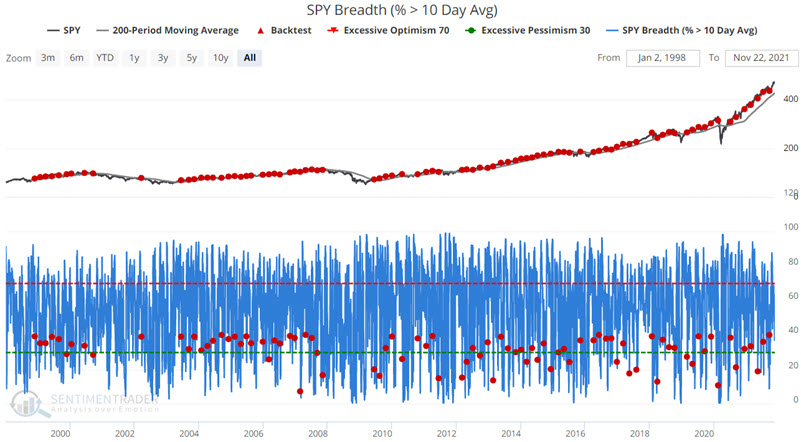
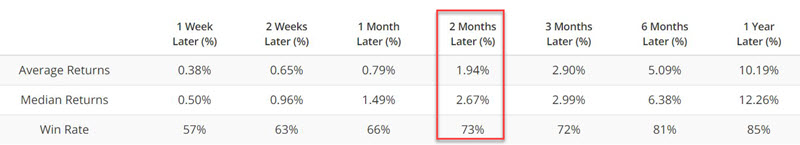
There is no shortage of trading signals. The summary of results appears below. For our purpose, we will focus on the 2-month time frame.
The chart zooms in on the chart above and below displays the signals generated in the past year.
Applying to Real-World Trading
Since 11/30/1998, there have been 87 signals, including the most recent open signal triggered on 9/28/2021. No new signal can be generated before 11/28/2021.
Let's run the following hypothetical test:
- Allocate a specific starting amount to this strategy
- Invest all capital allocated in SPY shares on the closing date of each new signal
- Sell SPY shares two months after the initial signal date
- Repeat the steps above - reinvesting all capital - on each new signal date
The cumulative hypothetical growth of $1 invested as detailed above since 1998 appears in the chart below.
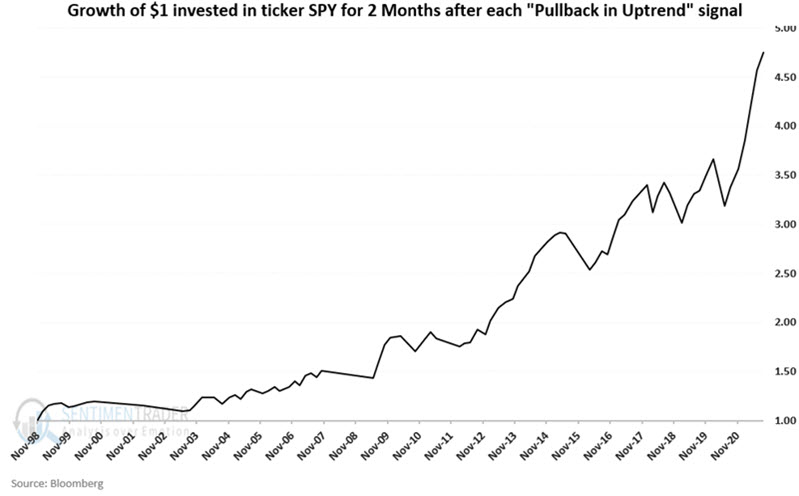
The results displayed in the chart above are by now means a "straight-line." Still, the lower left to upper right nature of the equity curve is unmistakable.
A summary of trading results appears in the table below.
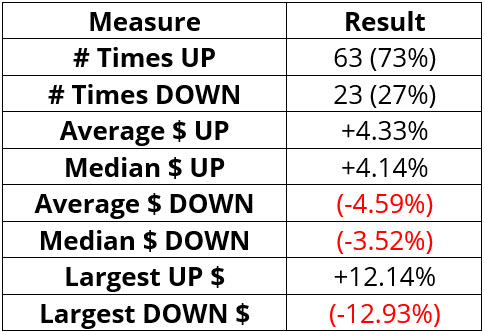
The strategy detailed here is not the "be all, end all" of trading systems and can undoubtedly be improved. But note also what it does demonstrate - that a simple "buy the dips in an uptrend" approach to trading can be consistently profitable over time.
The keys to succeeding using a strategy similar to the one above are:
- Allocating only a reasonable amount of risk capital
- Having the discipline to act when each new signal occurs (i.e., filtering out all of the "noise" that can create doubt)
What the research shows…
- Trading in the direction of the primary trend is one of the easiest ways for any trader to gain an "edge" and put the odds on their side
- Buying a pullback in an ongoing uptrend is another way to increase the odds of success and improve profit potential on a trade-by-trade basis
- Allocating a reasonable percentage of one's capital - and never "betting the ranch" is the best way to ensure that you stick with a viable strategy long enough to enjoy the "edge" that the approach enjoys