
Chinese Tech Stocks Are Washed Out

Few markets have suffered more of a barrage of uncertainty and negativity this summer than Chinese stocks. Technology-related issues have been hit particularly hard from all sides.
Based on the last 15 years of history, they've reached a point of maximum pessimism.
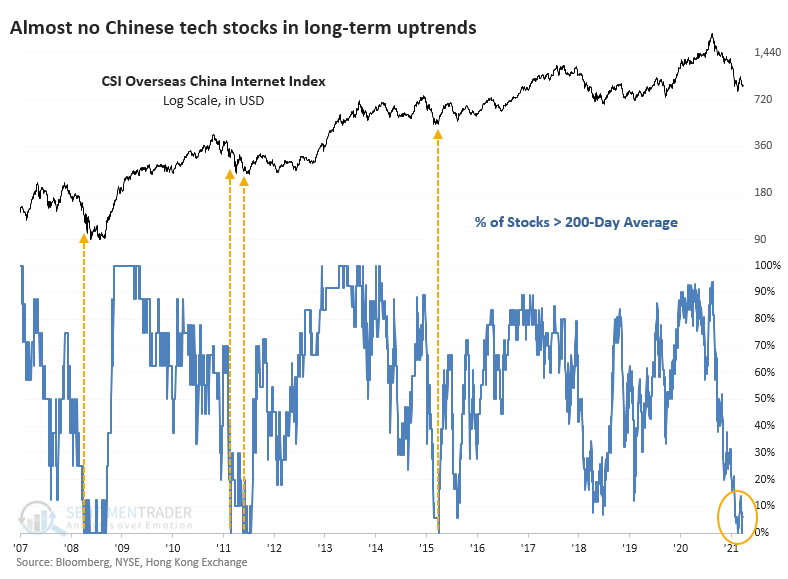
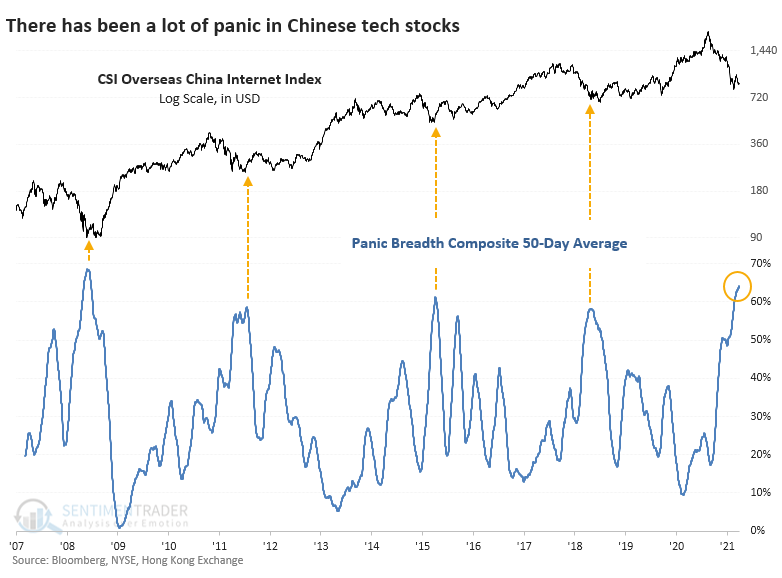
The most popular domestic fund for trading Chinese internet stocks is KWEB, based on the CSI Overseas China Internet Index. The index has just over 50 member stocks, and it's hard to find an uptrend among them.
FEW UPTRENDS, MANY NEW LOWS
During mid-August, precisely 0% of these stocks were trading above their 50-day moving averages. That spiked to around 40% during a relief bounce and has since slid back under 10% as recently as last week.

It's an even uglier picture when looking at the percentage of these stocks in long-term uptrends. In recent days, only 4% of them have closed above their 200-day moving averages, ranking among the very worst readings in available history.
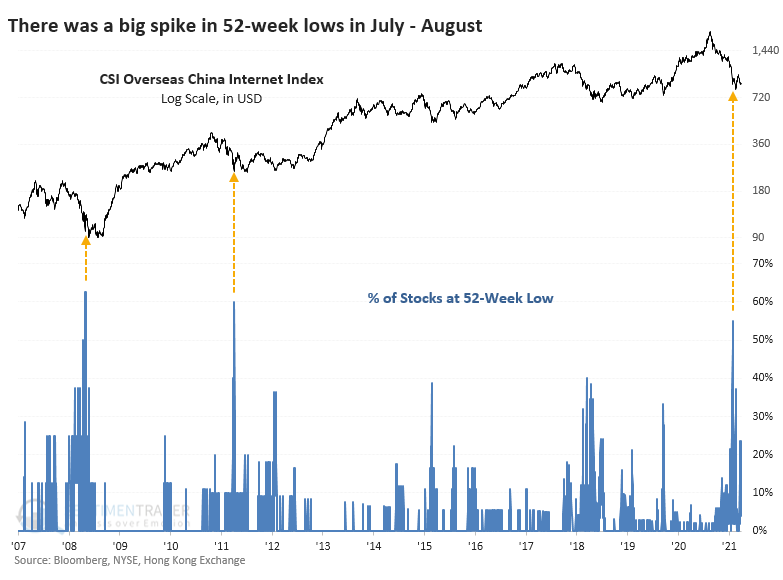
The plunge in late July caused more than 50% of Chinese 'net stocks to fall to a 52-week low, only the third time in 15 years that so many have done so at the same time. Many are gyrating around those low prices, and on any given day, between 10% - 25% of stocks have been setting fresh 52-week lows.
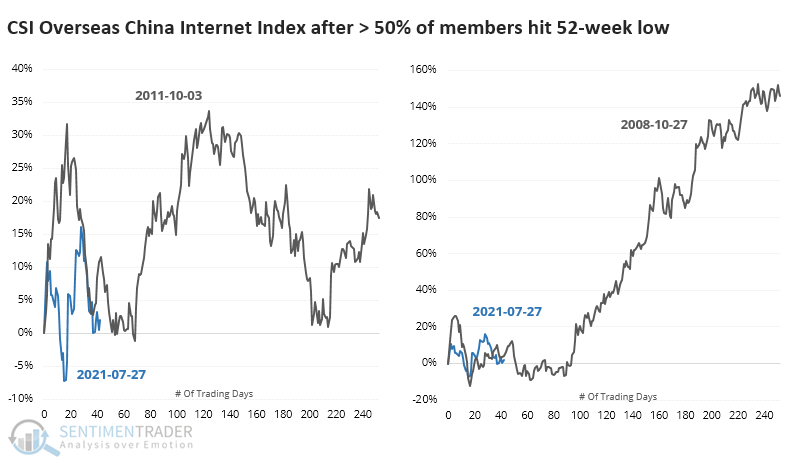
The other two times when more than 50% of them fell to a new low, the China Internet Index rebounded quickly, then fell back in the months ahead to test the low during a bottoming process. That's very similar to what it's been doing in recent weeks. If it continues to follow that pattern, then it should bottom within the next 20-40 sessions without undercutting its August low by much.
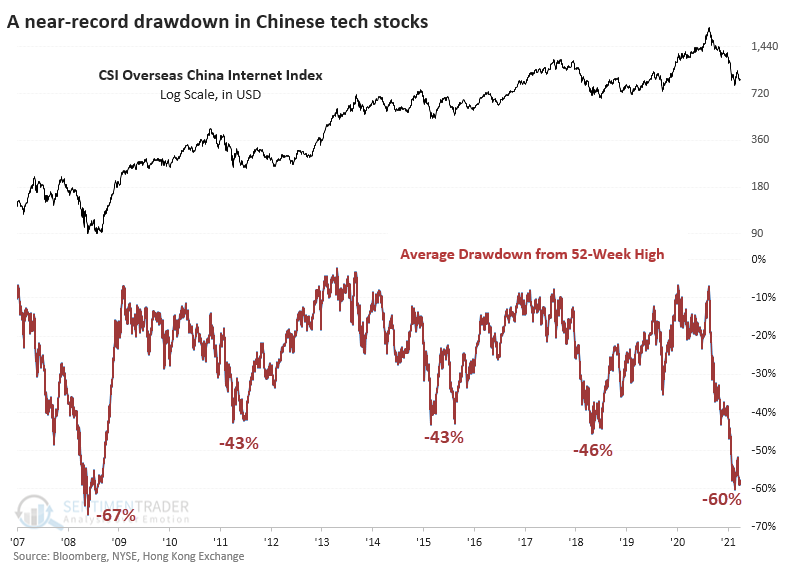
Not only have these tech stocks been falling to new lows, but they've also suffered huge drawdowns. Across the 53 companies in the index, the average stock is down nearly 60% from its 52-week high. The only period that exceeded this washout was the puke phase of the global financial crisis. During other waves of panic since then, the average drawdown stopped at about 45%.
If we use a similar methodology to what we've used with several other sectors in the last couple of weeks and compute a kind of panic breadth composite from these measures, the past 50 days are on par with the financial crisis. No other period saw so many stocks suffering such significant losses for so protracted a period.
CORPORATE BUYING, RETAIL SELLING
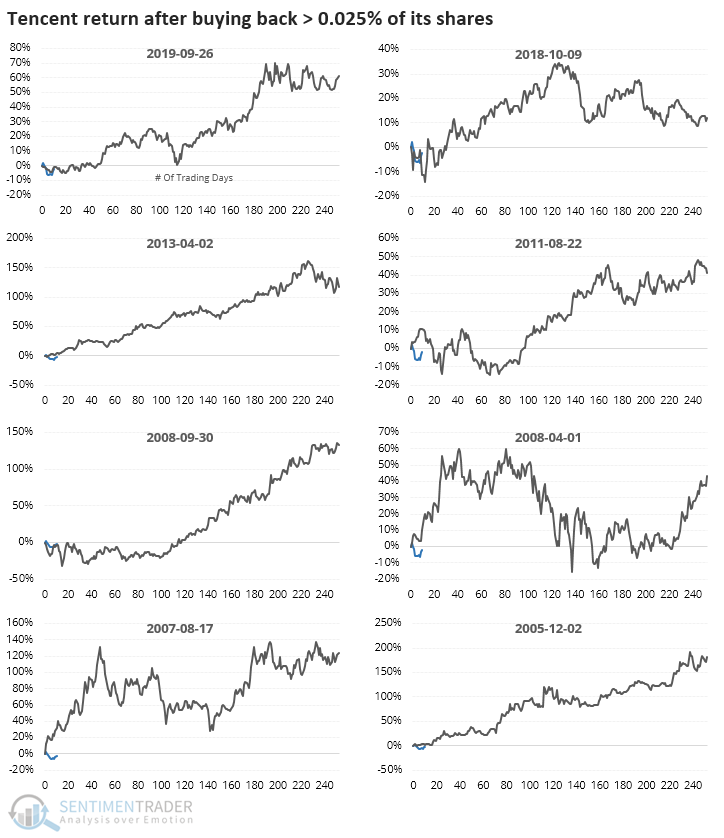
At least one of these firms - the most important one, carrying the most weight - is sensing a bargain in their shares. Tencent Holdings has authorized and executed stock buybacks almost every day since August 19. While it's not a significant percentage of its outstanding shares, it's still the largest in nearly a decade and ranks 4th since 2004. They're on pace to exceed their buyback binges from 2011 and 2013.
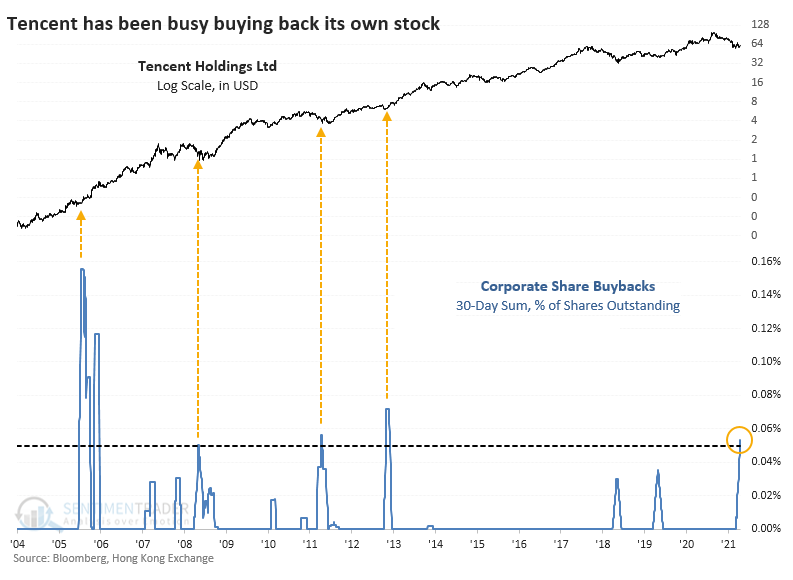
The company has had an exceptional record of buying its own stock at opportune moments. When Tencent repurchased 0.025% of its shares within a 30-day window, the stock rallied a median of 84% over the next year, with no losses either 6 or 12 months later.
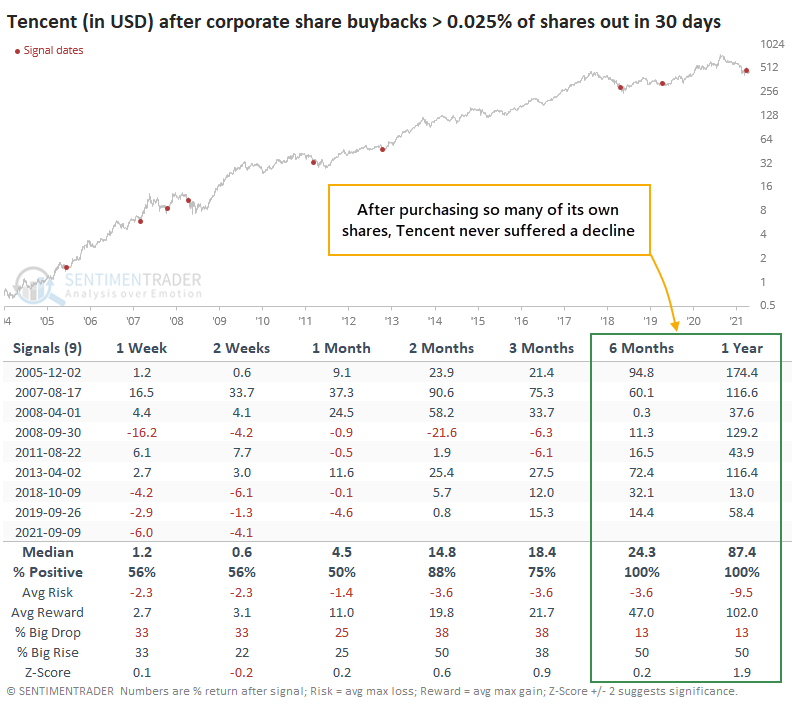
Tencent stock, priced in dollars, has already declined more than 6% since their buybacks crossed the study threshold, exceeding most other drawdowns. In 2008, 2011, and 2018, there were large losses all occurring within the first two months. After that, the stock enjoyed spectacular gains.
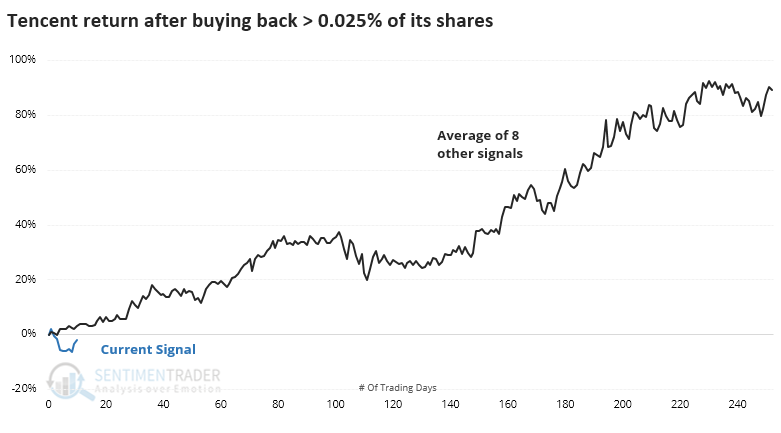
The individual thumbnails show that there were several times when the stock chopped around in a volatile manner for weeks or months, however, so it wasn't an immediate buy signal every time.
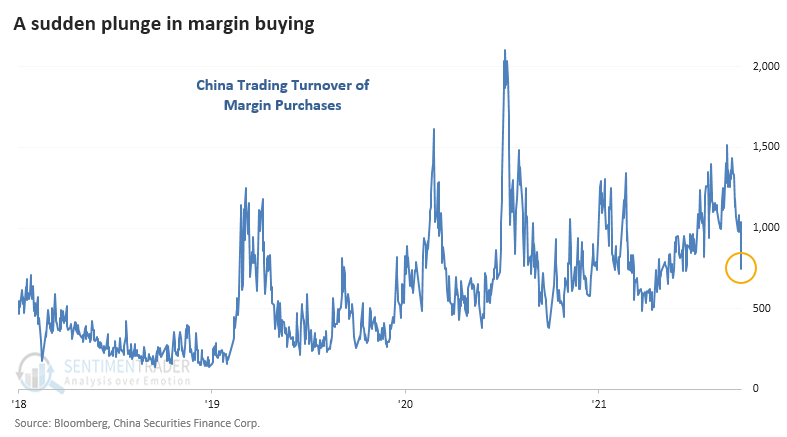
Who's not buying? The retail traders who rely on margin. The volume of shares bought on margin has plunged in recent sessions, down more than 50% from the peak. It hasn't reached the depths of apathy seen at other lows in speculative behavior, but it's getting close quickly.
If we assume that speculative shares like tech stocks see much of this margin buying, we can see if drops in activity were a contrary sign. The table below shows returns in the China tech index after margin buying activity cycles from a 12-month high to a 3-month low.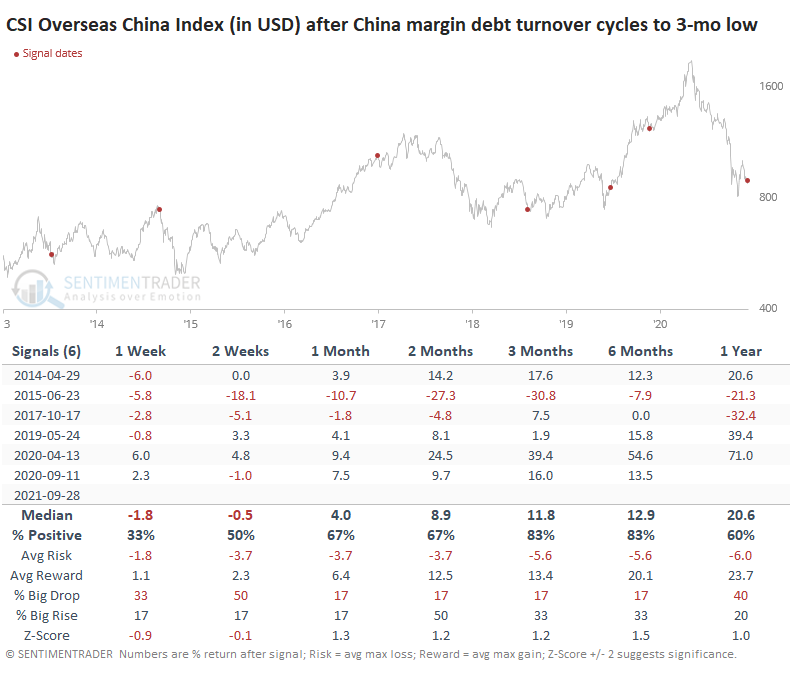
It was mostly a good sign, though it triggered at the peak in 2015 and ultimately led to a loss in 2018. The others began near bottoms and preceded significant gains for these stocks as speculative behavior returned.
Media headlines and analyst comments have cycled from euphoric in January to apathetic in March to concerned in June to hysterical in the past month. Lately, we've been seeing comments that China will dissolve capital markets altogether, reminiscent of the fear that authorities would close U.S. stock markets in March 2020.
There is a clear danger, both known and unknown, in these stocks. Nobody knows what government regulators will say or do (granted, that's becoming an increasing risk in every country), what impact that will have on trader sentiment, and whether the worst of the news has already been priced in. Companies like Tencent seem to believe so, or they wouldn't be buying back their shares.
Who knows where the selling pressure will stop if the regulatory environment has radically shifted from the past 15 years. Maybe these stocks can go down another 20%, 50%, or 90%. Anything is possible. We generally believe that probabilities favor long-term trends staying in place and investors more or less behaving as they have in the past until evidence strongly suggests the opposite. Based on that, it looks likely that Chinese tech stocks are well on their way to forming another long-term bottom.