Products
SentimenTrader Trading Tools
‍
Backtest Engine
My Trading Toolkit
Correlation Analysis
Seasonality
Indicators & Data API
‍
Proprietary Indicators & Charts
Market Data API
Strategies & Scanner
‍
50+ Trading Strategies
Smart Stock Scanner
Research Reports
‍
Research Solutions
Reports Library
Free Resources
Simple Backtest Calculator
Simple Seasonality Calculator
The Kelly Criterion Calculator
Sentiment Geo Map
Public Research Reports
Pricing
Company
About
In the News
Testimonials
Client Success Stories
Contact
Log inLoginSign up
< BACK TO ALL REPORTS

Commodity at the Crossroads - The Cotton Edition

Jay Kaeppel
2021-06-15
Several commodities appear to be at or near a critical juncture. In this piece, we look at the Cotton market and highlight several important price, seasonal, and sentiment trends.

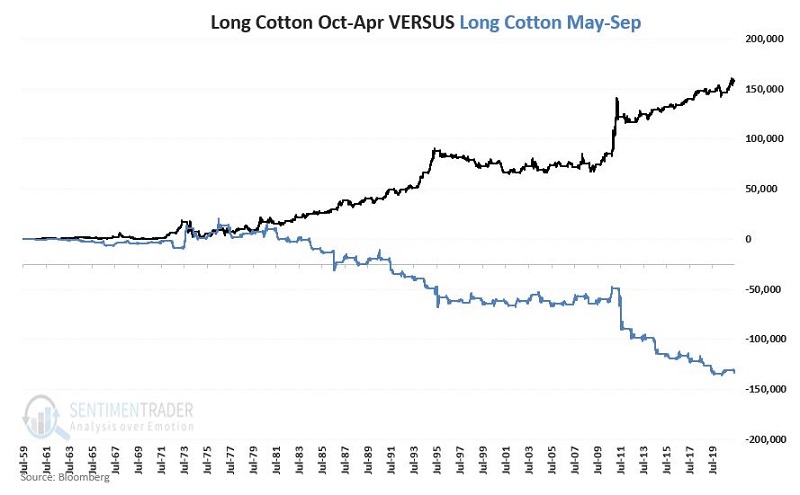
Few markets are as cyclical as the cotton market. To wit, in the chart below:

  • The black line displays the hypothetical $ + (-) achieved by holding long a cotton futures contract ONLY during October through April
  • The blue line displays the hypothetical $ + (-) achieved by holding long a cotton futures contract ONLY during May through September

WARNING SIGN #1: RESISTANCE

The chart below (courtesy of ProfitSource by HUBB) shows that the 92 to 97 range has long been a tough level for cotton to cross above. It did so briefly in 1994 and 1995 and again (in a huge, blowoff kind of way) in 2010 and 2011. 

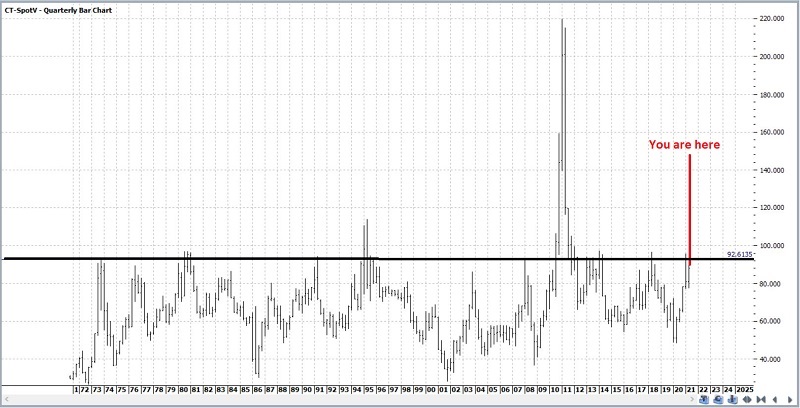
Is another 2010-2011 type explosion possible? Of course. Is it likely? History suggests not.

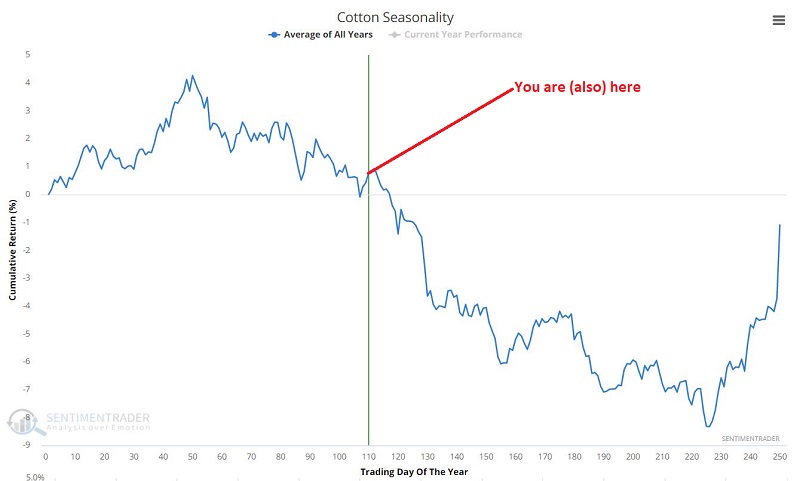
WARNING SIGN #2: SEASONALITY

As alluded to above, the May-Sep time of year is the period most likely to witness weakness in cotton. The seasonality chart below tells the tale pretty clearly.

WARNING SIGN #3: SENTIMENT

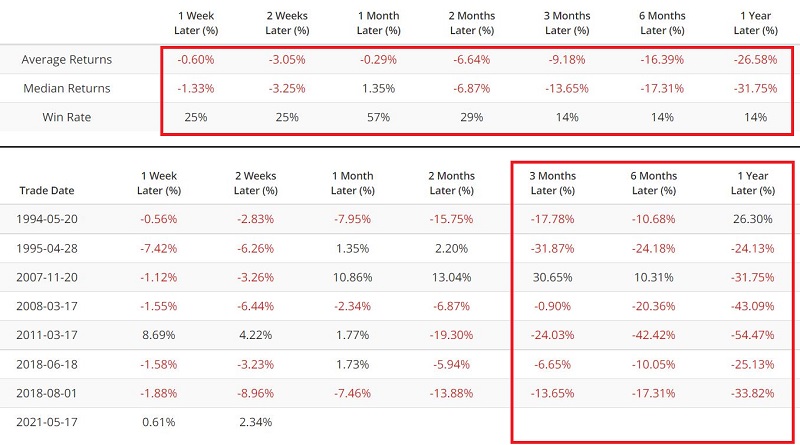
In mid-May, the 100-day moving average for cotton Optix dropped below 68.  Since 1994 there have been only 7 previous occasions when the 100-day moving average of the Optimism Index on cotton dropped from above to below 68. Those signals are displayed in the chart below.

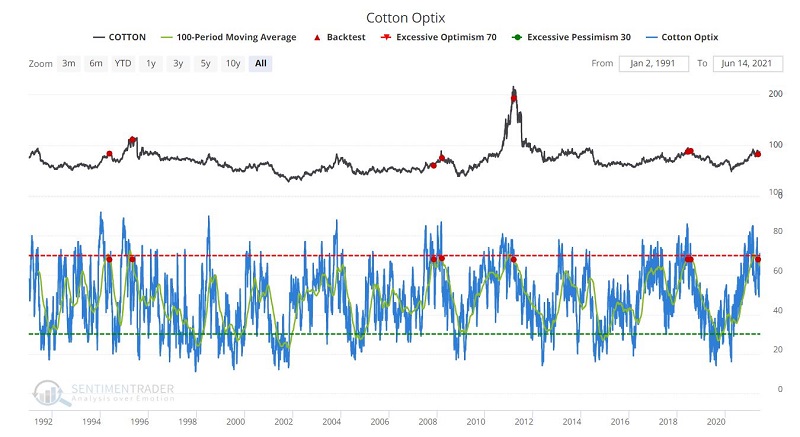
As you can see in the table below, the average and median returns across all time frames have been negative, and the Win Rate well below 50% for every period except 1-month.

TRADING

The most straightforward approach to trading cotton is via the futures market.  The December 2021 contract is currently the most active. 

There is ticker BAL (iPath Series B Bloomberg Cotton Subindex Total Return ETN) in the ETF market, which tracks the price movement of cotton futures contracts.  Volume on ticker BAL is presently very light, and selling short shares may be difficult.  There are options on BAL. However, they are presently extremely illiquid and have prohibitively wide bid/ask spreads.  

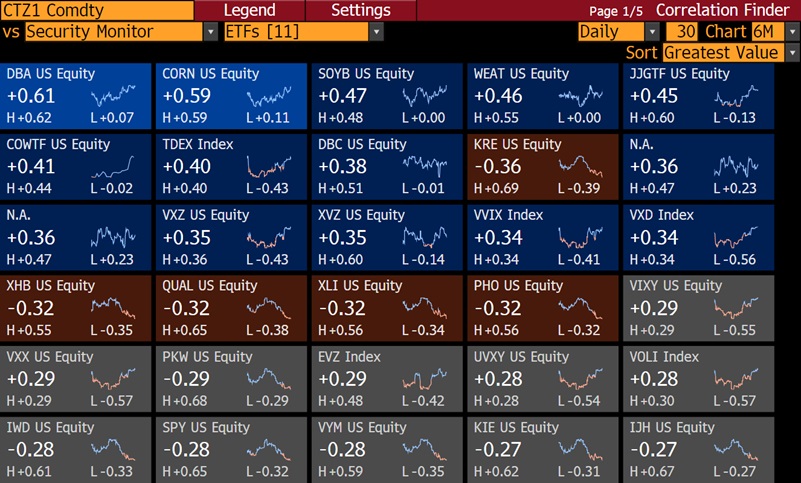
For non-futures traders, the best avenue might be buying a put option on ticker DBA (Invesco DB Agriculture Fund).  As you can see in the table below, DBA has the highest correlation to cotton futures among ETFs.  

As this is written, the Oct2021 DBA 19 strike price put is trading at $1.00 bid/$1.20 ask.  

As always, this should not be considered a recommendation. Instead, we are merely pointing out a potential low-dollar risk way to play a market that could be on the verge of trouble.

SUMMARY

On a trend-following basis, Cotton remains in an uptrend. As you can see in the chart below (courtesy of www.BarChart.com), cotton is still trading above its 50-day average.  However, it recently hit resistance and is threatening to reverse to the downside.

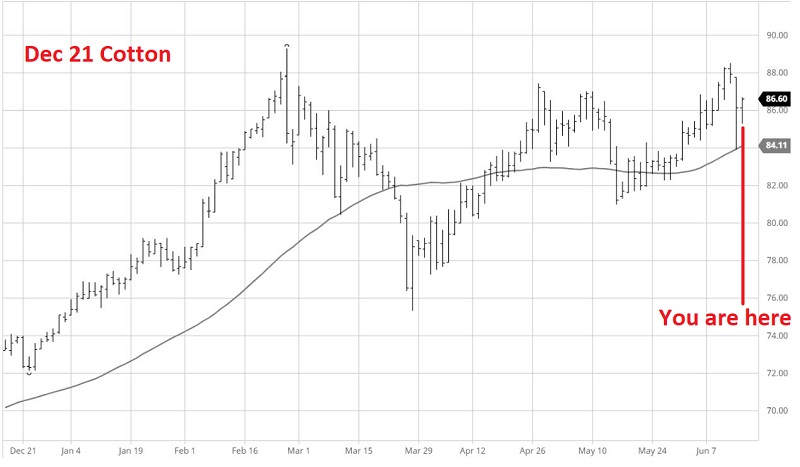
The warning signs above suggest that any drop below the 50-day average could be a sign of potential trouble and that traders should pay close attention.

Sorry, you don't have access to this report

Upgrade your subscription plan to get access
Go to Dasboard
PRODUCTS
SentimenTrader
Trading Tools
Indicators & Data API
‍
Strategies & Scanner
‍
Research Reports
FREE
RESOUrCES
Simple Backtest
Calculator
Simple Seasonality
Calculator
The Kelly Criterion
Calculator
Sentiment Geo Map
‍
Public Research Reports
‍
Pricing
Bundle pricing
‍
Announcements
‍
FAQ
COMPANY
‍
About
‍
In the News
‍
Testimonials
‍
Client Success Stories
CONTACT
‍
General Inquiries
‍
Media Inquiries
‍
Financial Professionals Inquiries
‍
© 2025 Sundial Capital Research Inc. All rights reserved.
Setsail Marketing
TermsPrivacyAffiliate Program
Risk Disclosure: Futures and forex trading contains substantial risk and is not for every investor. An investor could potentially lose all or more than the initial investment. Risk capital is money that can be lost without jeopardizing ones’ financial security or life style. Only risk capital should be used for trading and only those with sufficient risk capital should consider trading. Past performance is not necessarily indicative of future results.

Hypothetical Performance Disclosure: Hypothetical performance results have many inherent limitations, some of which are described below. No representation is being made that any account will or is likely to achieve profits or losses similar to those shown; in fact, there are frequently sharp differences between hypothetical performance results and the actual results subsequently achieved by any particular trading program. One of the limitations of hypothetical performance results is that they are generally prepared with the benefit of hindsight. In addition, hypothetical trading does not involve financial risk, and no hypothetical trading record can completely account for the impact of financial risk of actual trading. for example, the ability to withstand losses or to adhere to a particular trading program in spite of trading losses are material points which can also adversely affect actual trading results. There are numerous other factors related to the markets in general or to the implementation of any specific trading program which cannot be fully accounted for in the preparation of hypothetical performance results and all which can adversely affect trading results.

Testimonial Disclosure: Testimonials appearing on this website may not be representative of other clients or customers and is not a guarantee of future performance or success.