
Corporate insider buying falls off

One of the supporting legs of the rally beginning in the spring and lasting through June had been buying pressure from corporate insiders and other "smart money" investors. That began to moderate in August, especially among technology shares.
Lately, buying interest has dropped off significantly among members of the S&P 500. While there are still a large number of buyers over the past 6 months thanks to heavy interest in the spring, it's dropping quickly.
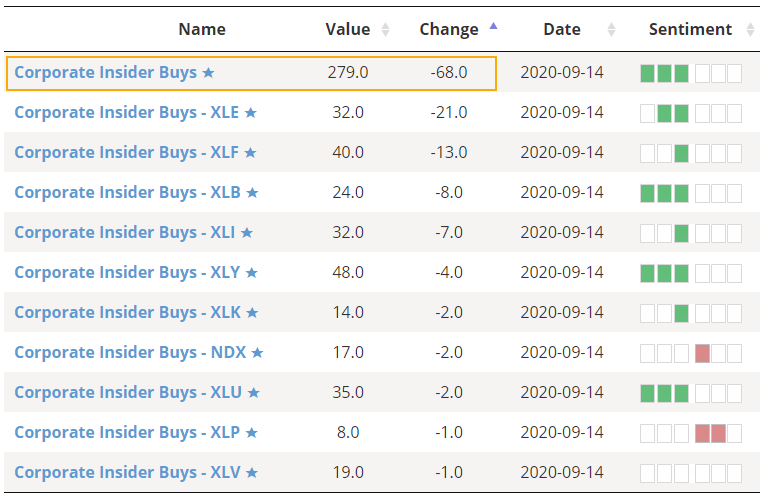
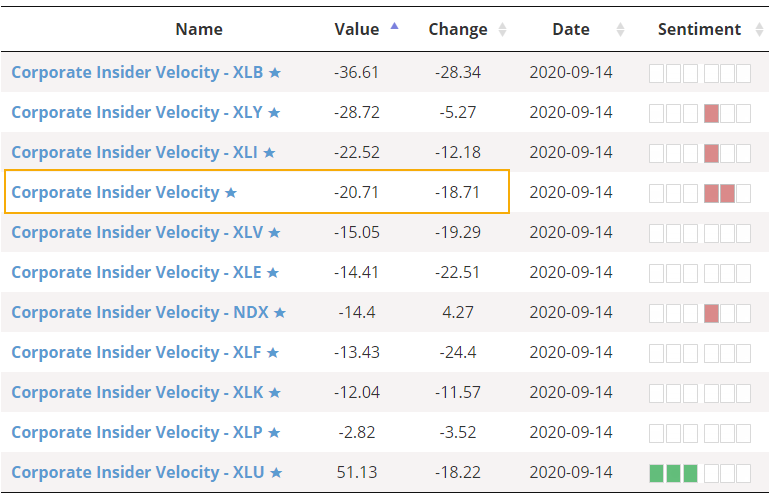
The 4-week rate of change in the Corporate Insider Buy/Sell Ratio, which we call Velocity, has dropped below -20% for stocks in the S&P 500.
According to the Backtest Engine, future returns have been poor whenever broad-market insider Velocity was below 20%.
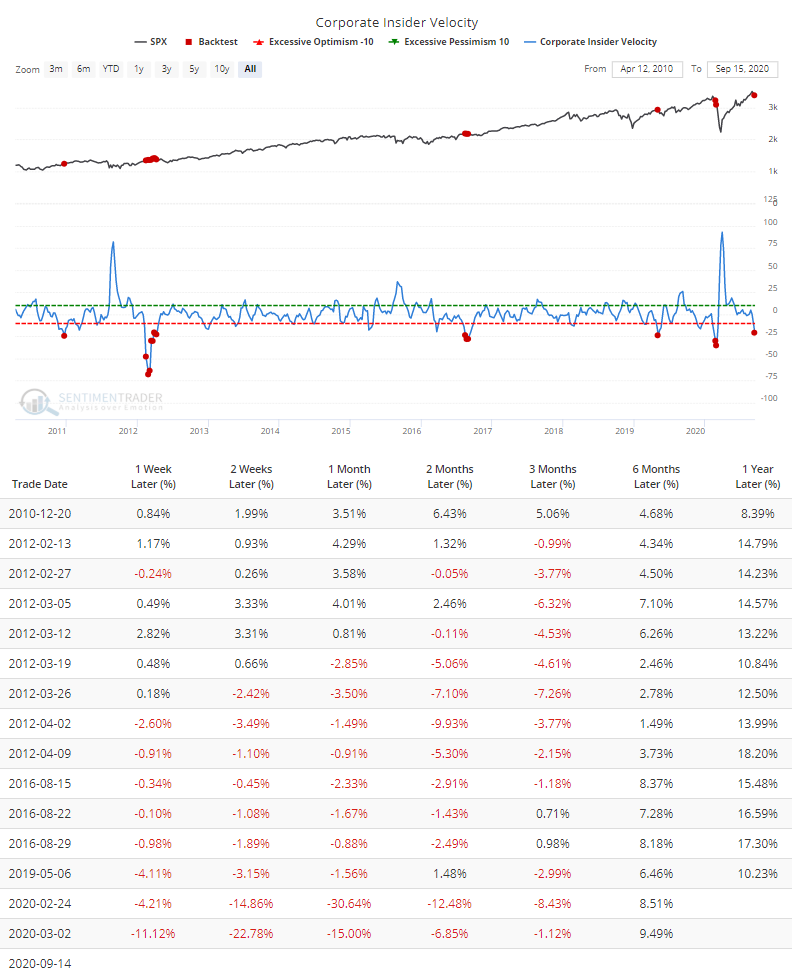
In 2010, this was very early and the S&P 500 managed to tack on more than 5% over the next few months. Those gains were eventually (though temporarily) erased during a subsequent correction but it took a long time to get there. The other signals saw more immediate weakness.
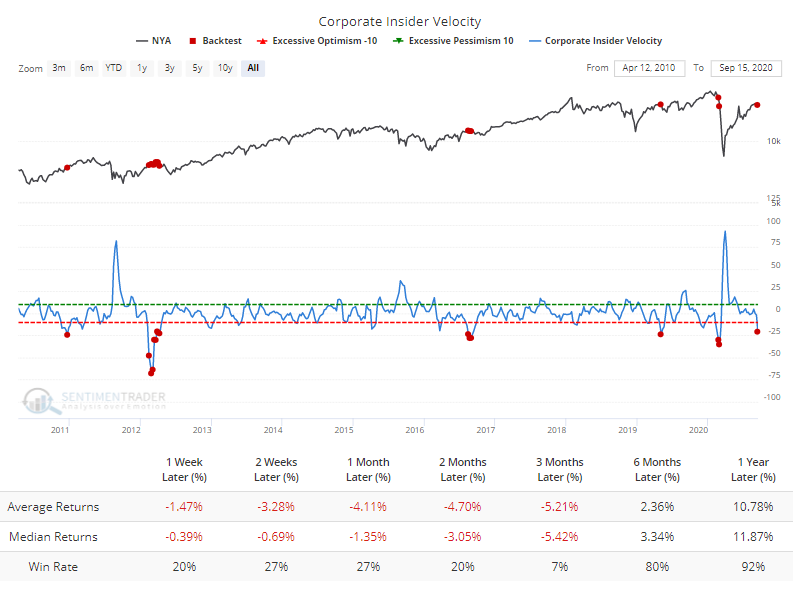
Even though the Buy/Sell Ratio is specific to S&P 500 companies, when there was quick selling pressure (or lack of buying) like this, broader indexes such as the New York Composite performed even worse.
The deeply negative Velocity is a concern, but it's minor. The reason is that the overall level of the Buy/Sell Ratio is still very high and it tends to be a longer-term metric.
Another reflection of "smart money" activity is the First Hour / Last Hour indicator. This compares trading activity during the opening minutes of each day to the closing minutes. Supposedly, the "dumb money" trades during the open, emotionally reacting to overnight and pre-market news, while the "smart money" transacts near the close after they've absorbed all of that day's developments and the behavior of other traders.
This is a shaky theory, especially in recent years when so much of late-day trading volume has been triggered by flows into and out of passive ETFs. Still, divergences between this indicator and stocks have been marginally useful and it tends to shine when making a rapid move up or down, especially if it's against the current trend in averages like the S&P 500 or Dow Industrials.
This is notable now because after surging in March, it has been steadily dropping and has lost more than 2% over the past month.
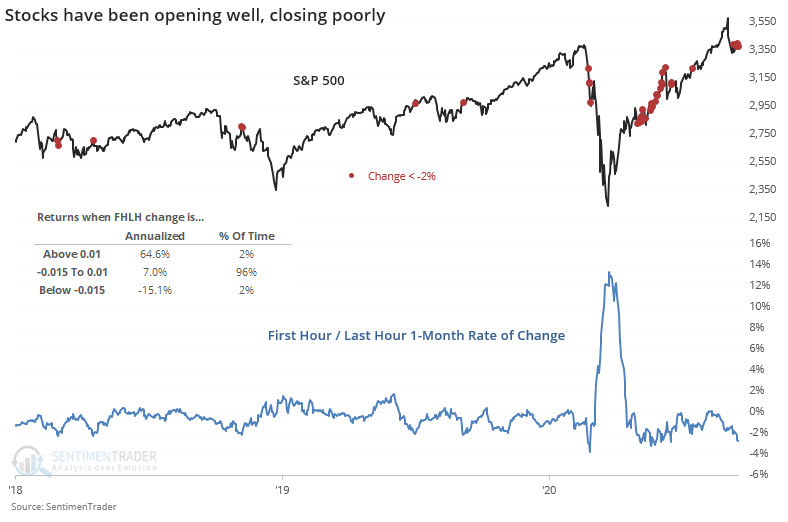
Annualized returns when this rate of change is very negative have been -15.1% as noted in the chart above. We don't put a lot of weight on this, but generally prefer to see this indicator rise as opposed to fall, along with the Smart Money Index (just another version of the same thing, and not to be confused with our Smart Money Confidence model).
Other measures of "smart money" activity, like hedgers' positions in equity index futures, are not confirming any wholesale effort to bet against stocks.
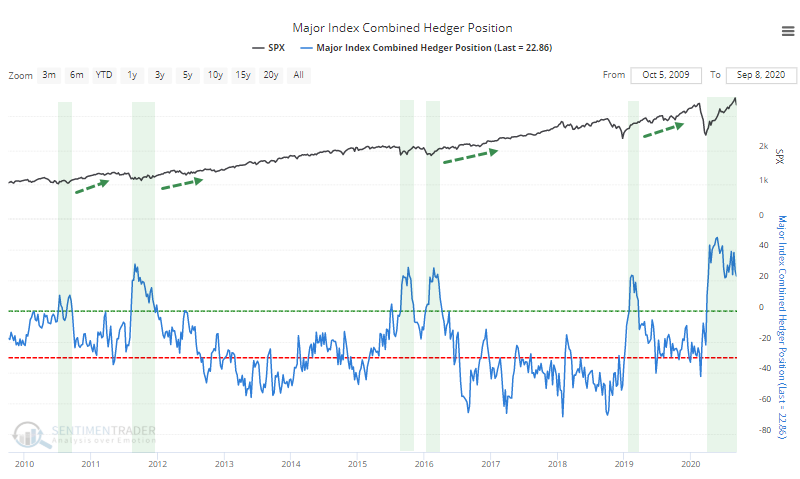
This was a nice confirming signal of a bullish bias in March and April, then it started to get weird when hedgers weren't selling as stocks rose. That should be even more positive on the surface, but the trouble is that it's different from how they've behaved at every other juncture in the past 10 years. When indicators act differently from how they have in the past, it should give pause that maybe something has changed.
Overall, "smart money" indicators are showing a very slight worry as they moderate, but generally it's coming from very positive positions and isn't a major concern here. The biggest worries for stocks remain the unbounded enthusiasm among options traders and some questionable internal momentum developments from August, though that has moderated a bit this week.