
Crafting an Options Position

It's time for another dose of "option traders aren't necessarily like everyone else." As usual, if you have no interest in options and are pretty certain you will never trade one, it is "class dismissed early" for you. For the rest of you, we are going to get a bit into the weeds to highlight the three key steps in trading options successfully. Namely:
- Spotting an opportunity
- Crafting a trade to exploit said opportunity
- Managing the position once entered
As always, the example trades below are just that - examples - and should in no way be construed as recommended trades that you should rush out and jump into. The primary thing to take away from this article is the "process" and NOT the specific examples covered.
Ticker BB
Some of you may remember when the Blackberry was a big deal (it was so addicting at the time they referred to it as the "Crackberry"). The company has had its ups and downs, but for the sake of example we are going to assume that Trader A:
- Believes in the Elliott Wave Theory (in a nutshell, everything moves in 5 waves)
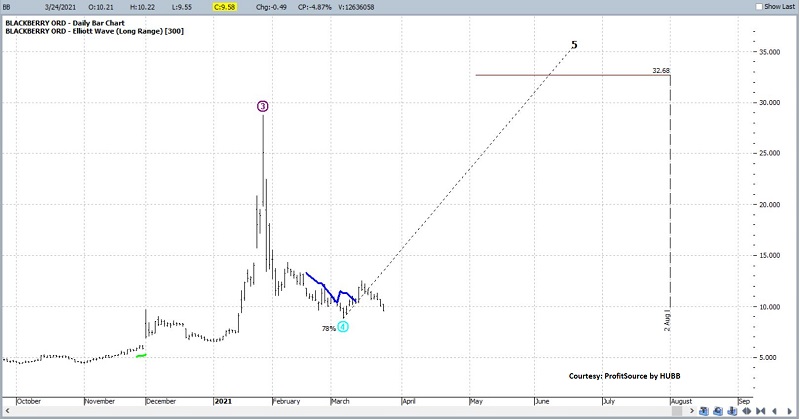
- Believes (based on the Wave 5 Elliott Wave projection in the chart below) that BB is headed higher in the months ahead
- Wants to maximize profitability by using options instead of simply buying shares of BB stock
The chart below - which utilizes a built-in EW algorithm in ProfitSource by HUBB - suggests the potential for an up move in BB in the months ahead. I am agnostic on the signal itself, but we are using this simply as an example opportunity - or catalyst - for initiating a trade.
Since we are going to look at an option trade there are a few things to consider:
- Do we want to play for "The Big One", i.e., an explosive move higher, OR
- Do we want to play for "whatever type of upward trend might develop"?
In other words, we can put on a position that might make an obscene amount of money if BB does in fact run to $35 a share - but will lose money if it does not (i.e., high profit potential, low probability of profit). Or we can enter a position that won't make nearly as much if BB does hit $35, but can generate a profit if BB advances to $10 a share, or $12, or $15 and so on. This is a crucial decision.
For the sake of example, we will assume that Trader A wants to play for an up move but does not necessarily expect it to carry to the EW target. In fact, Trader A's initial target is the February 2021 high around $14.50 a share.
The next question: is implied option volatility high, low, or somewhere in between? This is important because IV is a key determinant in deciding which option strategy to use.
The quick-and-dirty explanation:
- Option prices contain time premium
- If implied volatility is near the high end of the historical range it tells us that options have a lot of time premium built into their price, i.e., options are "expensive"
- Conversely, if IV is near the low end of the historical range it tells us that options have little time premium built into their price, i.e., options are "cheap.")
All figures below are presented courtesy of www.OptionsAnalysis.com. The dark black line in the chart below represents the history of the implied volatility for at-the-money options with 90+ days left until expiration.
In the chart below we see that BB implied volatility is something of a mixed bag.
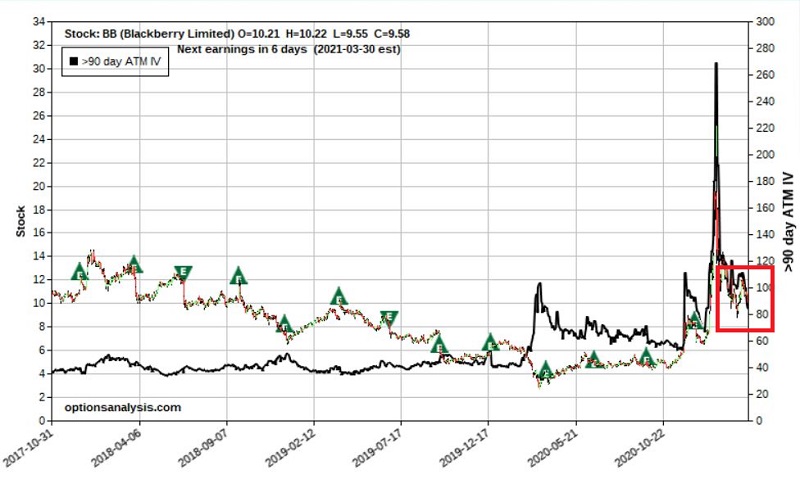
For a number of years, the high for IV (the black line in the chart above) was around 50%. During the covid selloff of 2020, it spiked to over 100% then fell back down to 50%. Then when the stock shot higher in January 2021, IV soared to 265% and is now just back under 100%.
So, BB options are presently not as expensive as they were a couple of months ago, but on a historical basis are still very expensive.
The bottom line: If you buy premium and IV drifts back down to the 40-50% range then the options you buy can lose a great deal of time premium based solely on the decline in IV.
Let's consider two possible ways to play.
1. Buy a call option
The first is to buy the January 2022 12.5 strike price call. The details and risk curves appear in the chart below.
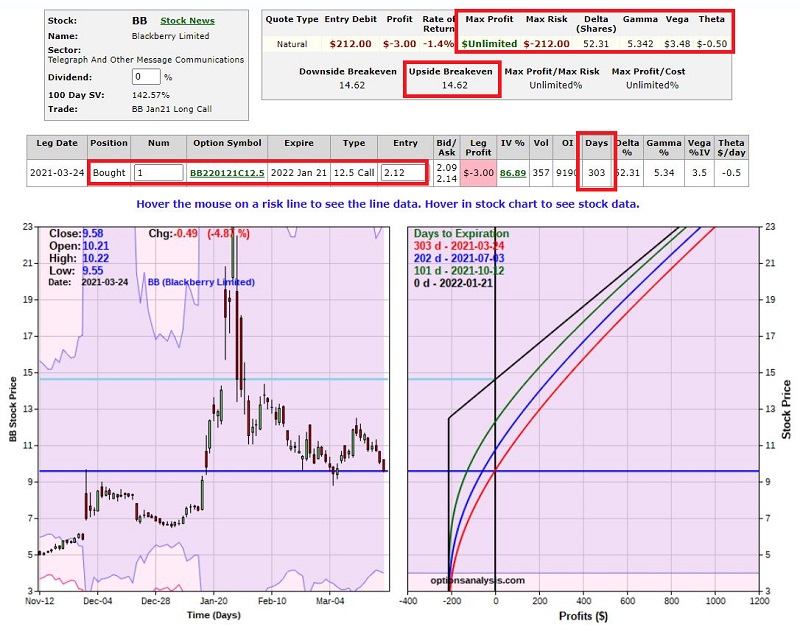
The good news is that:
- Risk is limited to $212 per 1-lot
- The position enjoys unlimited profit potential. If the EW projection does in fact turn out to be accurate this option can generate a huge percentage return
- This trade gives BB 9.5 months to "do something"
The bad news is two-fold:
- The breakeven price of this trade is $14.62, which is a full 52% above the current price of the stock
- A decline in IV in the months ahead can deflate the price of the option
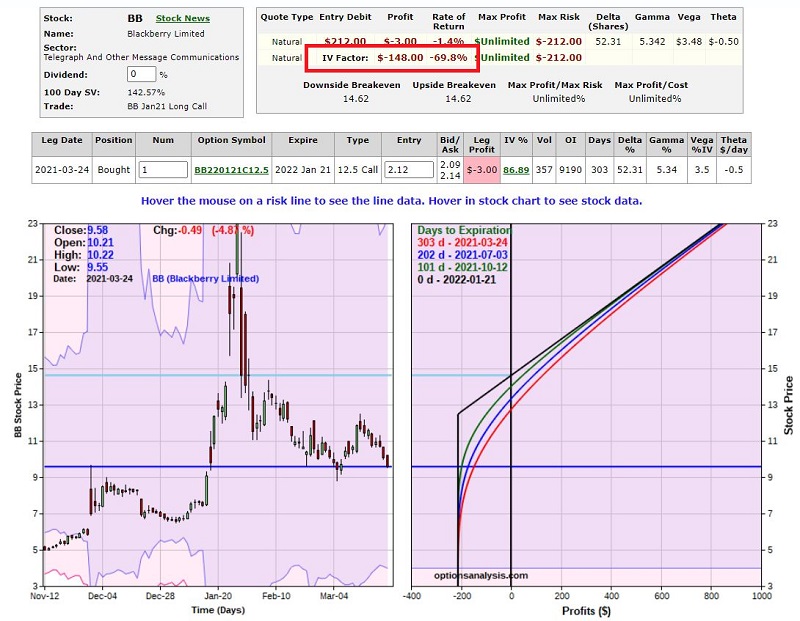
The chart below assumes that IV declines 40% from current levels. As you can see in the red highlight box, this stands to deflate the value of the option (due to a decline in time premium) by $148. If you look very closely at the red, blue, and green lines in the chart below you will note that they have shifted lower (on this chart lower means further to the left) than in the chart above. This illustrates the effect of a decline in implied volatility.
2. Sell a bull put spread
Let's consider an alternate trade that sells premium to take advantage of high implied volatility. The figure below displays a Bull Put Spread that involves:
- Selling the Jan2021 5 strike price put
- Buying the Jan 2021 2.5 strike price put
If Trader A makes this trade:
- She takes in a credit of $49 and risks $201
- The trade is profitable as long as BB is above $4.51 a share at option expiration
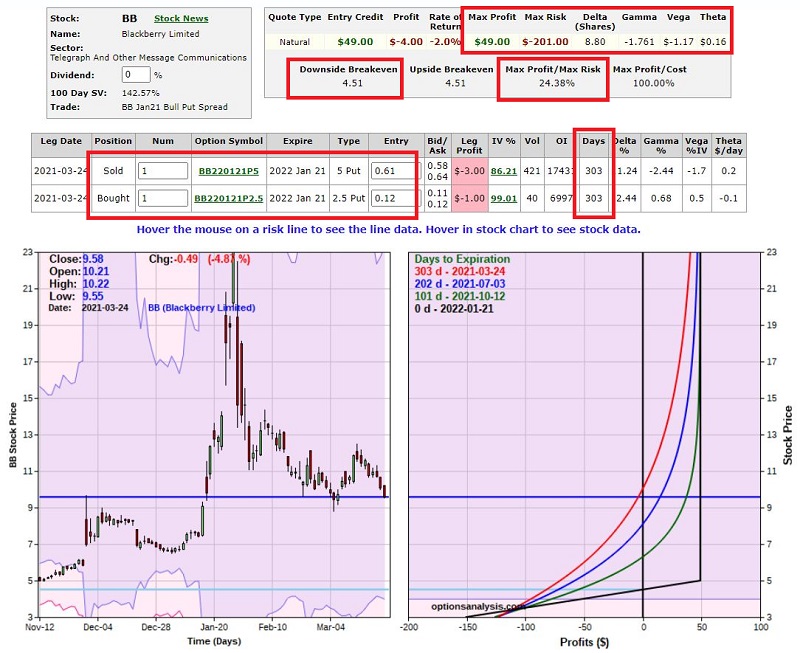
It should be noted that if BB drops below $5 a share and the short put is exercised, the seller of this option is obligated to buy 100 shares of BB at $5 a share.
An alternative route
Now let's consider an alternative that combines these two trades. We like the unlimited profit potential of the first trade but are concerned about the potential for time decay if either:
- The stock fails to advance in any meaningful way, OR
- If implied volatility declines in any meaningful way
We also like the idea of taking advantage of high time premium by selling puts as in the second trade, as well as having a breakeven price well below the current price of the stock. So, let's put these two trades together as follows:
- Sell 10 2021 5 strike price puts @ $0.61
- Buy 10 2021 2.5 strike price puts @ $0.12
- Buy 1 2021 12.5 strike price call @ $2.12
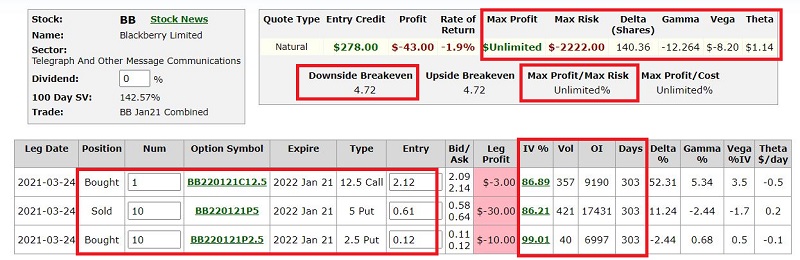
Things to note:
- The cost to enter this trade is $2,222
- $2,222 is also the maximum risk - which would only be realized if we hold the trade until expiration and BB stock is trading at $2.5 or lower
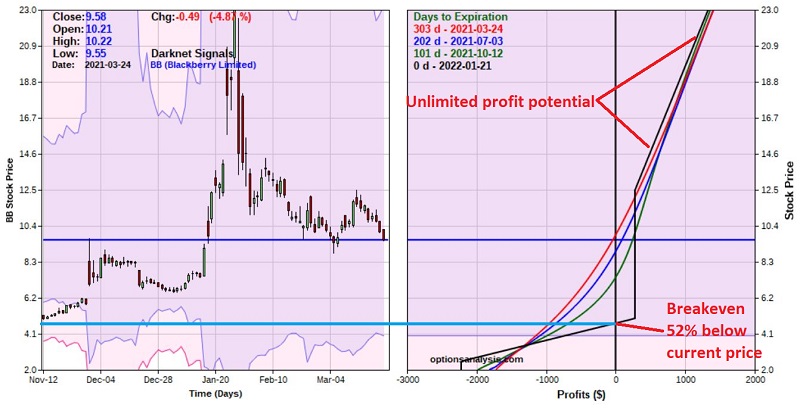
- The breakeven price for this trade is $4.72 (this implies that if BB stock DOES NOT decline 52% or more between now and expiration next January this trade will show a profit)
- The trade also enjoys unlimited profit potential (so Trader A retains the potential to profit handsomely if the EW projection from earlier actually were to play out)
- If BB stock drops below 5$ a share and the short puts are exercised, Trader A could be obligated to buy 1,000 shares of BB at $5.
Position Management
The Short Version:
- If BB stock approaches $14.35 look to adjust the trade to lock in a profit while retaining additional upside potential
- If BB stock approaches $4.72 a share look to cut a loss before short puts get exercised
The Long Version:
- Trader A in this example will have to monitor this trade if BB begins to decline in price. Option exercise on the short puts is a danger if price drops below $5 a share (it should be noted however that option exercise typically - though not always - occurs when there is very little time premium in the option. Since these options do not expire until January 2022 there is a good chance that that will not be an issue anytime soon.
- In any event, the breakeven price of $4.72 represents an obvious fail-safe "Uncle" point. As you can see in the chart above, the expected loss if the trade is exited at that point gets smaller as time goes by. This is the effect of "time decay" and positive "Theta".
- A close look at the chart above reveals that if BB fell immediately to $4.72 the open loss on the trade would be roughly -$950 (Note that the red line represents the expected P/L at a given price for BB stock as of the day of trade entry. Each successive line - blue, green, and black - represents a later date leading up to expiration).
- On the upside, we will assume that Trader A has an initial price target of the February high of $14.35 a share. If BB stock reaches that price the expected open profit is roughly $475 (depending on volatility - if it rises the profit will be higher if it falls the profit will be lower). Trader A resolves to consider adjusting the trade - hopefully locking in a profit while allowing for further upside potential - if and when that price is hit.