
Credit Spreads Suggest the Easy Money Has Already Been Made

When things are swell, things are great.
In 2020, before anyone could figure out what was going on, the stock market plunged 30+% in a little over a month. As everyone fretted and worried about the potential for a Covid related economic collapse, the stock market sensed something completely different (lots of government cash and a rebounding economy).
And now we keep reading about how the economy is heating up. And the implication is that this is good for the stock market going forward. But as I wrote about in this article, the stock market is a discounting mechanism. As a result, much impending "Good Economic News" may already be priced in.
Consider the message from credit spreads.
BBB MINUS AAA CREDIT SPREAD
In times of economic uncertainty, the yield on lower-rated bonds (i.e., those issued by less stable companies) tends to soar relative to high-rated bonds (i.e., those issued by more stable companies). On the flip side, when the economy is humming along, the spread between low-grade and high-grade yields tends to narrow. And here is where human nature leads many investors to make a common mistake.
When the BBB-AAA Credit Spread narrows:
- the headline story usually reads, "narrowing credit spreads suggest a strong economy in months ahead"
- then everyone cheers and makes the mistake of assuming that this will translate into big gains for the stock market
- the problem is that history suggests otherwise; the stock market has usually already priced in whatever the headline is suggesting
The BBB-AAA Corporate Yield Bond Spread indicator found on SentimenTrader recently read 0.63 (meaning that the yield on BBB bonds minus the yield on AAA bonds = 0.63). The chart below from our Backtest Engine highlights all days when this spread was below 0.64.
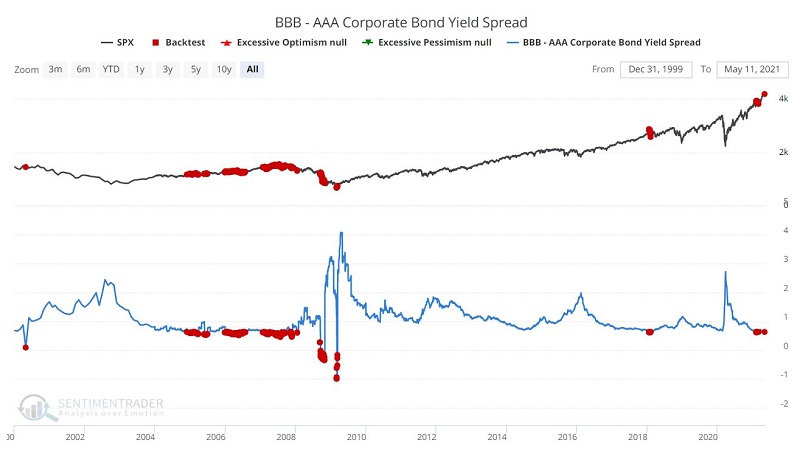
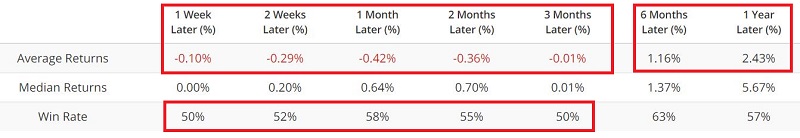
The table below displays the performance of the S&P 500 Index following the days marked in red on the chart above.
Note that:
- The results are NOT overwhelmingly bearish for stocks per se
- HOWEVER, they are uniformly well below average
- Returns through 3 months were roughly 50/50
- Average returns through 3 months were negative
- The average 6-month and 12-month returns are quite inferior to the long-term average
This is not a "precision market timing" tool. It is intended more to cause investors to consider an "attitude adjustment" regarding expectations in the future.
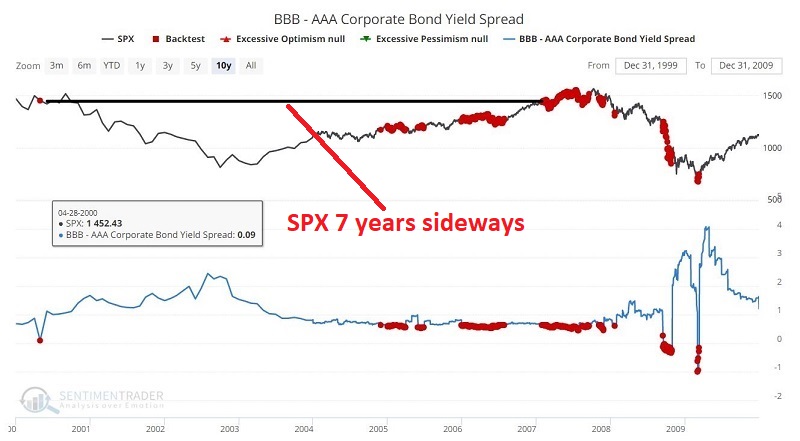
APRIL 2000
In the chart below, we see that:
- The BBB-AAA spread fell to 0.09 in April 2000
- The S&P 500 Index stood at 1,452
- It took the S&P 500 Index 7 years to get back to that level
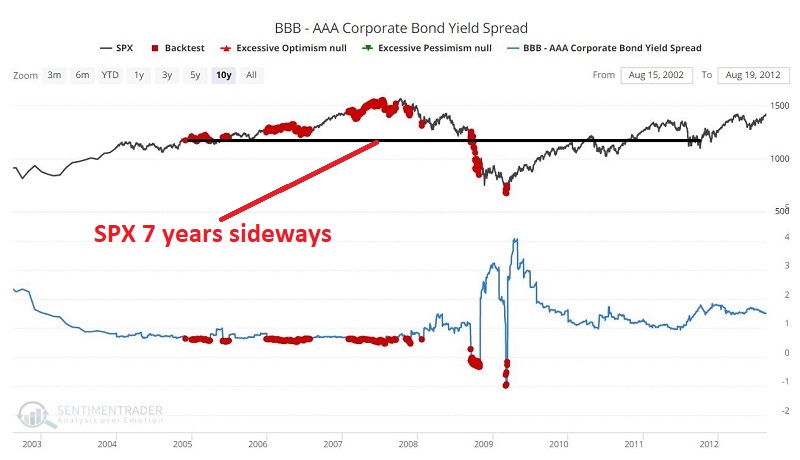
NOVEMBER 2004
In the chart below, we see that:
- The BBB-AAA spread fell below 0.64 in November 2004
- The S&P 500 Index stood at 1,173
- The S&P rallied nicely into the 2007 top before plunging
- It took the S&P 500 Index 7 years to break out decisively above 1,173
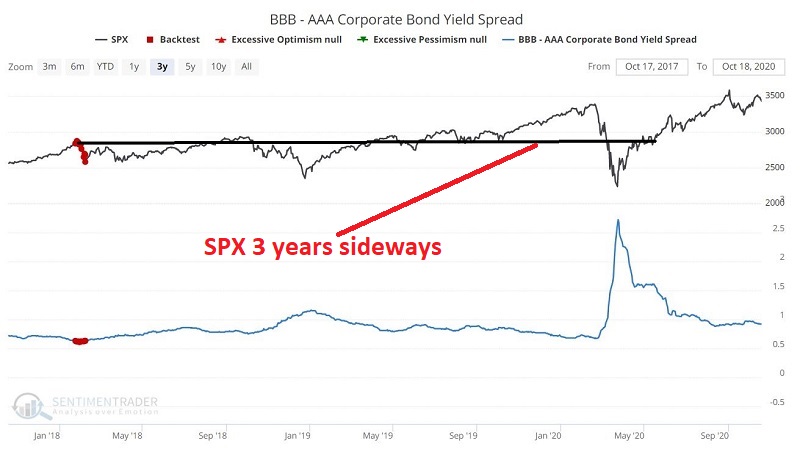
JANUARY 2018
In the chart below, we see that:
- The BBB-AAA spread fell below 0.64 in January 2018
- The S&P 500 Index stood at 2,837
- The S&P rallied nicely into the 2020 top before plunging
- It took the S&P 500 Index 3 years to break out decisively above 2,837
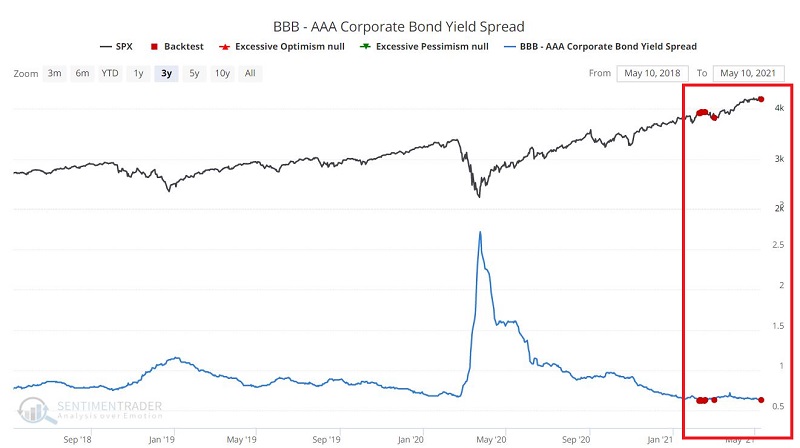
FEBRUARY (AND MAY) 2021
In the chart below, we see that:
- The BBB-AAA spread fell below 0.64 in January 2021
- The S&P 500 Index stood at 3,911
- The S&P has continued to rally, hitting 4,238 in May 2021
- The BBB-AAA spread dropped below 0.64 again in May 2021
SUMMARY
So, has the easy money been made, and will the stock market now enter a long sideways (or worse) period that lasts several years? Or are we truly in a "New Era" where a flood of Fed money overpowers all of the old rules?
The truth is there is no way to predict. Still, at the very least, history suggests that given the current state of the BBB-AAA credit spread:
- Investors can expect a decent economy for some period of time
- At the same time, investors would likely be wise NOT to star-gaze and wonder how much more terrific profits the stock market has in store