Crude Oil Reversal Pattern
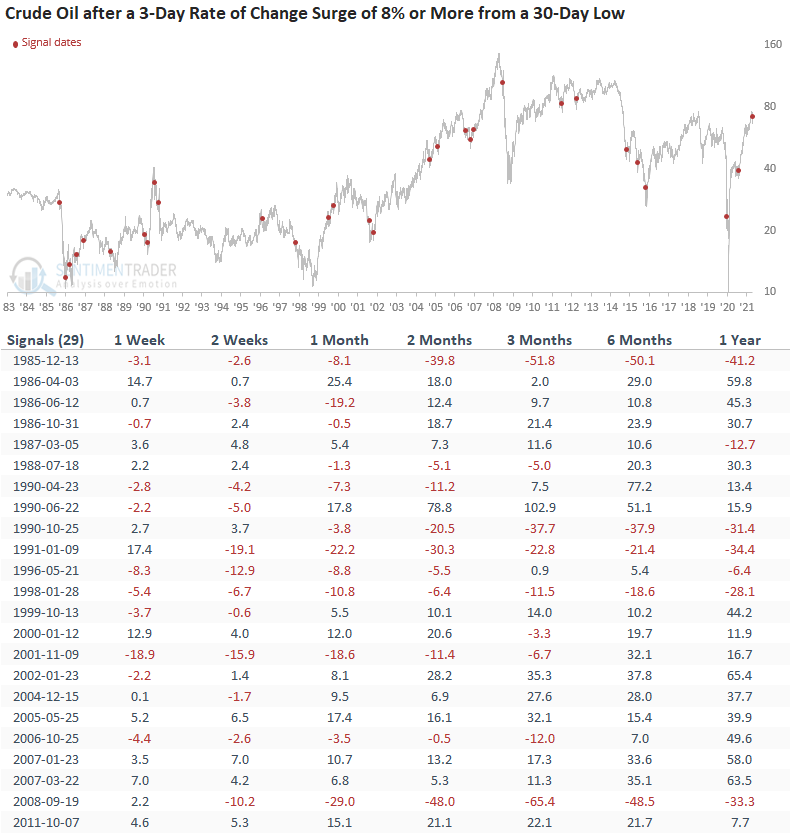
Crude oil has surged over 8% in the last three days after registering a 30-day closing low on 7/19/21. While the commodity's short-term trend outlook remains uncertain for the time being, the intermediate to long-term trend environment still looks very healthy.
Let's see if the short-term pattern that has played out over the last four days can provide us with any insight into the future direction of the commodity.
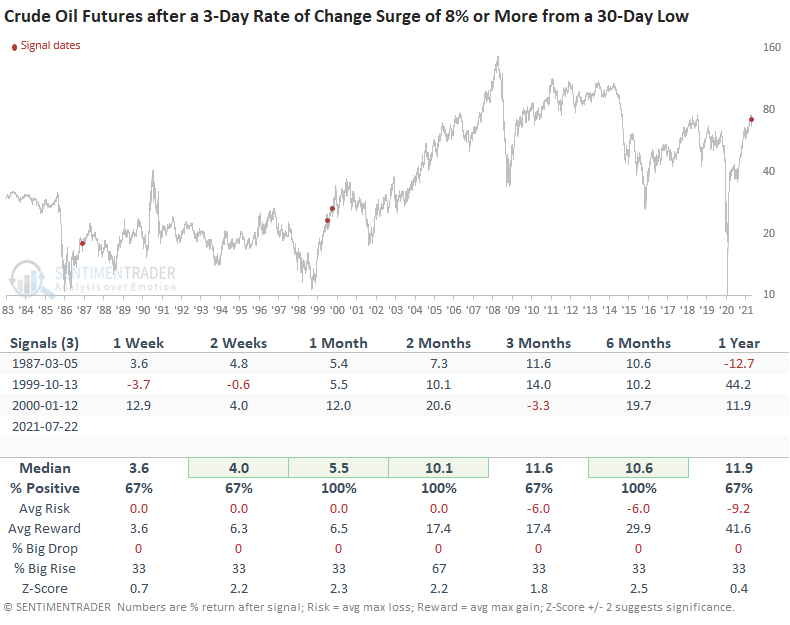
We will conduct a study that identifies all instances when the 3-day rate of change surges by 8% or more from a 30-day low.
HOW THE SIGNALS PERFORMED
The 1-2 week results suggest that crude could see some follow-through from the reversal pattern. However, the 1- month window indicates that after the initial bounce in the first couple of weeks, crude could experience some backing and filling. The long-term results look constructive, especially in the 6-month window.

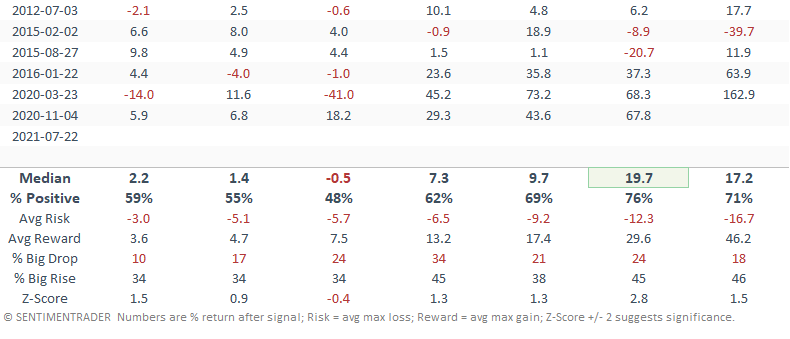
Let's add some context to the signal. The following table contains the distance from the 252-day high on our signal day. So, the 7/22/21 pattern triggered when crude oil was 5.83% below its 252-day high. When I glance at the table, it tells me that most signals occurred when crude oil was down 20% or more. i.e., the pattern occurred in a bear market.
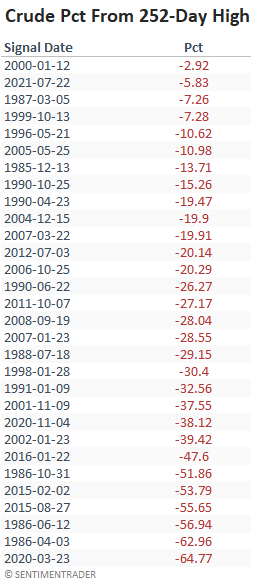
Let's add a trend filter to the pattern. We will now isolate when crude oil registered a 3-day rate of change of 8% or more from a 30-day low and include a condition that crude oil is trading above its 200-day moving average. i.e., crude oil is in an uptrend.
HOW THE SIGNALS PERFORMED - 200-DAY MOVING AVERAGE FILTER
Results look pretty good across all timeframes, with positive returns despite a couple of ugly signals in the early 1990s. I would note that the 1990 and 1991 signals occurred within the context of the Iraq war oil spike and subsequent collapse.
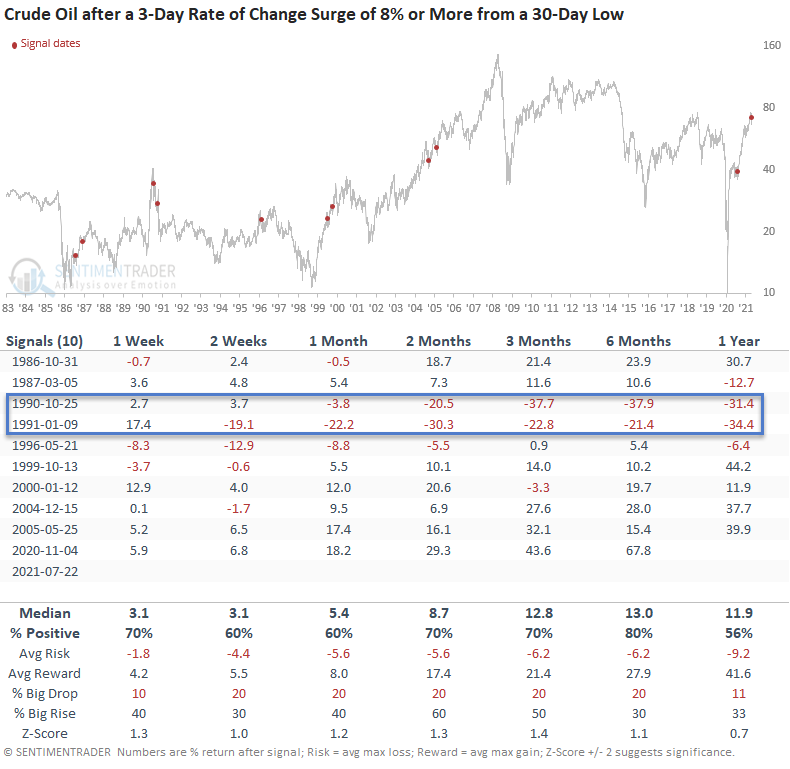
Let's add one more filter to the original study. We will now isolate when crude oil registered a 3-day rate of change of 8% or more from a 30-day low and include a condition that crude oil is down less than 10% from a 252-day high. The 252-day high requirement should help us to isolate a pattern similar to the current one.
HOW THE SIGNALS PERFORMED - LESS THAN 10% FROM 252-DAY HIGH
While the sample size is small, the results look promising. And, I would note that the historical instances occurred in uptrends.
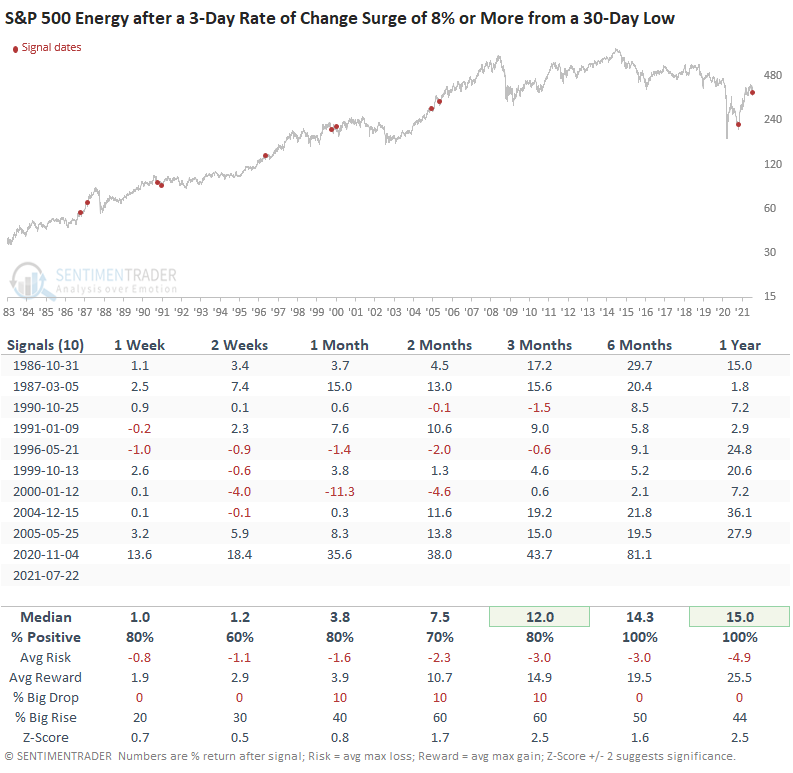
Let's go back to the study with our trend filter that includes the 200-day moving average condition and assess the S&P 500 energy sector outlook.
HOW THE SIGNALS PERFORMED - THE ENERGY SECTOR
Results look excellent across all timeframes, especially the 6-12 month window.
The backdrop for crude oil to reestablish a positive short-term uptrend against the backdrop of healthy intermediate to long-term trends looks constructive at this point. I will also be monitoring the energy sector for bullish momentum reversal signals that I have shared in previous notes.

