
Crude Oil Trend Persistency

The price trend backdrop for Crude Oil looks excellent. My composite trend model is currently maintaining a perfect score and hasn't been below a level of five since November 2020.
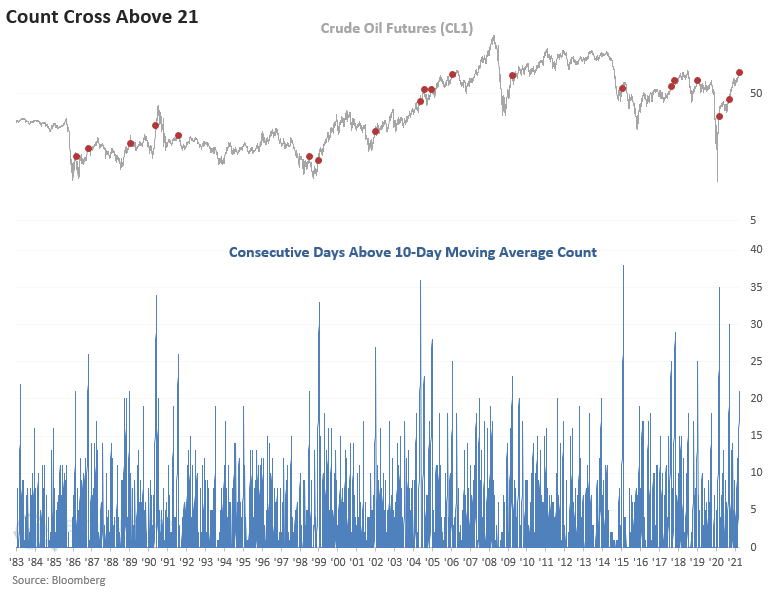
While I prefer to utilize intermediate to long-duration indicators to assess price trends, I've found that short duration indicators have a time and place. I use short-duration indicators like moving averages to measure trend persistency by counting the number of consecutive bars above or below a moving average. The trend persistency count can help to identify significant price reversals and potential short-term exhaustion points.
Crude Oil has now traded above its 10-day moving average for 21 consecutive days. Let's conduct a study to assess the forward return outlook for the commodity when this pattern has occurred in the past.
HISTORICAL CHART
The trend persistency count has now reached a level of 21 for the third time since April 2020. The 2003-08 crude oil bull market is the only other time we've seen this type of consistency.
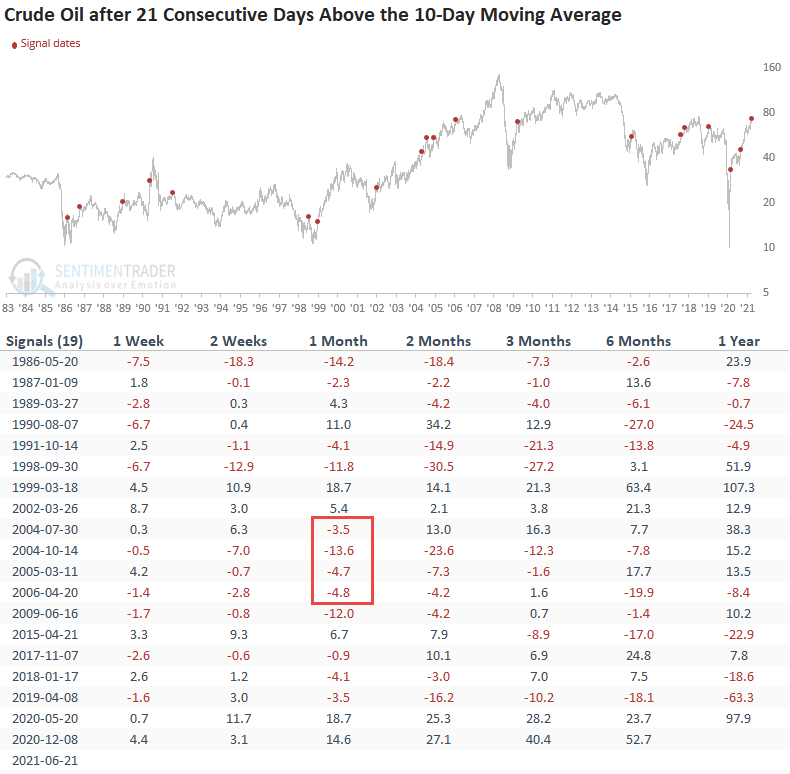
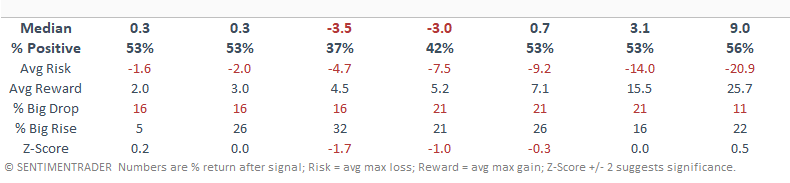
HOW THE SIGNALS PERFORMED
While the last two signals exhibited strong returns, history would suggest that crude oil could take a break in the short to intermediate term. I highlighted the 1-month instances in the 2003-08 timeframe so one could see that even when oil was in a bull market, nothing goes up in a straight line forever.
Please click on the following link to see a seasonality note on the large-cap energy sector from Jay. Click here.