Headlines
|
|
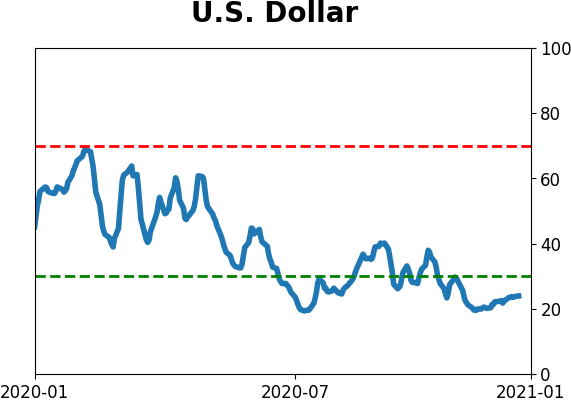
Short covering in the dollar as the trend turns:
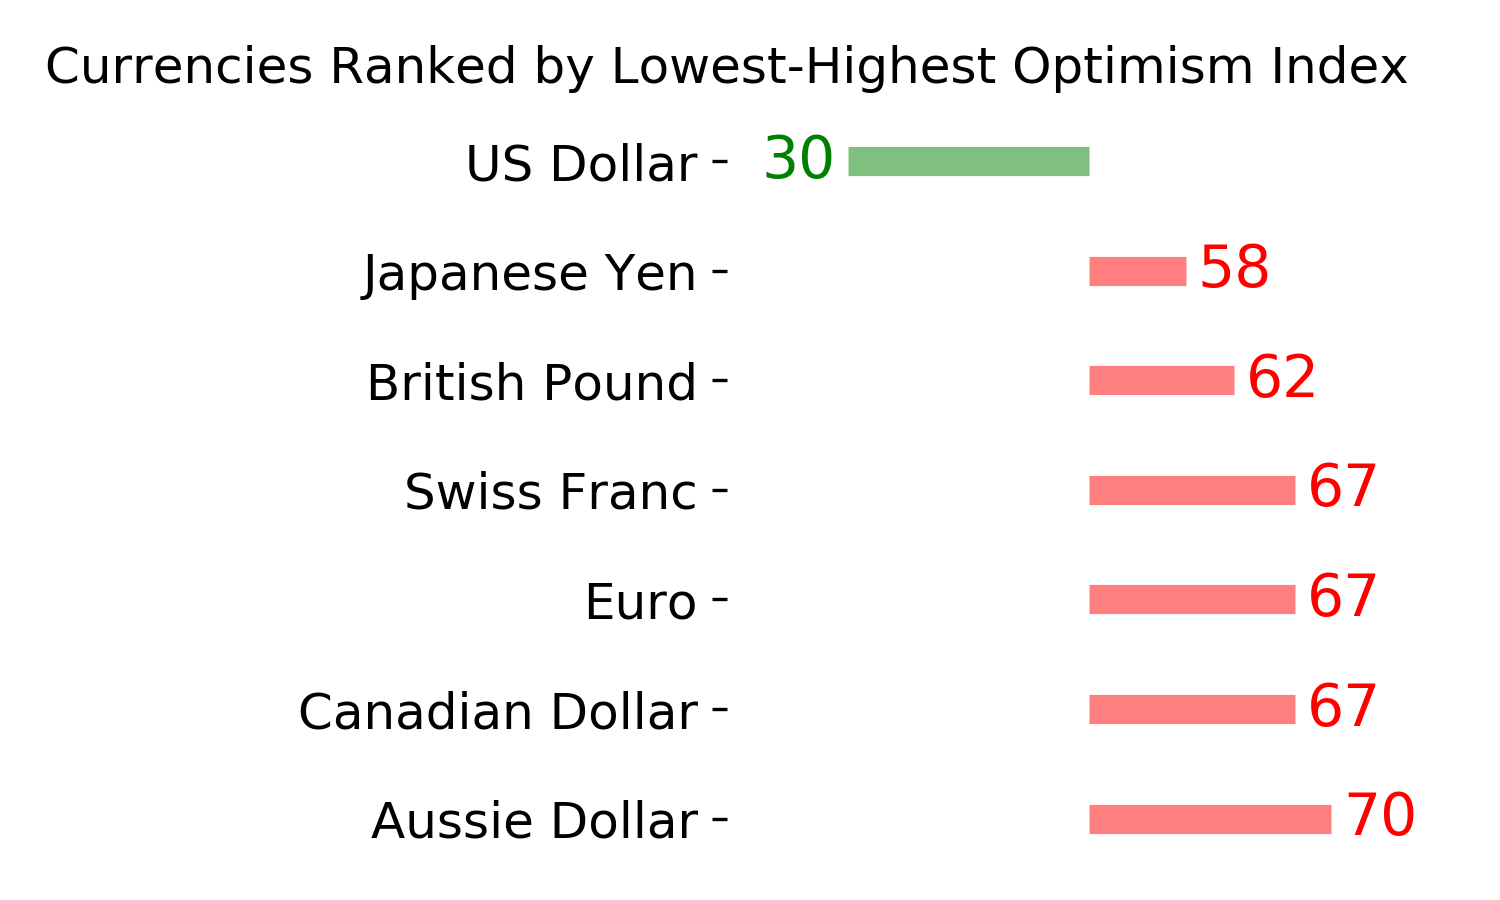
The U.S. dollar has jumped over the past few sessions, suggesting some short covering by speculators, who have been carrying massive exposure against the dollar. It has also closed above its 20-day average for the first time in months. But neither condition has reliably led to a higher dollar.
Bottom Line:
- The market environment is pristine, with only sporadic signs of internal deterioration, but with near-historic optimism, gains tend to be muted, with a high probability of being reversed at some point over the ensuing weeks.
| Other Sectors and Assets |
| | Positives | Negatives | | 1. Energy (here, here, and here) | 1. Skewed tech (here and here) |
|
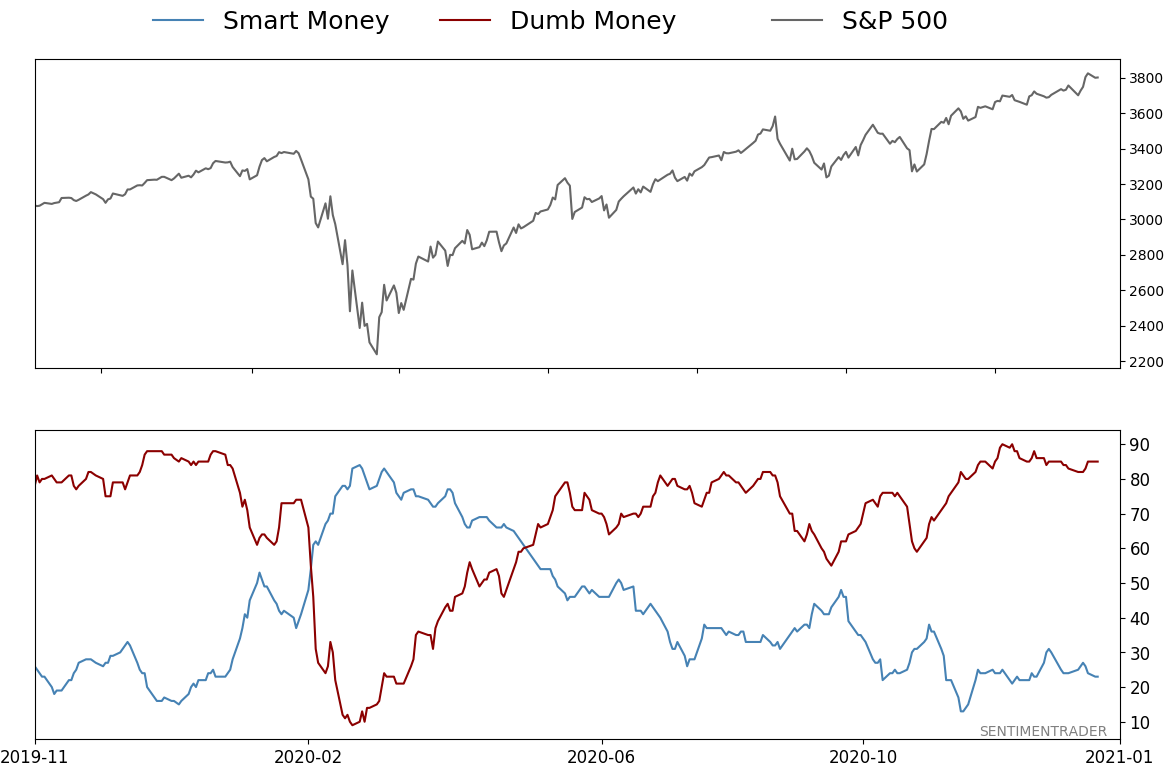
Smart / Dumb Money Confidence
|
Smart Money Confidence: 23%
Dumb Money Confidence: 85%
|
|
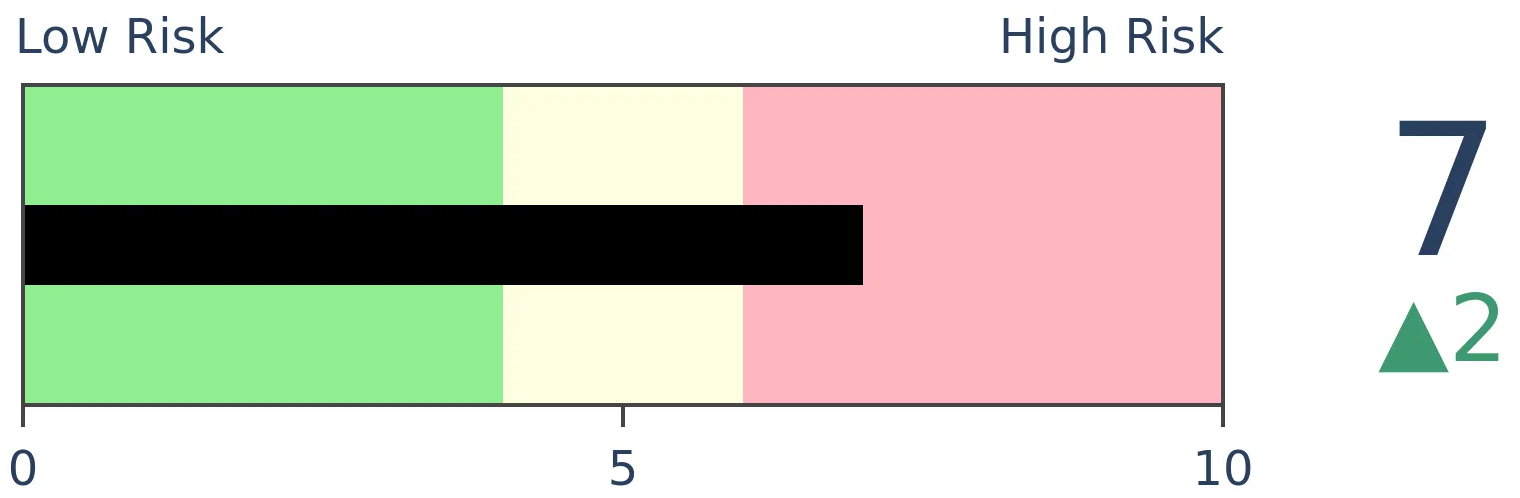
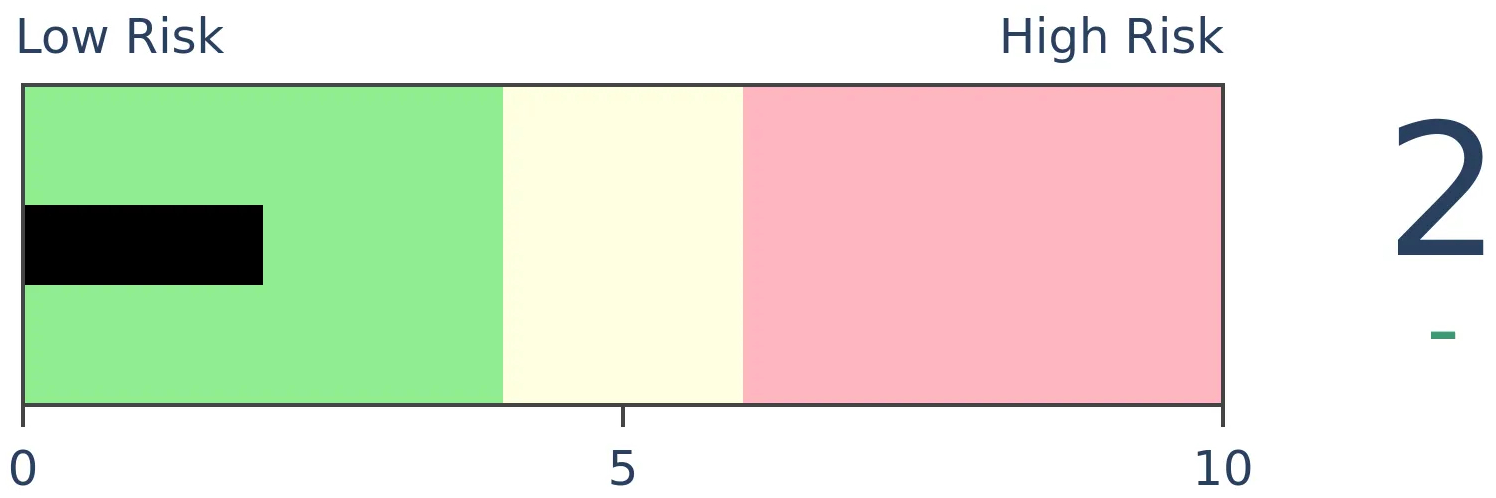
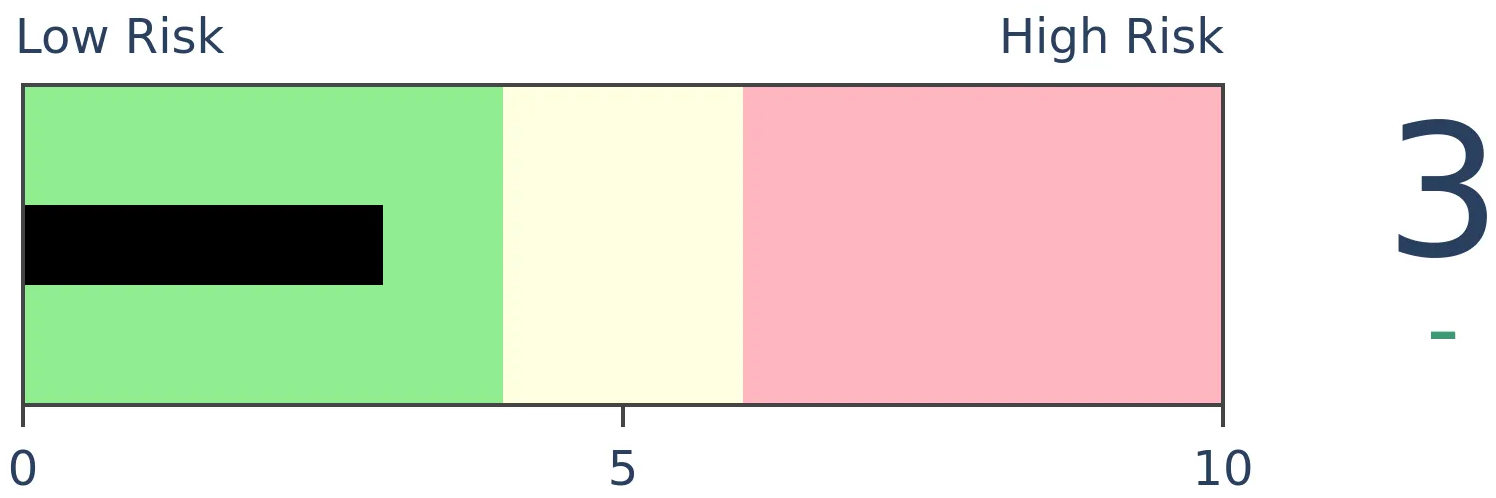
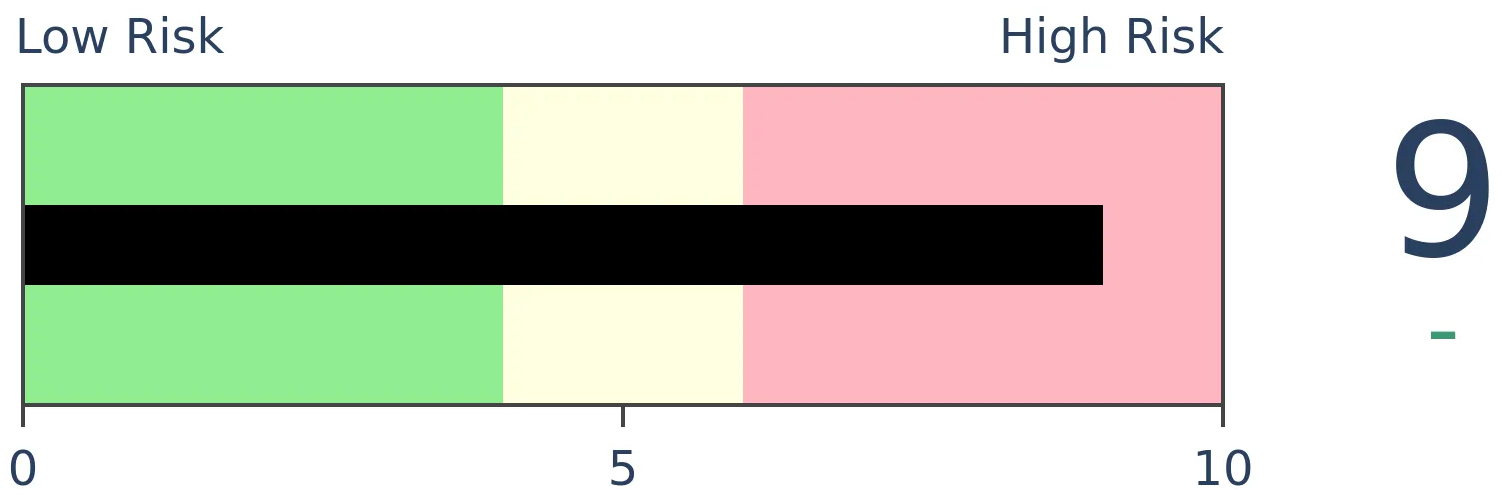
Risk Levels
Stocks Short-Term
|
Stocks Medium-Term

|
|
Bonds
|
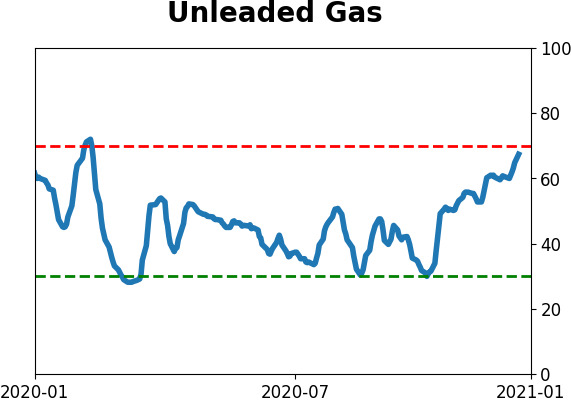
Crude Oil

|
|
Gold
|
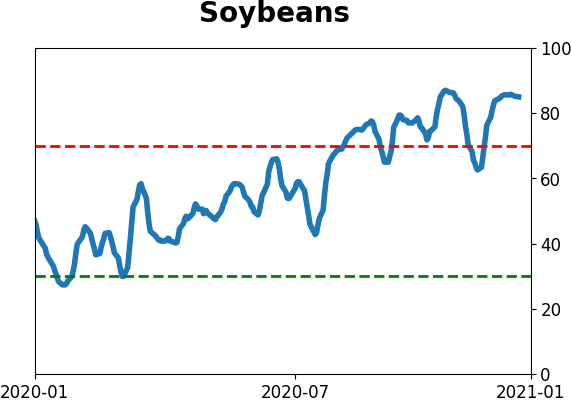
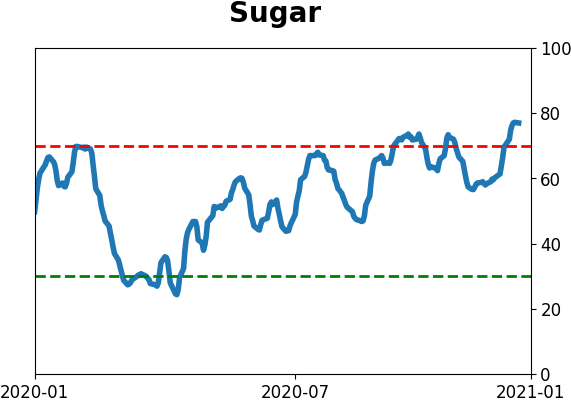
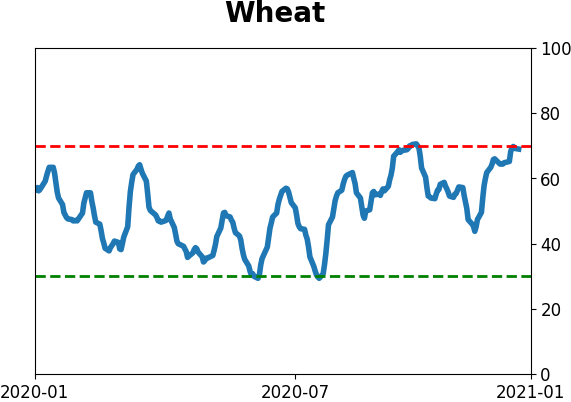
Agriculture
|
|
Research
BOTTOM LINE
The U.S. dollar has jumped over the past few sessions, suggesting some short covering by speculators, who have been carrying massive exposure against the dollar. It has also closed above its 20-day average for the first time in months. But neither condition has reliably led to a higher dollar.
FORECAST / TIMEFRAME
None
|
There is a broad spectrum of investors looking for the dollar to rally, which should help trigger a pullback in stocks, metals, and commodities. The trouble is, many of their arguments were the same ones used in September.
On the surface, the arguments have a little bit of support. The buck closed above its 20-day moving average for the first time in months on Monday. That ended a streak of 46 days below that average, the longest in nearly a decade.
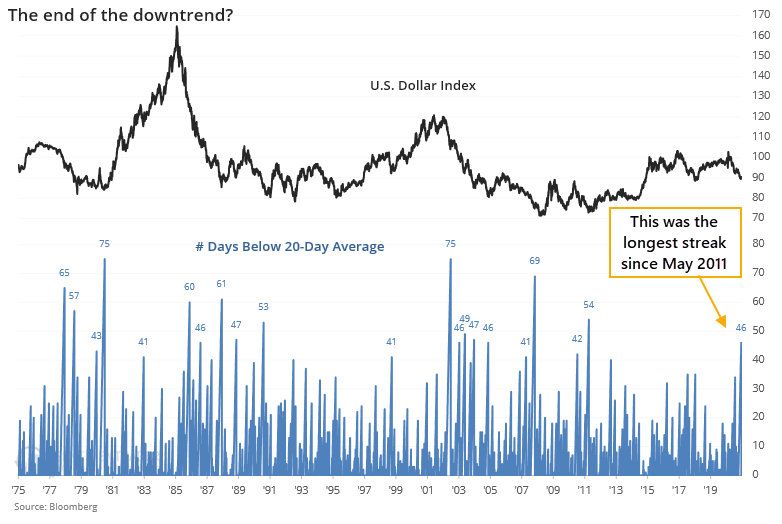
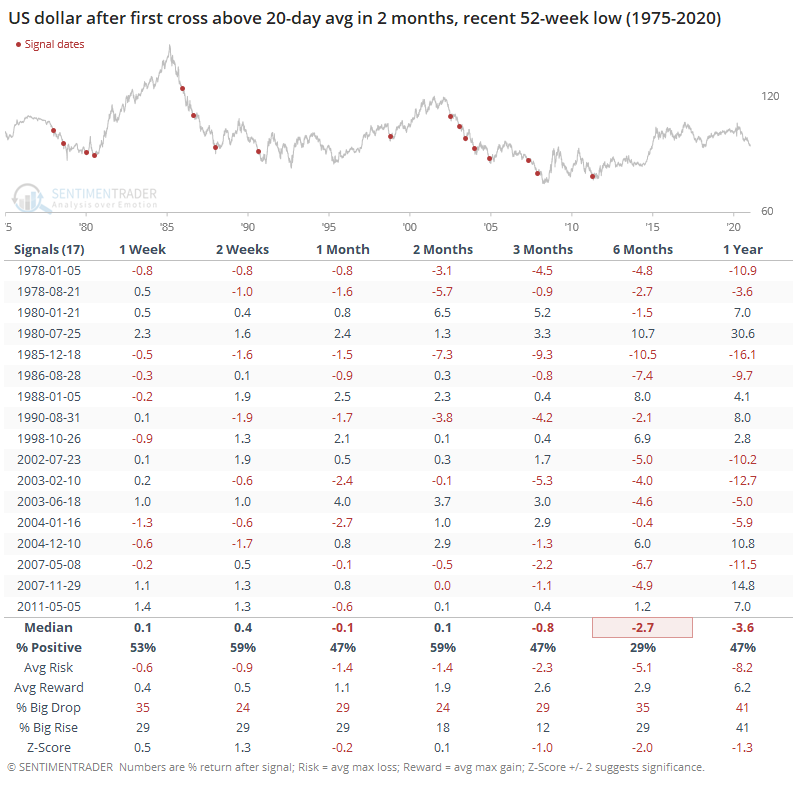
This is the kind of streak the dollar consistently underwent during structural bear markets, with only the last one in the sequence (sometimes) ending up leading to sustained gains. Out of the 17 times when it ended a long streak below its 20-day average, the dollar was higher 6 months later only 5 times.
There is an argument being made now that the dollar will surely rally because there is a massive short base, and the recent spike will cause those investors to cover, driving the dollar still higher. But that was the case in September, too, and as we saw at the time, that kind of argument hasn't been very successful.
It's a tempting argument, with large speculators holding nearly 40% of dollar futures open interest net short, one of their largest positions ever. On a chart, it seems like the extremes tend to line up with turns in the dollar, but charts can be misleading.
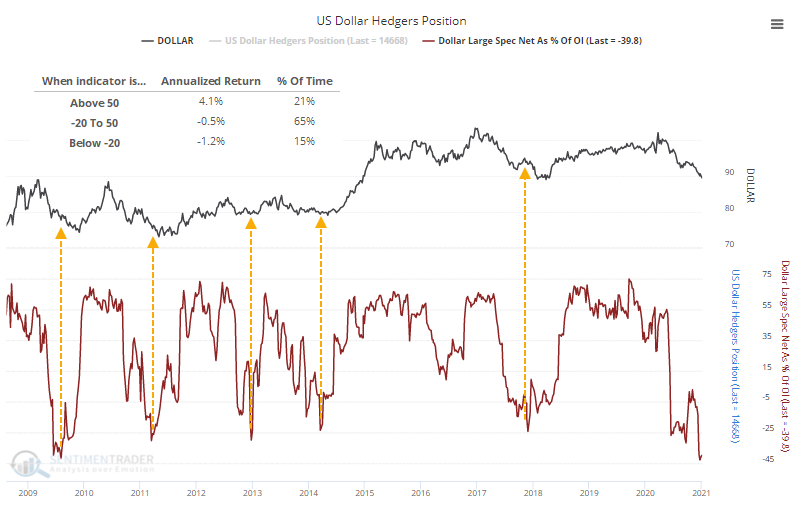
From the chart, we can see that the dollar's annualized return when speculators held more than 20% of open interest net short was -1.2%. Returns were significantly higher when speculators were net long a large share of open interest. This is the opposite of what we see in most other contracts.
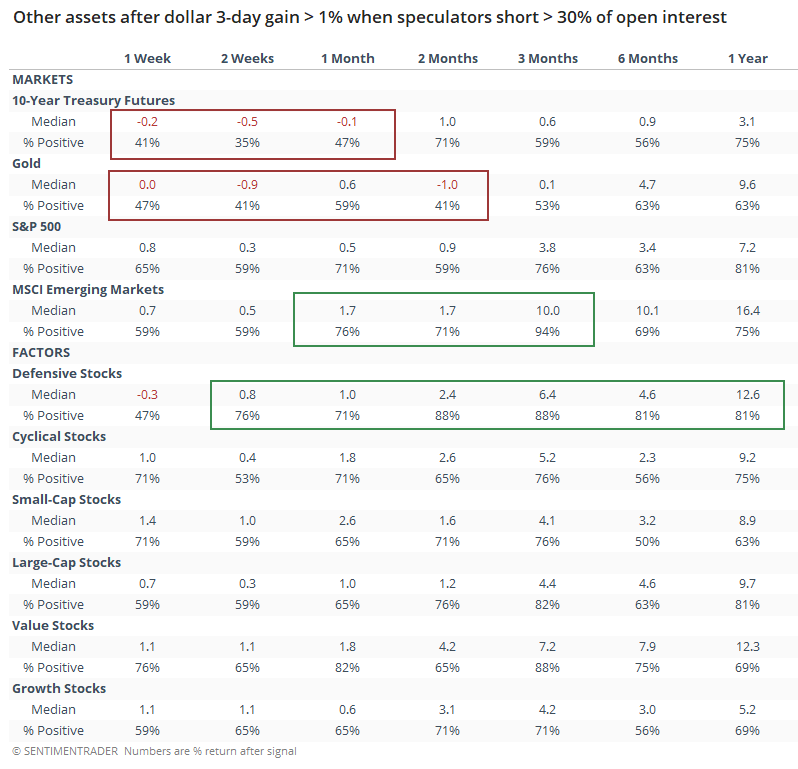
Let's go with the argument that the dollar's recent jump is going to ignite a massive short-covering rally. The table below shows all 3-day rallies of more than1% when speculators were holding at least 30% of dollar contracts net short.
Again, this is the kind of behavior that has triggered during structural bear markets, not bull markets. While the buck did manage to add to its gains over the short-term most of the time, those gains tended to prove fleeting.
For what it's worth, it was a better sign for emerging market stocks, which were higher 94% of the time over the next 3 months. This is not what dollar bulls would expect.
Every time we've looked at rallies, or potential inflection points due to extremes, over the past year, the evidence has suggested that failure was more likely than success. Extremes in the dollar have not been good indications of positive forward returns, nor have short-term rallies. There is still little hard evidence that the nascent rally in the buck is likely the beginning of a sustained advance.
Active Studies
| Time Frame | Bullish | Bearish | | Short-Term | 0 | 0 | | Medium-Term | 2 | 1 | | Long-Term | 14 | 2 |
|
Indicators at Extremes
Portfolio
| Position | Description | Weight % | Added / Reduced | Date | | Stocks | 10.6% VWO, 10.1% XLE, 8.5% RSP, 8.3% PSCE | 37.5 | Added 3% | 2021-01-05 | | Bonds | 10% BND, 10% SCHP, 10% ANGL | 27.8 | Reduced 0.1% | 2020-10-02 | | Commodities | GCC | 2.3 | Reduced 2.1%
| 2020-09-04 | | Precious Metals | GDX | 9.8 | Added 4.8% | 2020-12-01 | | Special Situations | | 0.0 | Reduced 5% | 2020-10-02 | | Cash | | 22.6 | | |
|
Updates (Changes made today are underlined)
There hasn't been much that changed in recent weeks, with sky-high sentiment on many measures receding a bit, but that's not necessarily a good sign, just ask February 2020. We still have the lingering positives from all the breadth thrust last year, as late as October and November. Those have a very good historical record at preceding higher prices over a longer time frame. Of more immediate concern is the explosion in speculation in the most leveraged parts of the market. So far, that hasn't translated to price troubles, though there have been more oddities n the latter half of December than we'd seen since August, like the major indexes rising but on very poor breadth. I continue to avoid tech- and cap-heavy indexes, and don't see that changing any time soon. Energy stocks are doing what they should, and I added a bit more there. I'm not a momentum trader and do not focus on pyramiding positions in this account - it's more about protecting capital - but I like the setup on a long-term time frame. RETURN YTD: 3.9% 2020: 8.1%, 2019: 12.6%, 2018: 0.6%, 2017: 3.8%, 2016: 17.1%, 2015: 9.2%, 2014: 14.5%, 2013: 2.2%, 2012: 10.8%, 2011: 16.5%, 2010: 15.3%, 2009: 23.9%, 2008: 16.2%, 2007: 7.8%
|
|
Phase Table
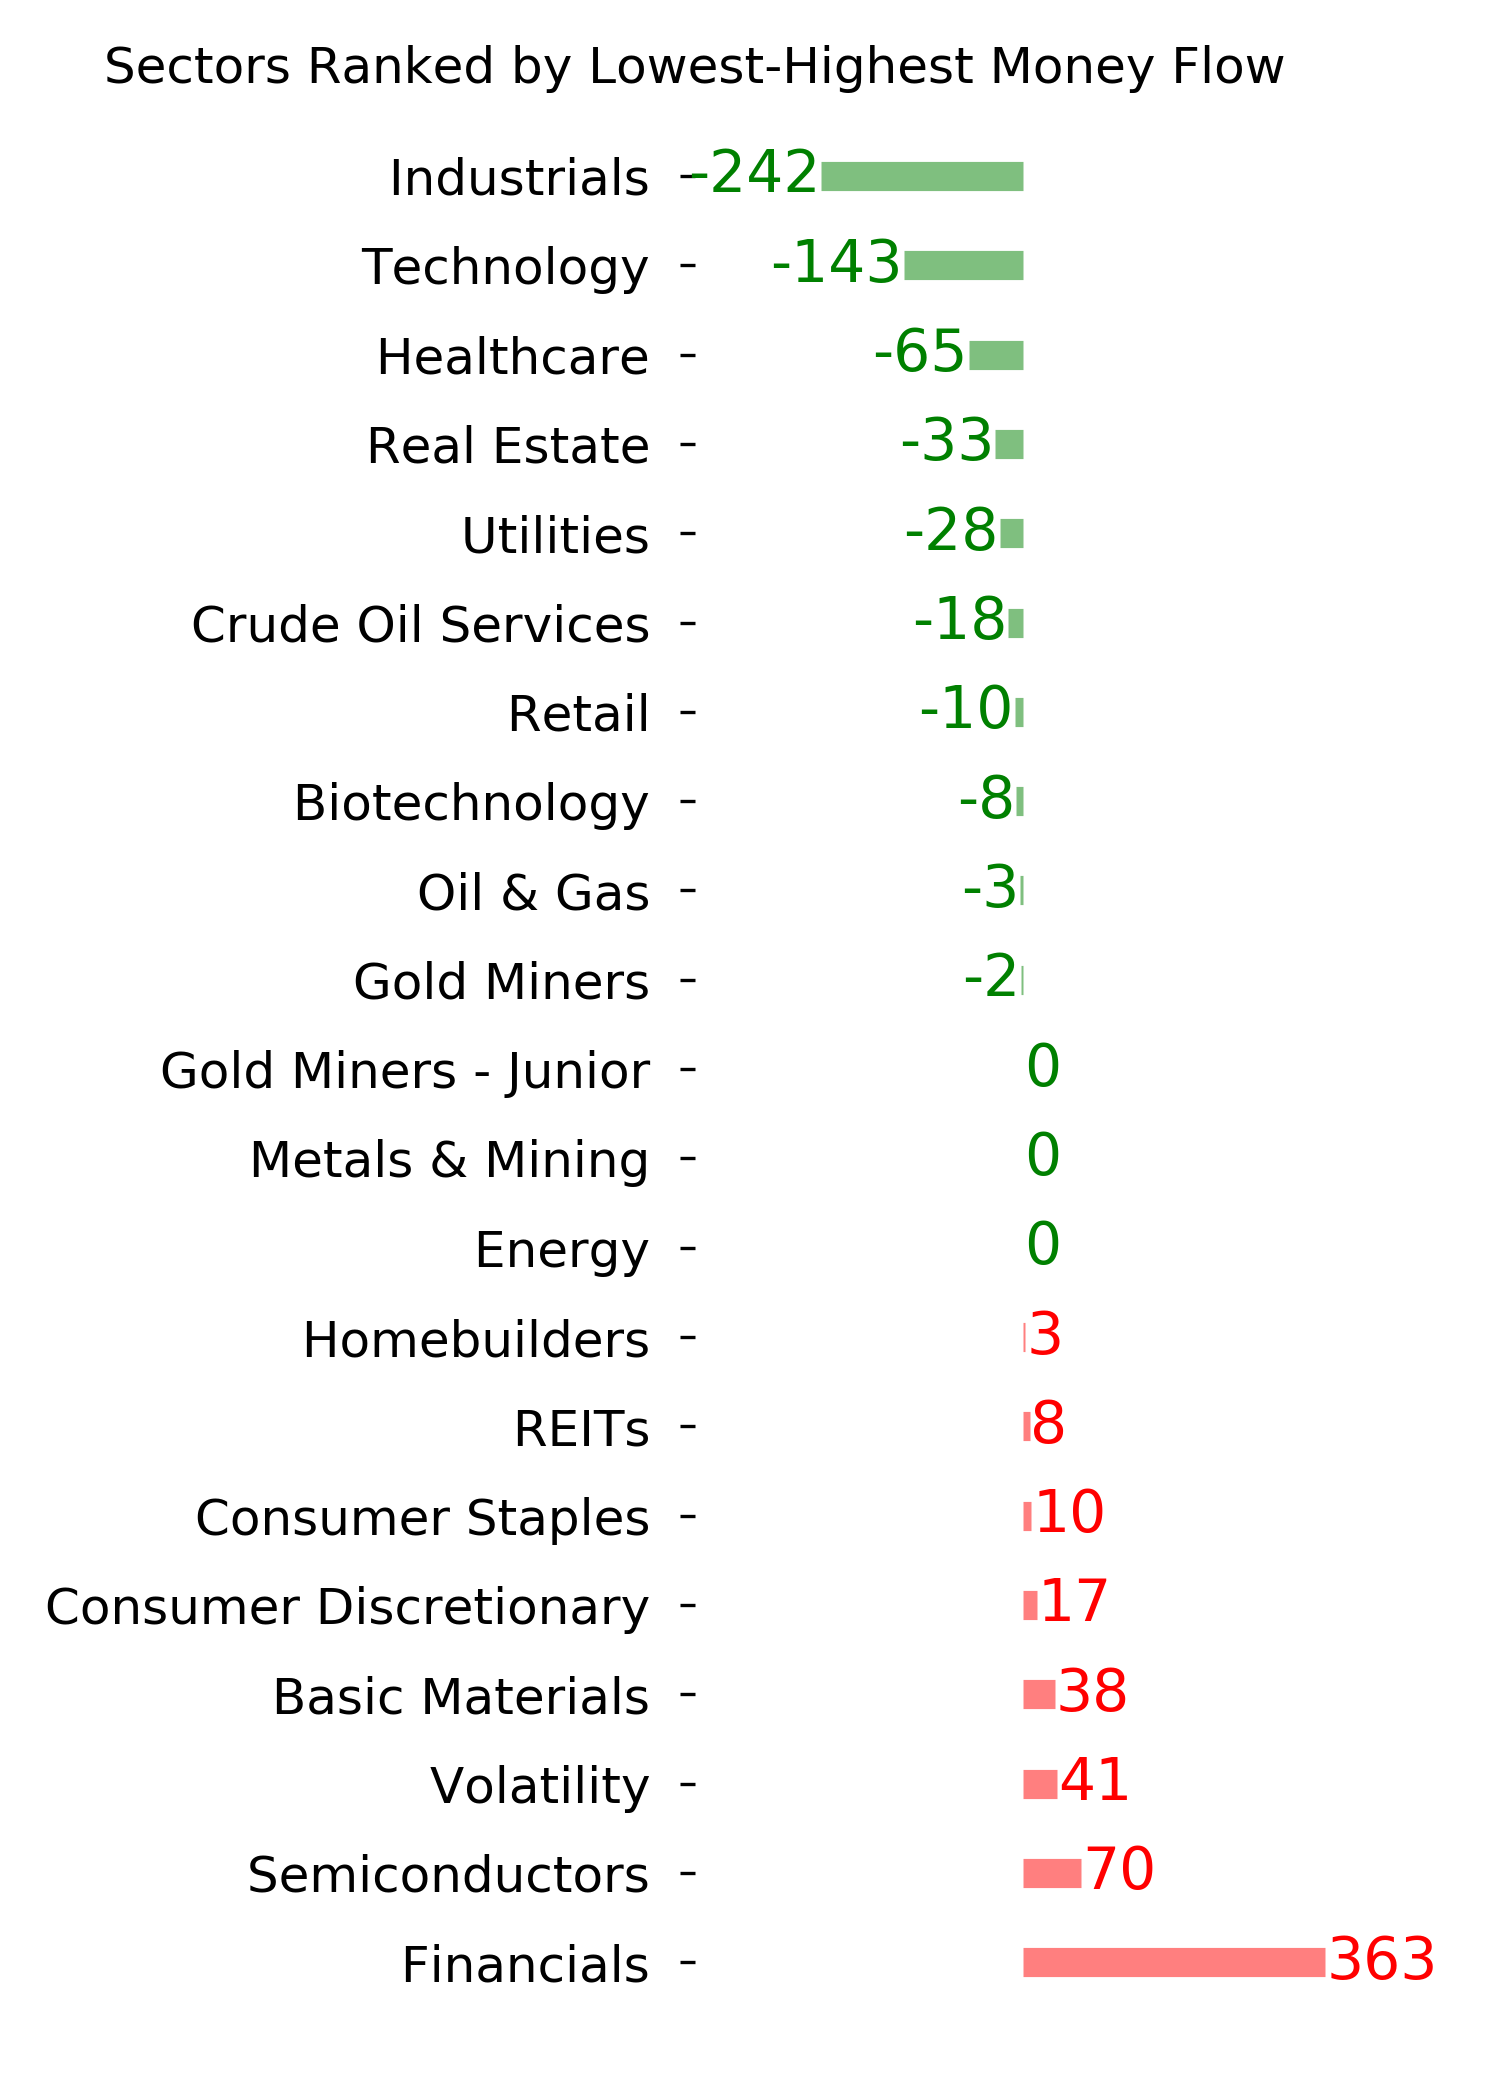
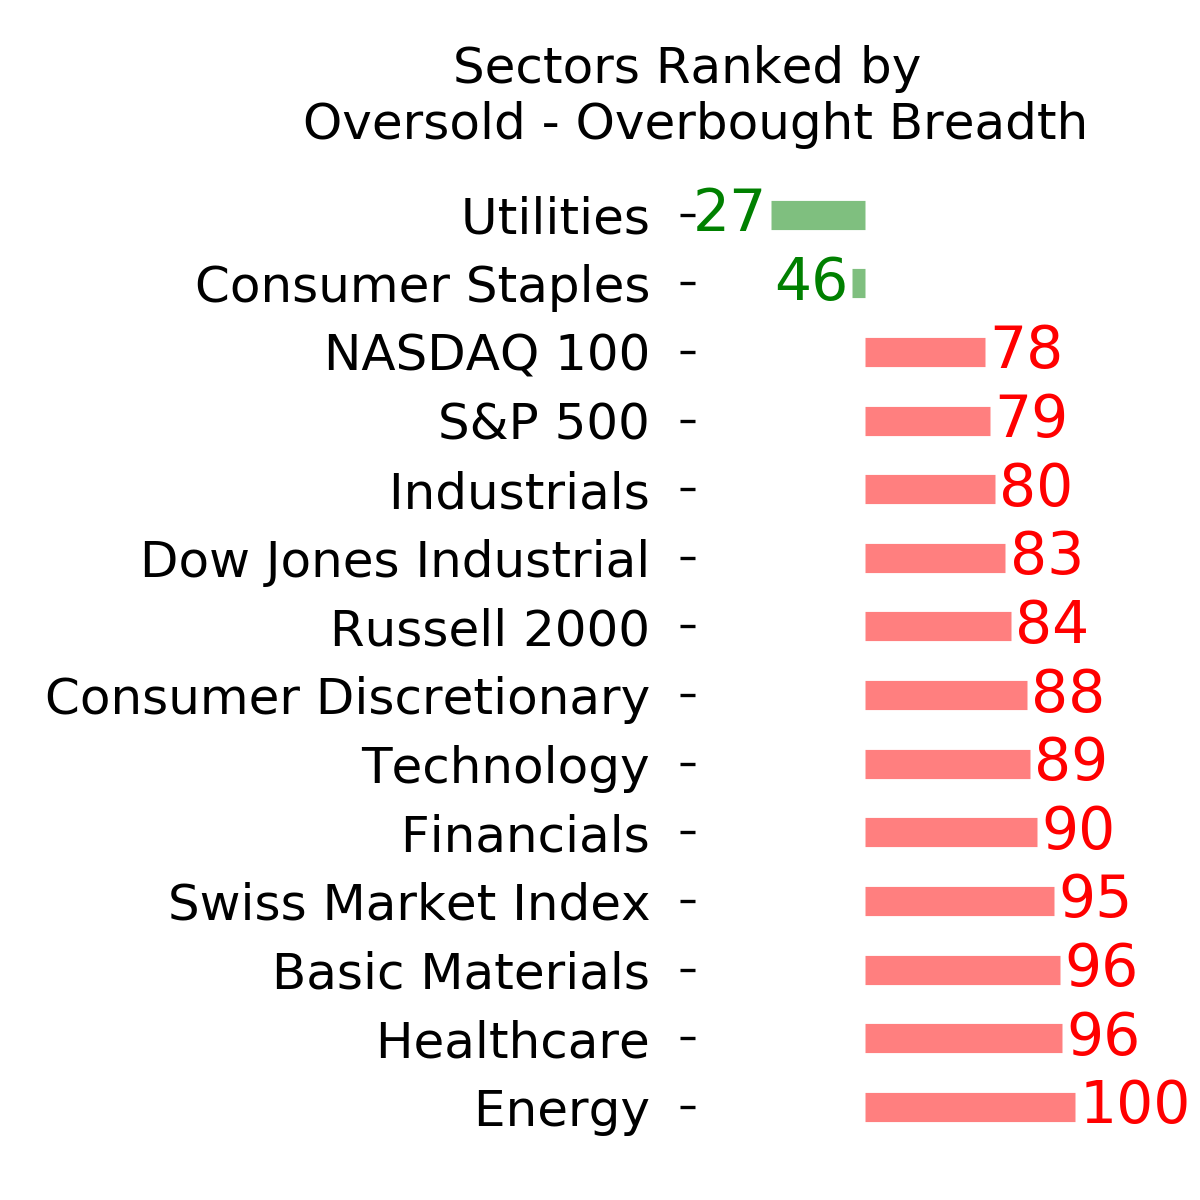
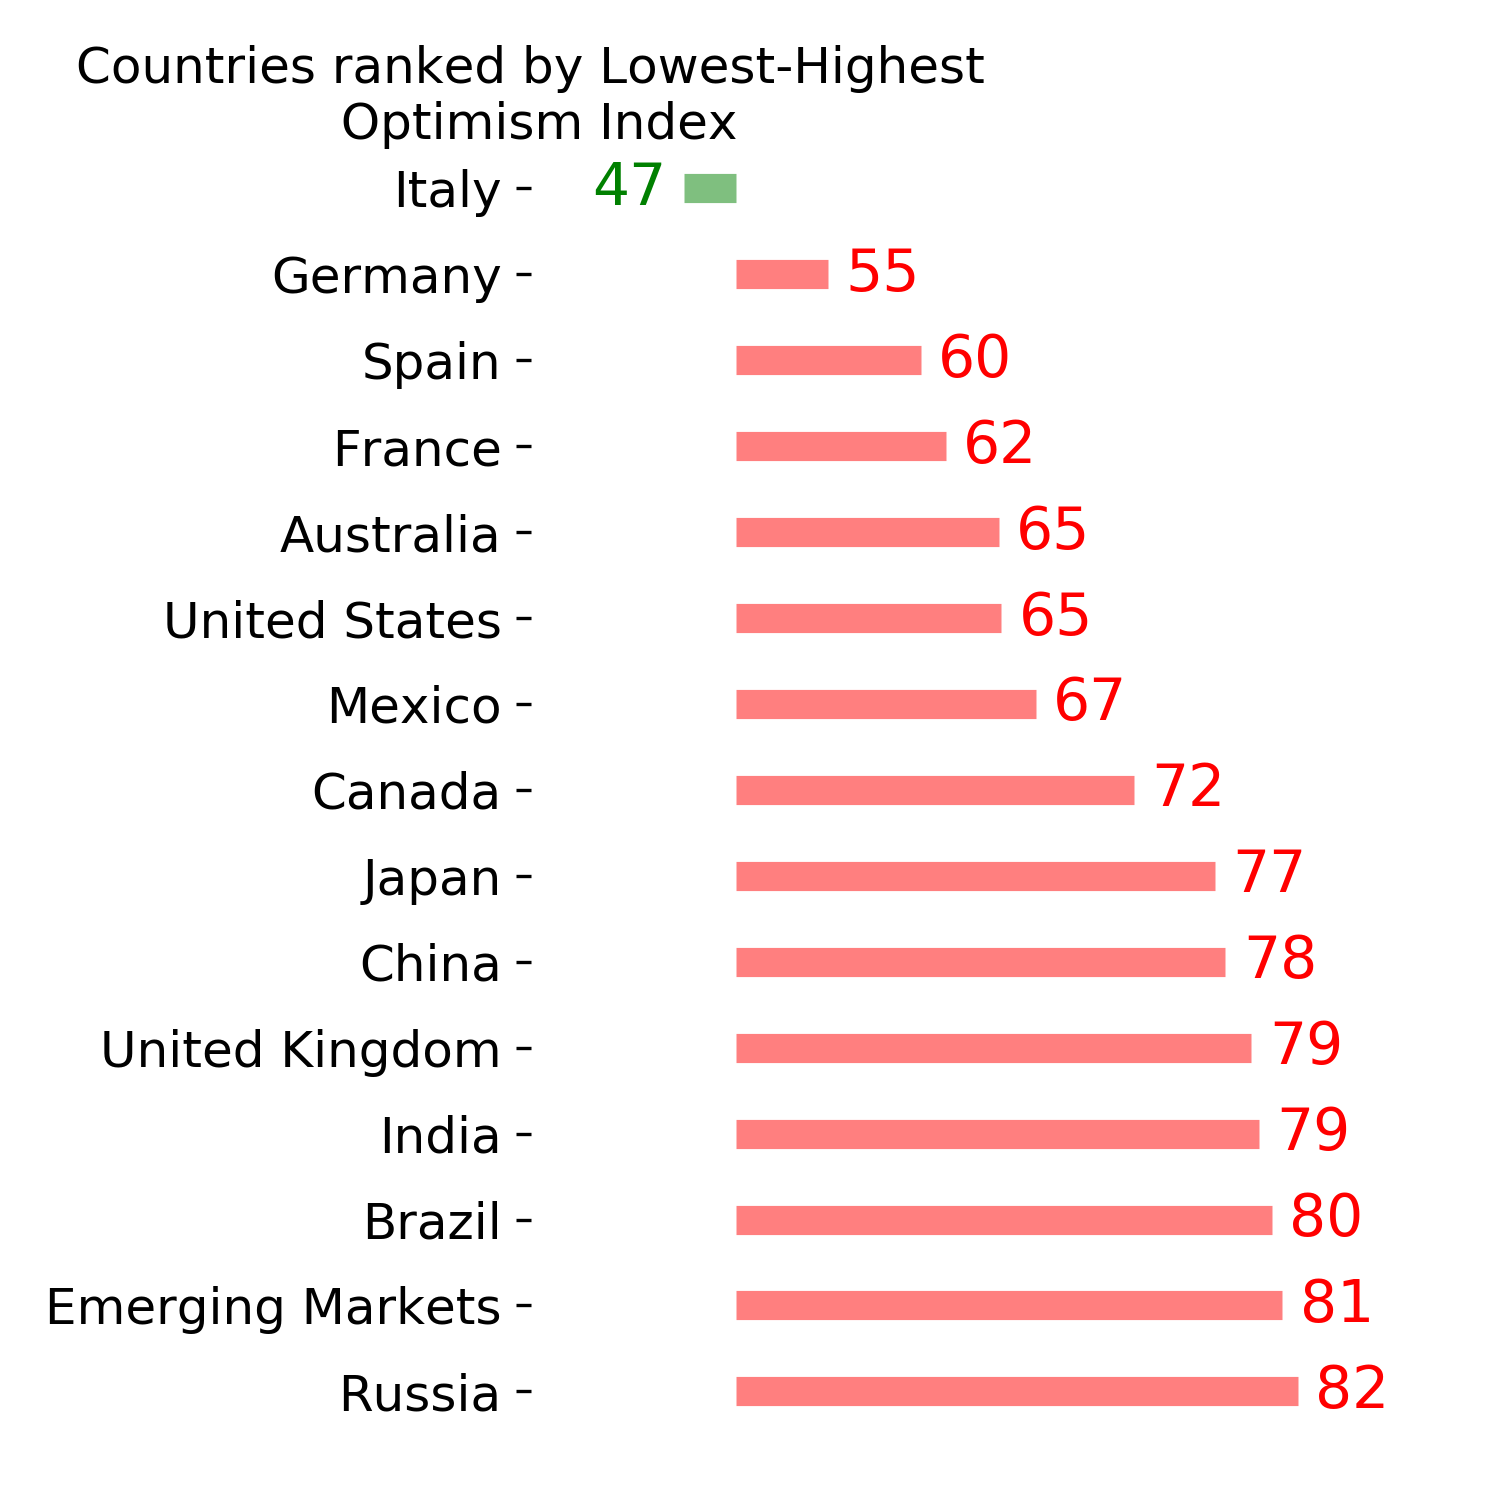
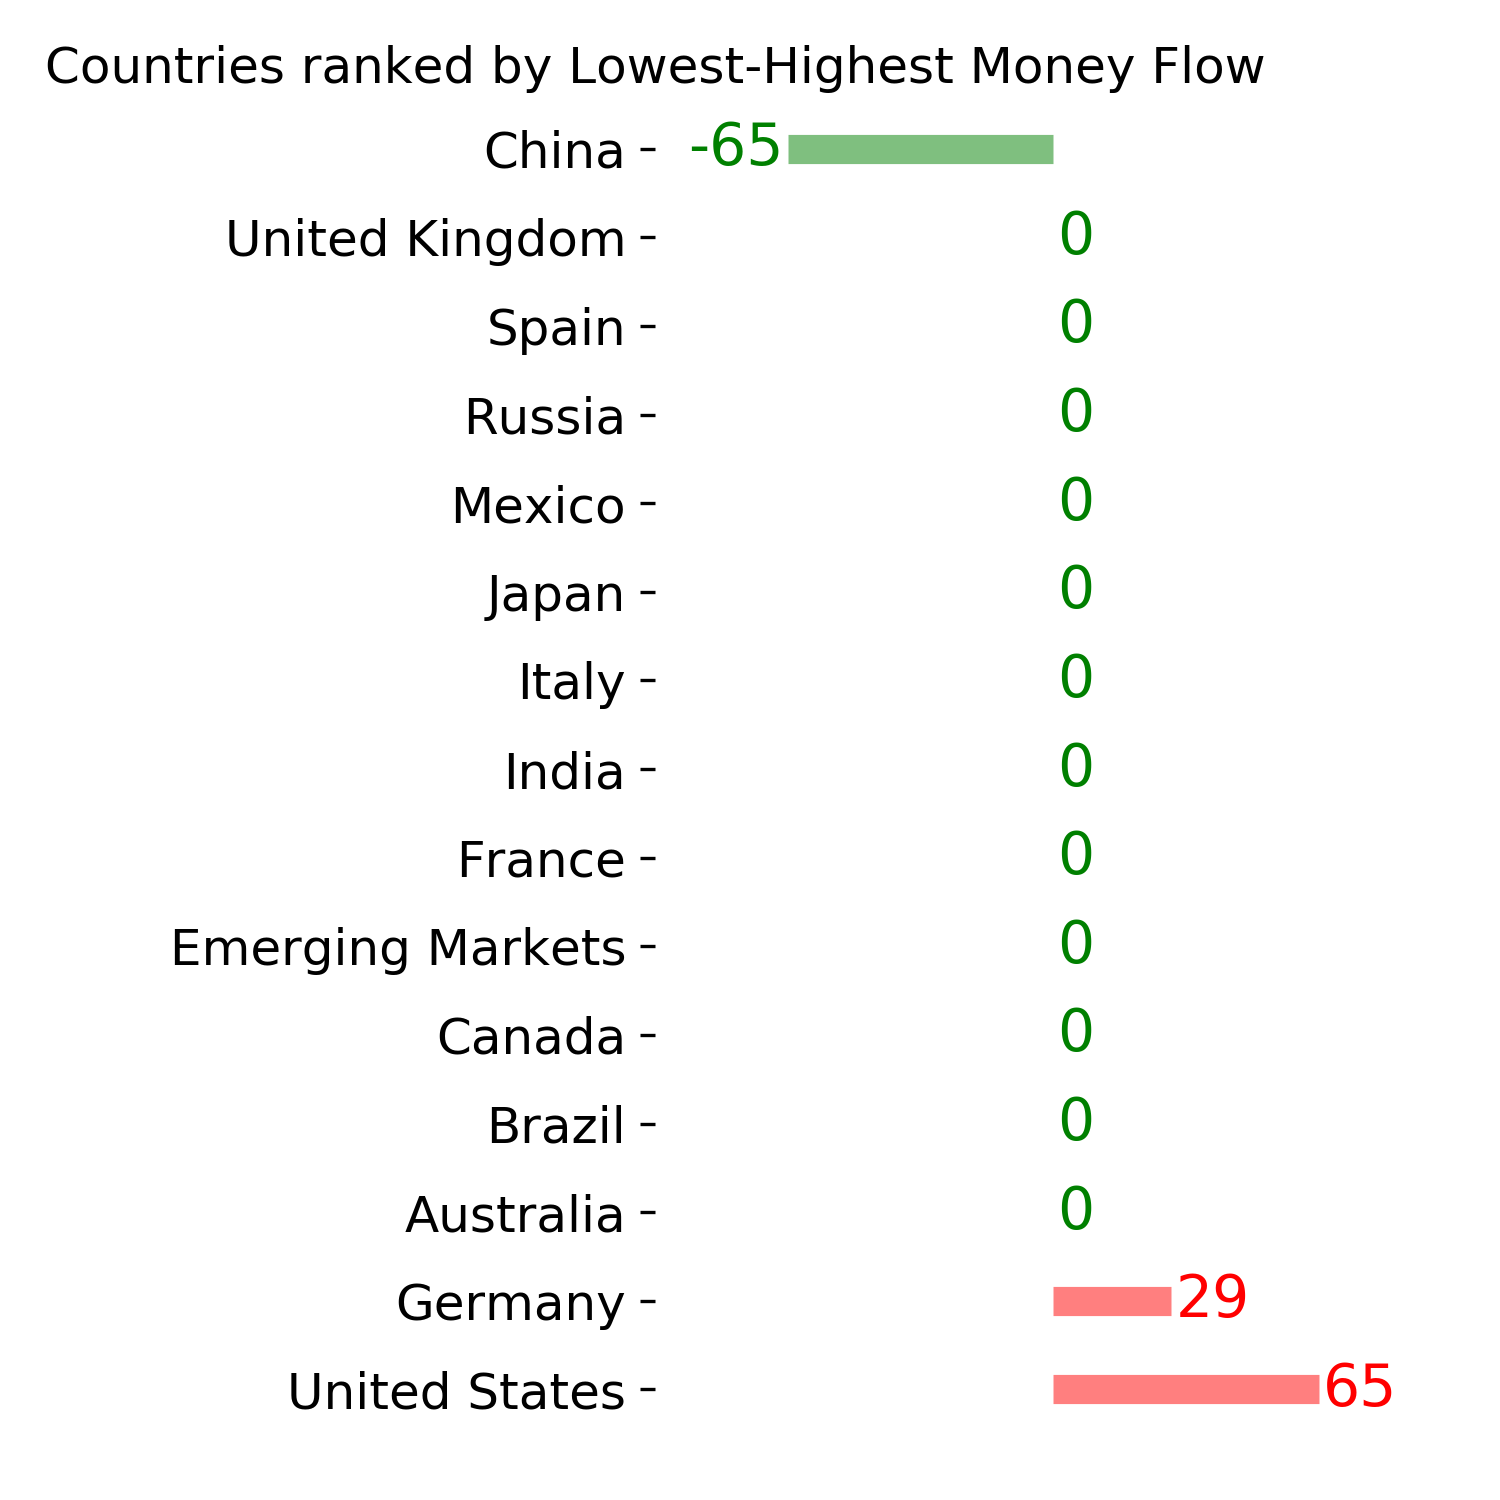
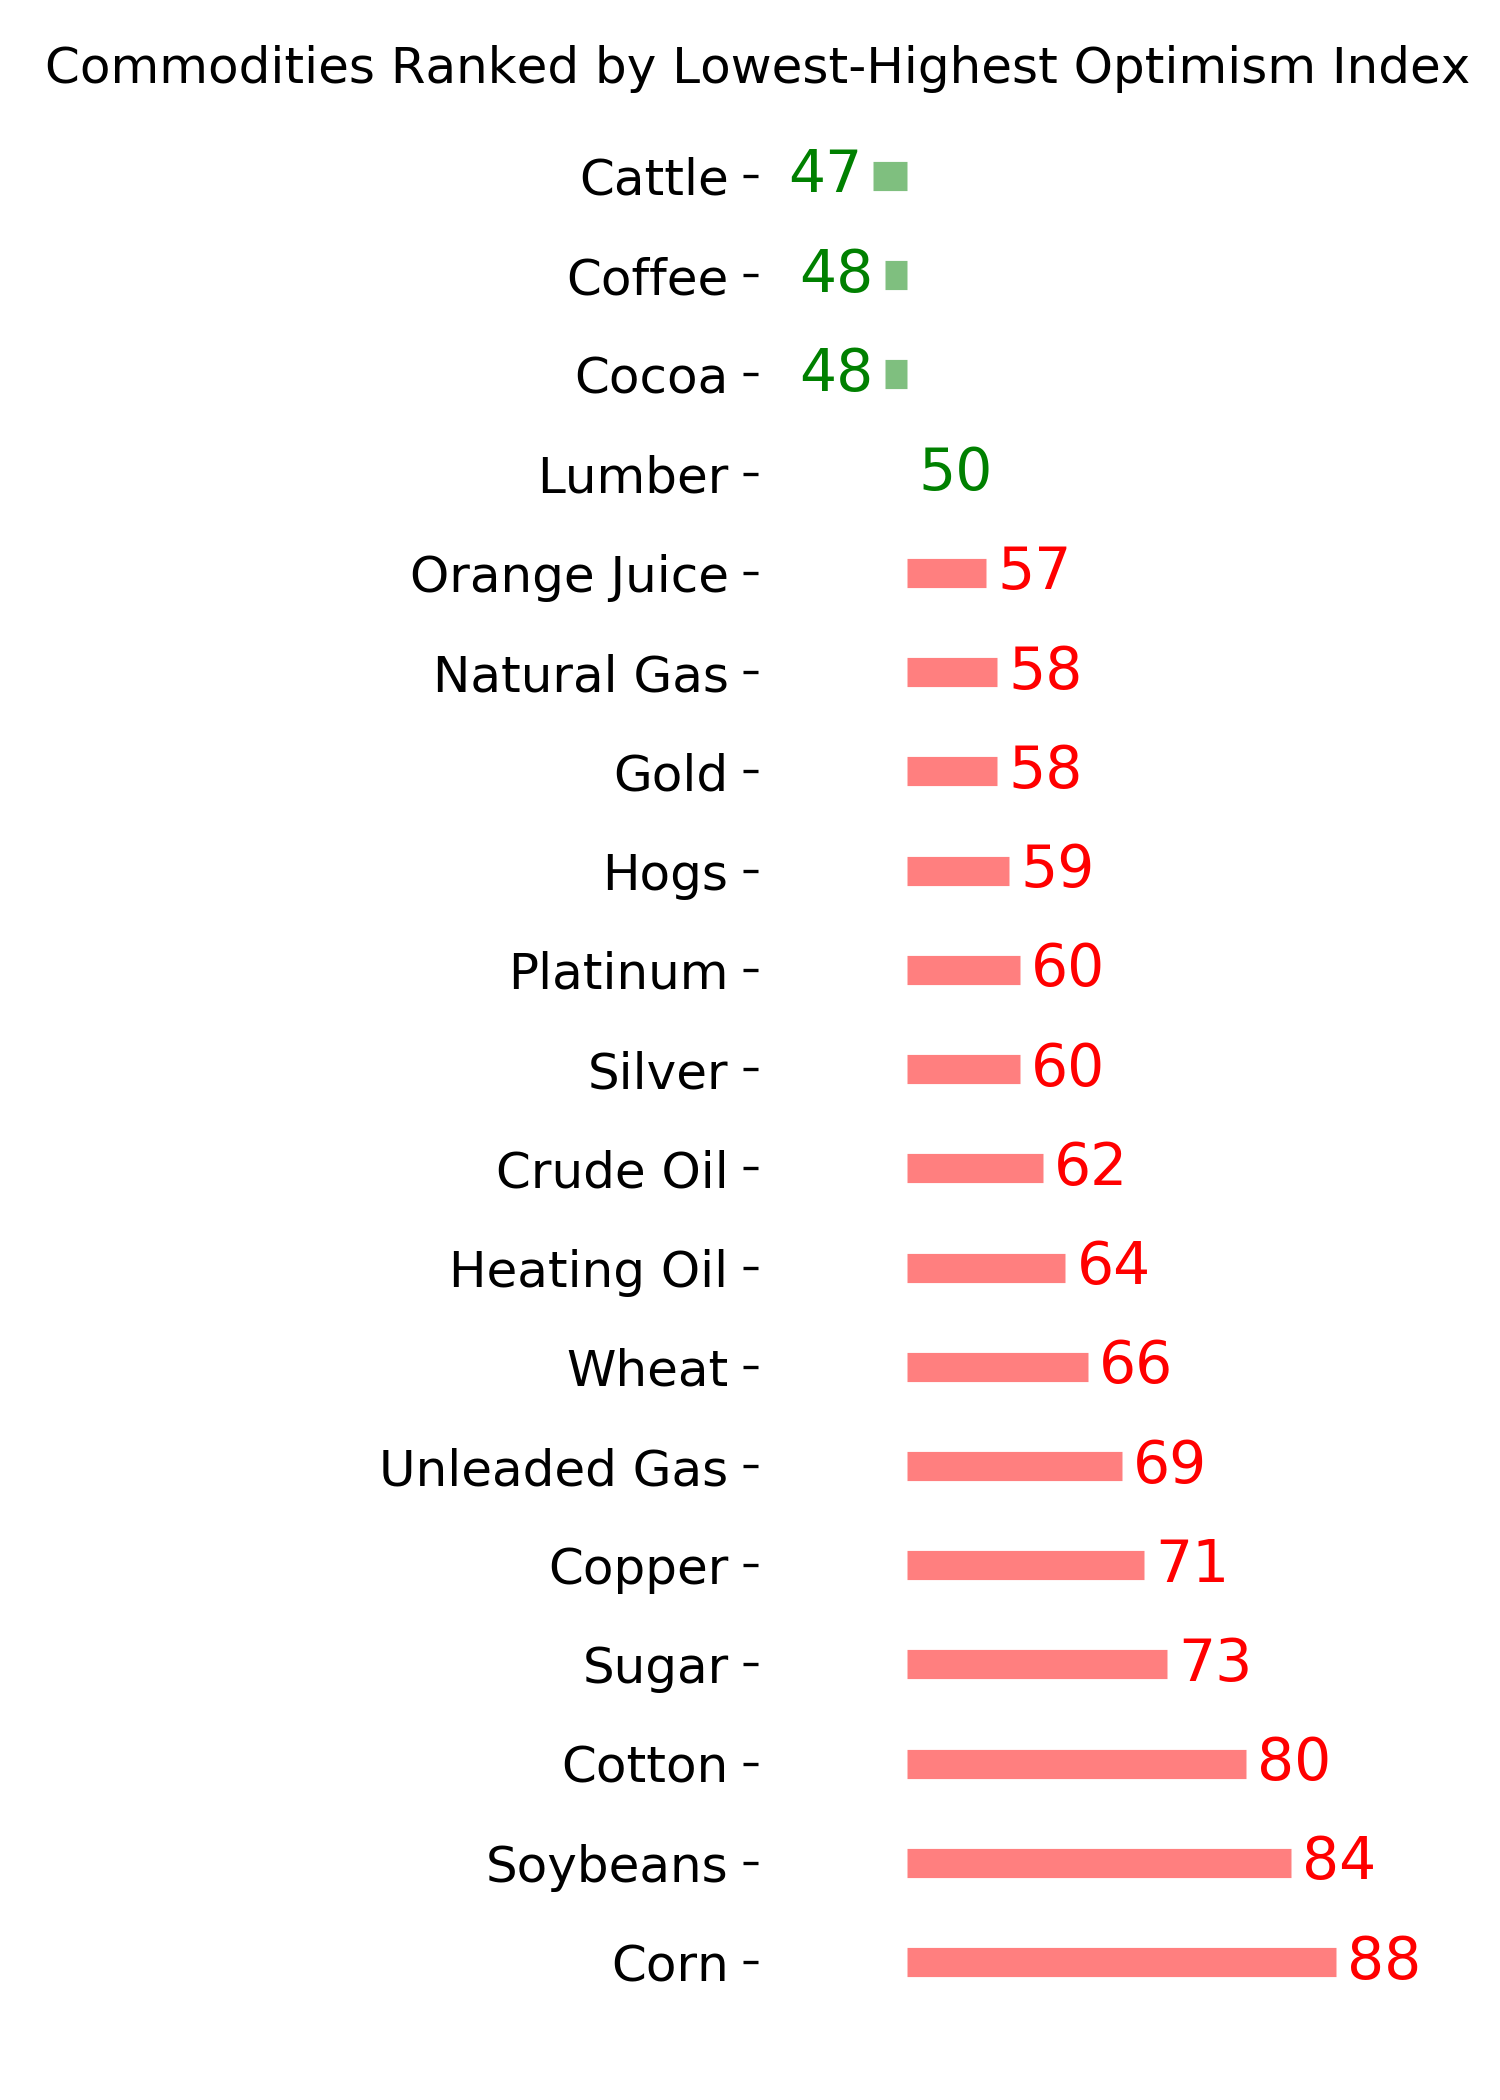
Ranks
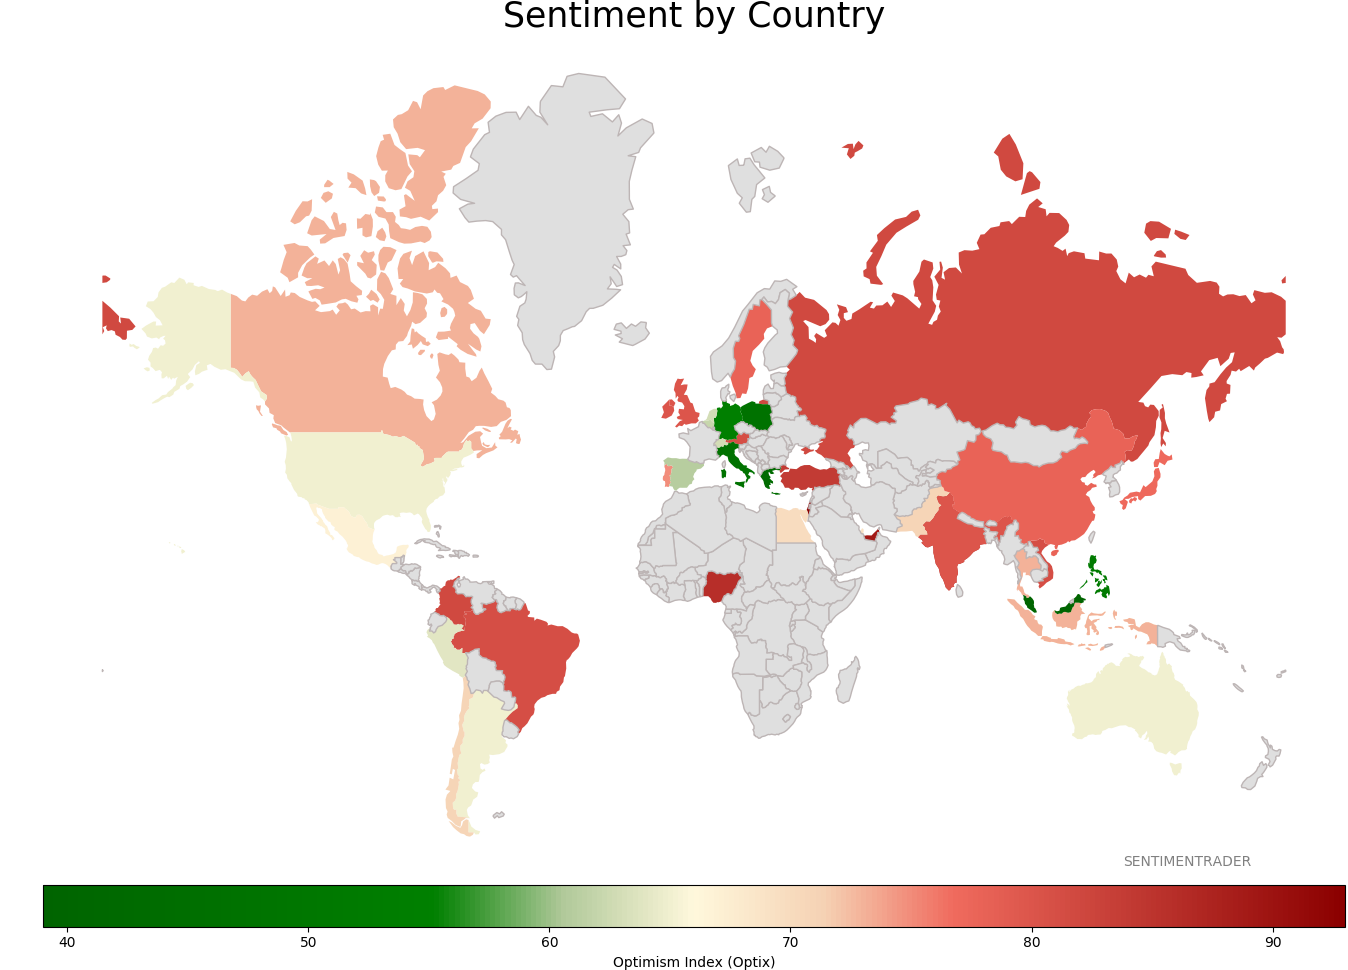
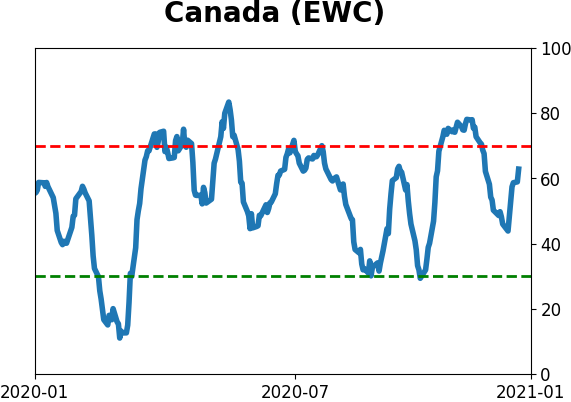
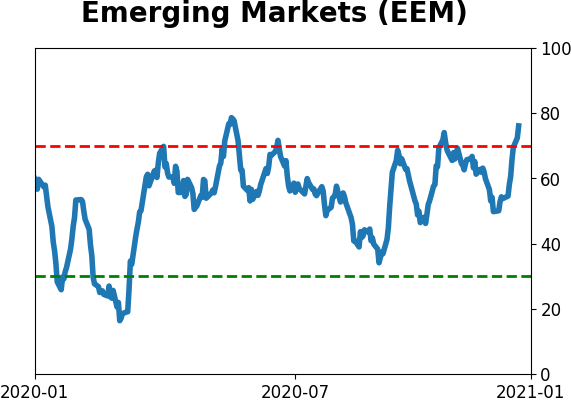
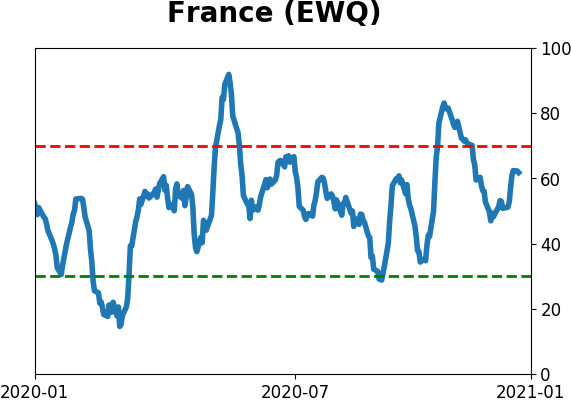
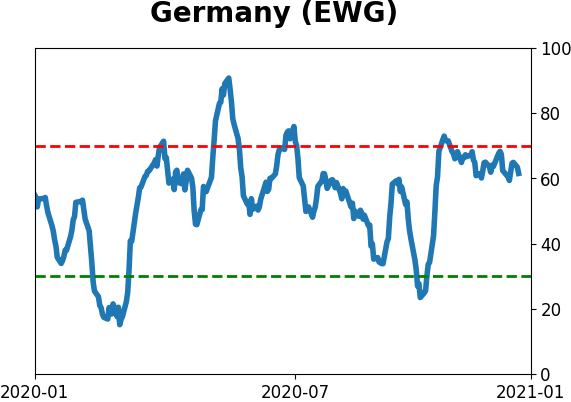
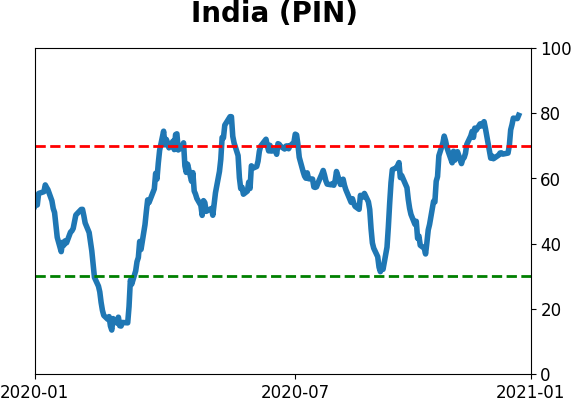
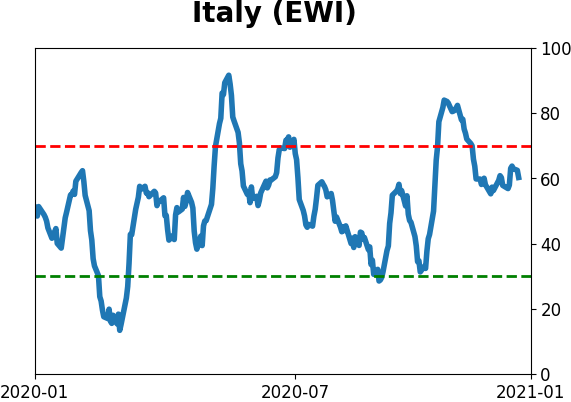
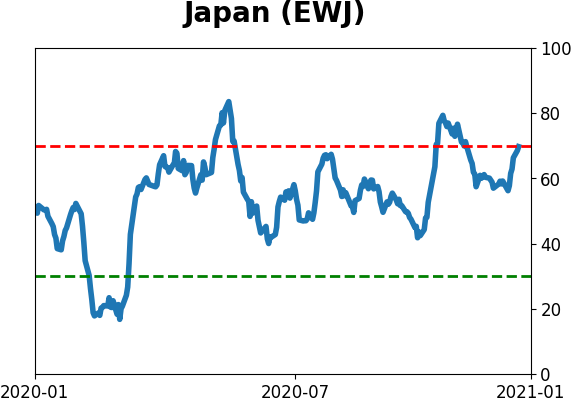
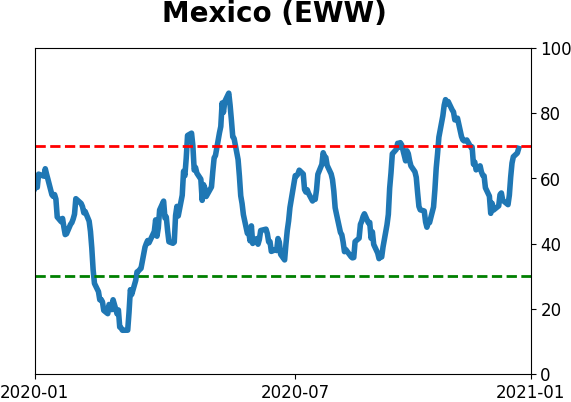
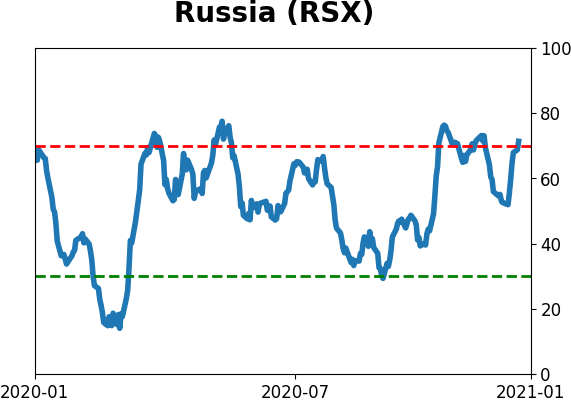
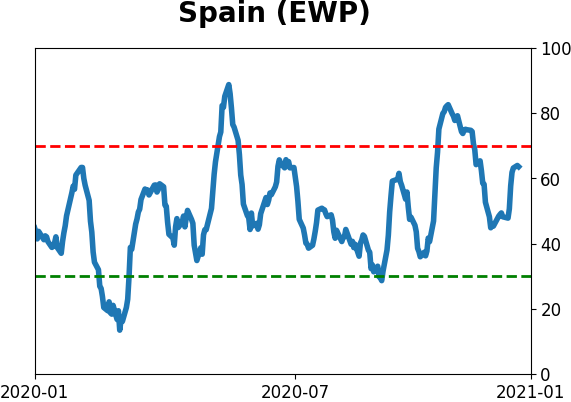
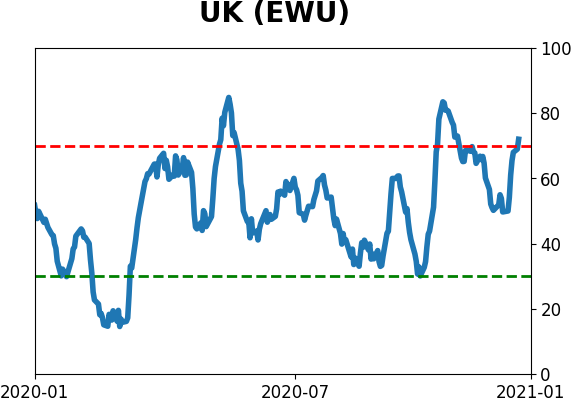
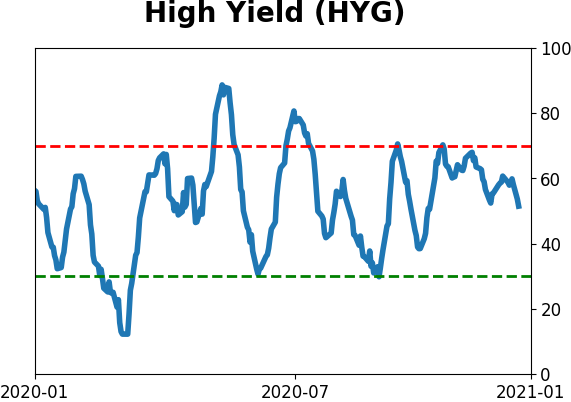
Sentiment Around The World
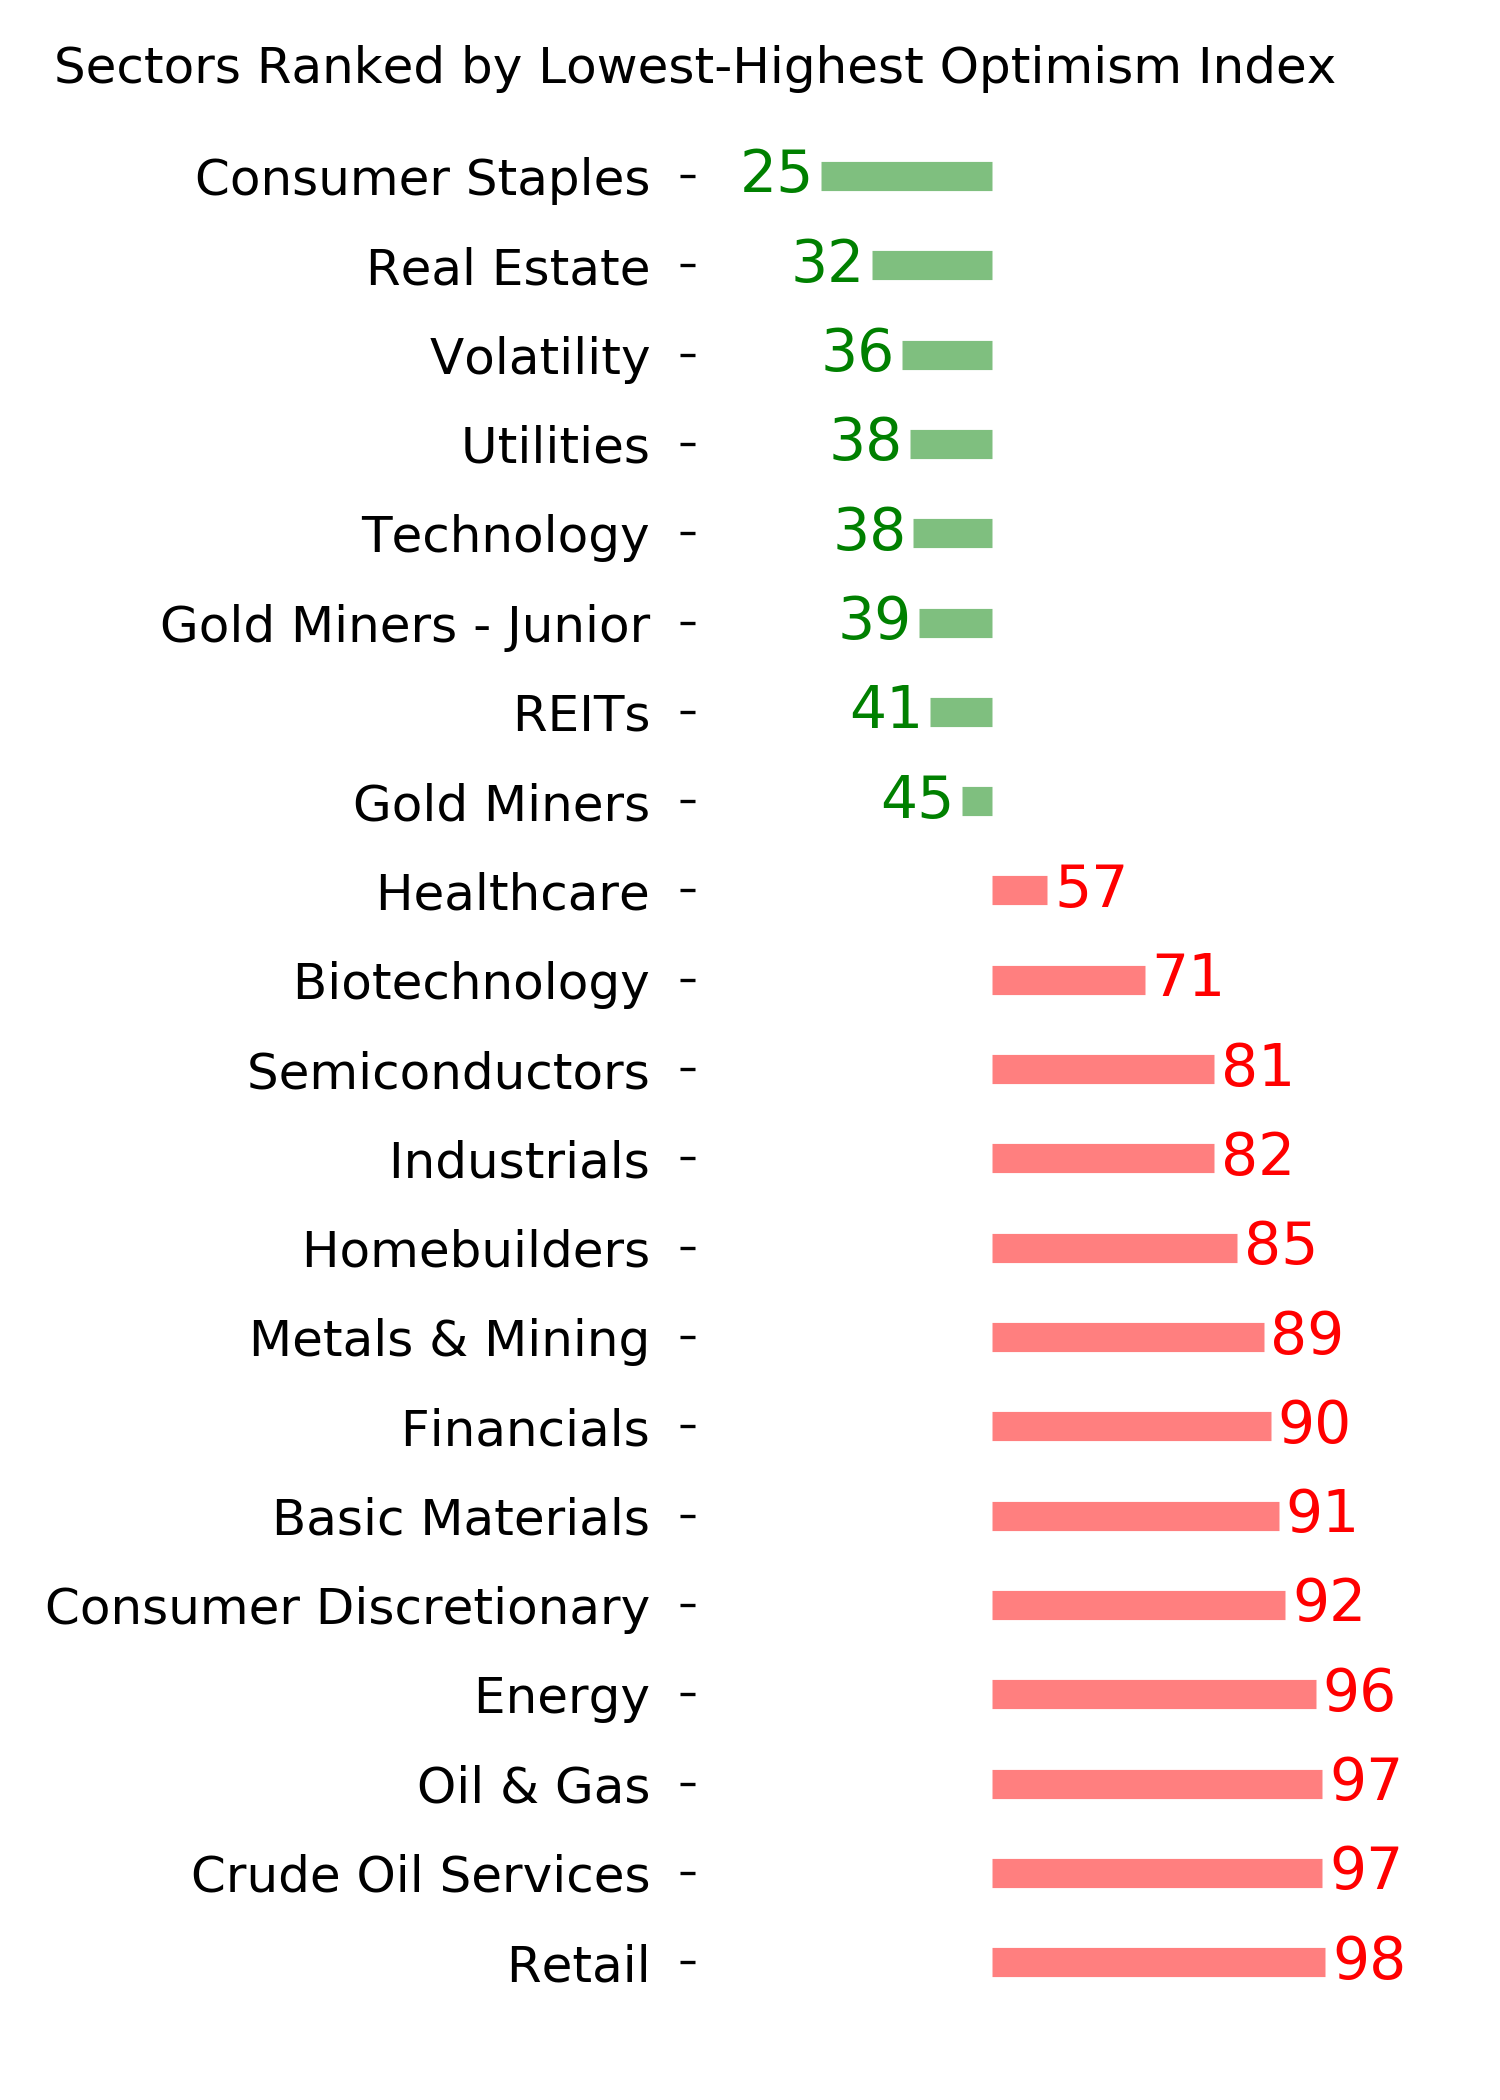
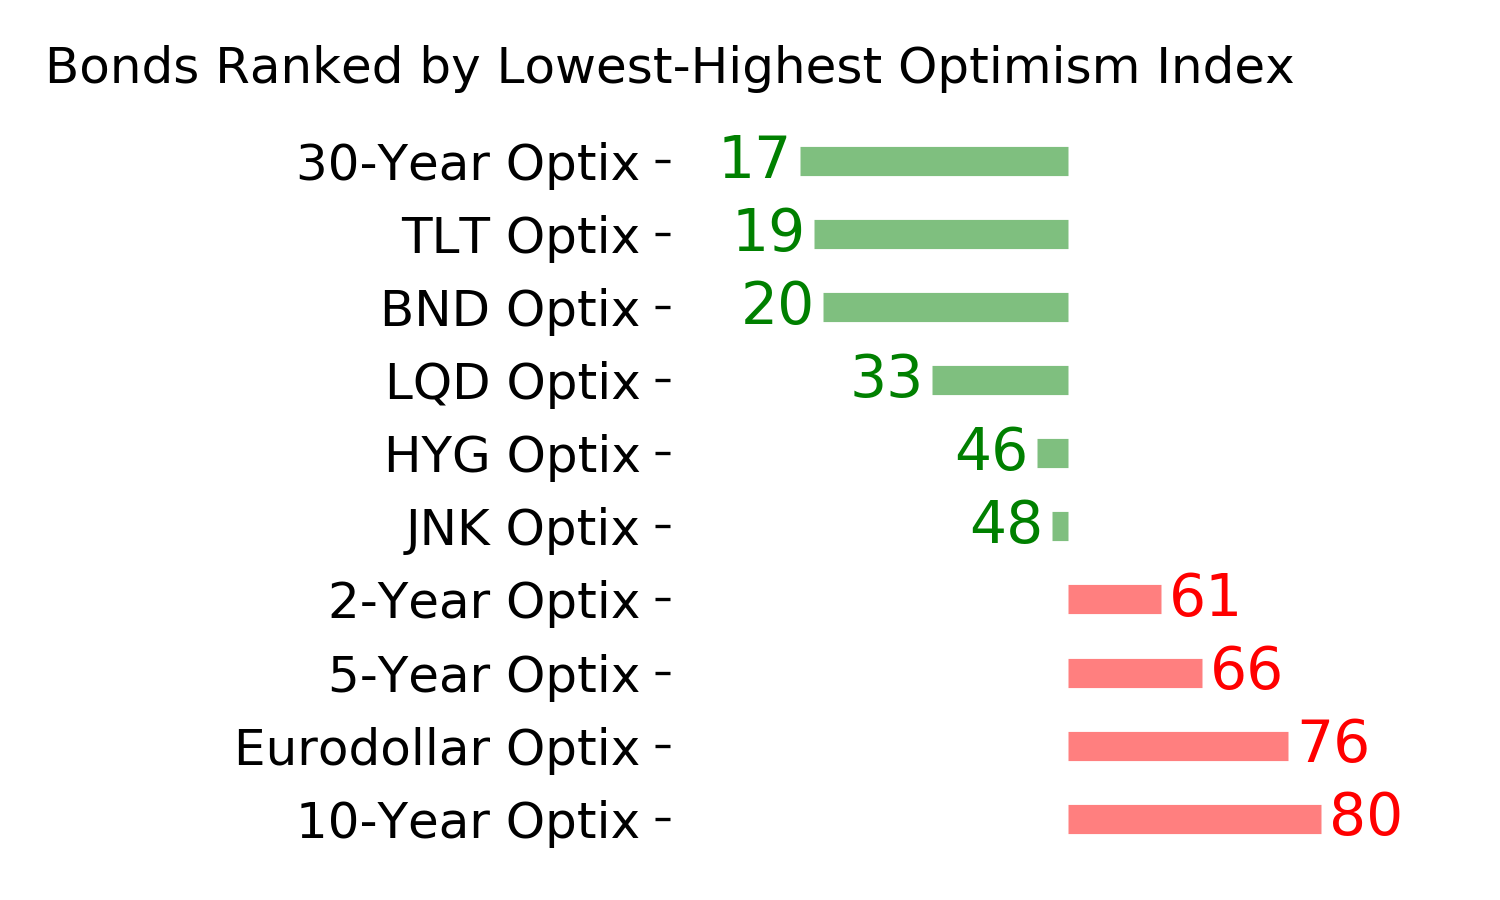
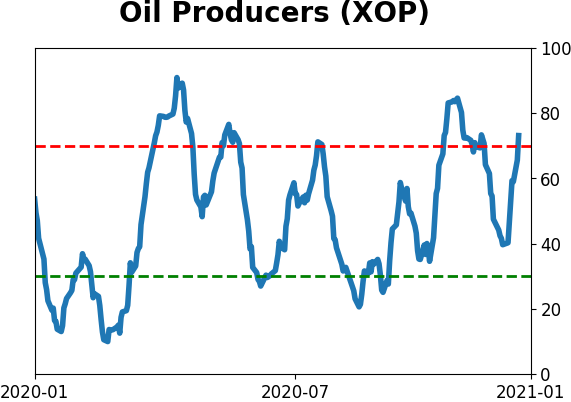
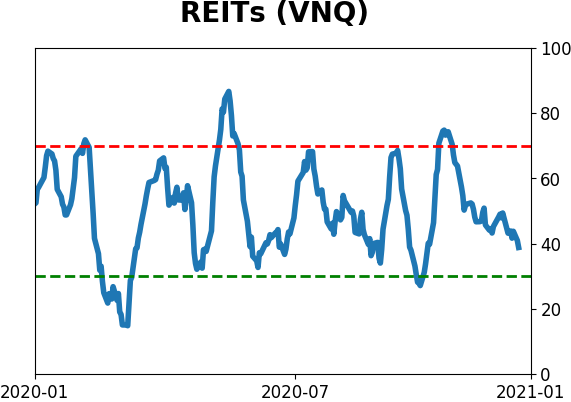
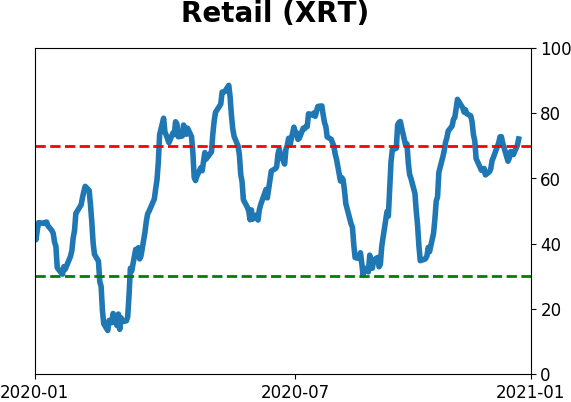
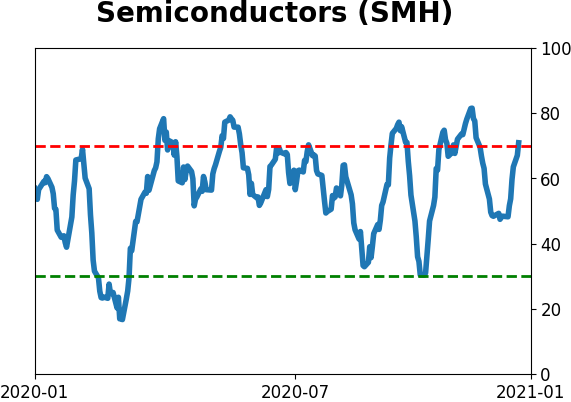
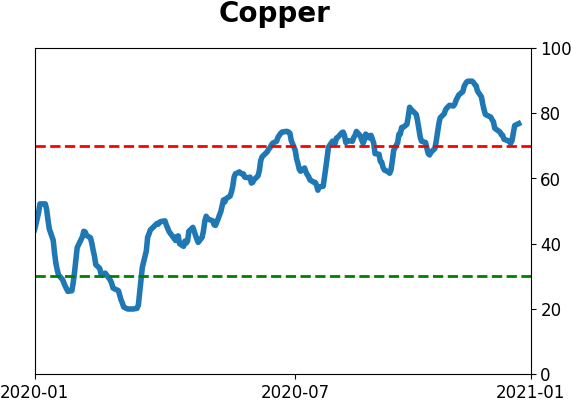
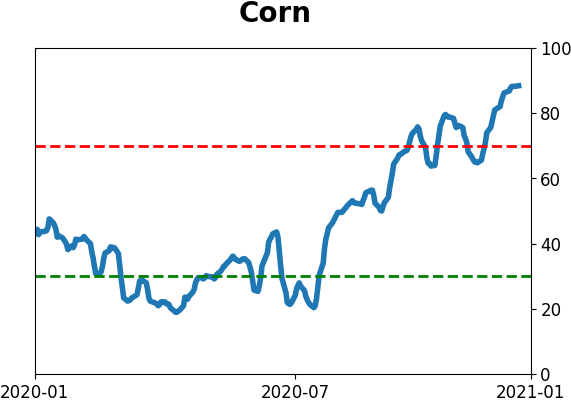
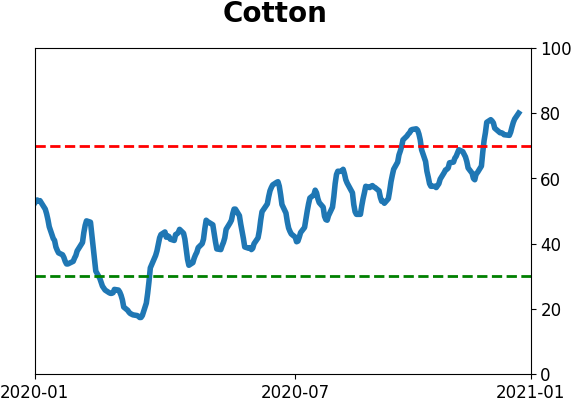
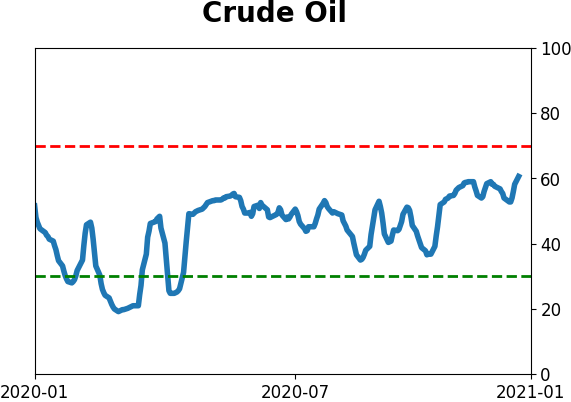
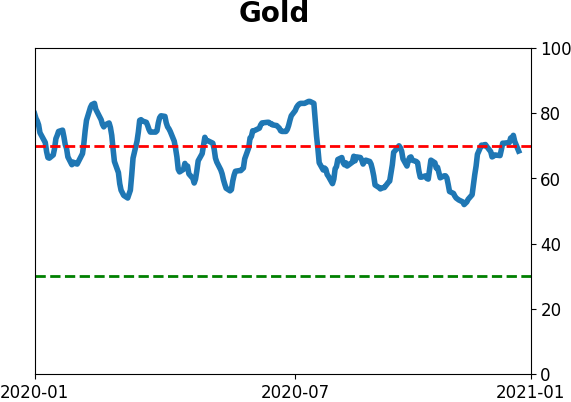
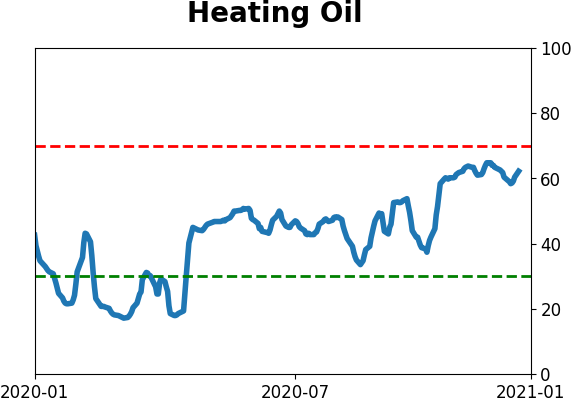
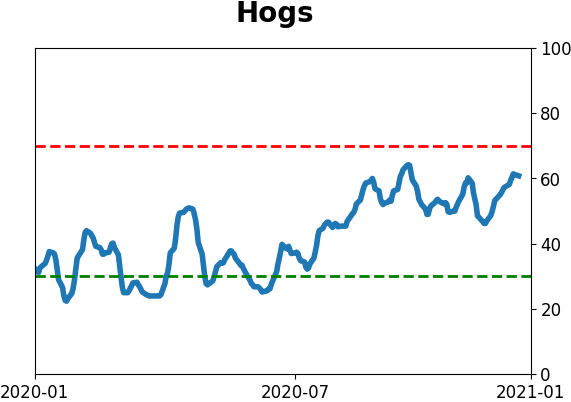
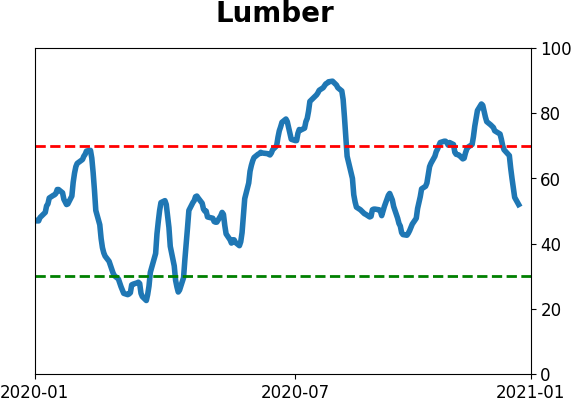
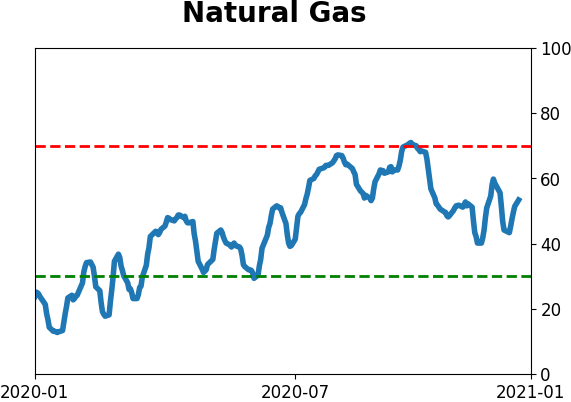
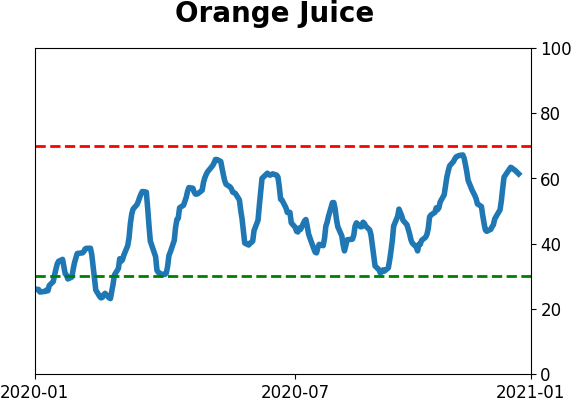
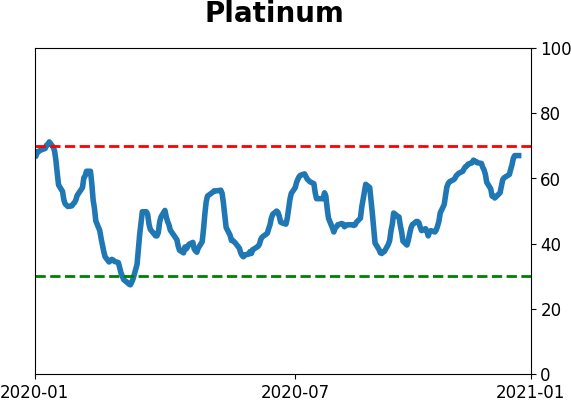
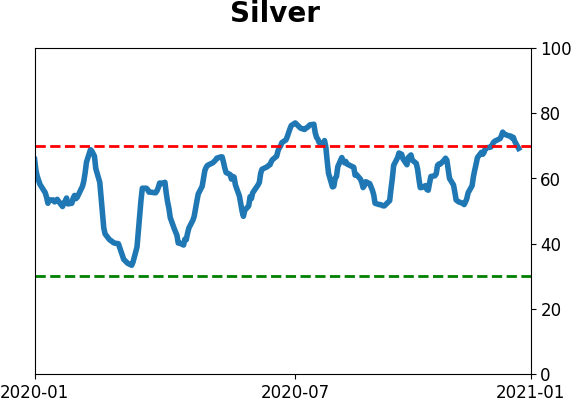
Optimism Index Thumbnails
|
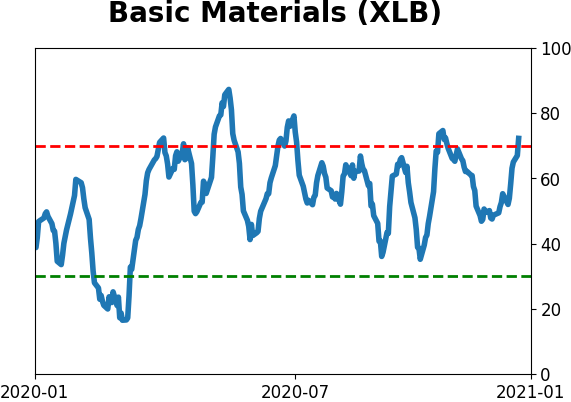
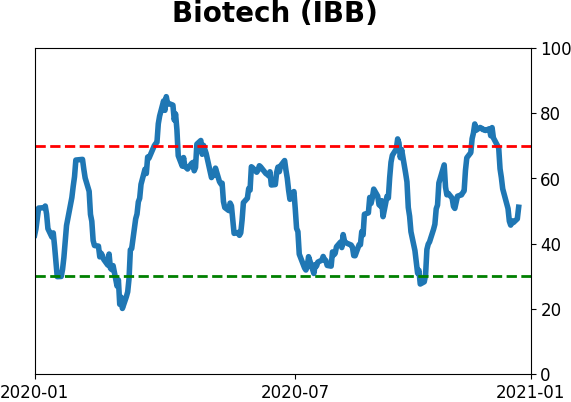
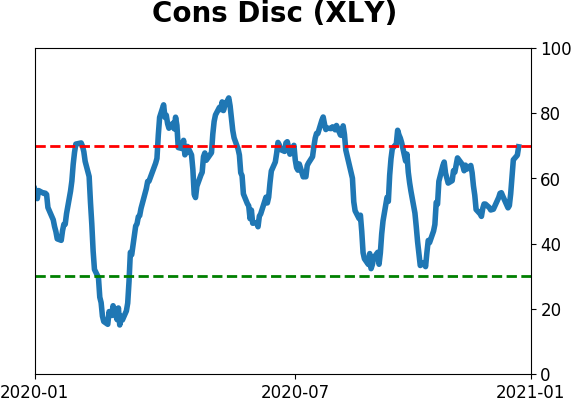
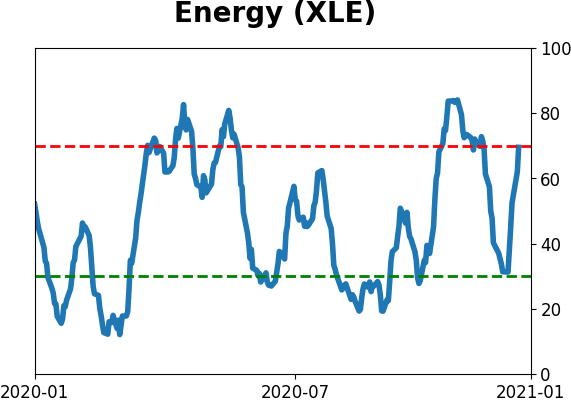
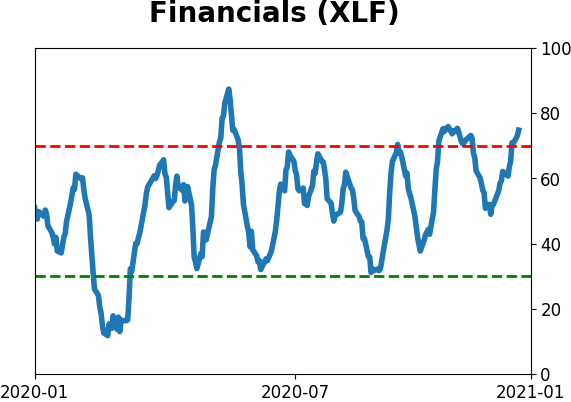
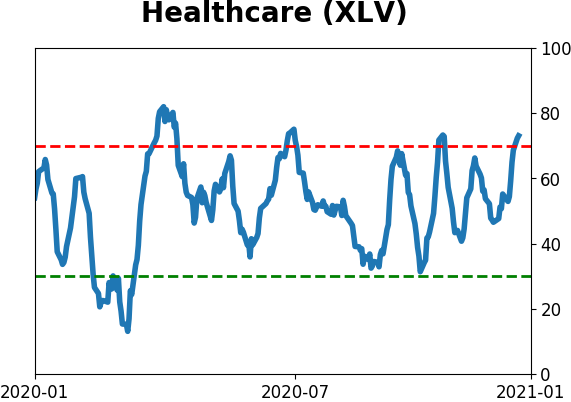
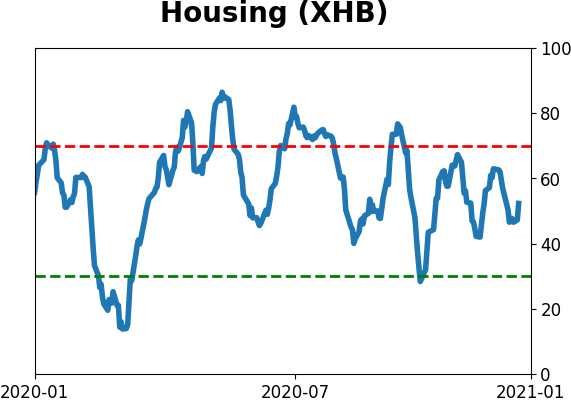
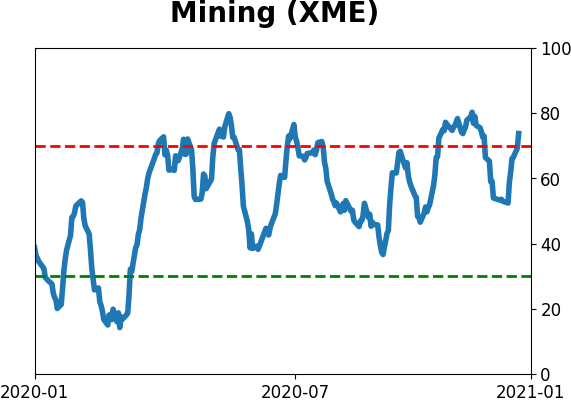
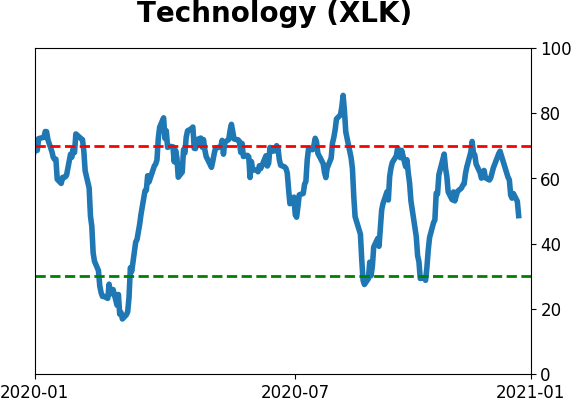
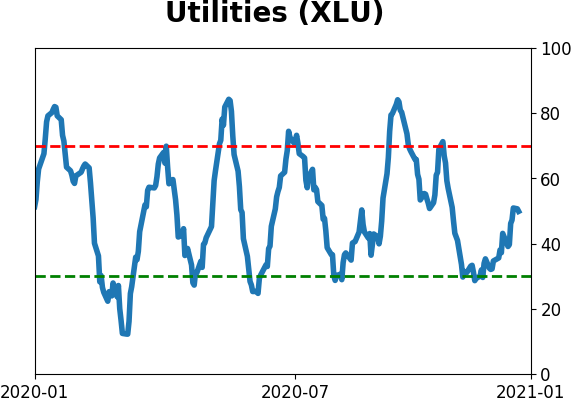
Sector ETF's - 10-Day Moving Average
|
|
|
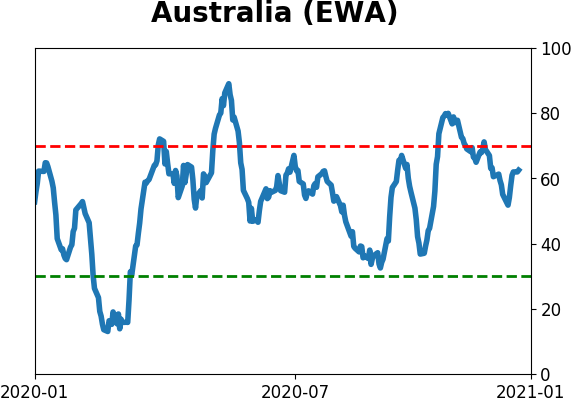
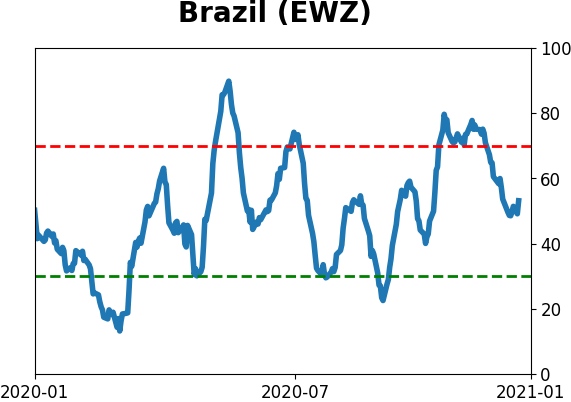
Country ETF's - 10-Day Moving Average
|
|
|
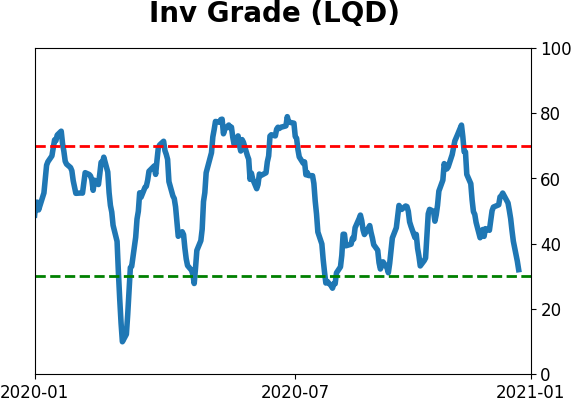
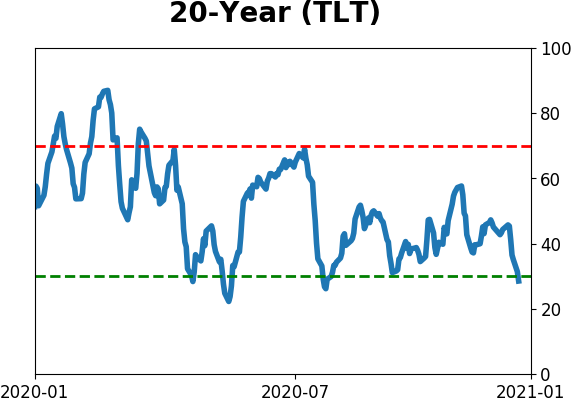
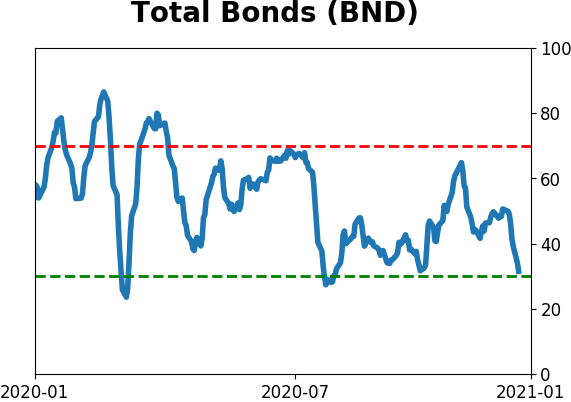
Bond ETF's - 10-Day Moving Average
|
|
|
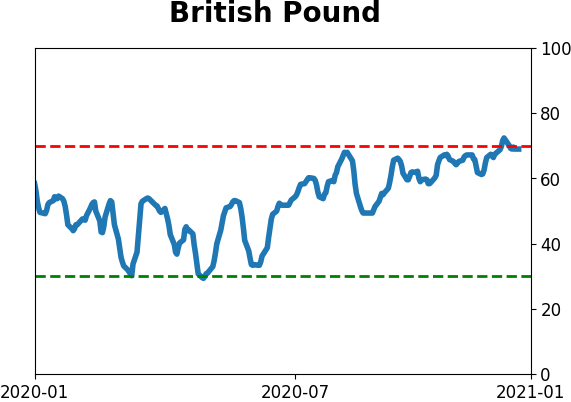
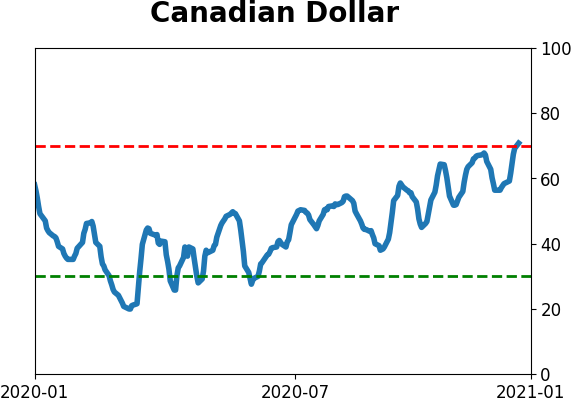
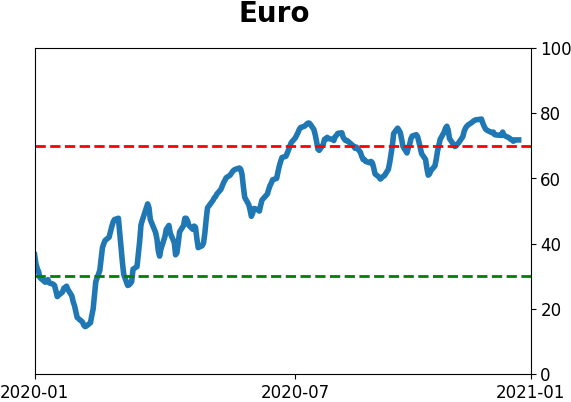
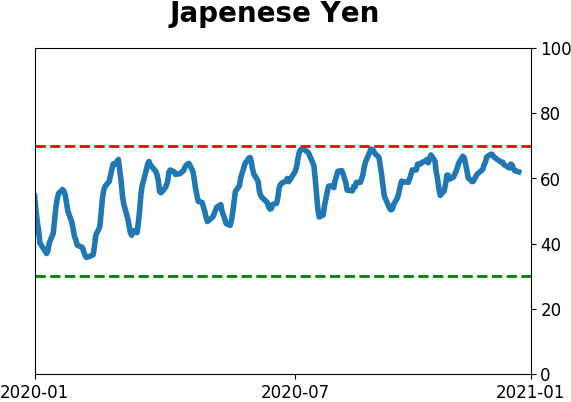
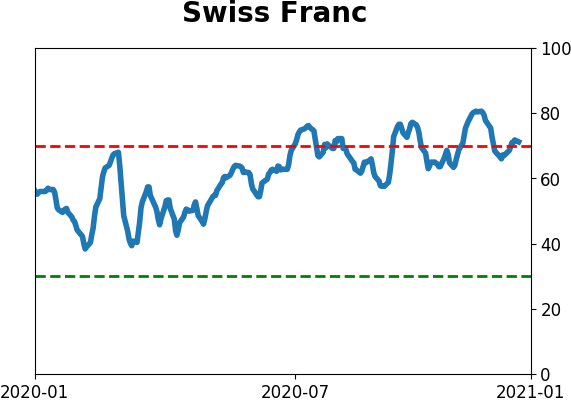
Currency ETF's - 5-Day Moving Average
|
|
|
Commodity ETF's - 5-Day Moving Average
|
|