Headlines
|
|
A jump in stocks cut in half, with Healthcare bearing the brunt:
Last week's selling pressure caused 42% of Nasdaq stocks to be cut in half from their 52-week highs. The stocks seeing selling are being sold extremely hard. More than a quarter of Nasdaq stocks are now at 52-week lows. Among sectors, Healthcare stocks have been hit even harder than Technology.
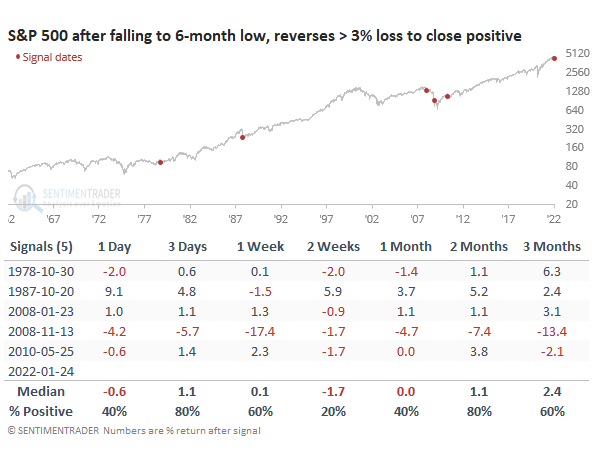
A historic reversal: Stocks enjoyed one of the best reversals in history on Monday, especially the Nasdaq. But the S&P 500, the most benchmarked index in the world, enjoyed a notable reversal of its own. The S&P was off by more than 3% and traded to a 6-month low, before reversing all of its losses. We've highlighted the danger of relying on single-day price patterns many times, and this is no different. The sample size is tiny, but all equivalent reversals saw losses either 1 or 2 weeks later.
|
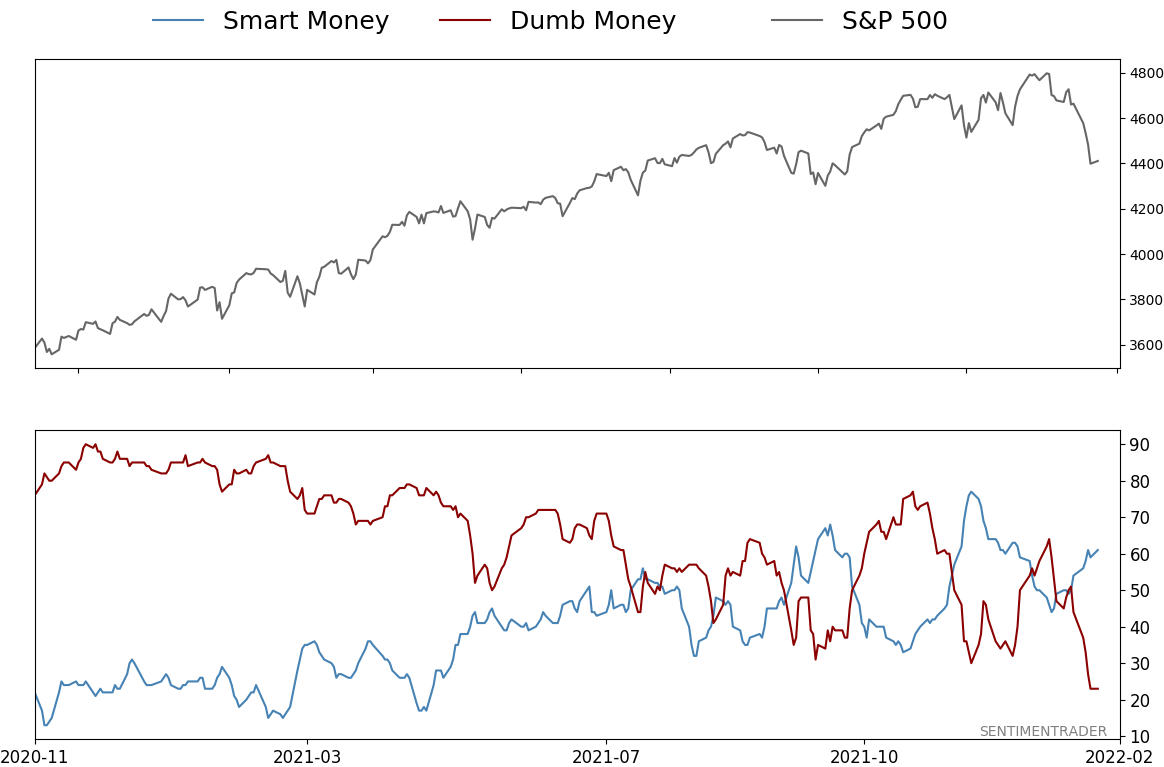
Smart / Dumb Money Confidence
|
Smart Money Confidence: 61%
Dumb Money Confidence: 23%
|
|
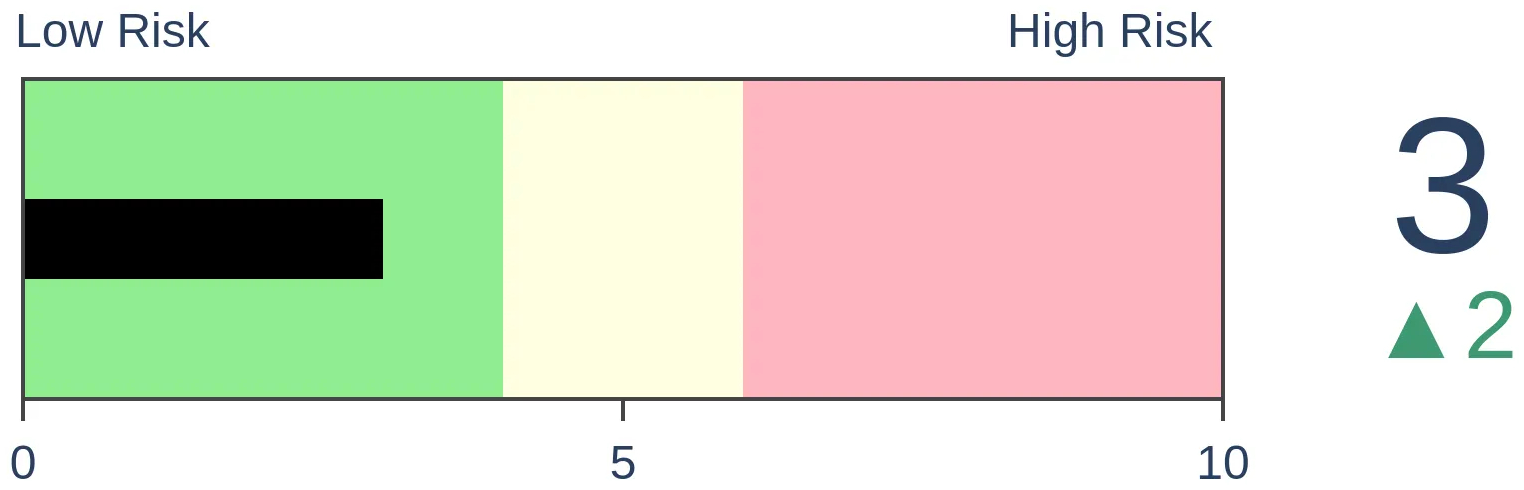
Risk Levels
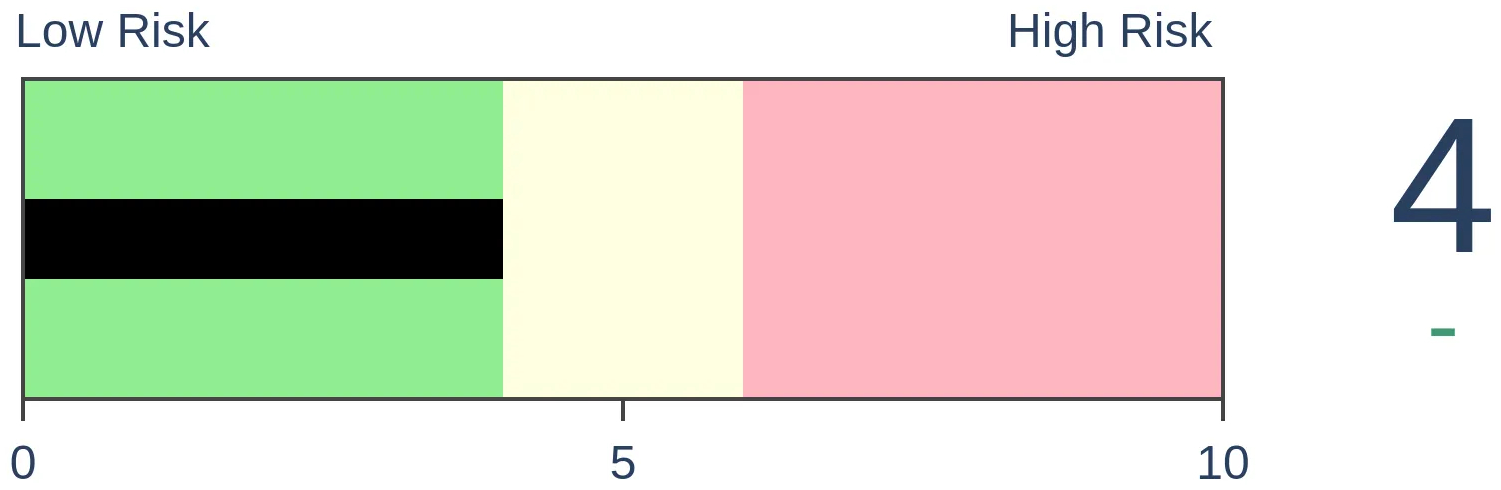
Stocks Short-Term
|
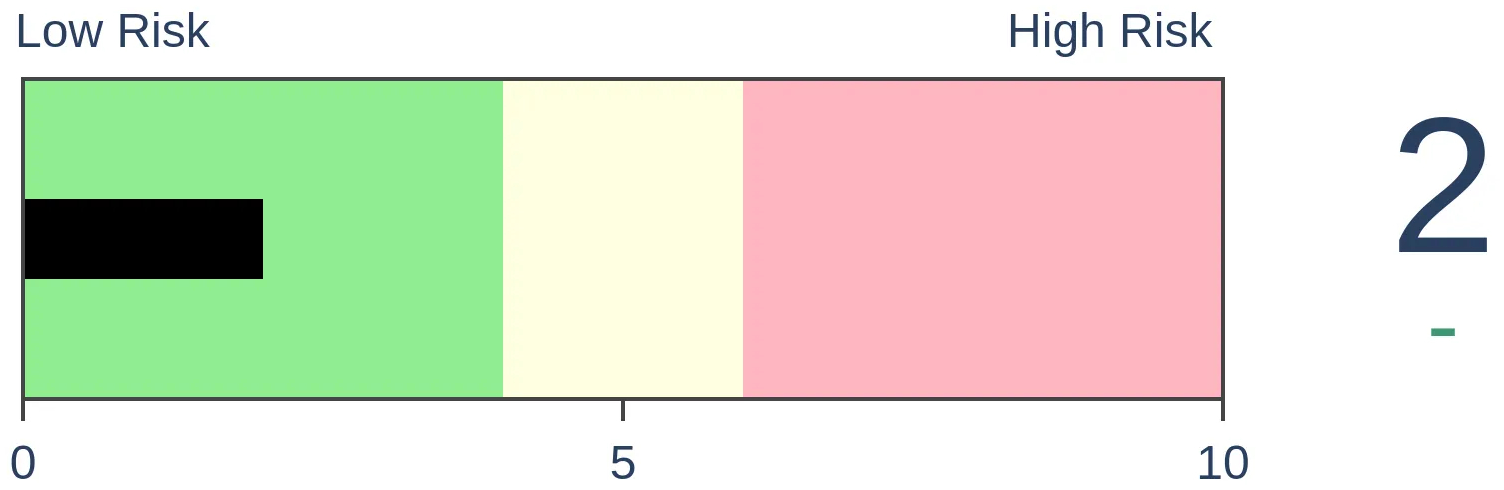
Stocks Medium-Term
|
|
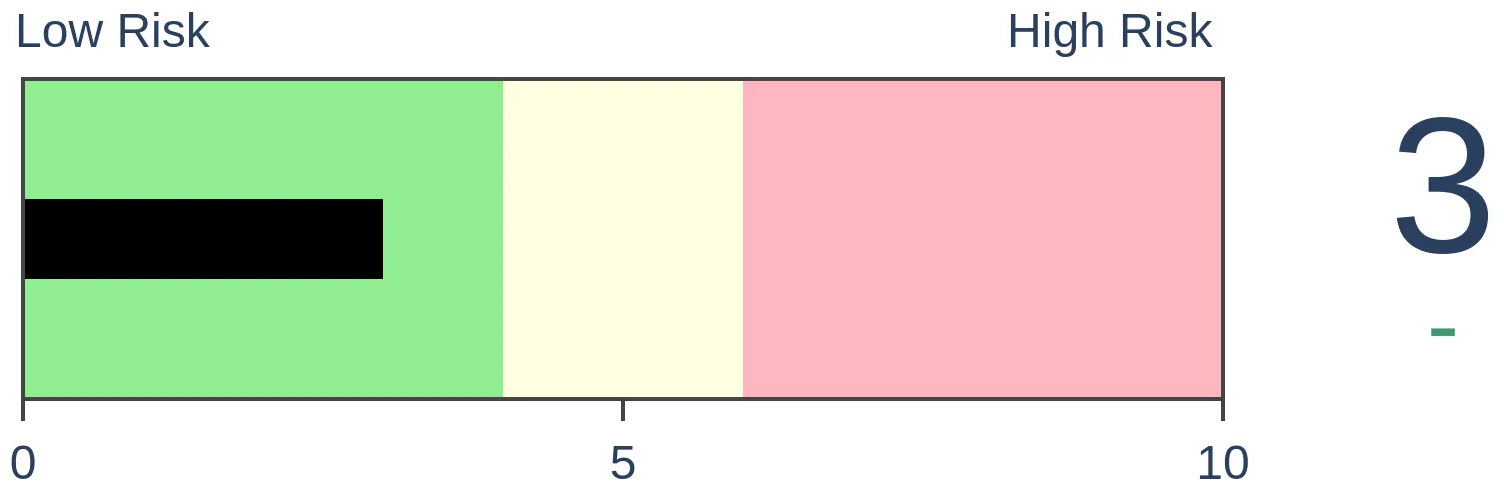
Bonds
|
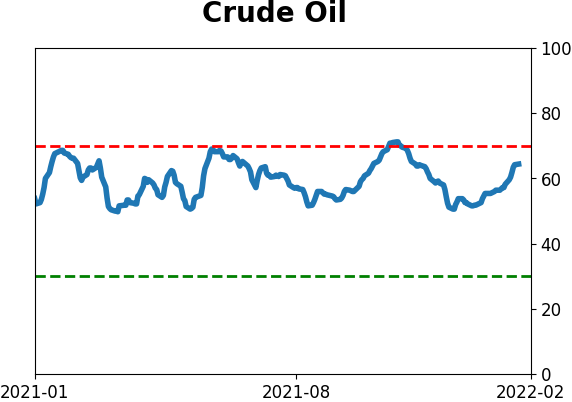
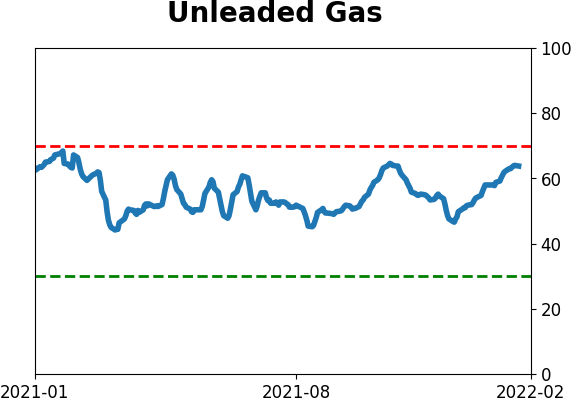
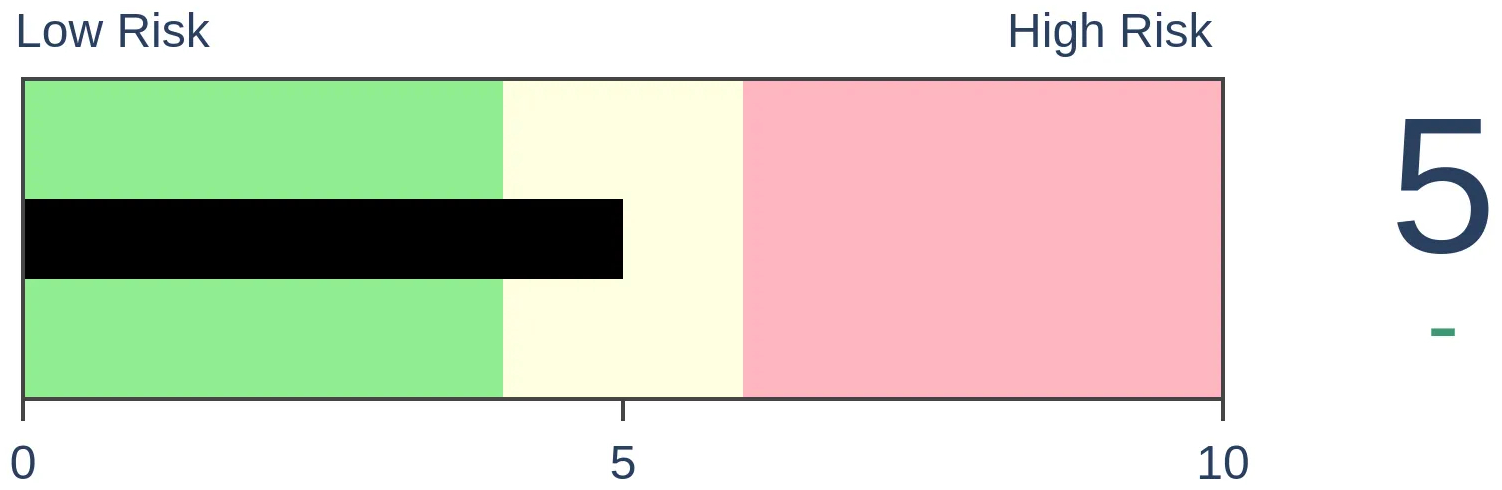
Crude Oil
|
|
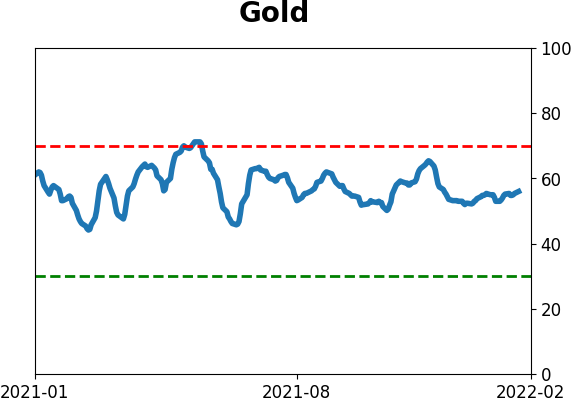
Gold
|
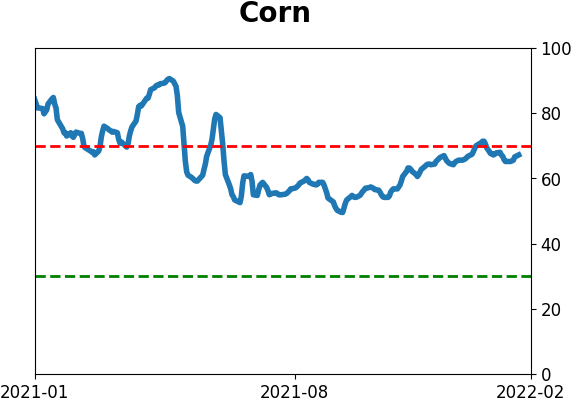
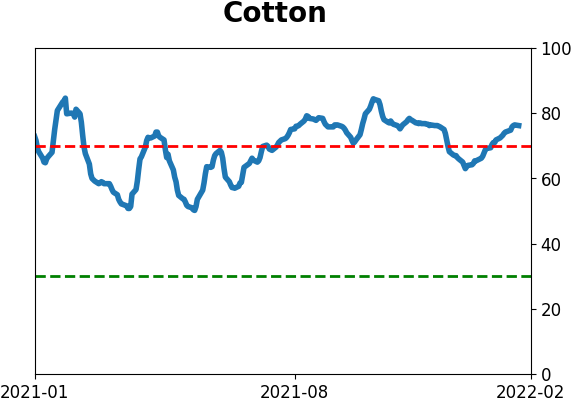
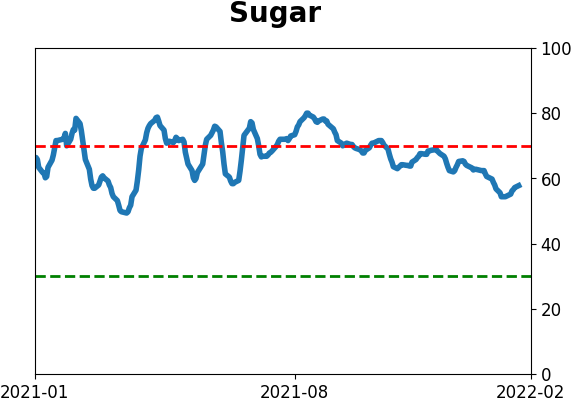
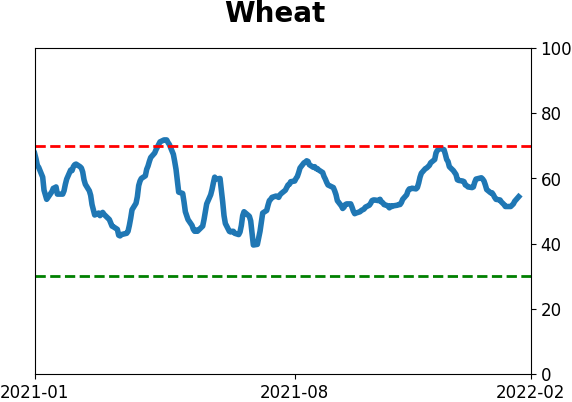
Agriculture

|
|
Research
By Jason Goepfert
BOTTOM LINE
Last week's selling pressure caused 42% of Nasdaq stocks to be cut in half from their 52-week highs. The stocks seeing selling are being sold extremely hard. More than a quarter of Nasdaq stocks are now at 52-week lows. Among sectors, Healthcare stocks have been hit even harder than Technology.
FORECAST / TIMEFRAME
XLV -- Up, Long-Term
|
Key points:
- An extreme percentage of Nasdaq stocks are now down 50% from their highs
- The carnage is not very widespread, however, as relatively few are down 5%, 10%, or 20%
- More than a quarter of them have plunged to 52-week lows
- Technology stocks are not the biggest culprit - Healthcare stocks have born the brunt of selling pressure
Nasdaq stock selling on par with the worst markets in 20 years
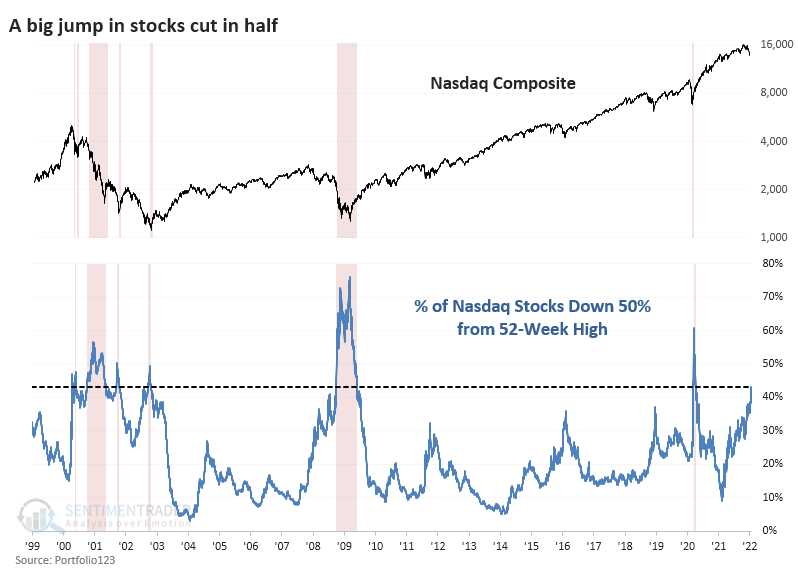
A few weeks ago, we looked at the number of stocks cut in half. It's only gotten worse.
As of Friday, 42% of stocks on the Nasdaq were down by half. That's on par with the very worst markets of the past 20 years. Since the 2008 financial crisis, only 20 days from March 12, 2020, through April 16, 2020, saw more stocks down by 50% or more from their highs.
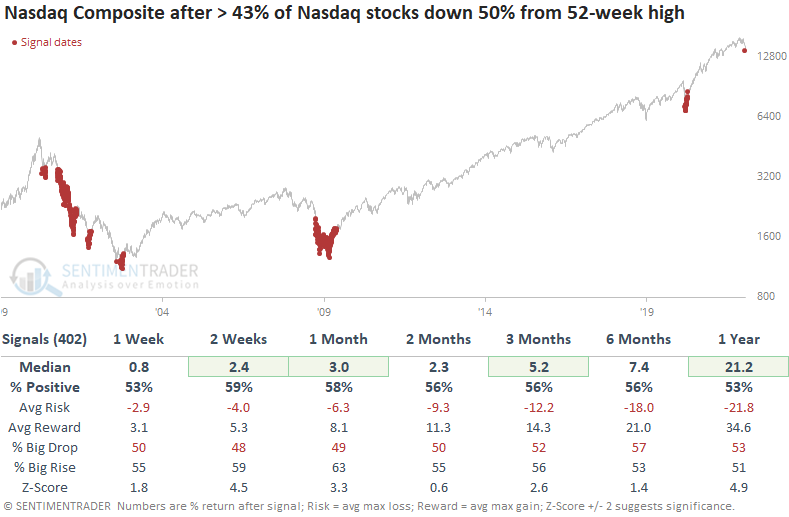
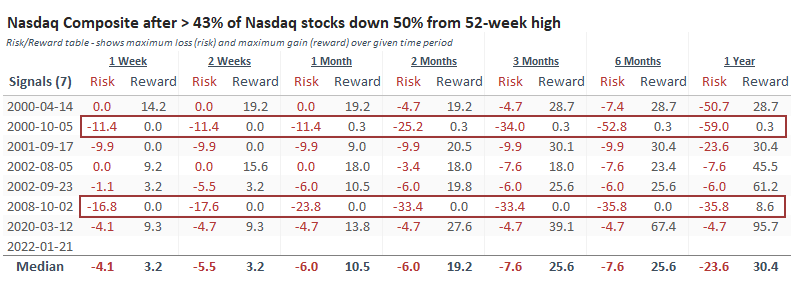
The Nasdaq Composite performed okay after any day on which 43% or more of securities had been cut in half. There were some significant losses in 2001 and 2008, though. It was a much safer bet to wait until the smoke cleared and miss trying to buy the bottom.
Focusing just on the first day when more than this many stocks dropped by 50%, we can see the two biggest failures. This kind of behavior triggered relatively early in the 2000 and 2008 bear markets. After the others, it wasn't even that great of a "this is the bottom" signal.
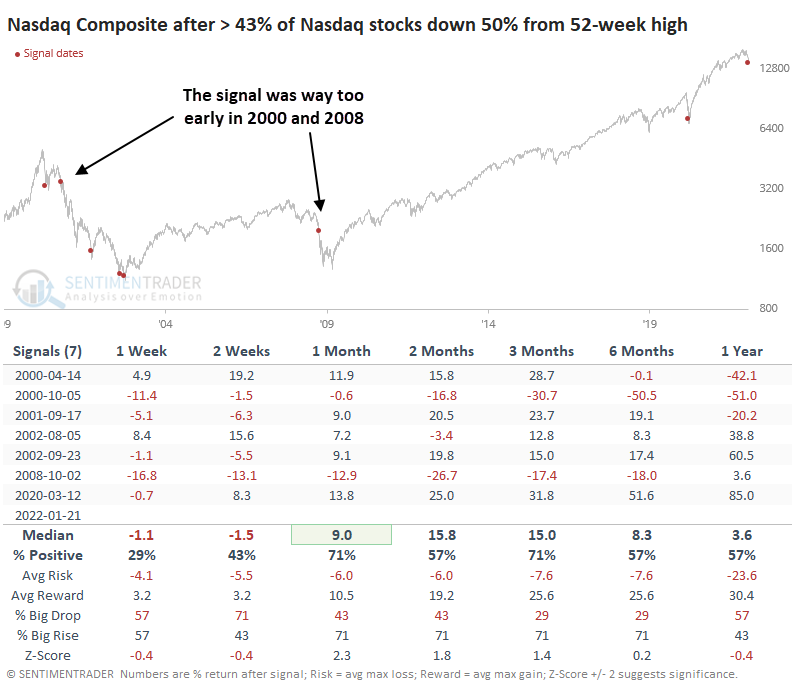
The Risk/Reward Table shows what to watch. The Nasdaq continued to plunge in the week(s) following the 2001 and 2008 signals. After the others, losses were relatively limited as the index was putting in a bottom, though all of them showed losses of several percent at some point over the next couple of months.
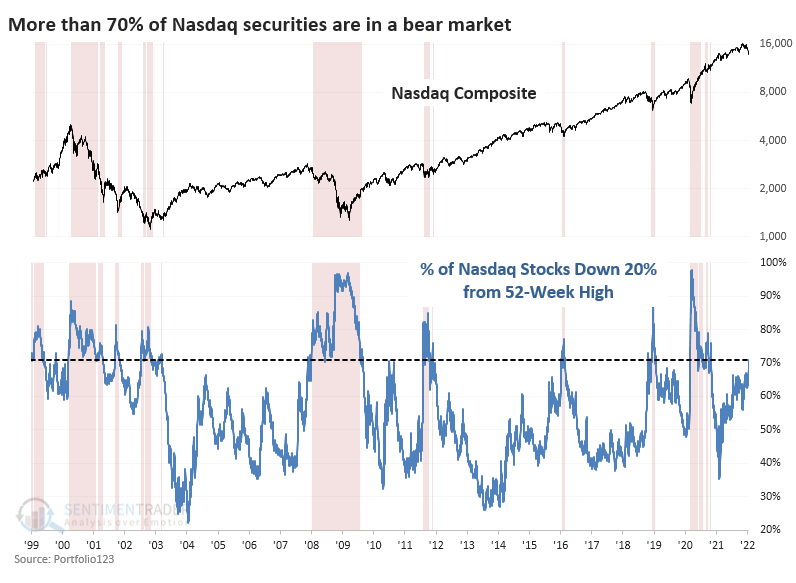
As we discussed a few weeks ago, there isn't wholesale selling pressure, at least not on the scale of the big bear market bottoms. Even after last week's carnage, "only" 70% of Nasdaq stocks are down 20%. Other bottoms saw this reach 80% - 95% of stocks.
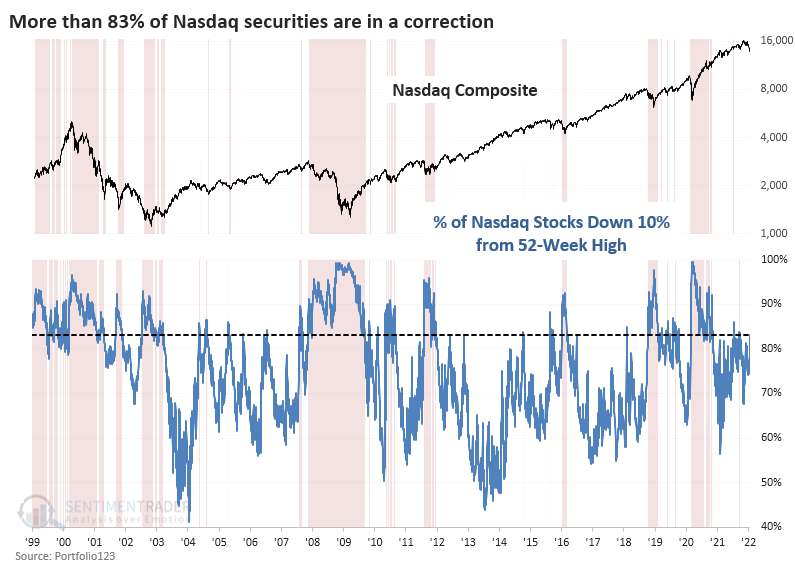
Just over 80% of stocks are down 10% or more. This isn't extreme at all.
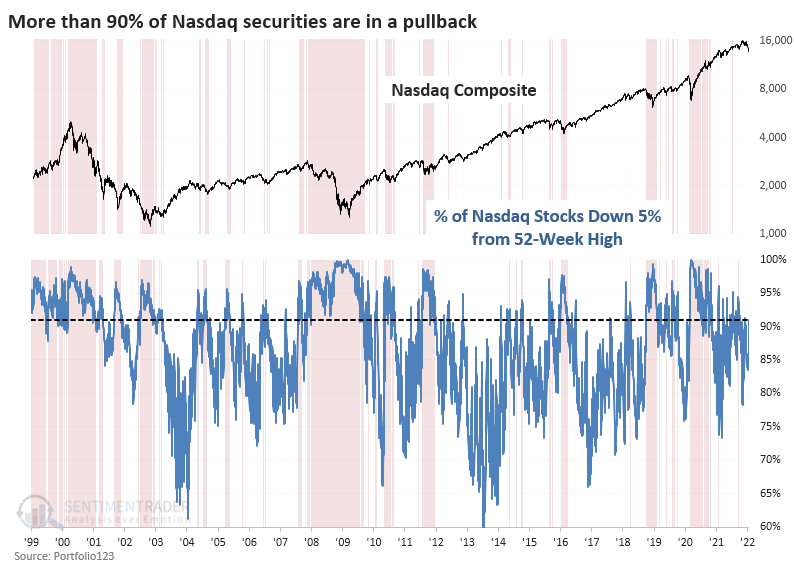
And 90% of stocks are in a pullback, down 5% or more. That's high, but other bear market bottoms saw this reach close to universality, with nearly 100% of stocks down by that much.
The bottom line is that the stocks seeing selling pressure are being sold HARD. There is not yet wholesale dumping of all stocks.
Lots of 52-week lows, too
Even though relatively few stocks are down by 20% or more, more than a quarter of them have dropped to 52-week lows. New 52-week highs are nearly non-existent.
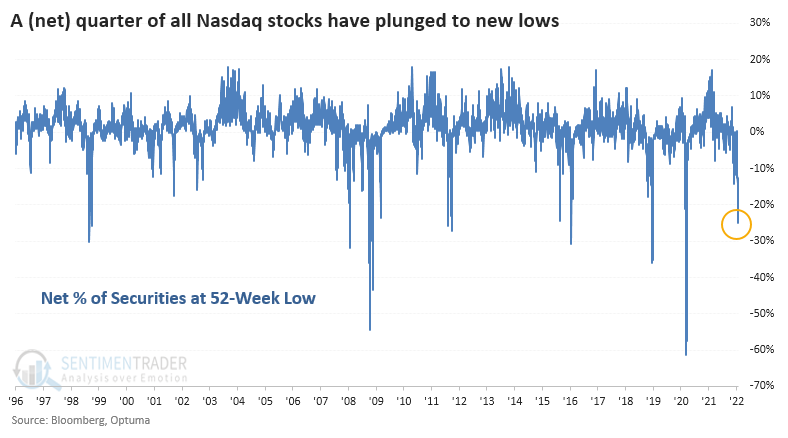
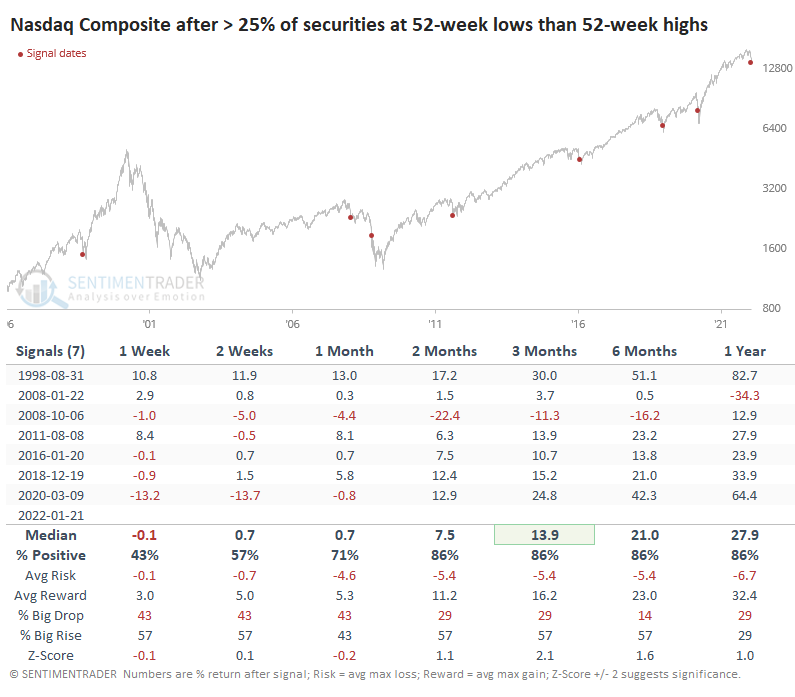
Because the 2000-2002 bear market was a slow-rolling affair with heavy rotation between stocks, we never saw this kind of extreme during that window. After the other times more than a net 25% of stocks fell to a new low, the Nasdaq Composite saw a lot of short-term volatility, with all but the financial crisis eventually leading to gains over the next couple of months.
The damage isn't necessarily in Technology
We're seeing so many extremes on the Nasdaq exchange right now because of the massive amount of new issues listed over the past few years. The number of securities traded on the exchange has grown from fewer than 2,500 to more than 3,500.
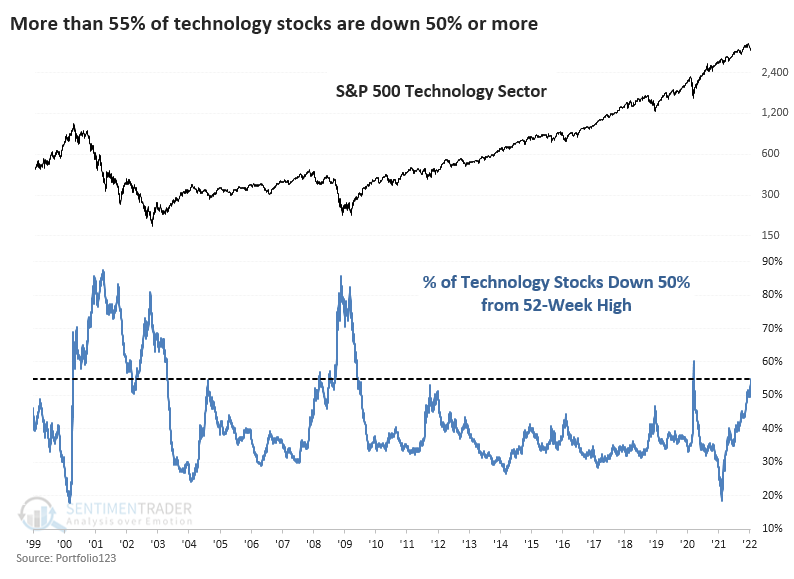
While people tend to think that Nasdaq = Technology, that's not really the case. A broad universe of Technology stocks has been hit, no doubt about it, with 55% of them down by half. During the last two great bear markets, that figure exceeded 80%.
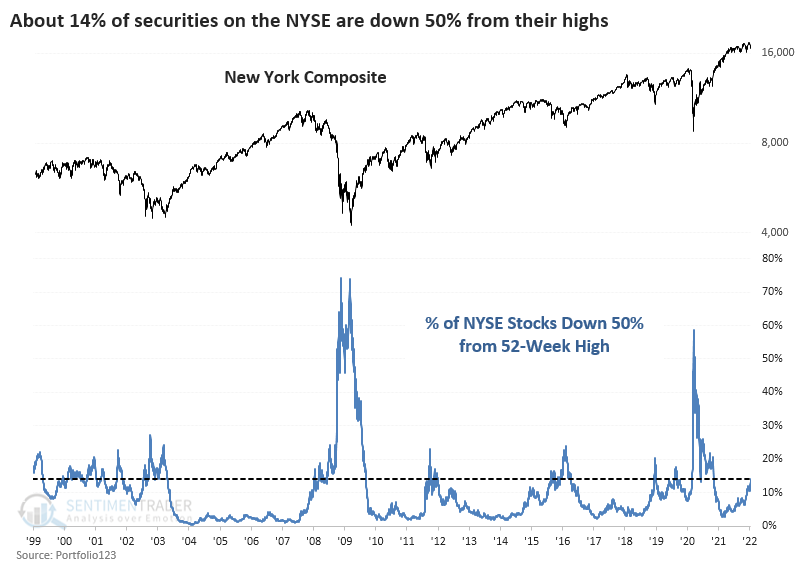
Only 14% of stocks are down 50% or more on the NYSE. At the bottoms of other panicky declines since 2010, this figure hit 20% or more.
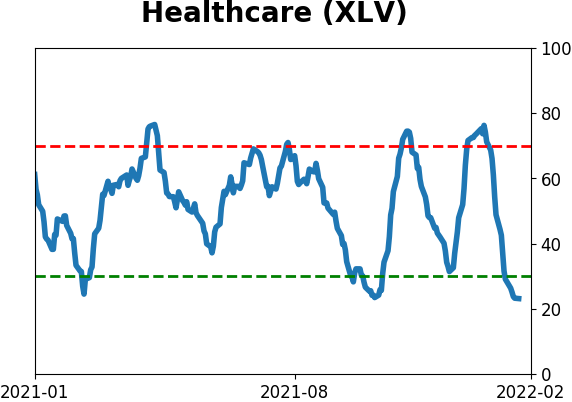
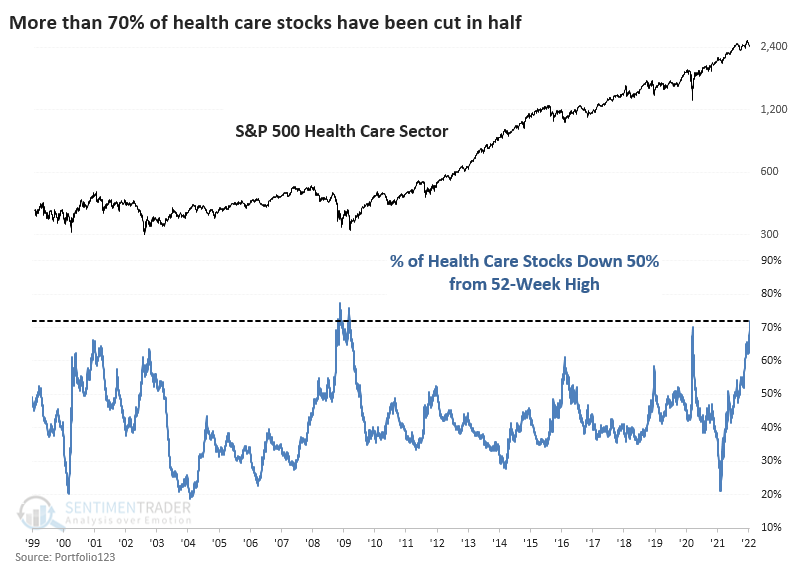
So, where is the selling pressure? Health Care, for one.
Selling in those stocks has been merciless. Out of nearly 1,700 U.S. Healthcare sector stocks with fundamental data tracked by Portfolio123, almost 1,200 of them have dropped by 50% or more.
This means that more than 70% of them have been knee-capped, exceeding the pandemic carnage. Only a handful of days in 2008-09 saw more Healthcare stocks down by half.
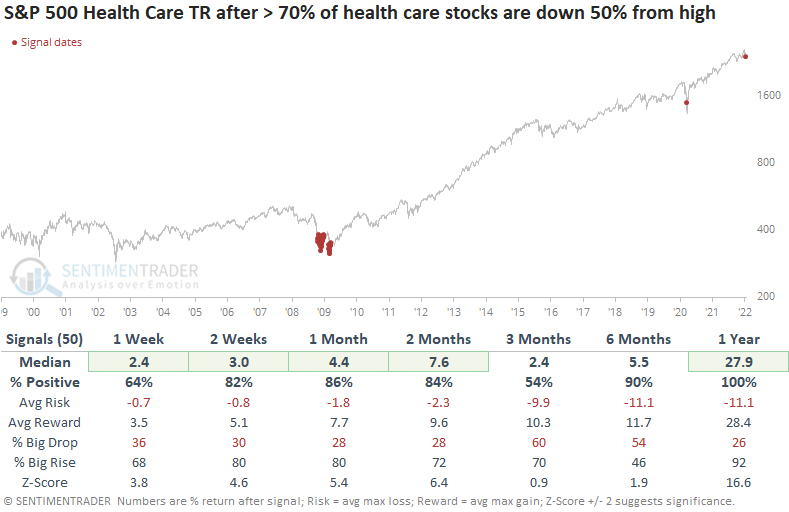
After the 50 days when more than 70% of Healthcare stocks got cut in half, the S&P 500 Healthcare Sector total return was quite positive, though one had to endure some short-term pain to get there. A year later, the sector showed an average return of nearly 28%.
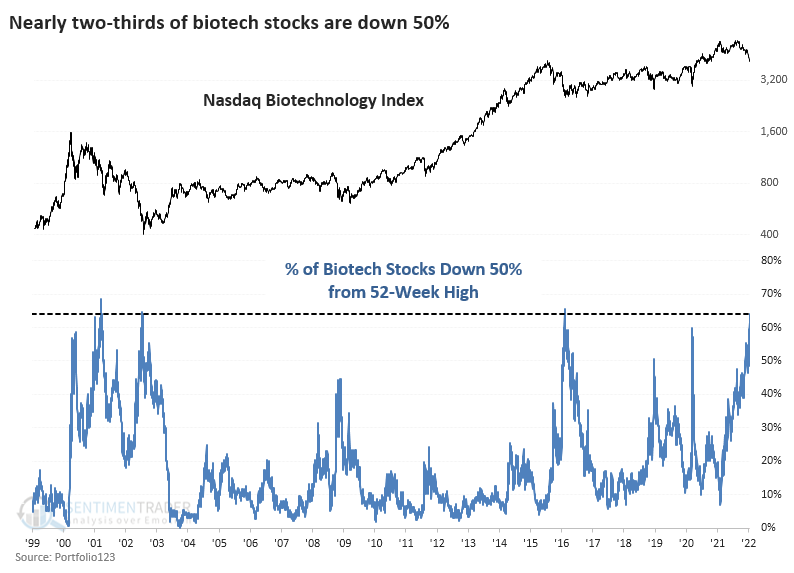
Within the sector, Biotechnology industry stocks have been especially vulnerable. More than 60% of them have dropped by half. Not many days in the past 20 years can compare.
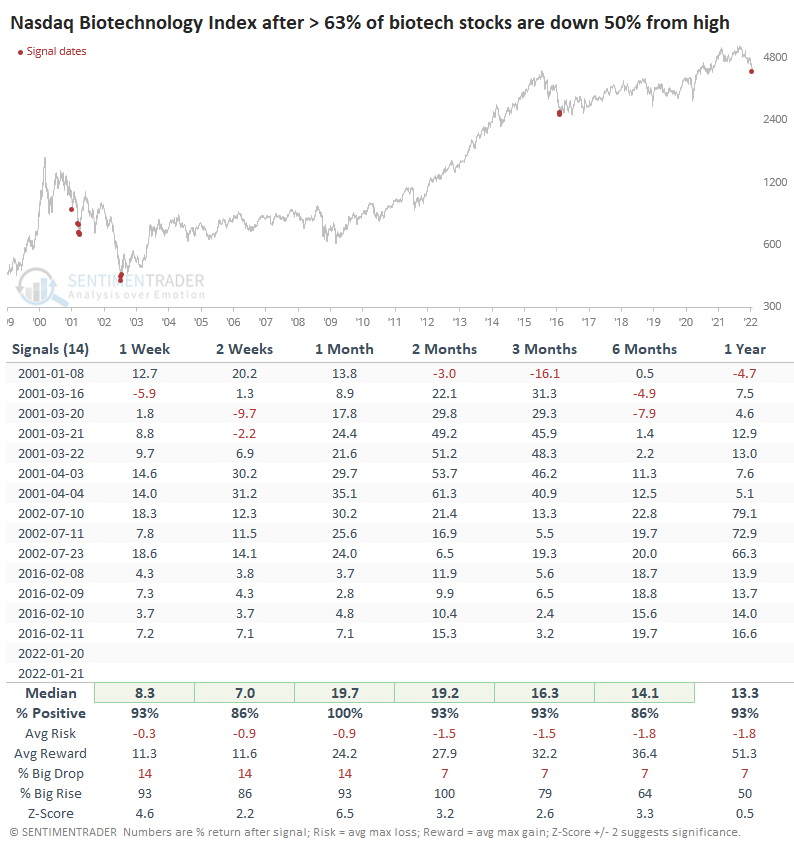
After other times when more than 63% of Biotech stocks got cut in half, the Nasdaq Biotechnology Index rebounded each time. Over the next month, all 14 signals showed a positive return, though a few of them ended up failing in 2001.
What the research tells us...
Whenever we see an extreme in something, the natural reaction is to expect mean-reversion. That's usually what happens, and it has served investors well over the past decade. The current round of extremes feels different, which is 100% subjective. Objectively, a case can be made that we're seeing a moderate extreme of pessimism, and during healthy markets, that is an excellent setup for buyers. The problem is that we're no longer in a healthy environment. Even on the Nasdaq, there are evident extremes, but it's not clear that that means it's a low-risk buying opportunity. A better case could be made for specific sectors, especially Healthcare. But only for medium- to long-term investors, as short-term data shows much less of an upside edge.
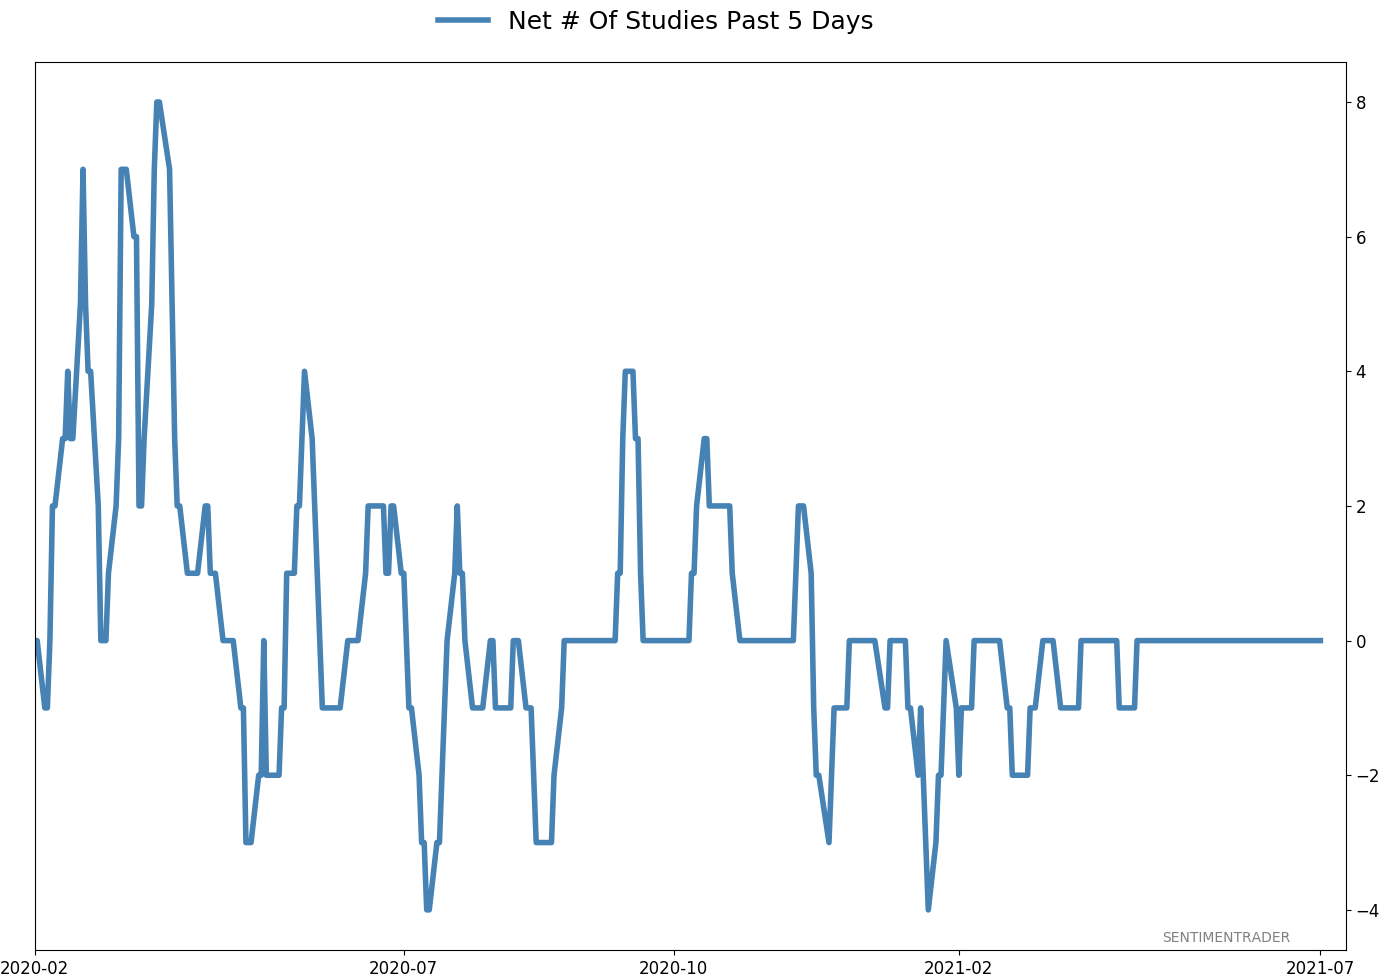
Active Studies
| Time Frame | Bullish | Bearish | | Short-Term | 2 | 0 | | Medium-Term | 13 | 2 | | Long-Term | 13 | 5 |
|
Indicators at Extremes
Portfolio
| Position | Description | Weight % | Added / Reduced | Date | | Stocks | RSP | 10.8 | Reduced 9.1% | 2022-01-20 | | Bonds | 32.7% BND, 7.1% SCHP | 40.1 | Added 8.3% | 2021-10-26 | | Commodities | GCC | 2.4 | Reduced 2.1%
| 2020-09-04 | | Precious Metals | GDX | 4.6 | Reduced 4.2% | 2021-05-19 | | Special Situations | 8.1% KWEB, 3.6% XLE, 1.7% PSCE | 13.4 | Reduced 3.9% | 2022-01-18 | | Cash | | 28.0 | | |
|
Updates (Changes made today are underlined)
Not impressed at all with the market action since there was a breadth thrust at the end of December, with selling pressure hitting consistently since then. The drawdown is beyond what we've typically seen after similar thrusts. More and more indicators are showing risk-off sentiment, and the market environment is sketchy. I've reduced risk because of it. Bond sentiment is trying to recover from a recent bout of pessimism, and gold stocks are doing their thing which is not much at all. They've been flat for six months. Chinese tech stocks were doing exactly what they're supposed to do, then did *not* by plunging to new lows. This is troubling on a shorter-term time frame, but this was never meant for a trade, rather a multi-year investment. Recent behavior is troubling and I will not be adding any exposure as long as that's the case. RETURN YTD: -0.7% 2021: +8.7%, 2020: +8.1%, 2019: +12.6%, 2018: +0.6%, 2017: +3.8%, 2016: +17.1%, 2015: +9.2%, 2014: +14.5%, 2013: +2.2%, 2012: +10.8%, 2011: +16.5%, 2010: +15.3%, 2009: +23.9%, 2008: +16.2%, 2007: +7.8%
|
|
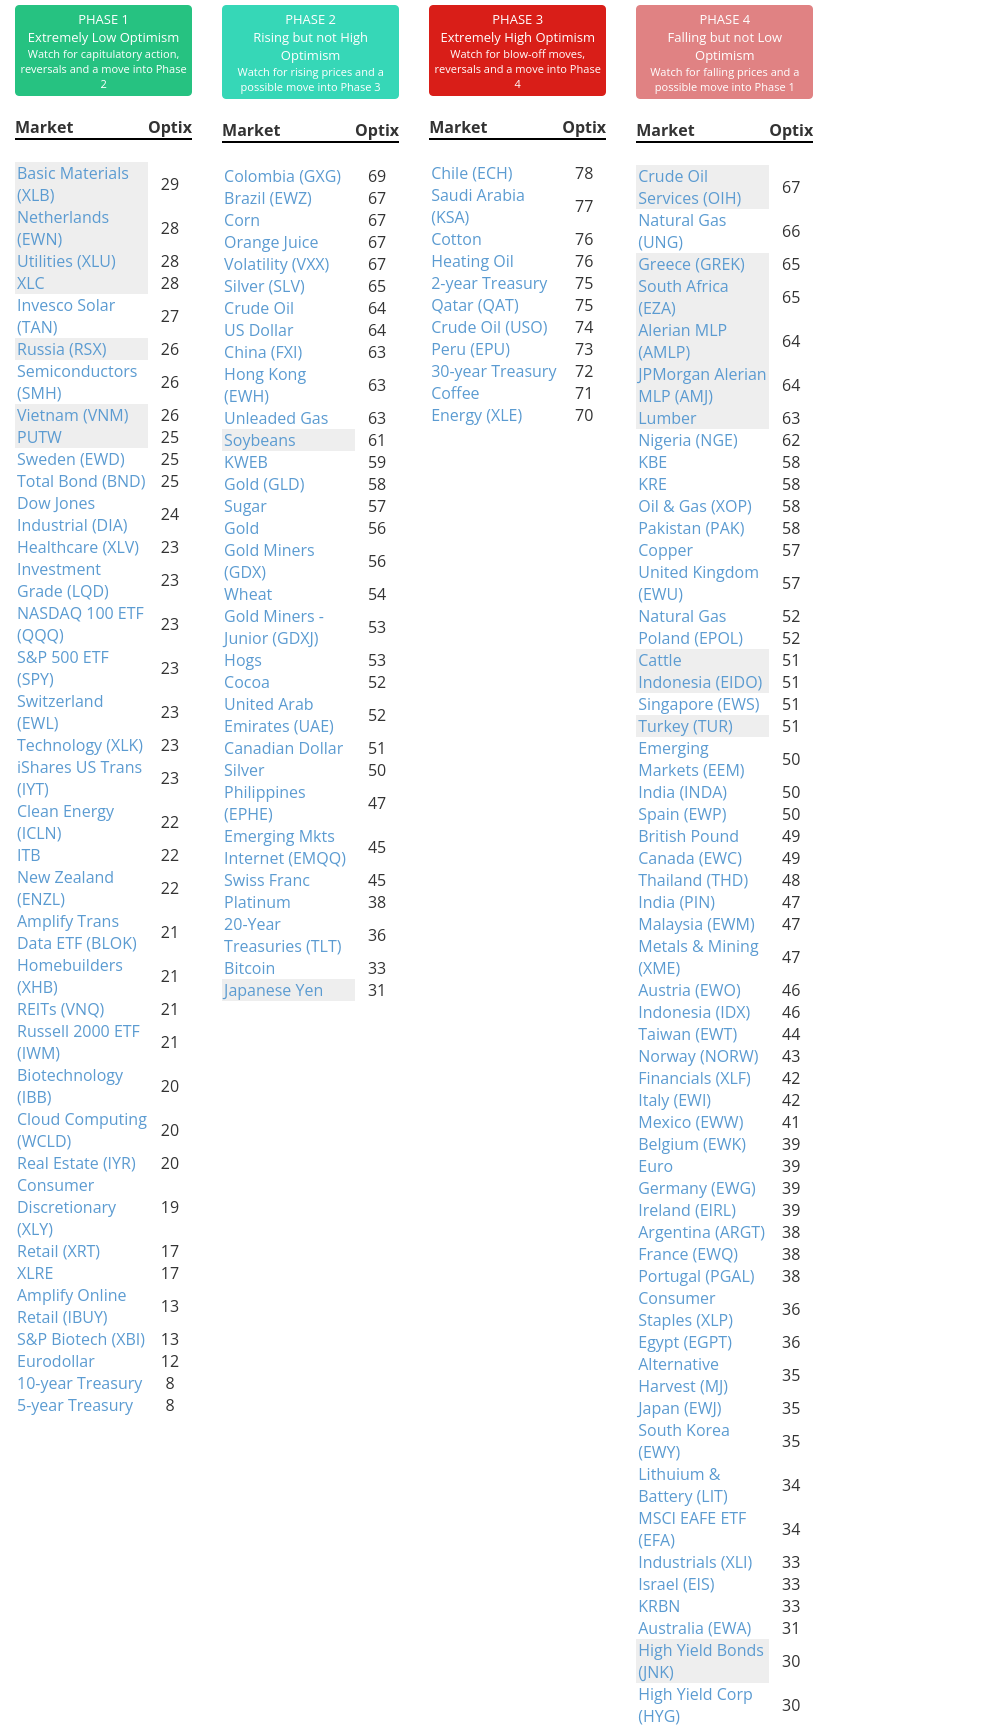
Phase Table
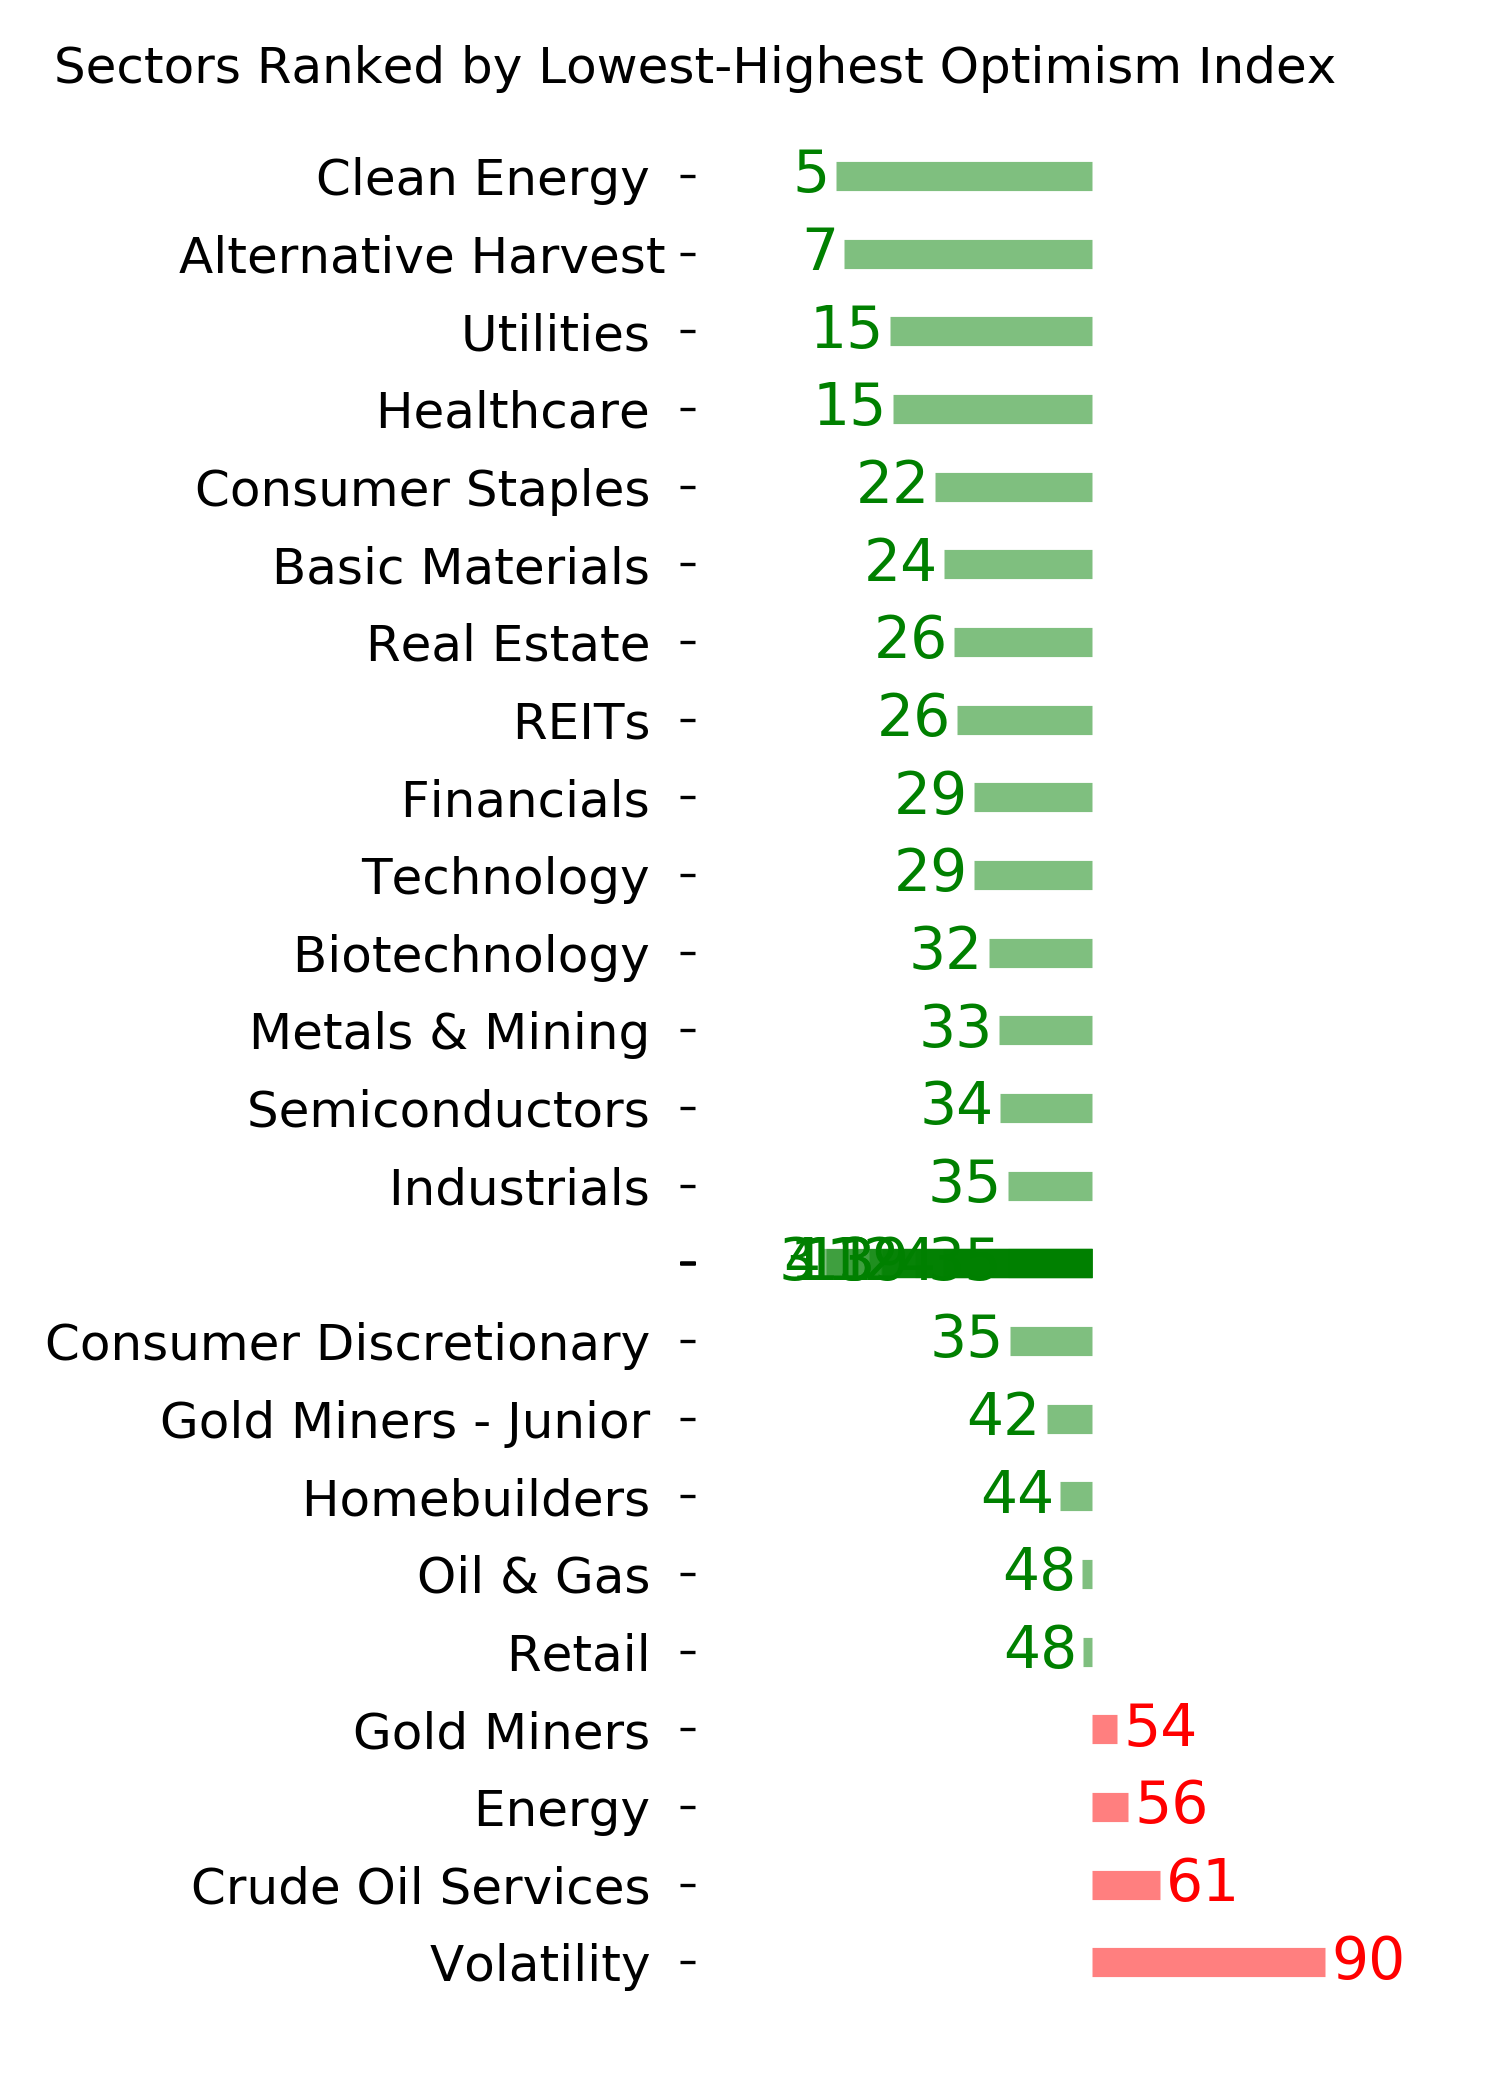
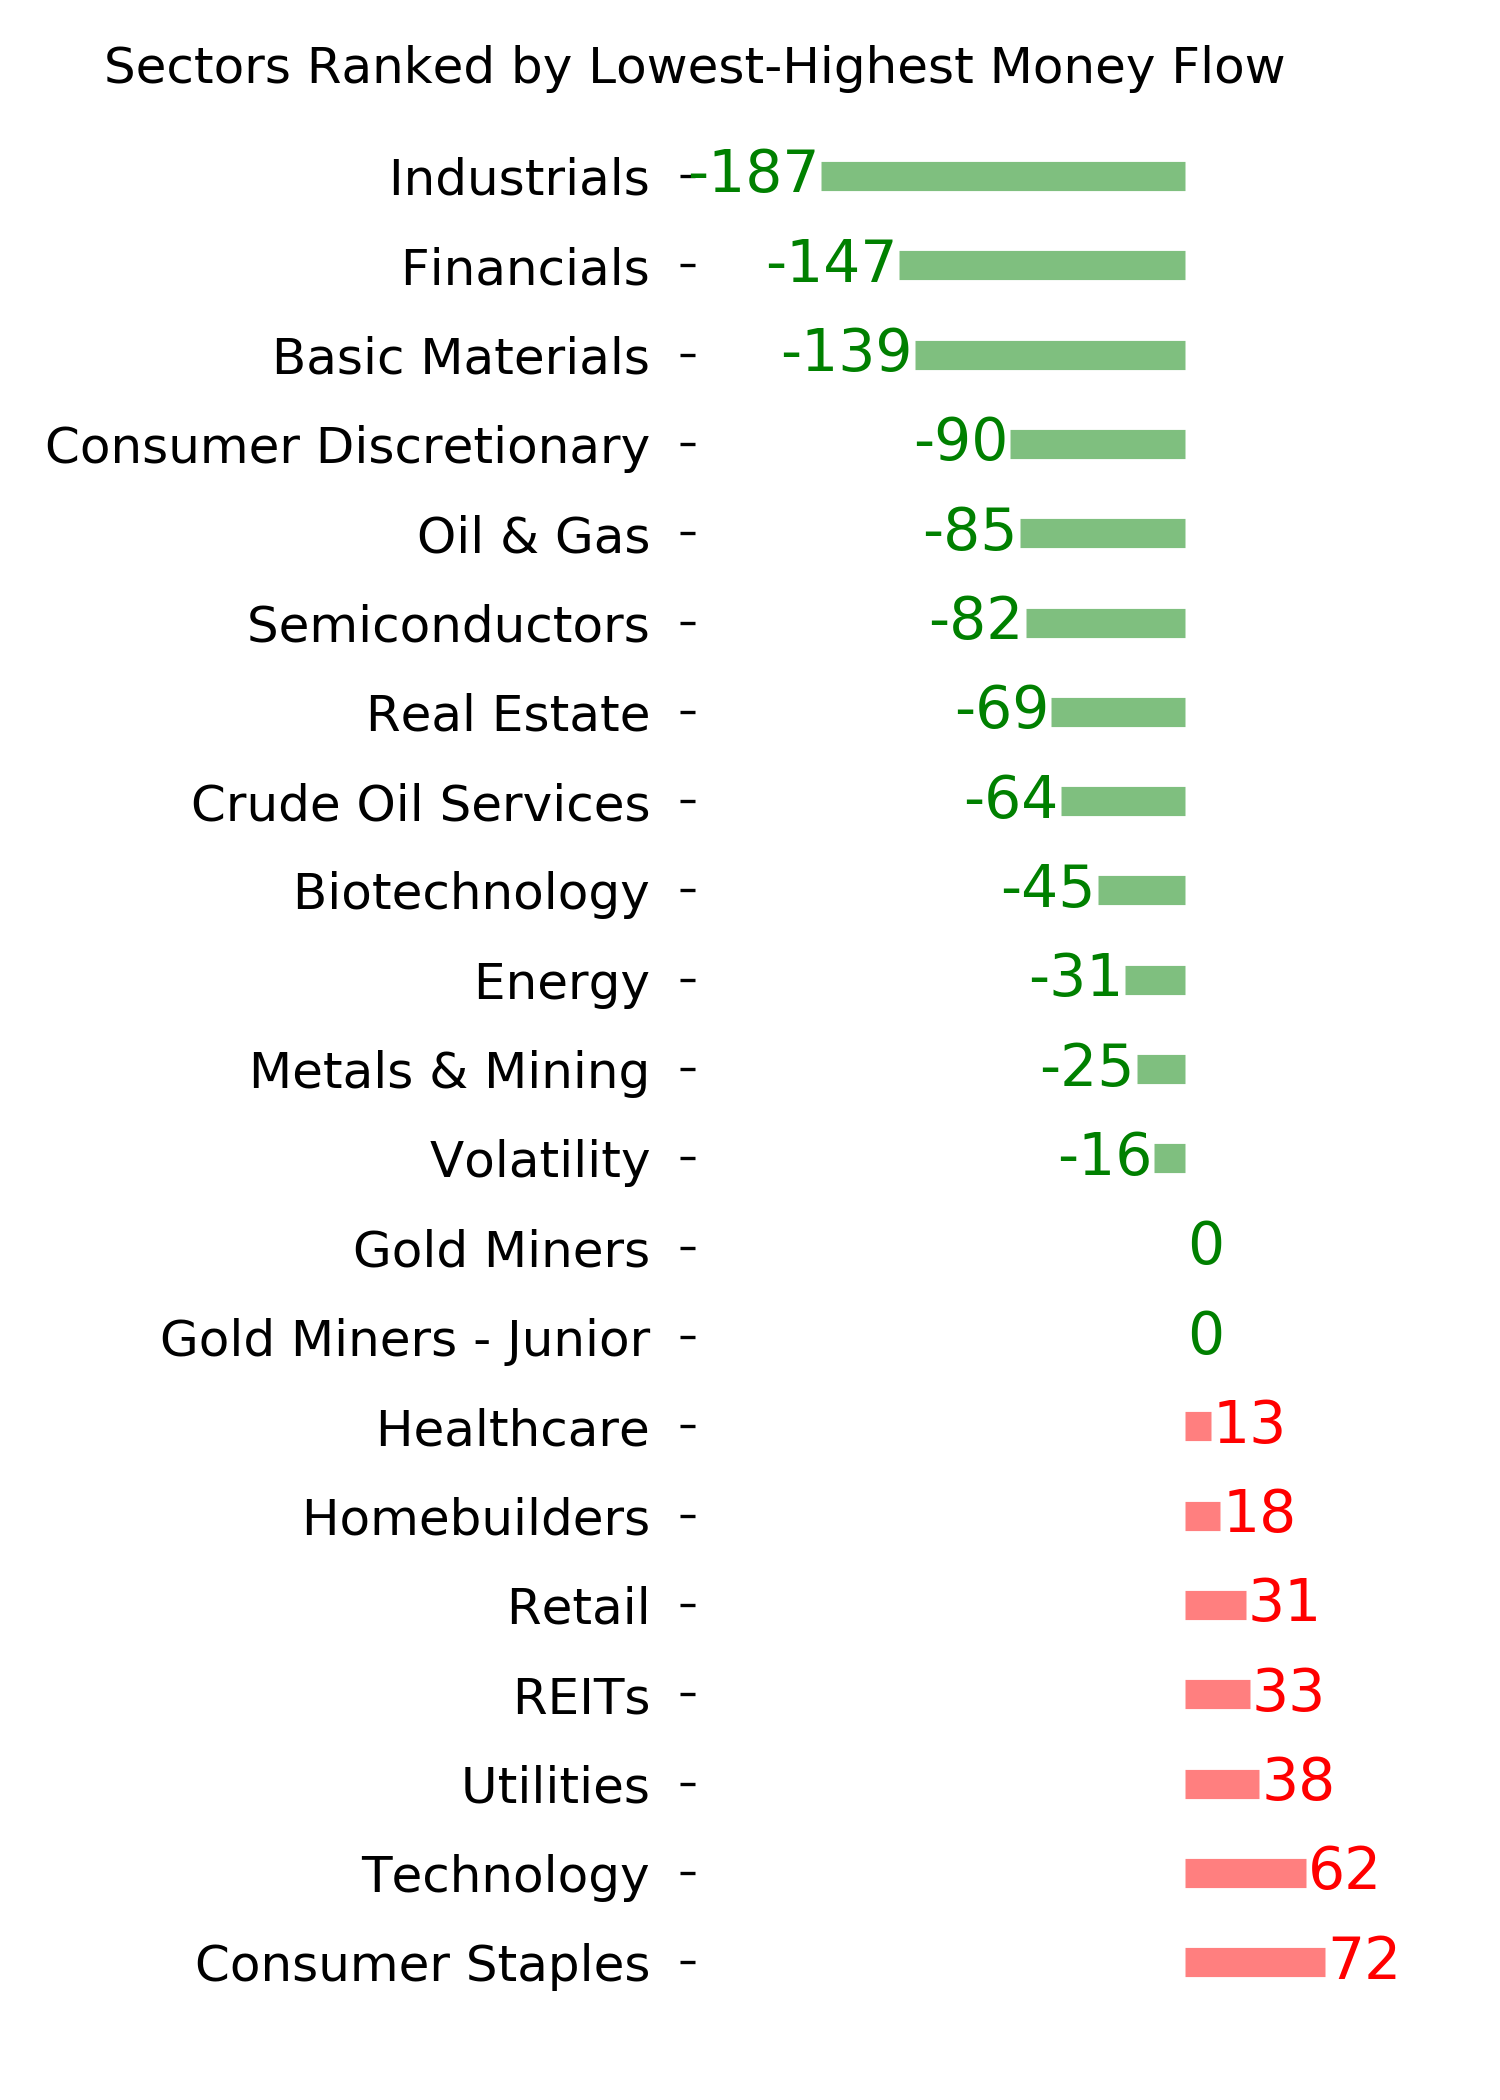
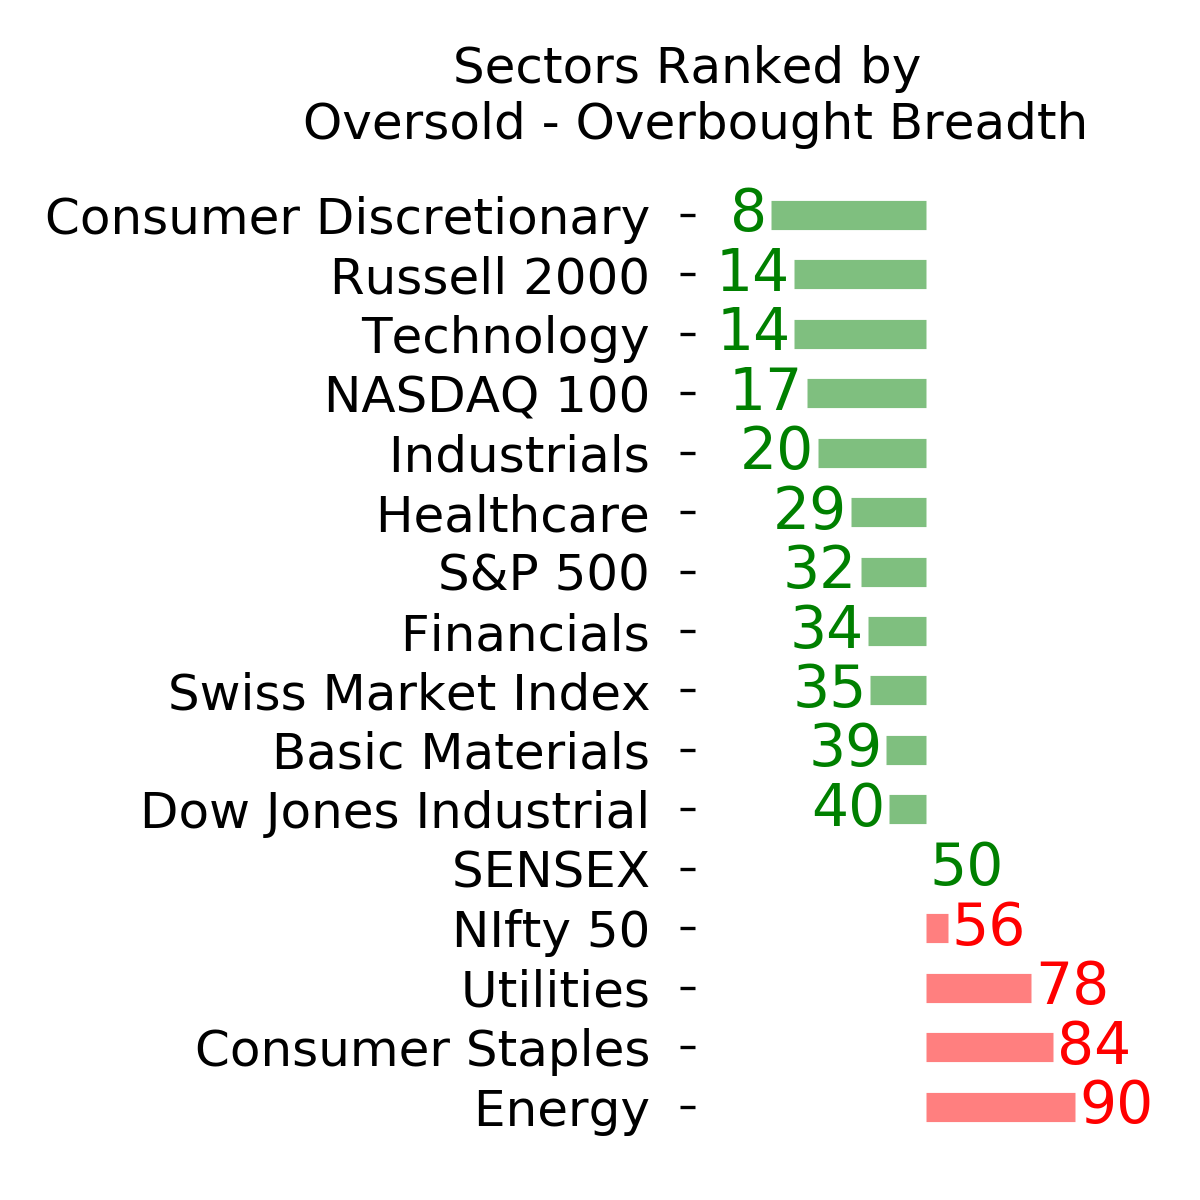
Ranks
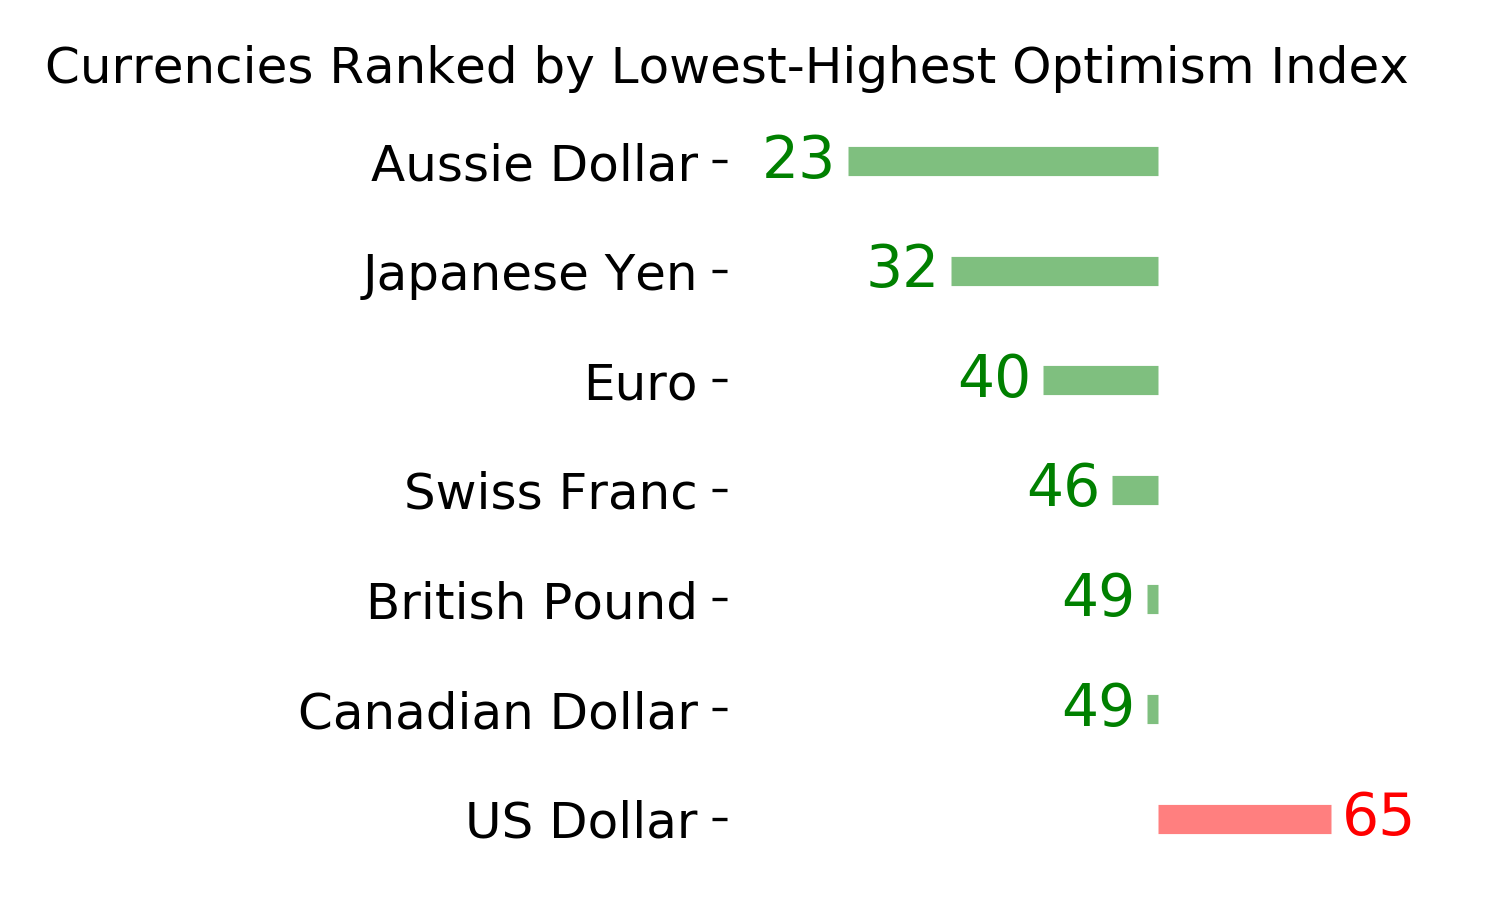
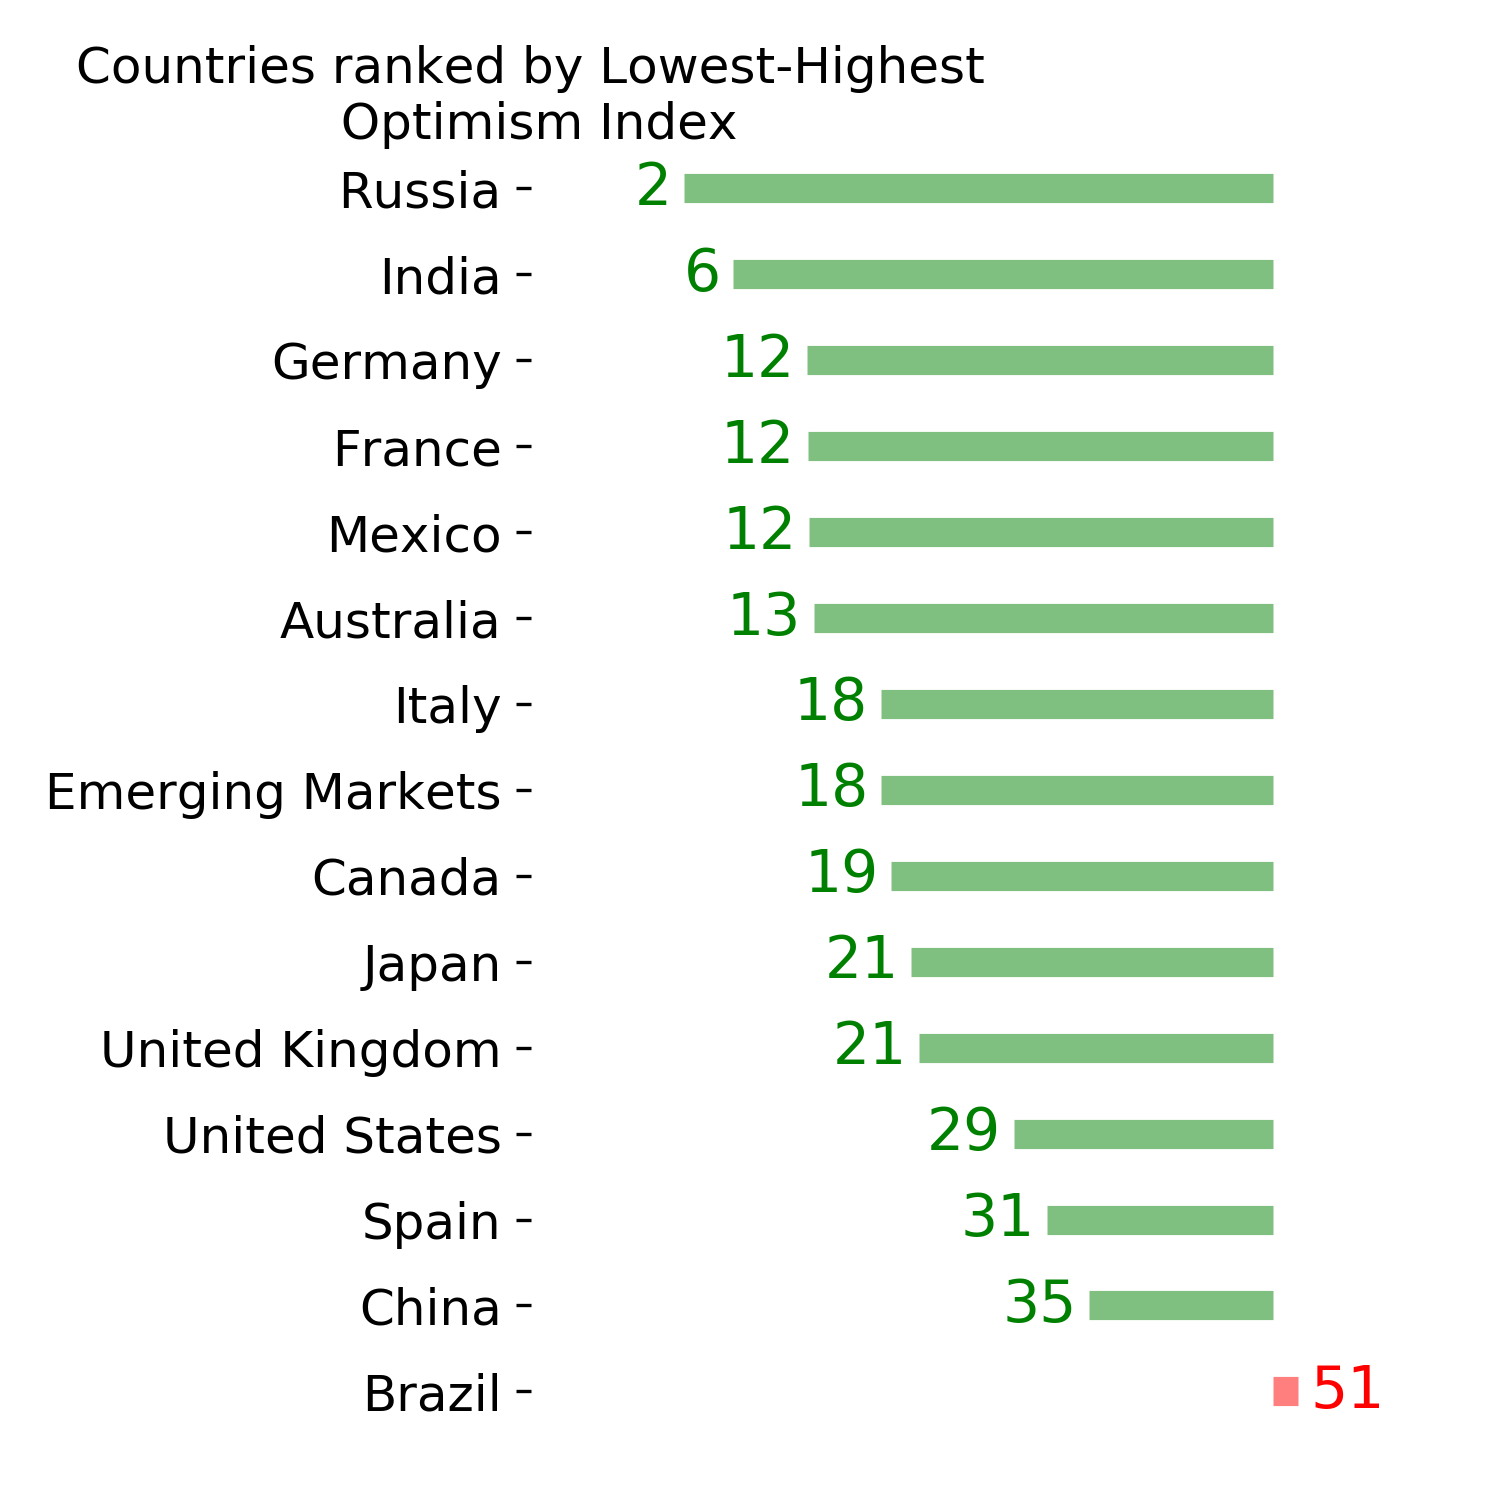
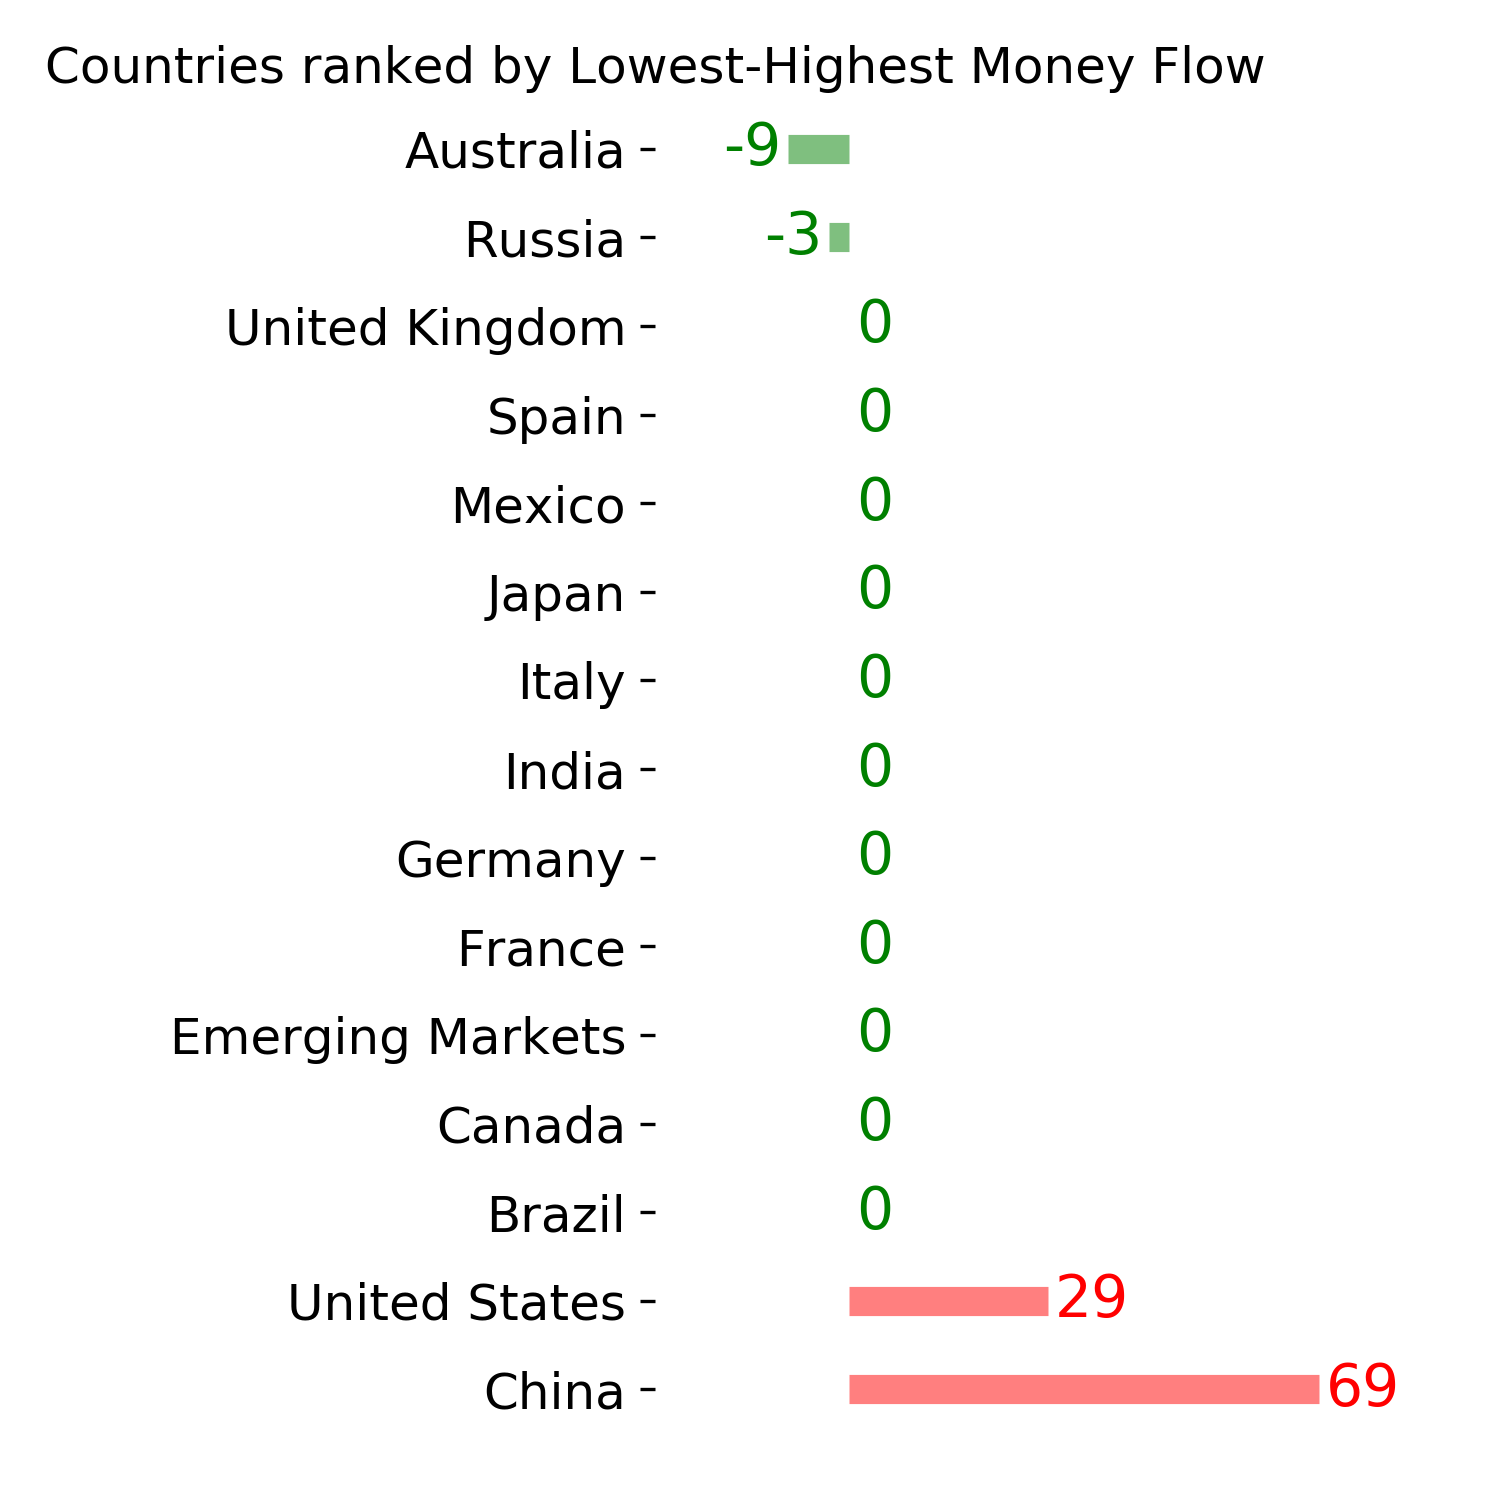
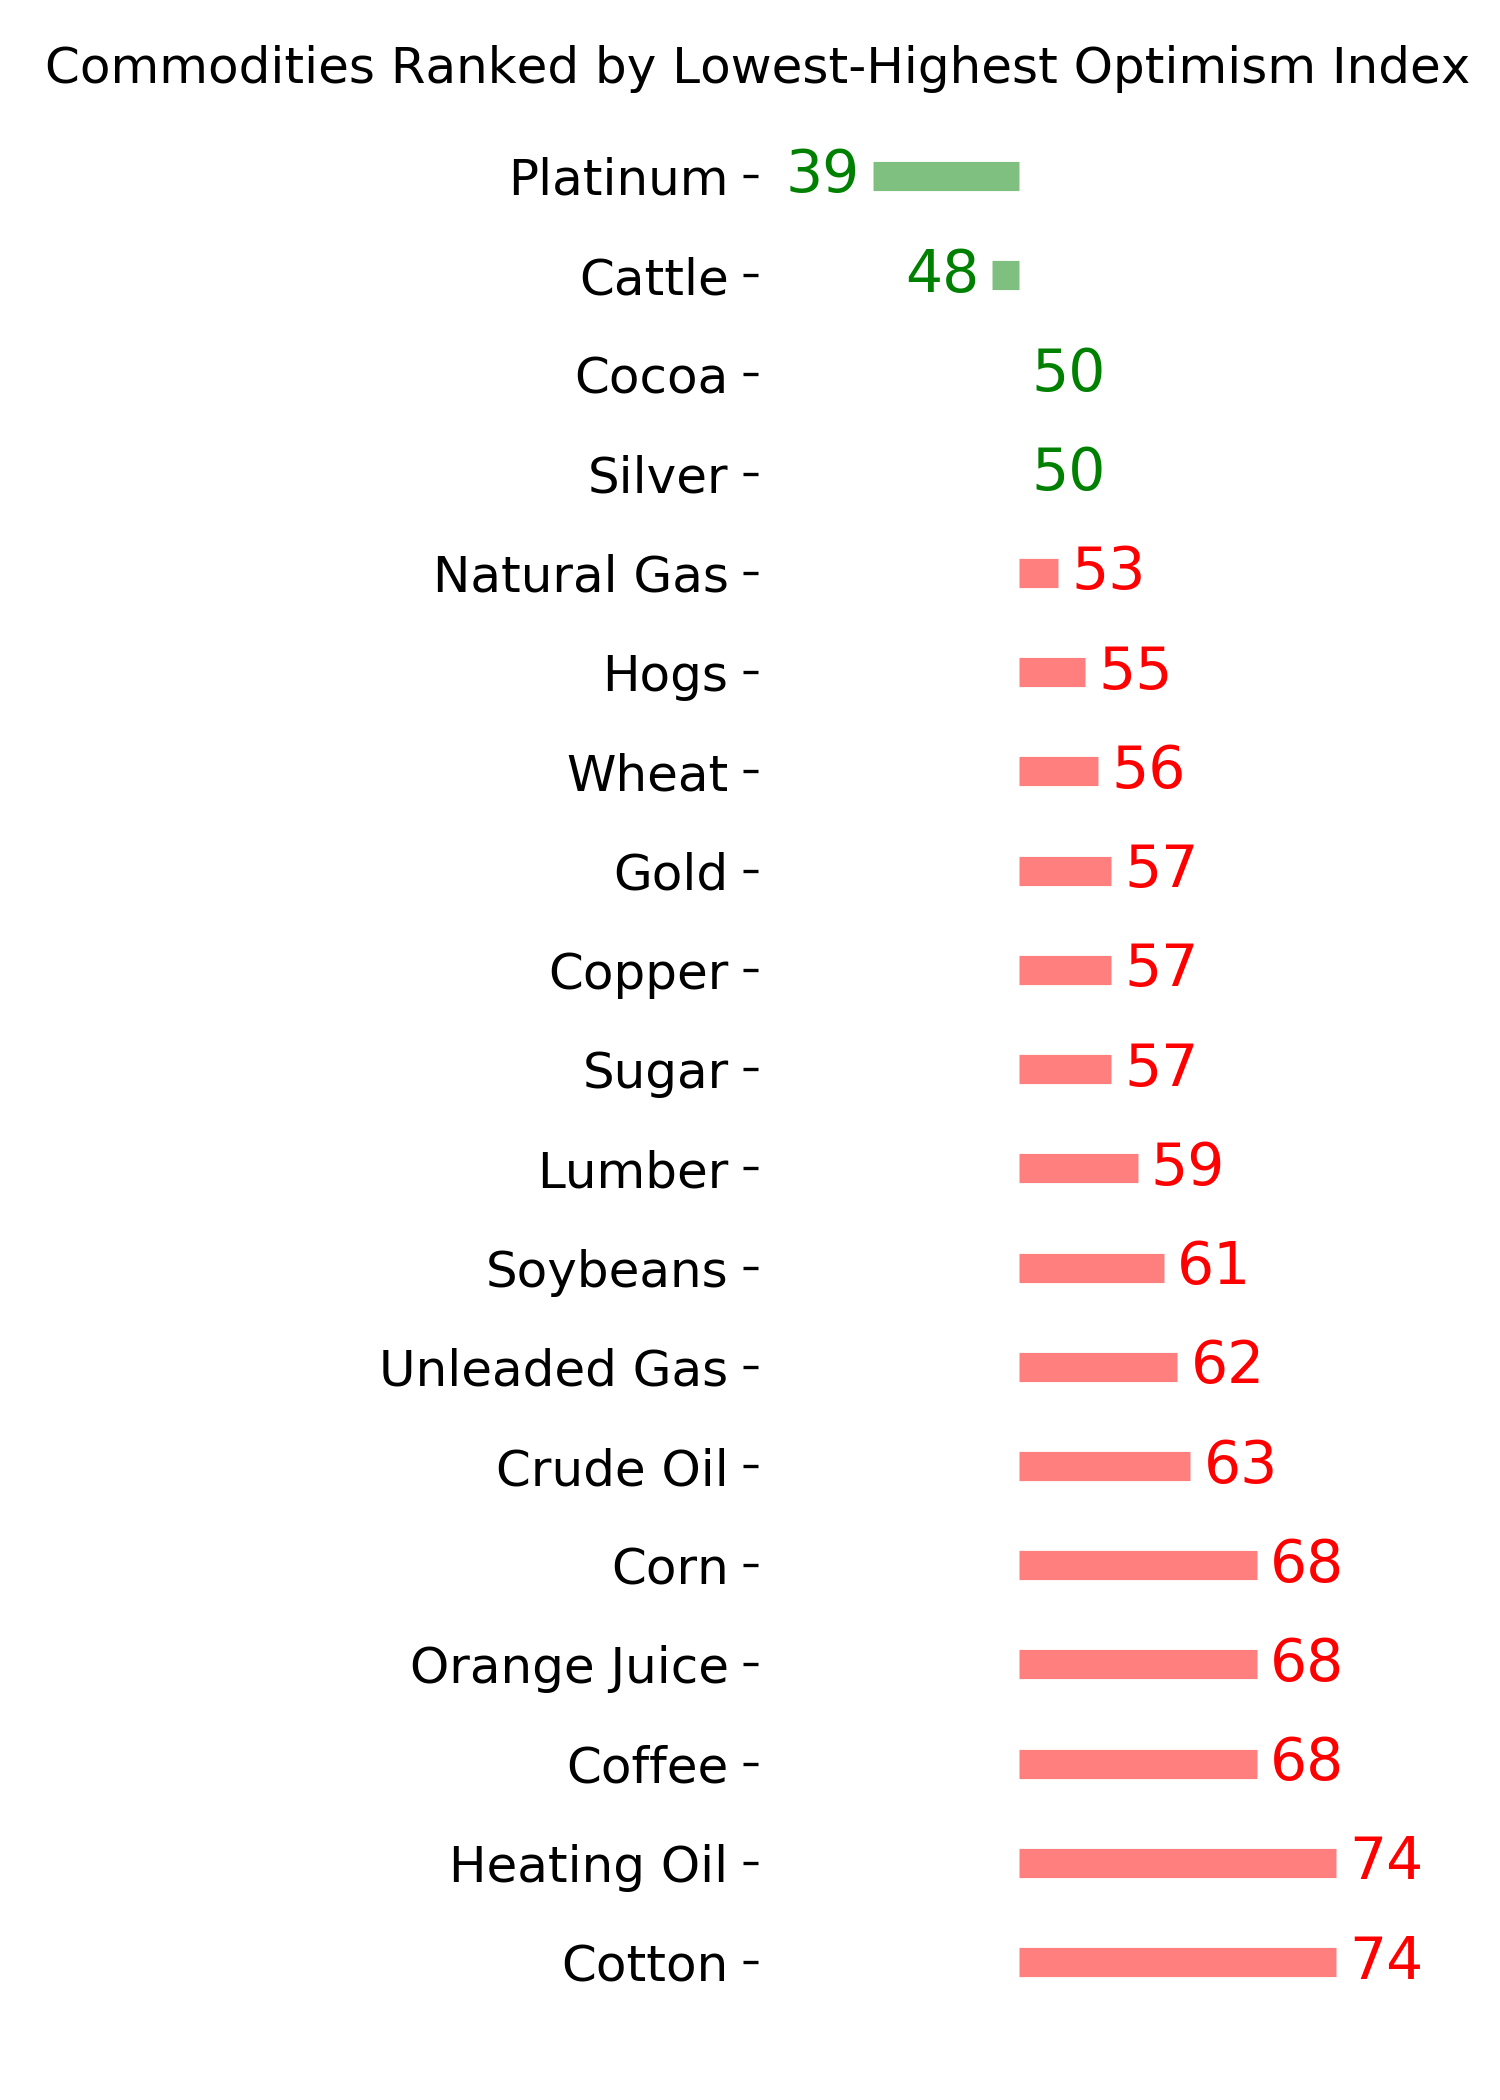
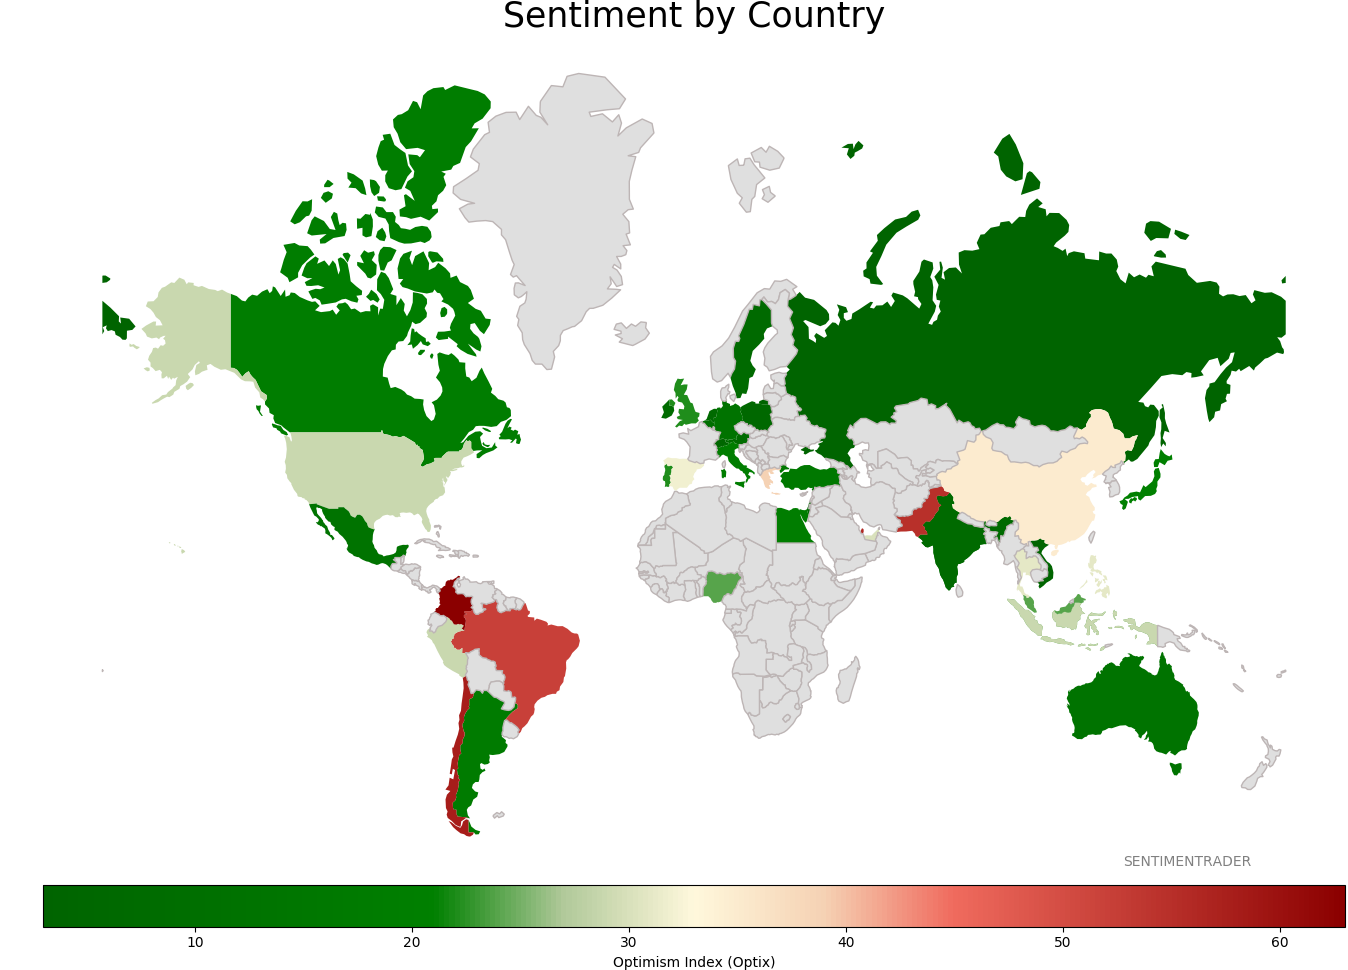
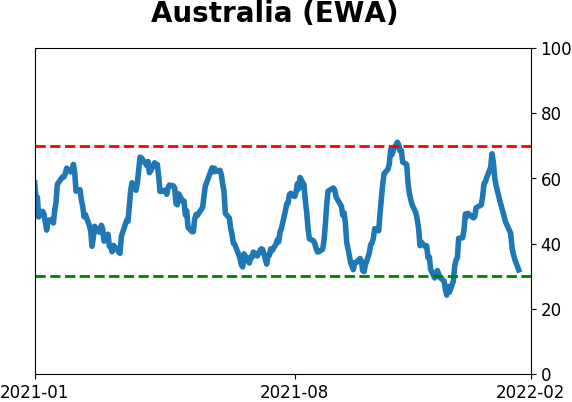
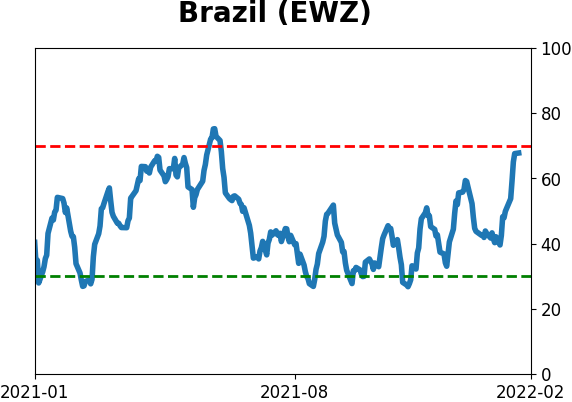
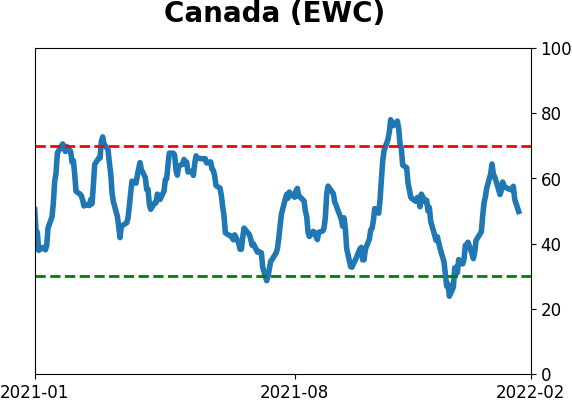
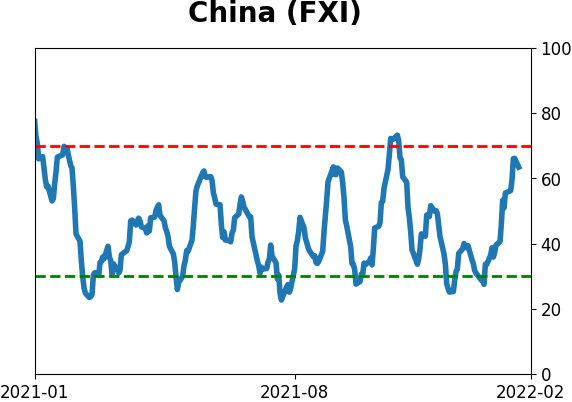
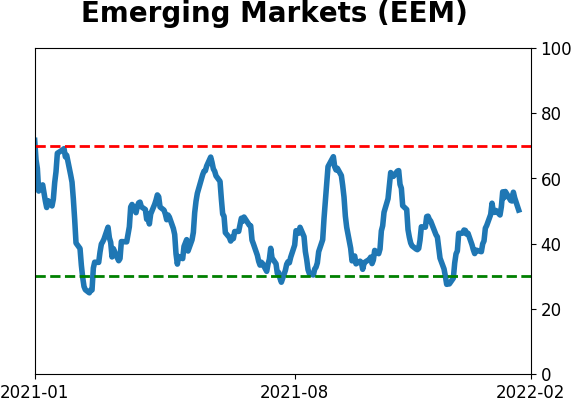
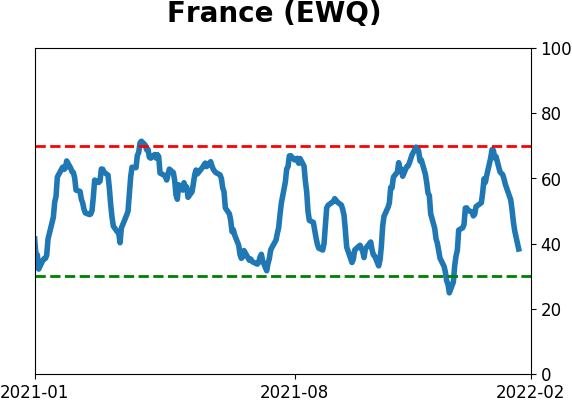
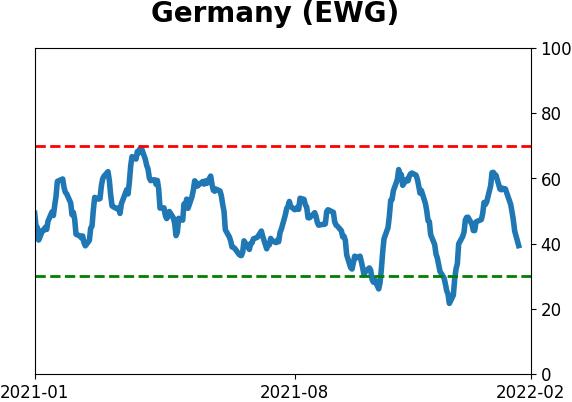
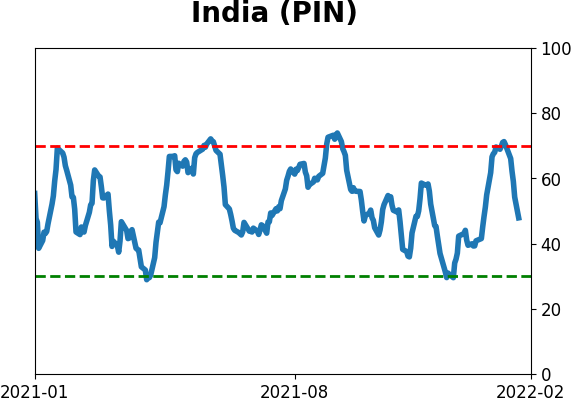
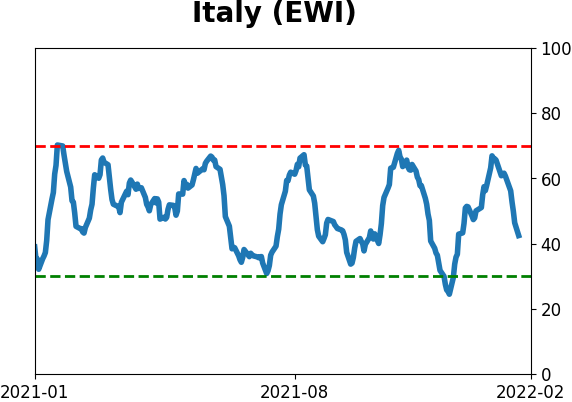
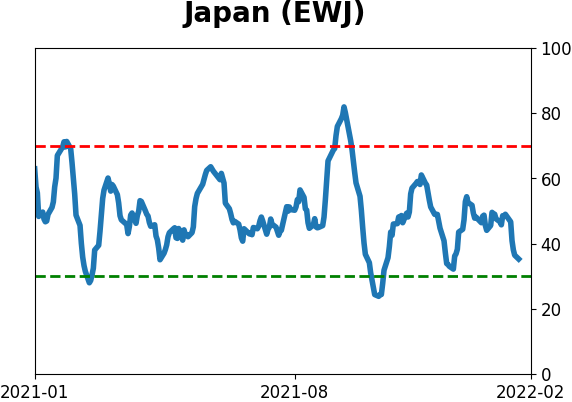
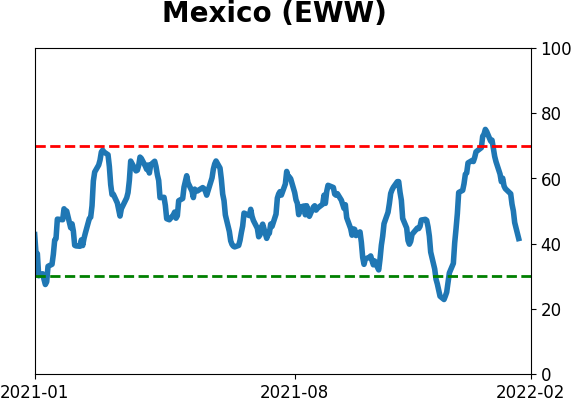
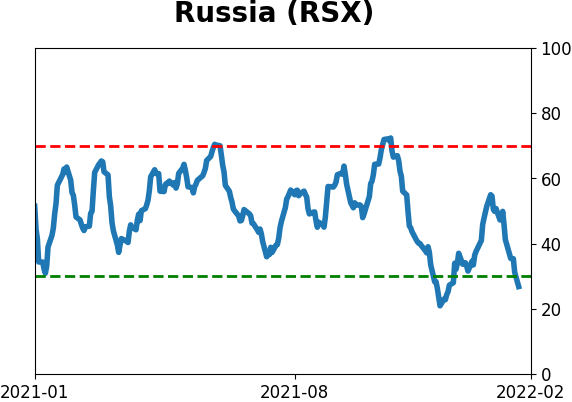
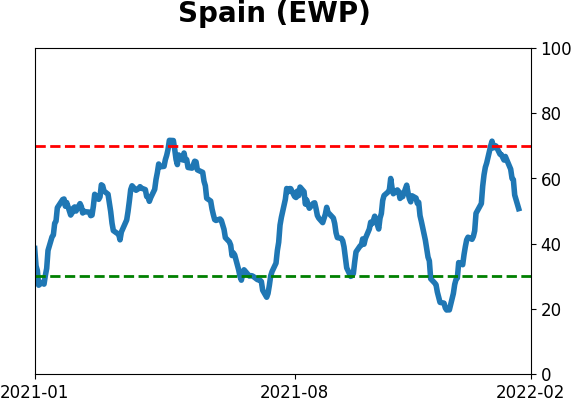
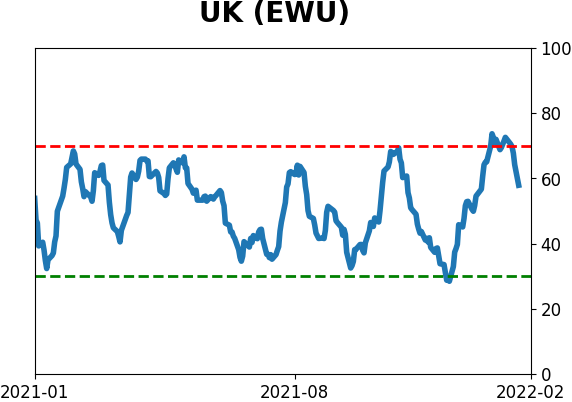
Sentiment Around The World
Optimism Index Thumbnails
|
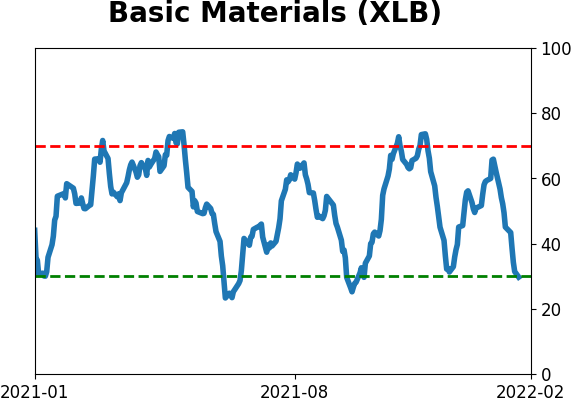
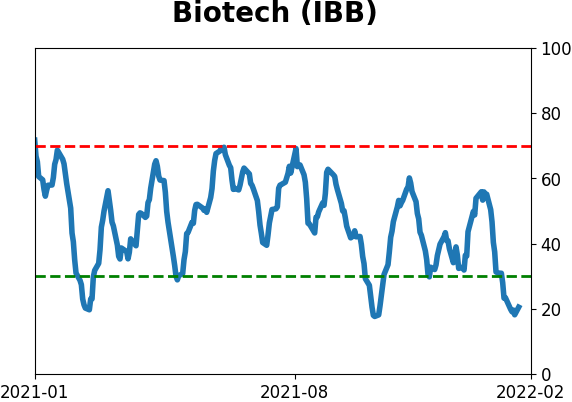
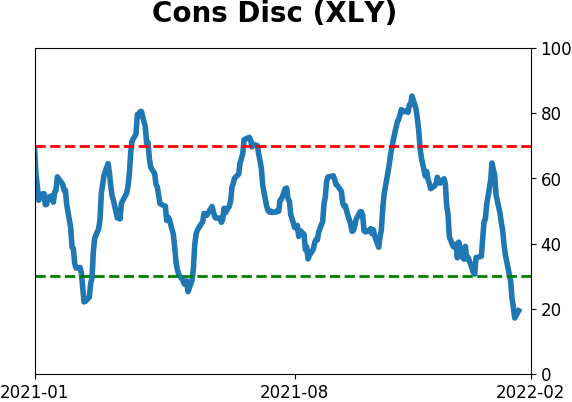
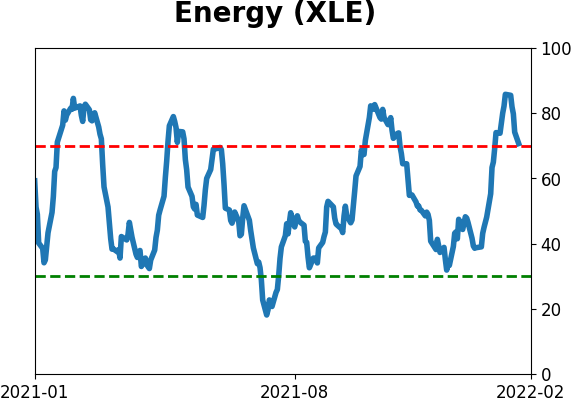
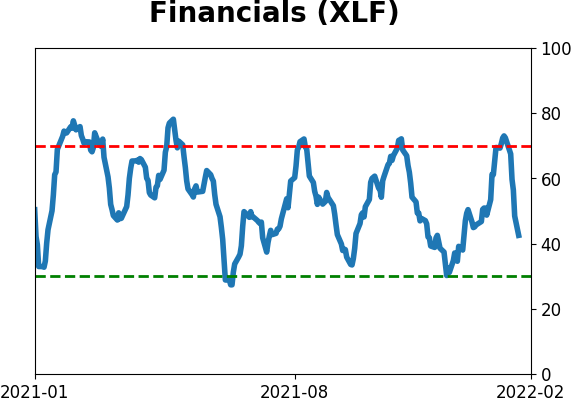
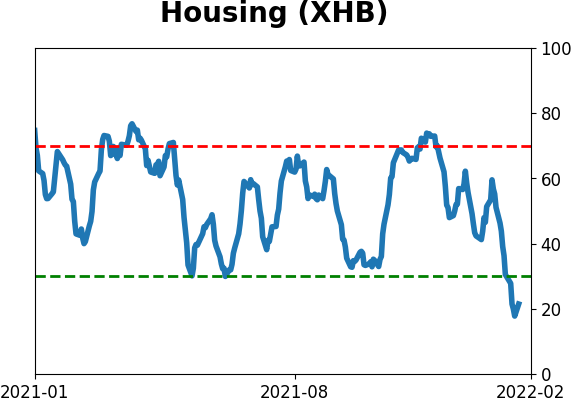
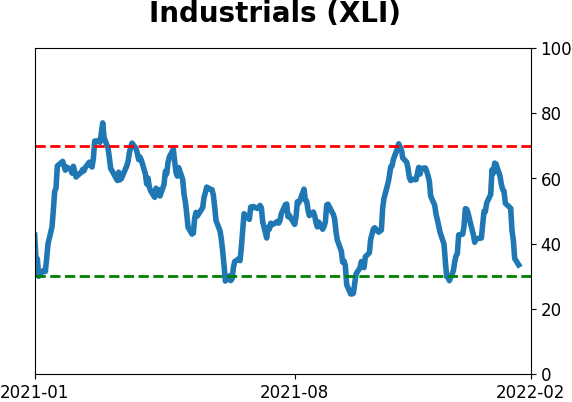
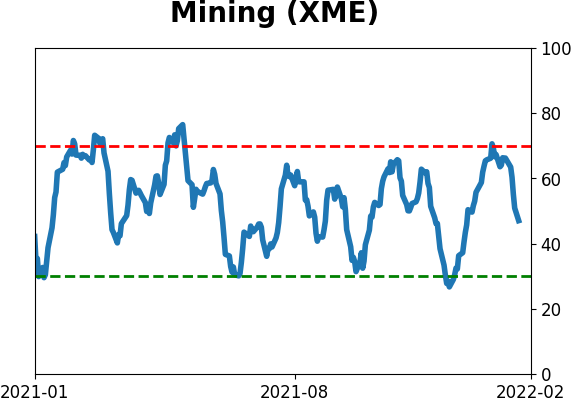
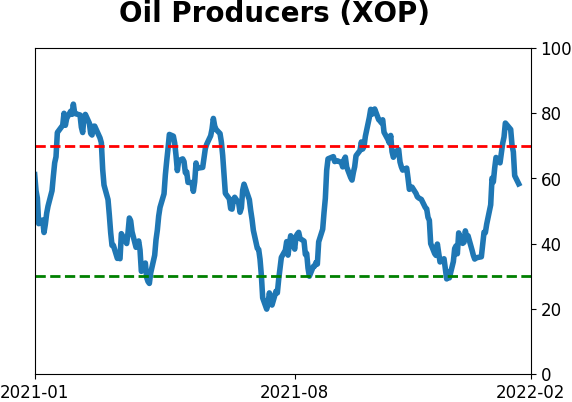
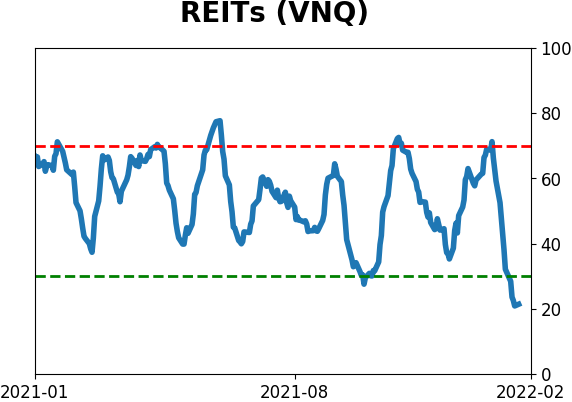
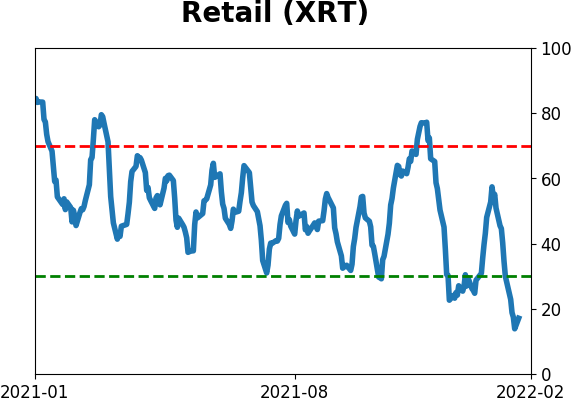
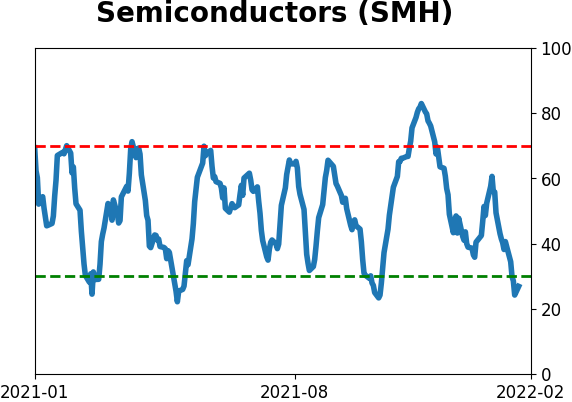
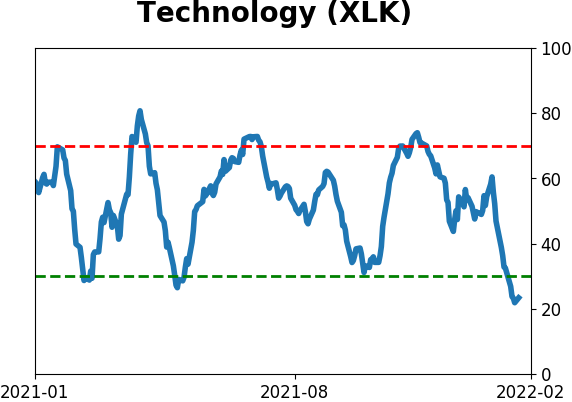
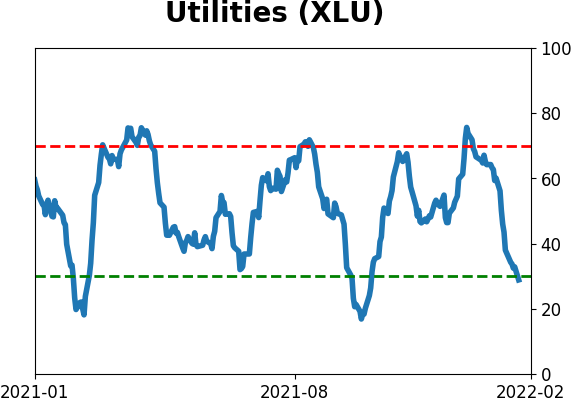
Sector ETF's - 10-Day Moving Average
|
|
|
Country ETF's - 10-Day Moving Average
|
|
|
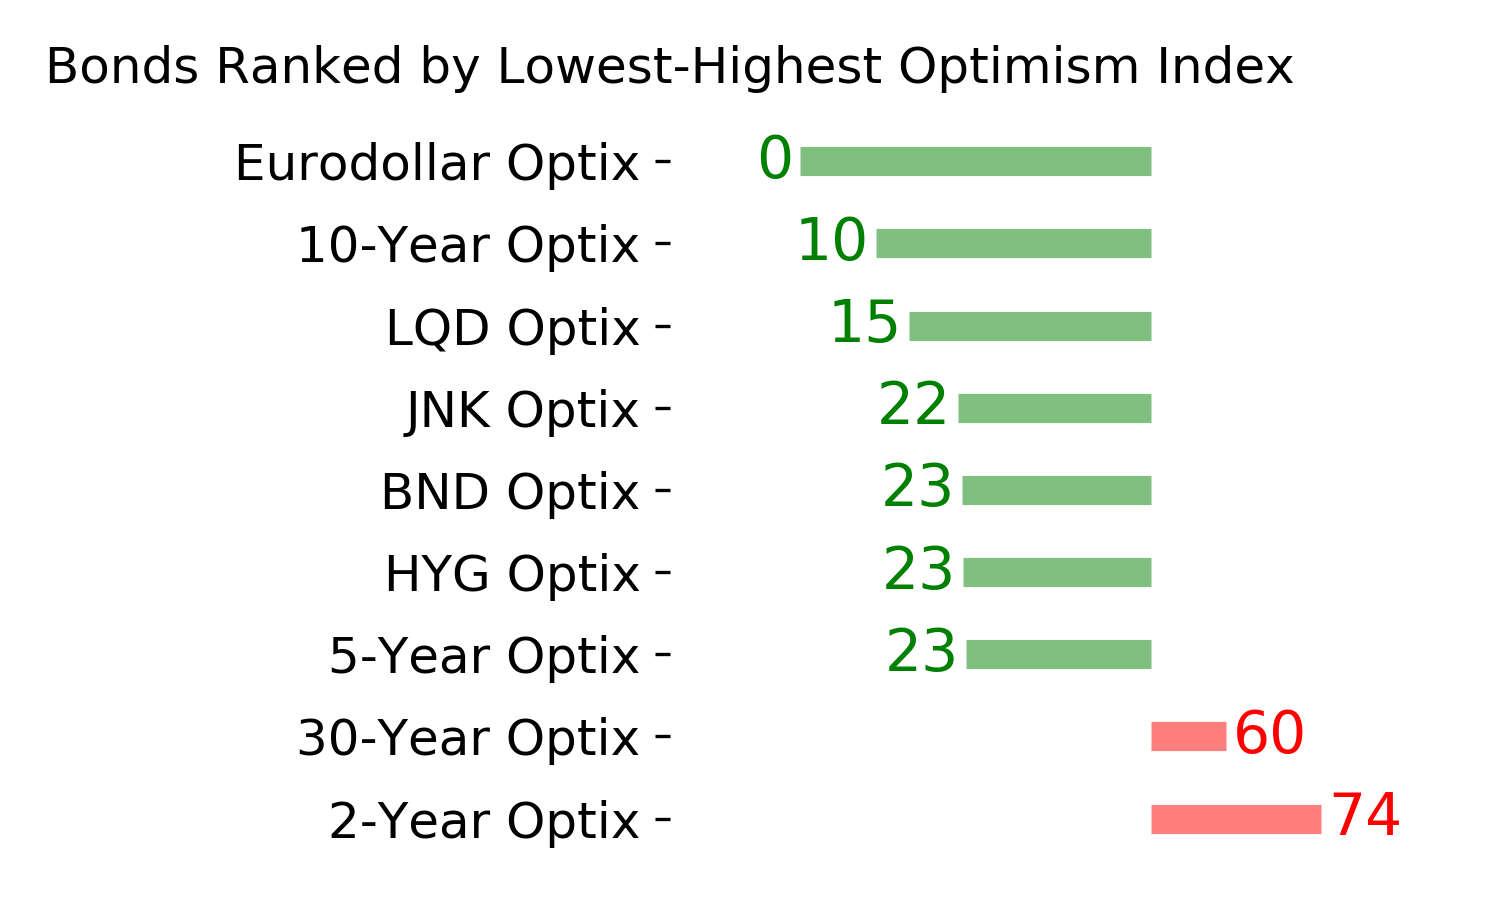
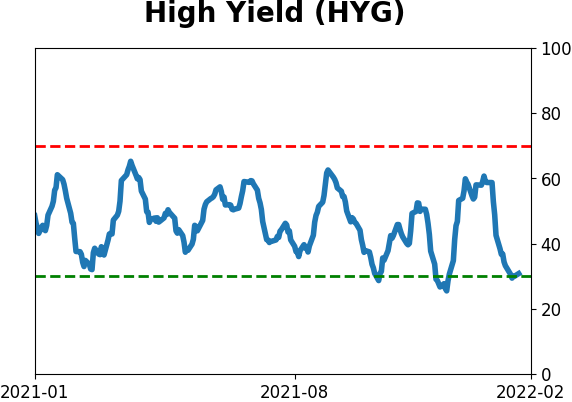
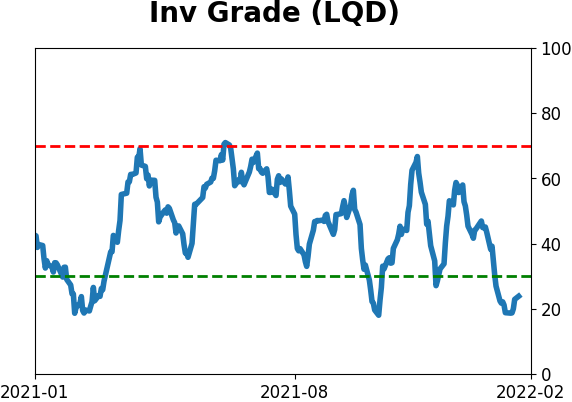
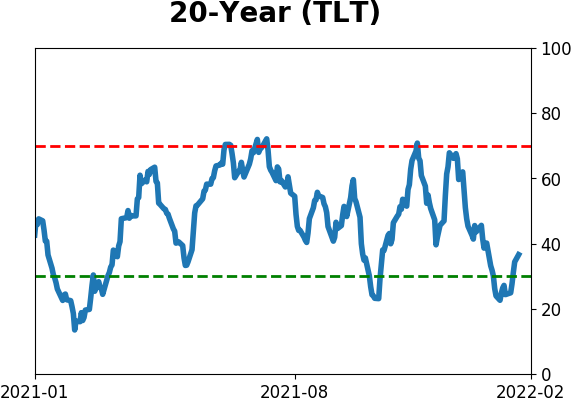
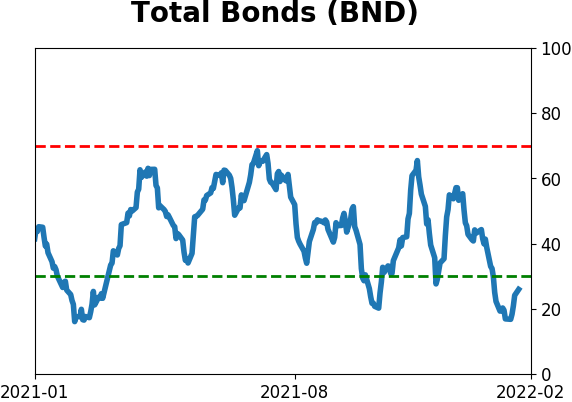
Bond ETF's - 10-Day Moving Average
|
|
|
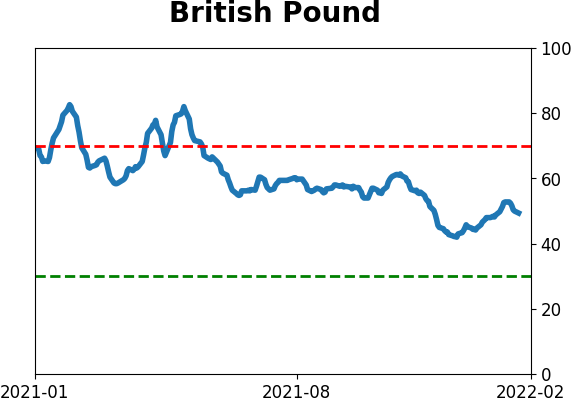
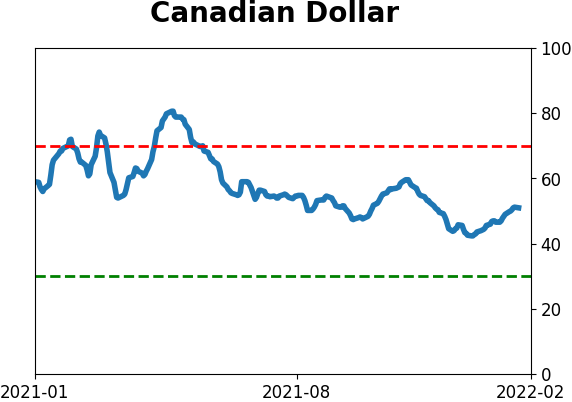
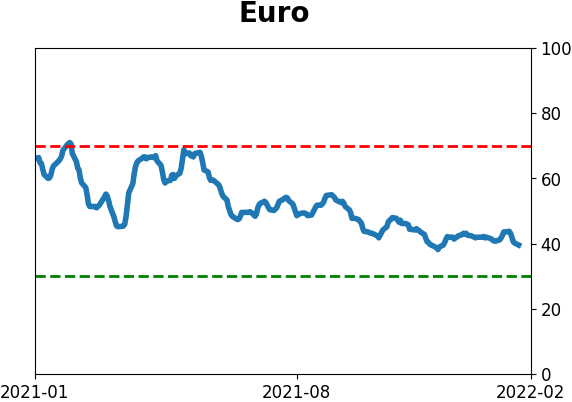
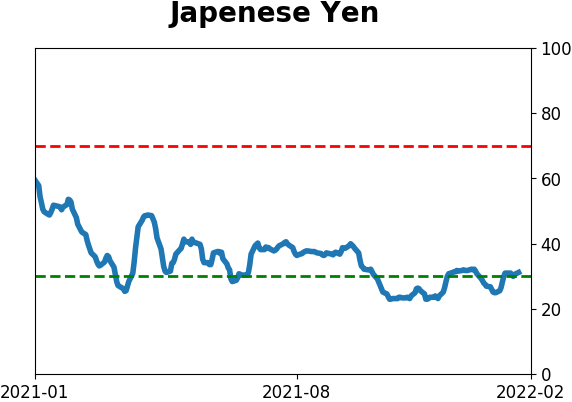
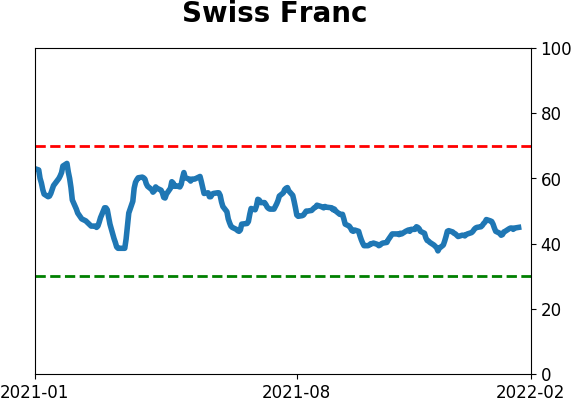
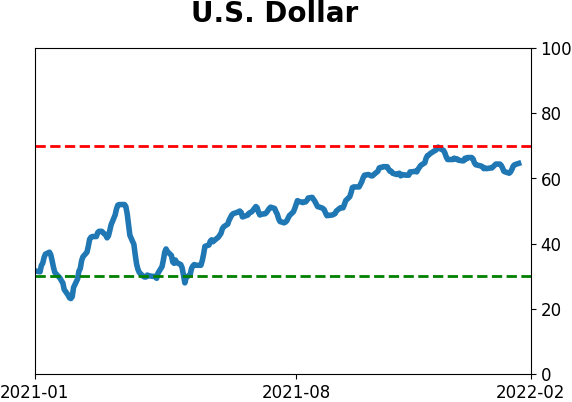
Currency ETF's - 5-Day Moving Average
|
|
|
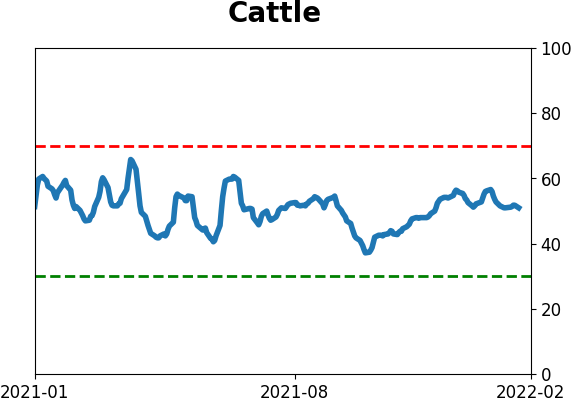
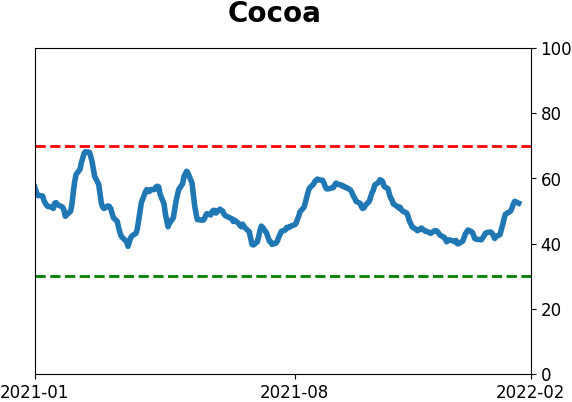
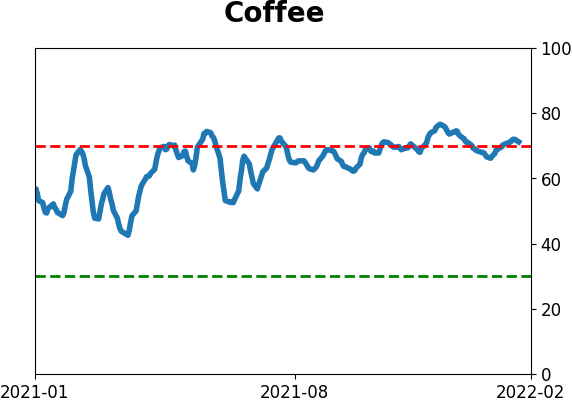
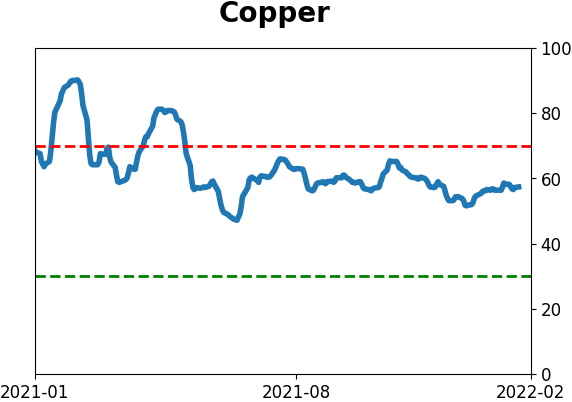
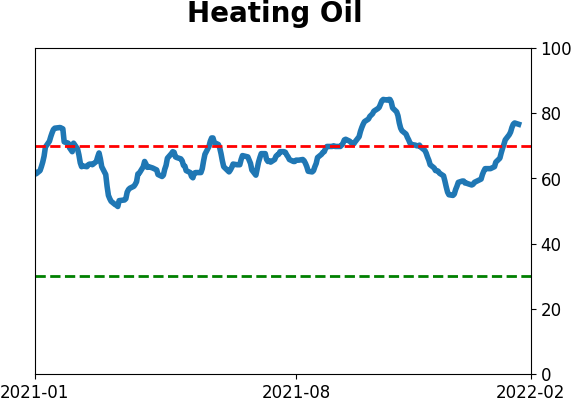
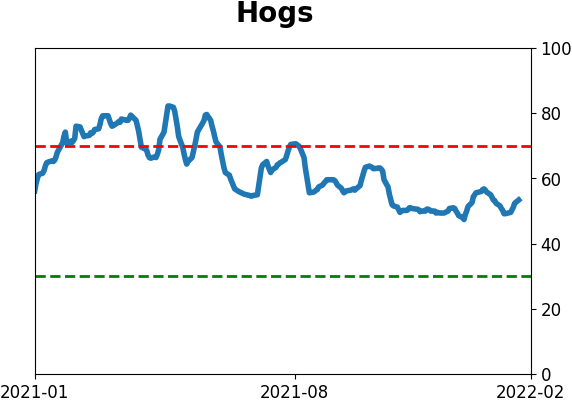
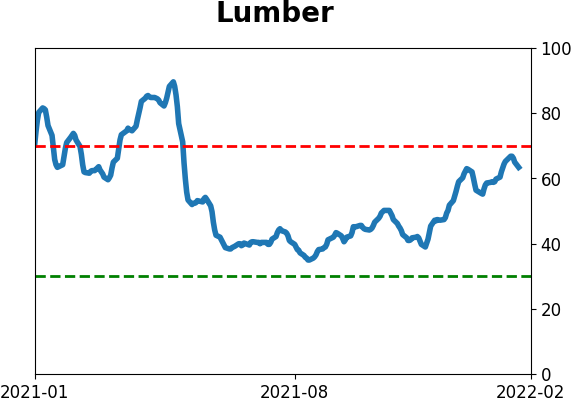
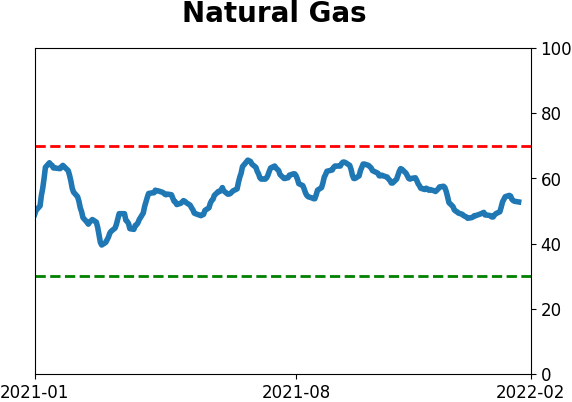
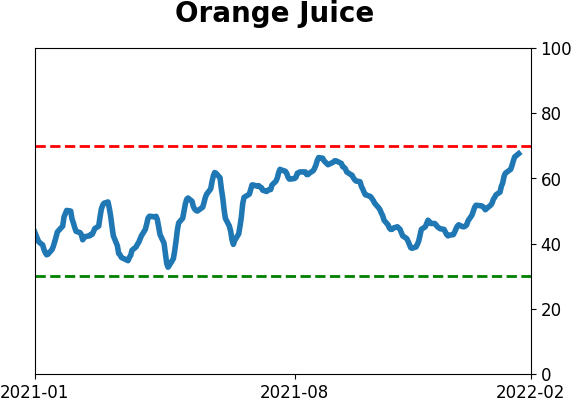
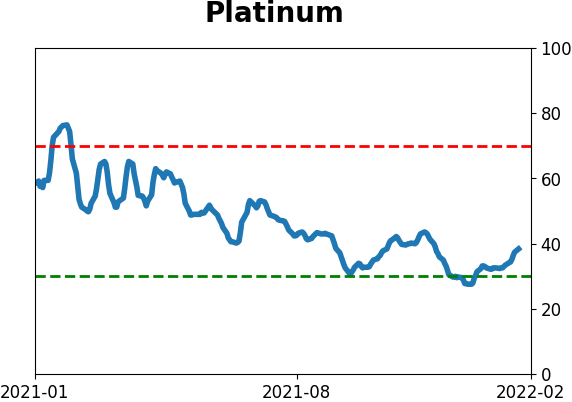
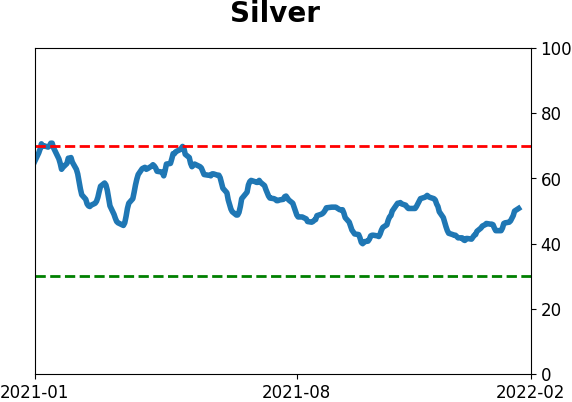
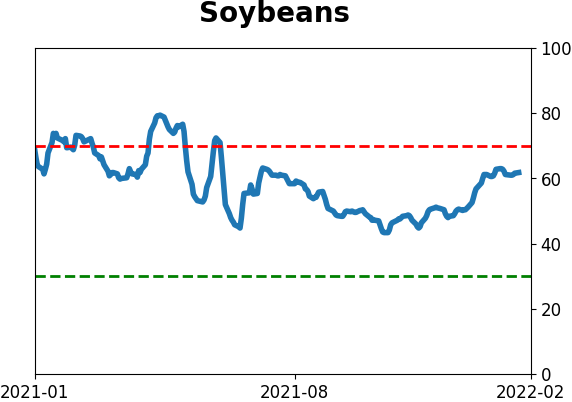
Commodity ETF's - 5-Day Moving Average
|
|