Headlines
|
|
Nasdaq nears record new lows as hedging activity spikes:
With Monday's tumble, more than 30% of stocks on the Nasdaq have now hit a 52-week low, one of the highest readings in 25 years. Options activity shows a huge spike in hedging activity, which has pushed Gamma Exposure to the opposite extreme seen at the speculative peaks.
|
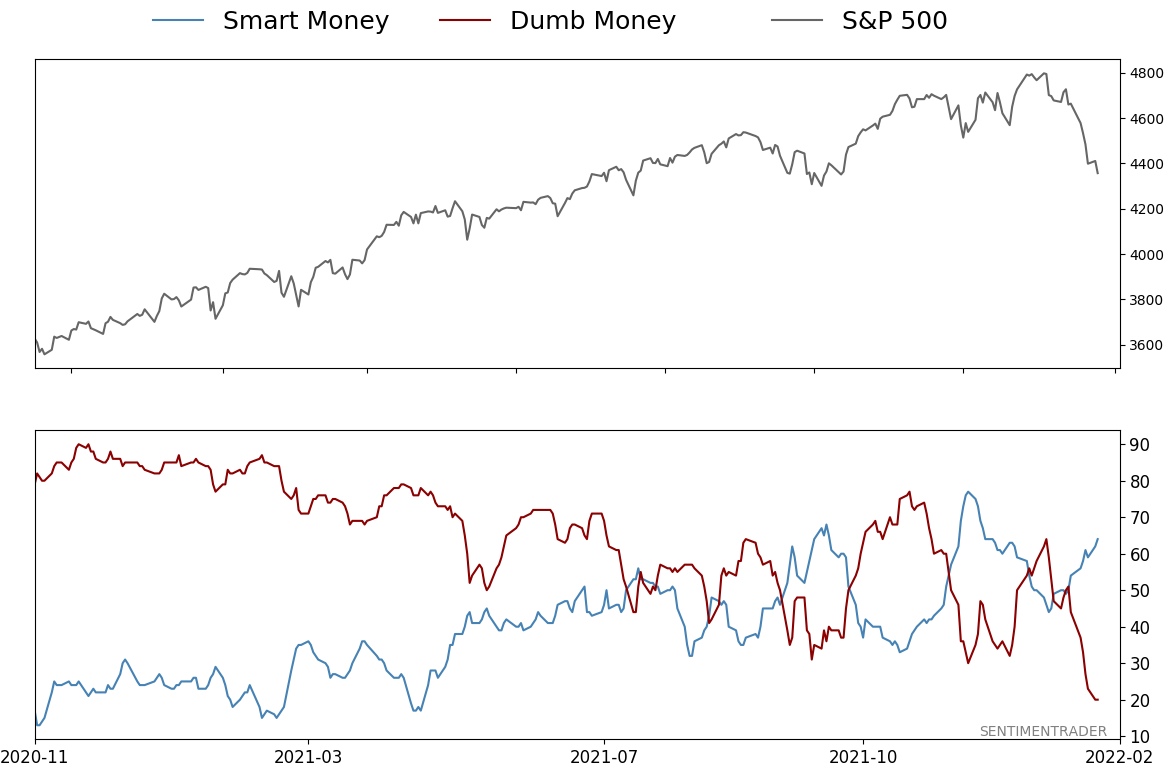
Smart / Dumb Money Confidence
|
Smart Money Confidence: 64%
Dumb Money Confidence: 20%
|
|
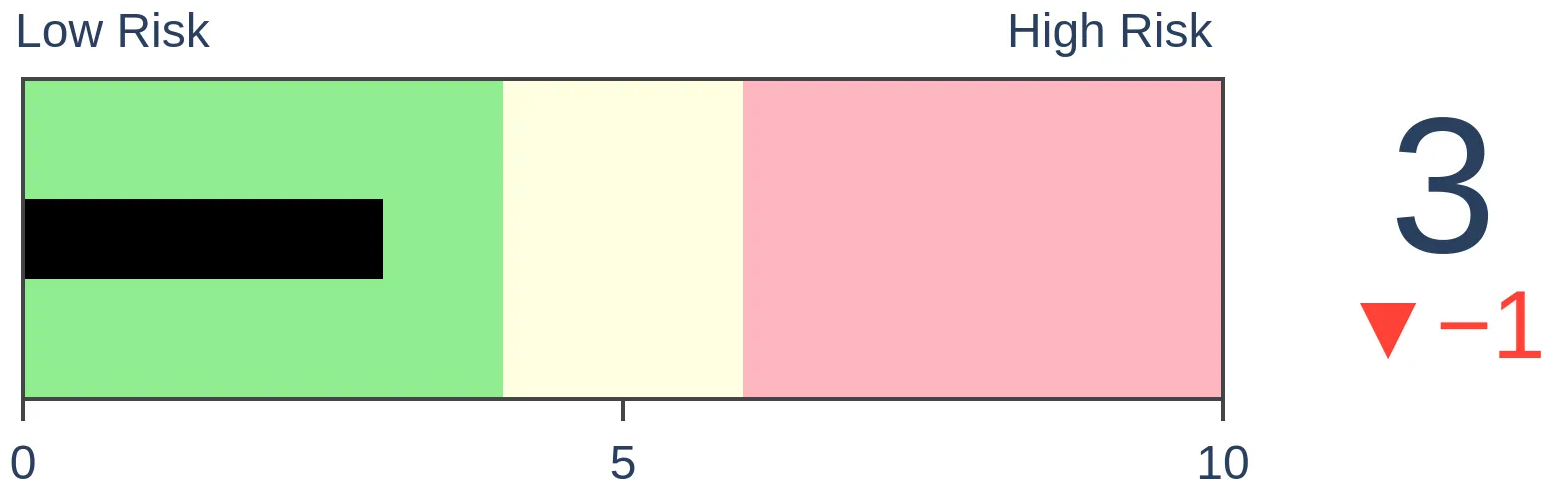
Risk Levels
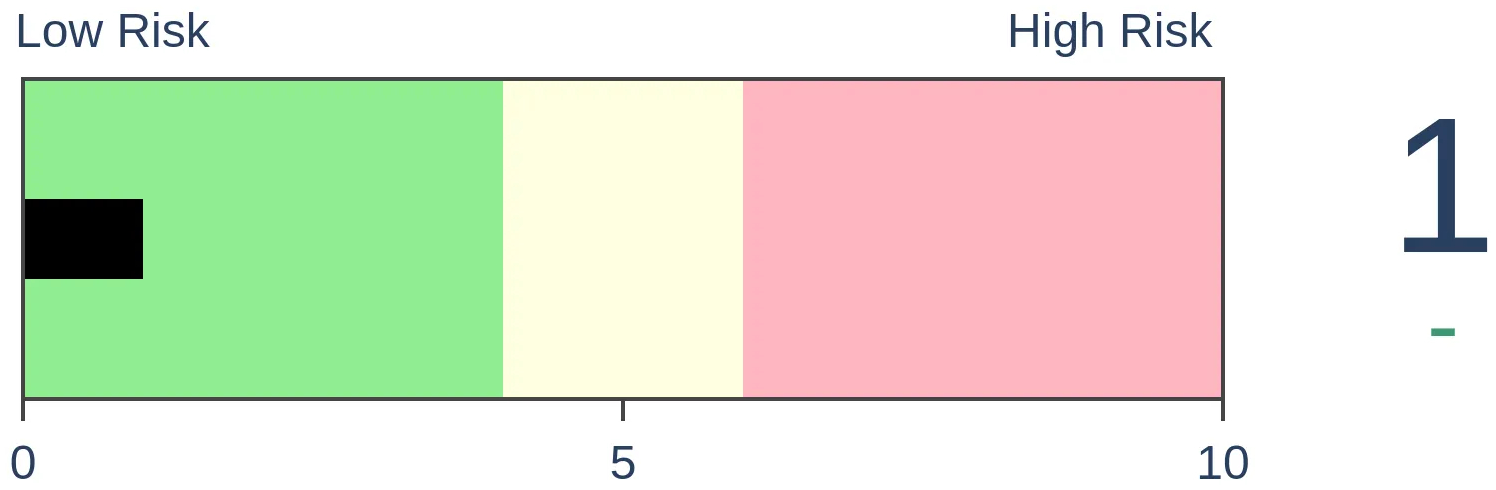
Stocks Short-Term
|
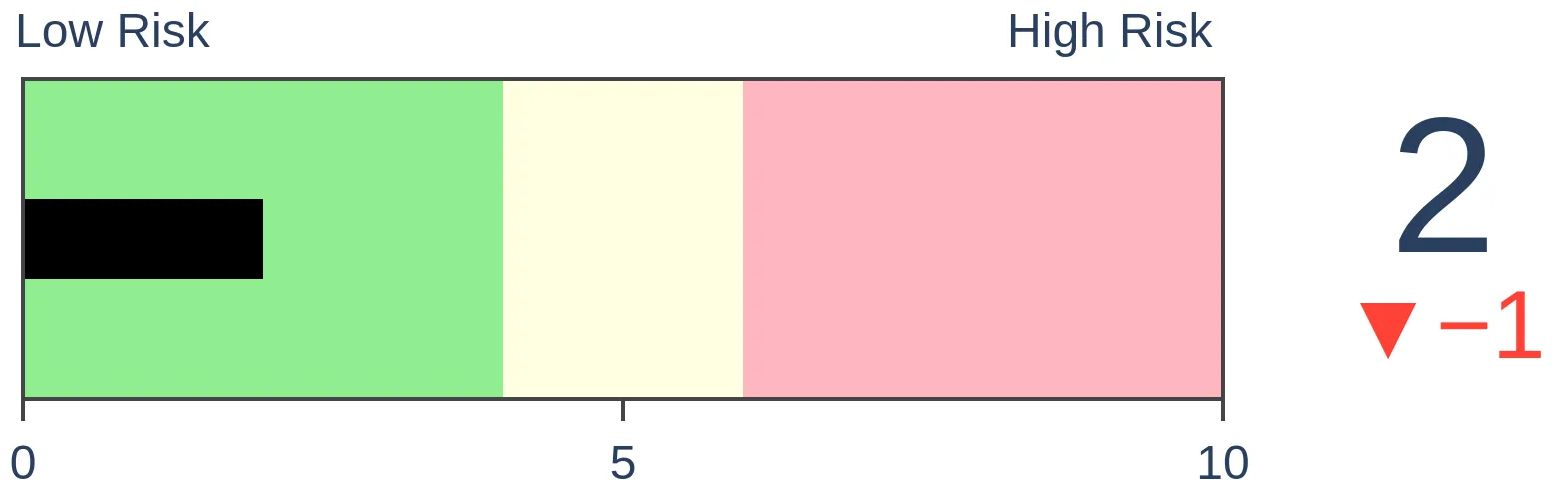
Stocks Medium-Term
|
|
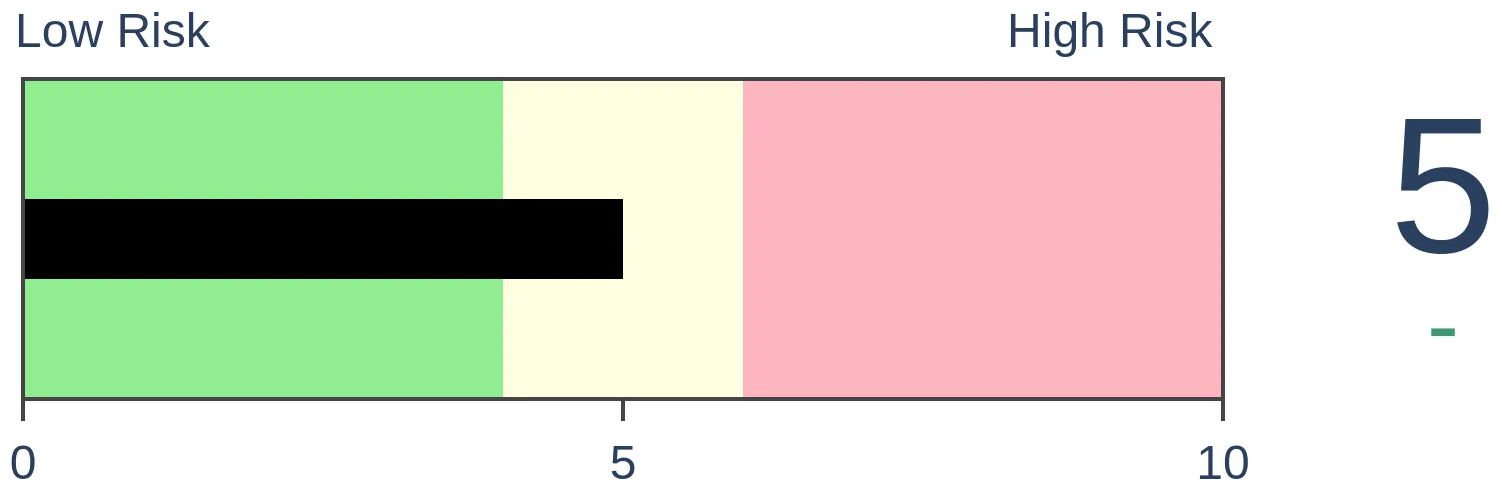
Bonds
|
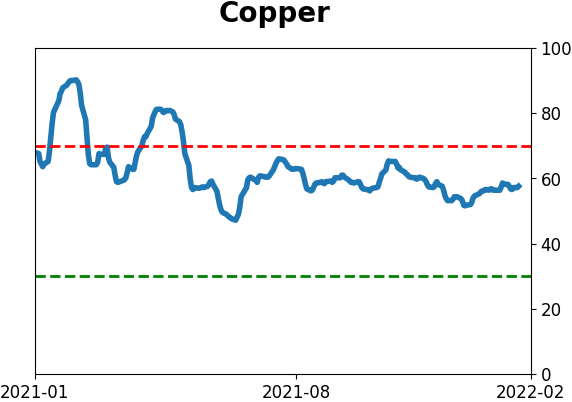
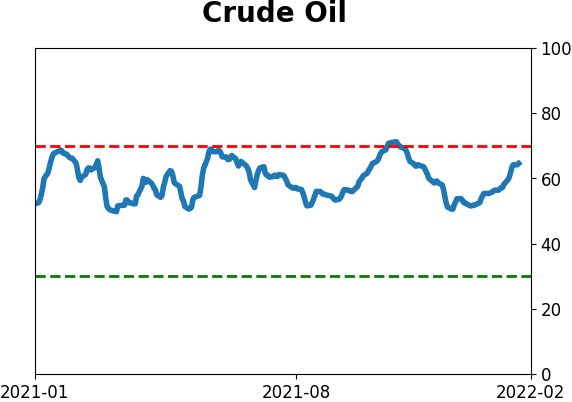
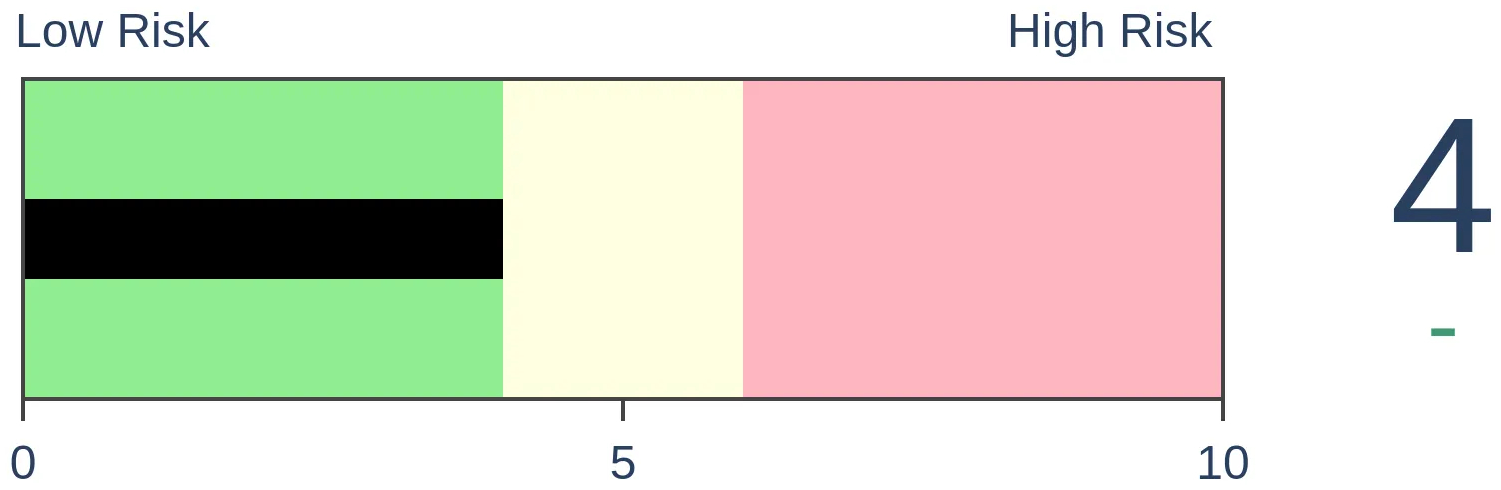
Crude Oil
|
|
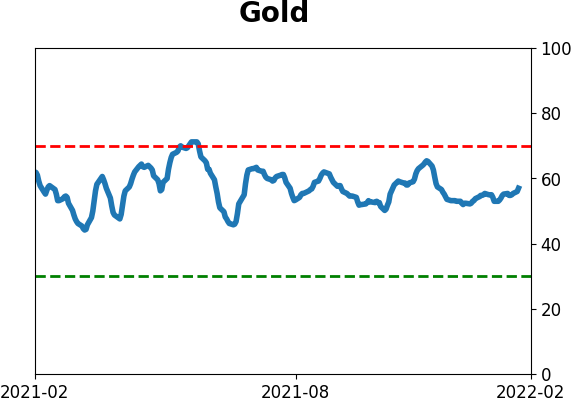
Gold
|
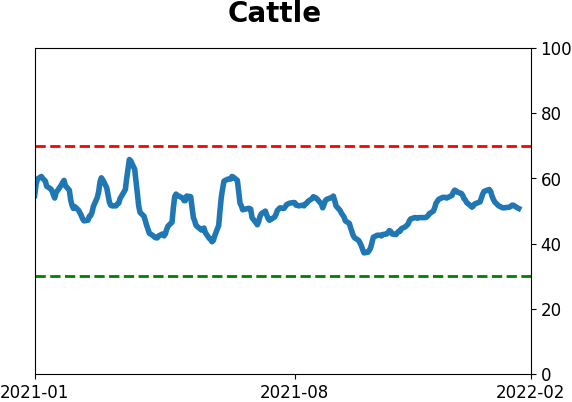
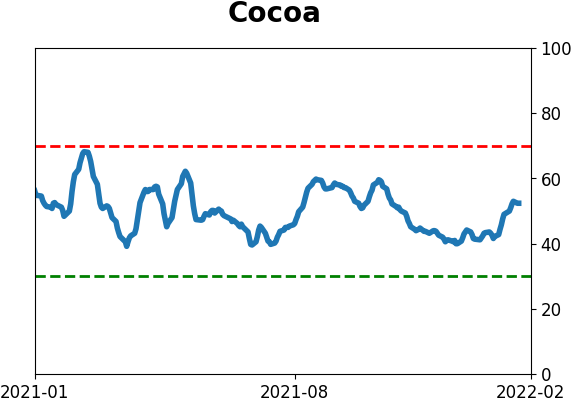
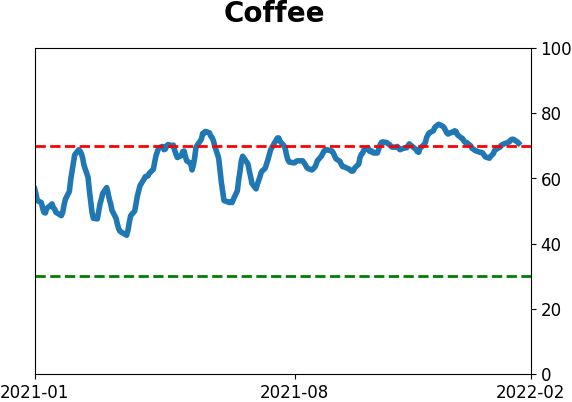
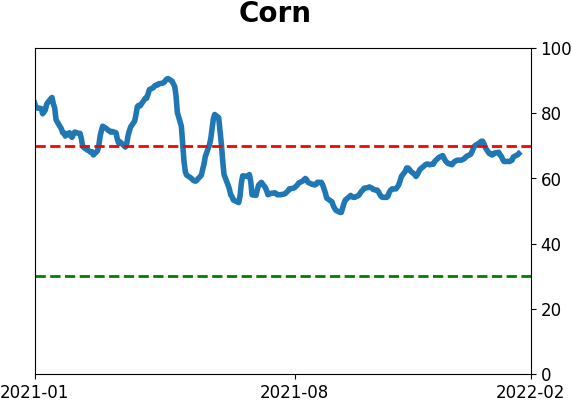
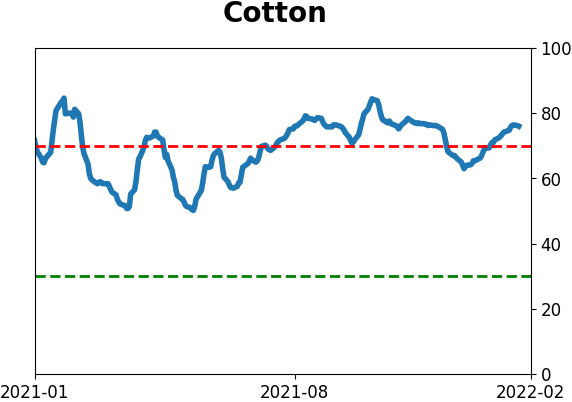
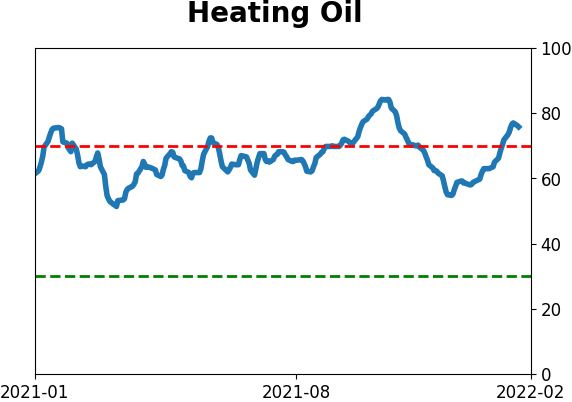
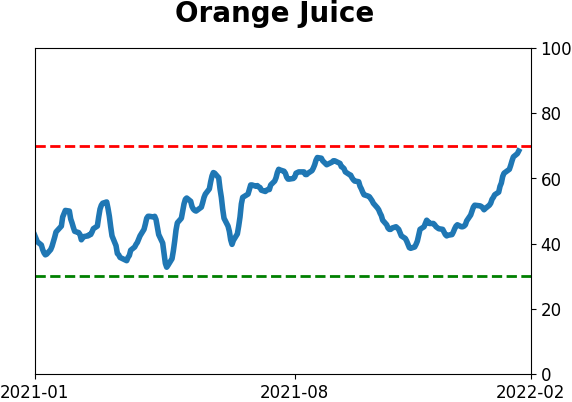
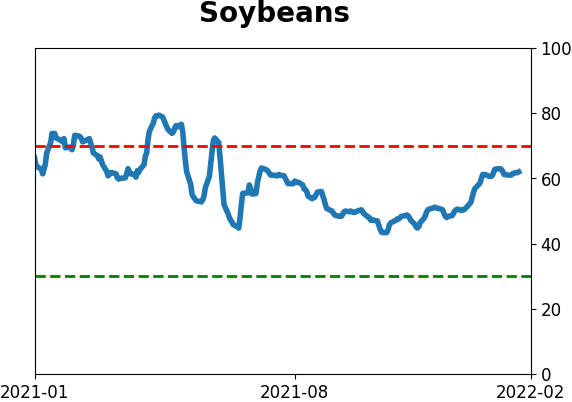
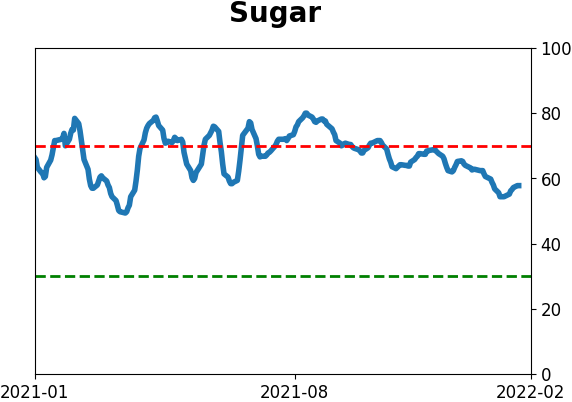
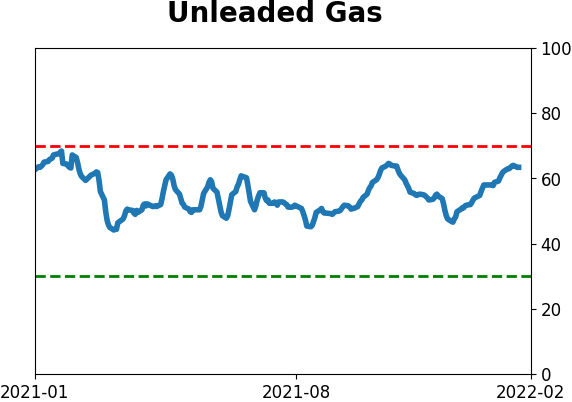
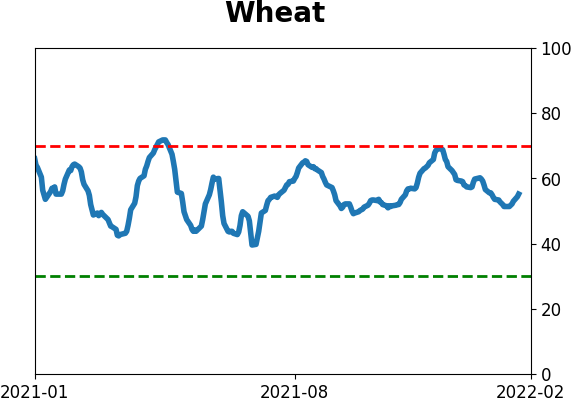
Agriculture

|
|
Research
By Jason Goepfert
BOTTOM LINE
With Monday's tumble, more than 30% of stocks on the Nasdaq have now hit a 52-week low, one of the highest readings in 25 years. Options activity shows a huge spike in hedging activity, which has pushed Gamma Exposure to the opposite extreme seen at the speculative peaks.
FORECAST / TIMEFRAME
None
|
Key points:
- More than 30% of Nasdaq stocks have now hit a 52-week low
- Hedging activity is skyrocketing in the options market, driven in large part by small traders
- Gamma Exposure shows potential institutional buying ahead
Nearly a third of Nasdaq stocks at new lows
First, a quick update. Despite Monday's reversal, many more stocks on the Nasdaq exchange touched a 52-week low during the day. Updating the chart from yesterday's note, now 30% of stocks on the exchange have plunged to that extreme on the same day. That's the 18th-highest figure since 1996.
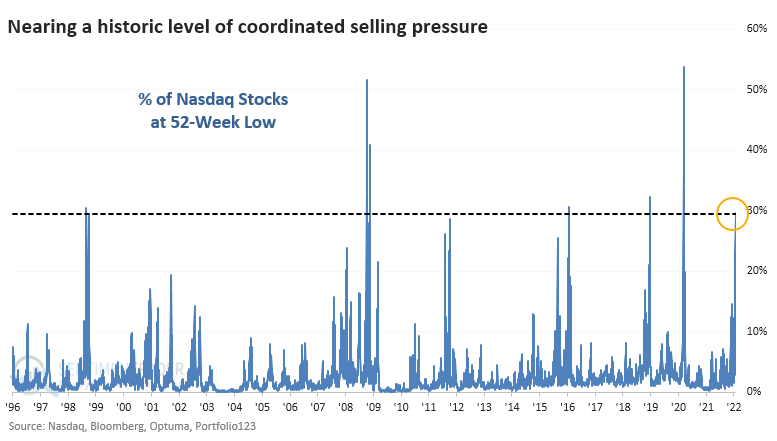
Even though this was exceeded before the final plunges in 2008 and 2020, the Nasdaq Composite's forward returns were impressive. Over the next year, the Nasdaq showed a gain all 17 times, sporting a massive median return of +57.2%.
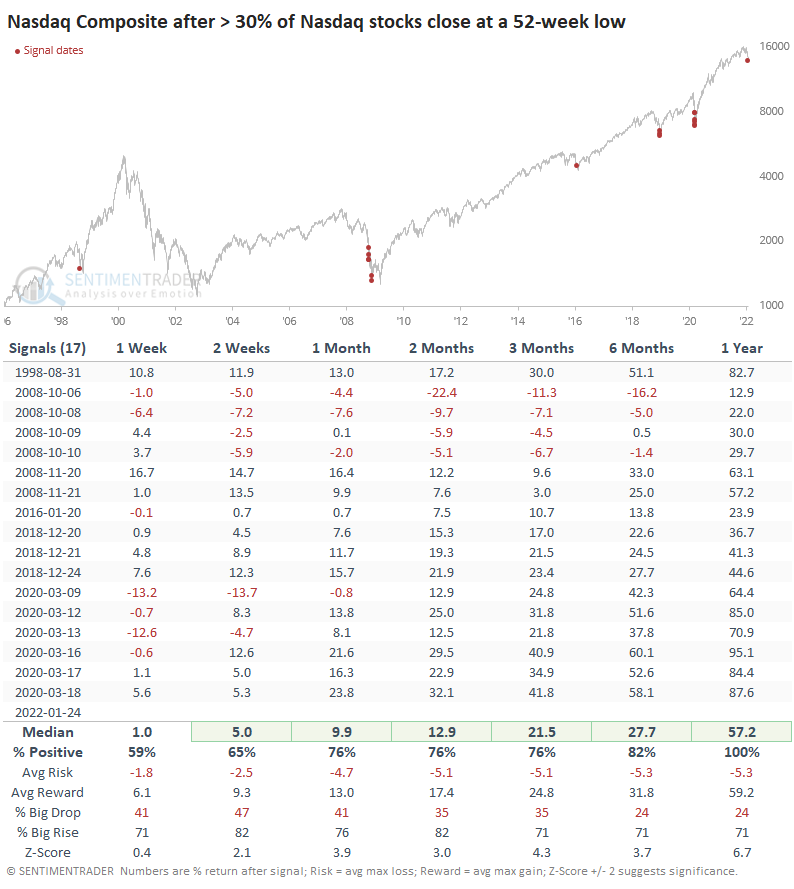
Buying a Nasdaq index off an extreme like this caused some excruciating short-term losses during the worst of the panics, and a more conservative approach would be to wait until the panic subsides and, say, fewer than 20% of stocks fell to a 52-week low. That wouldn't have prevented all losses, and it would have meant missing the ultimate bottom, but it also would have meant avoiding the worst of the short-term waterfall declines.
A surge in hedging activity
We focused on the historic level of speculative activity in the options market early last year. In all available data, we'd never seen risk-seeking behavior like that. Since then, many of the riskiest securities have been cut in half.
We've also seen the curious behavior of traders quickly turning bearish or trying to hedge on smaller and smaller declines. This is probably just an outgrowth of the increased level of market participation among investors. Whatever the reason, they're quick to pay for protection when stocks drop.
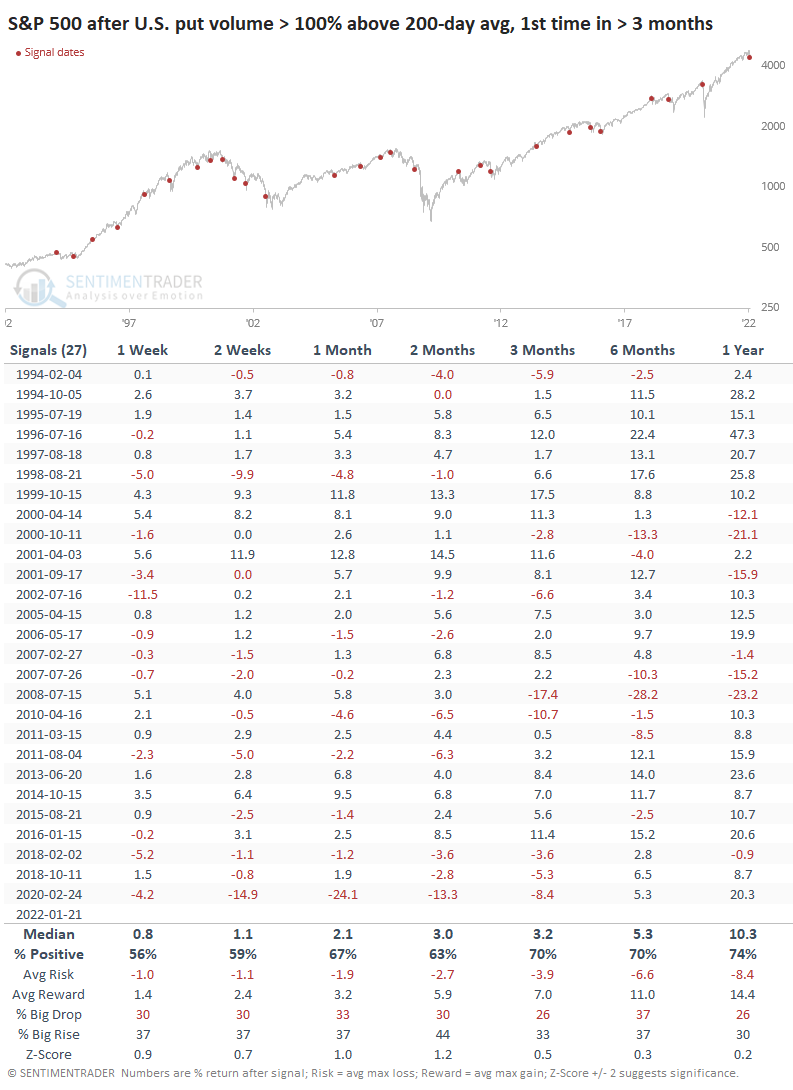
That was indeed the case last week. Heading into the weekend, there had never been more put options traded on U.S. exchanges. Protective put volume was more than 100% higher than the average of the past 200 days.
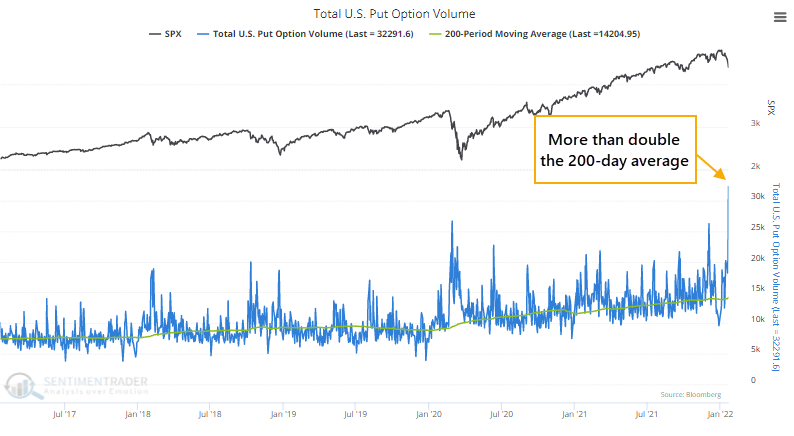
People seem to want everything to be a contrary indicator, but this wasn't necessarily the case. The first time put volume was more than double its 200-day average for the first time in several months, the S&P 500's returns going forward weren't anything special. It happened right before some of the worst declines in recent years, but overall, stocks rose more than declined after such spikes.
We prefer to focus on weekly data that more clearly shows who is doing what. On both the bullish and bearish sides, we've found the most value in watching opening transactions among the smallest of traders.
Last week, they spent 27% of their volume purchasing put options to open (meaning not closing out a previous trade). That's one of the highest readings in the past 20 years. The Backtest Engine shows that high levels of put buying tended to lead to positive returns in the S&P 500 over the next 2-to 3 months.
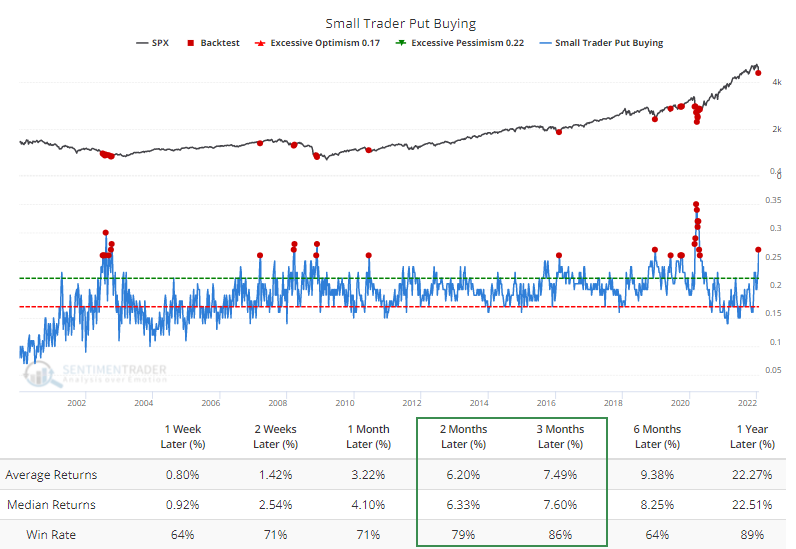
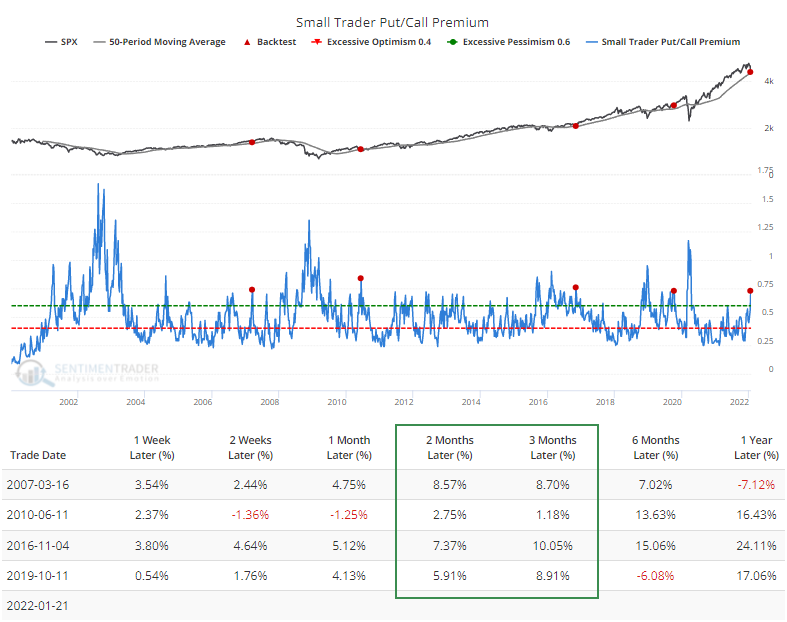
We also like to watch how much traders pay for this protection relative to what they spend on speculative upside bets. Last week, the amount they spent on hedges accounted for nearly 75% of the premiums paid on calls. That's high but has gotten much higher. They've spent more on puts than calls at times of pure wild-eyed panic.
Even so, the Backtest Engine shows that there were only 4 other times traders paid up so much for protection when the S&P 500 was still trading above its rising 50-week moving average.
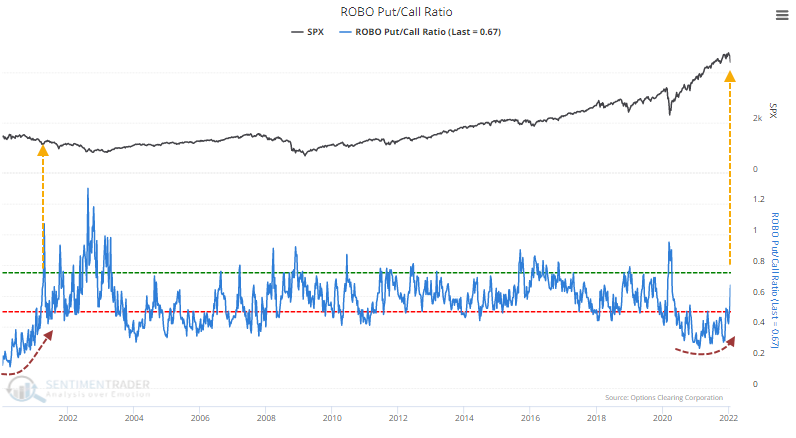
When we look at the number of puts bought to open versus calls bought to open for the smallest traders, it's only back to neutral territory. The ROBO Put/Call Ratio is the highest since April 2020, but that's not saying much. It's nowhere near an extreme that would suggest that traders are genuinely panicking.
The only precedent for a rise after a protracted period of shallow readings is March 2001. That led to a multi-week bounce, then a whole lot more pain and panic.
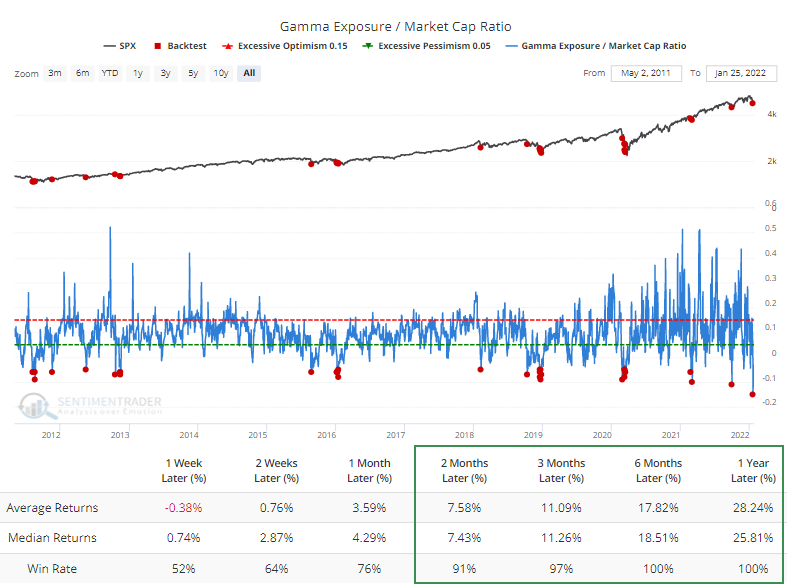
The Gamma Exposure / Market Cap Ratio shows a record reversal in the influences that were troubling during much of last year. When traders were buying call options hand over fist, the dealers taking the other side needed to buy stock to hedge. As options expired, dealers were exposed to market movements unless they sold their stock.
Now, we're seeing the opposite influence as traders buy put options.
The Backtest Engine shows that 32 out of 33 days led to a rally in the S&P 500 over the next 3 months. Granted, the study period was dominated by a persistent bull market, so there was a big tailwind for longs.
What the research tells us...
We're at a highly tricky juncture. The market environment has turned unhealthy, but there are signs of widespread pessimism and pockets of outright panic. That makes this more like a 1998 kind of scenario, and a quick multi-day plunge can't be ruled out (well, nothing should be ruled out). We're quickly seeing more signs that the risk/reward skew over a 3-12 month time frame is turning positive. Still, again, the most significant risk is that the environment is now negative, and in those cases, sentiment can become much more pessimistic for much longer. About the best we can say is that for a medium time frame of 1-3 months, we should be near to a point where buys make more sense than sells.
Active Studies
| Time Frame | Bullish | Bearish | | Short-Term | 2 | 0 | | Medium-Term | 13 | 2 | | Long-Term | 13 | 5 |
|
Indicators at Extremes
Portfolio
| Position | Description | Weight % | Added / Reduced | Date | | Stocks | RSP | 10.8 | Reduced 9.1% | 2022-01-20 | | Bonds | 32.7% BND, 7.1% SCHP | 40.1 | Added 8.3% | 2021-10-26 | | Commodities | GCC | 2.4 | Reduced 2.1%
| 2020-09-04 | | Precious Metals | GDX | 4.6 | Reduced 4.2% | 2021-05-19 | | Special Situations | 8.1% KWEB, 3.6% XLE, 1.7% PSCE | 13.4 | Reduced 3.9% | 2022-01-18 | | Cash | | 28.0 | | |
|
Updates (Changes made today are underlined)
Not impressed at all with the market action since there was a breadth thrust at the end of December, with selling pressure hitting consistently since then. The drawdown is beyond what we've typically seen after similar thrusts. More and more indicators are showing risk-off sentiment, and the market environment is sketchy. I've reduced risk because of it. Bond sentiment is trying to recover from a recent bout of pessimism, and gold stocks are doing their thing which is not much at all. They've been flat for six months. Chinese tech stocks were doing exactly what they're supposed to do, then did *not* by plunging to new lows. This is troubling on a shorter-term time frame, but this was never meant for a trade, rather a multi-year investment. Recent behavior is troubling and I will not be adding any exposure as long as that's the case. RETURN YTD: -0.7% 2021: +8.7%, 2020: +8.1%, 2019: +12.6%, 2018: +0.6%, 2017: +3.8%, 2016: +17.1%, 2015: +9.2%, 2014: +14.5%, 2013: +2.2%, 2012: +10.8%, 2011: +16.5%, 2010: +15.3%, 2009: +23.9%, 2008: +16.2%, 2007: +7.8%
|
|
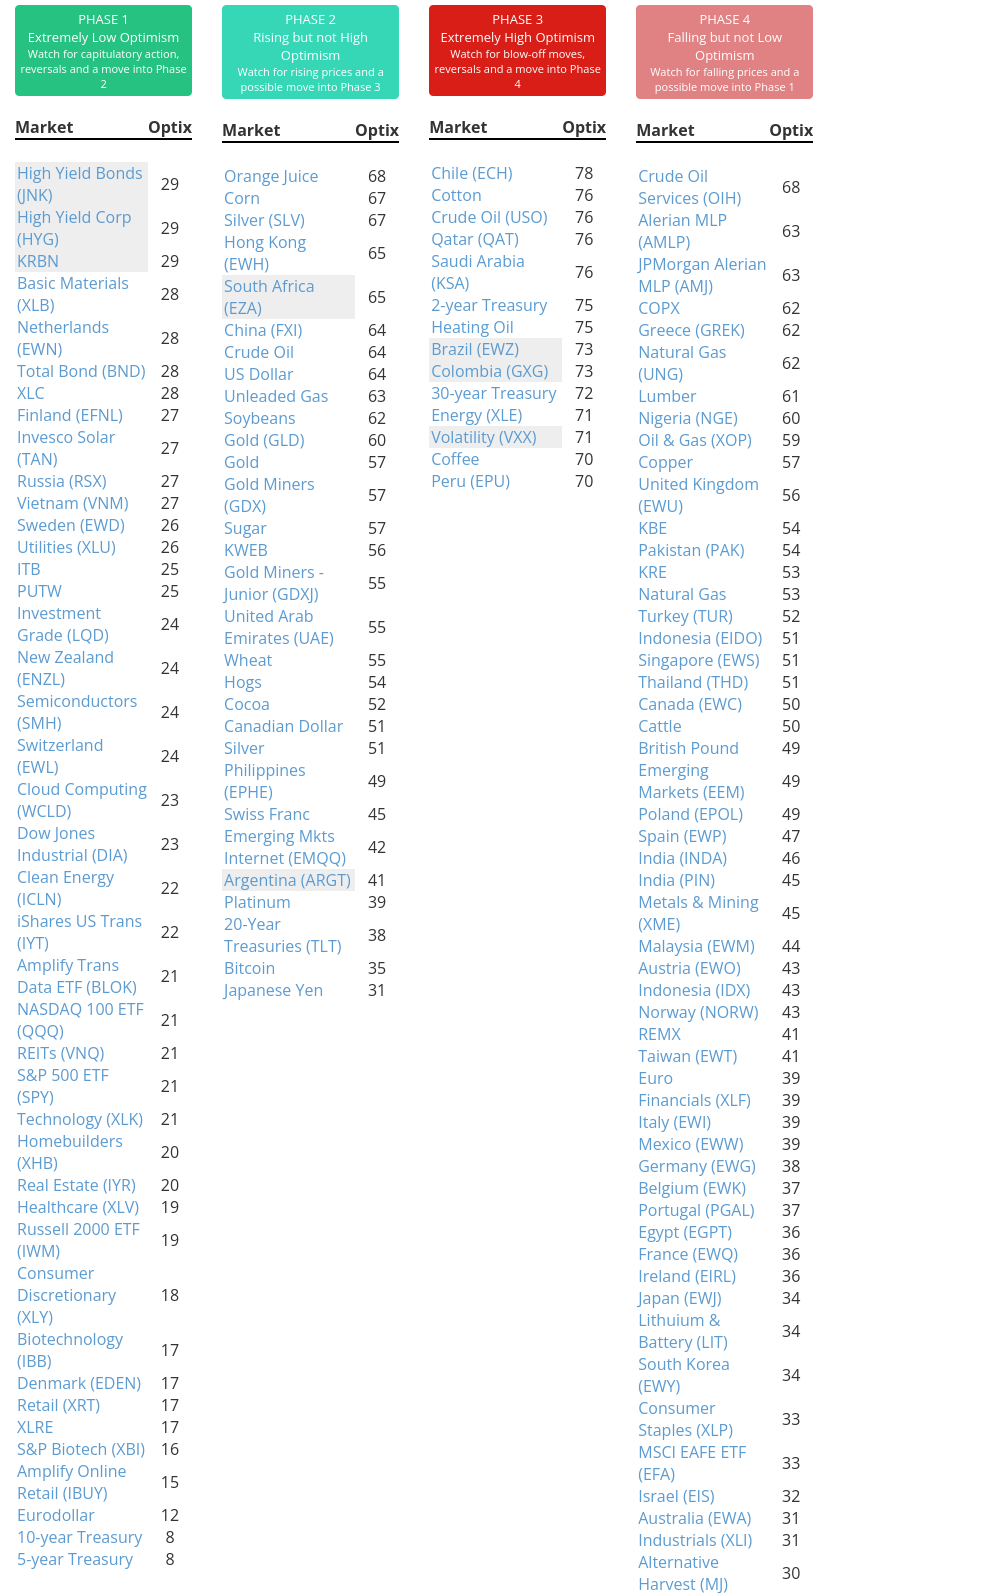
Phase Table
Ranks
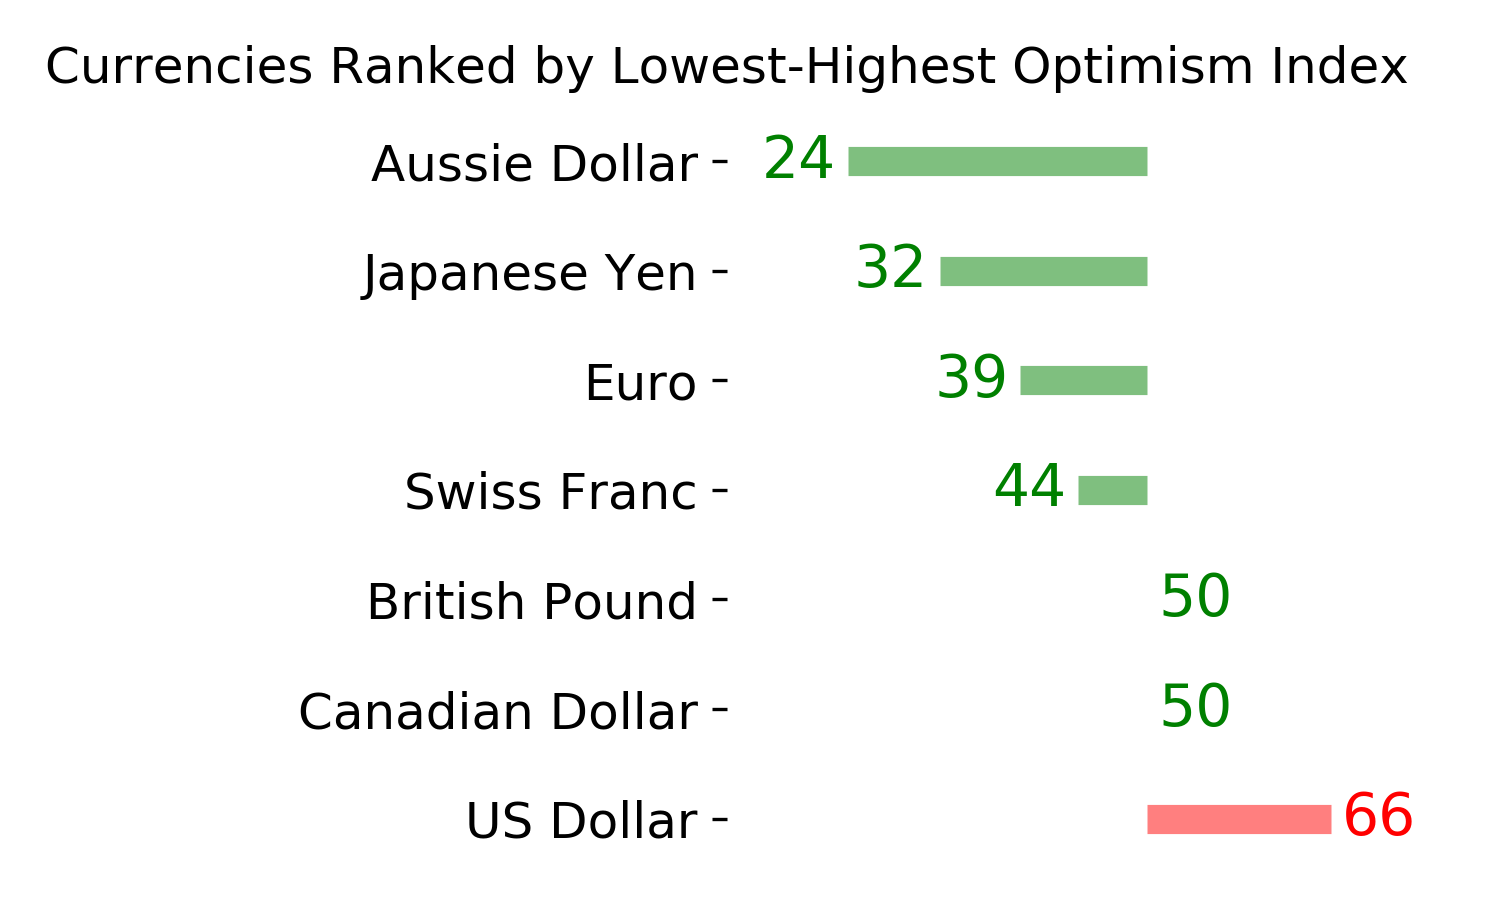
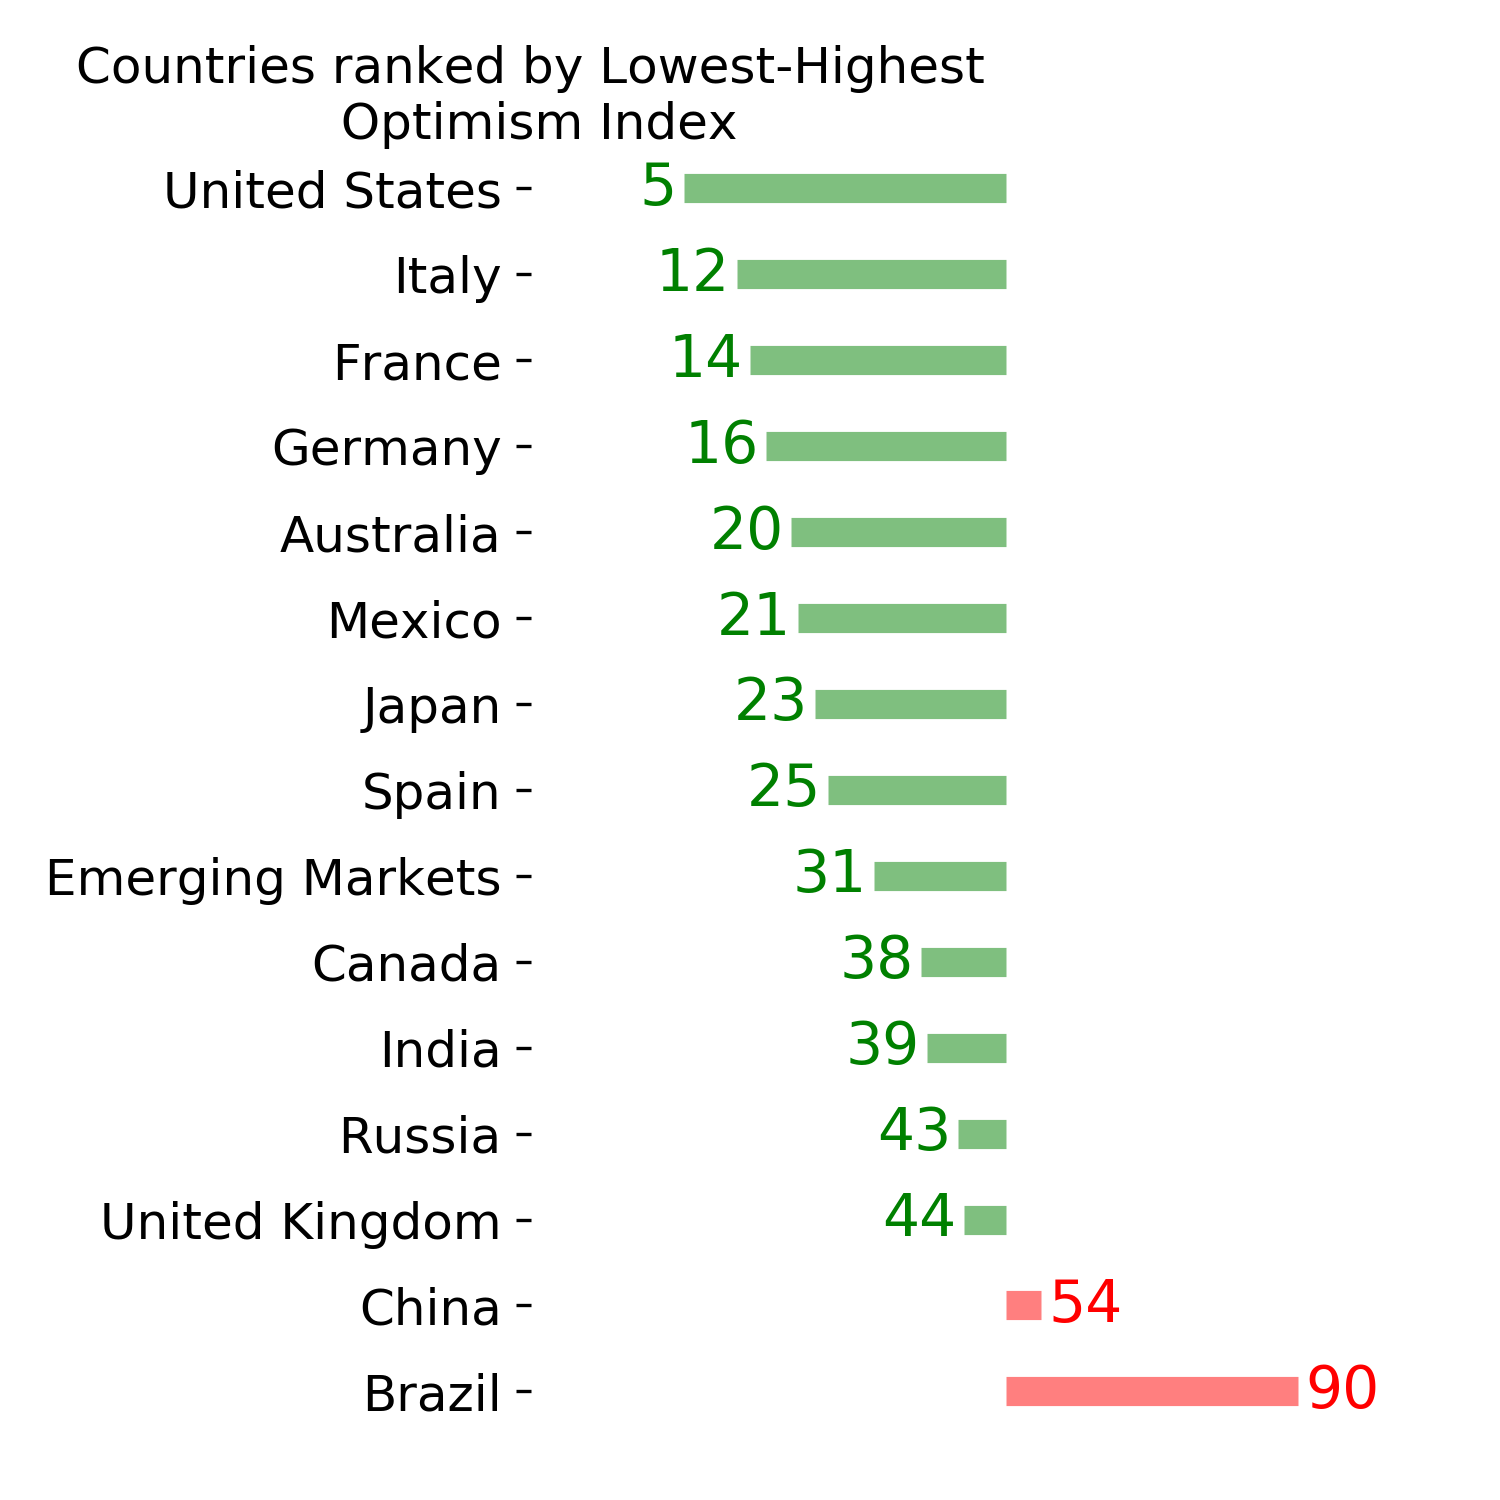
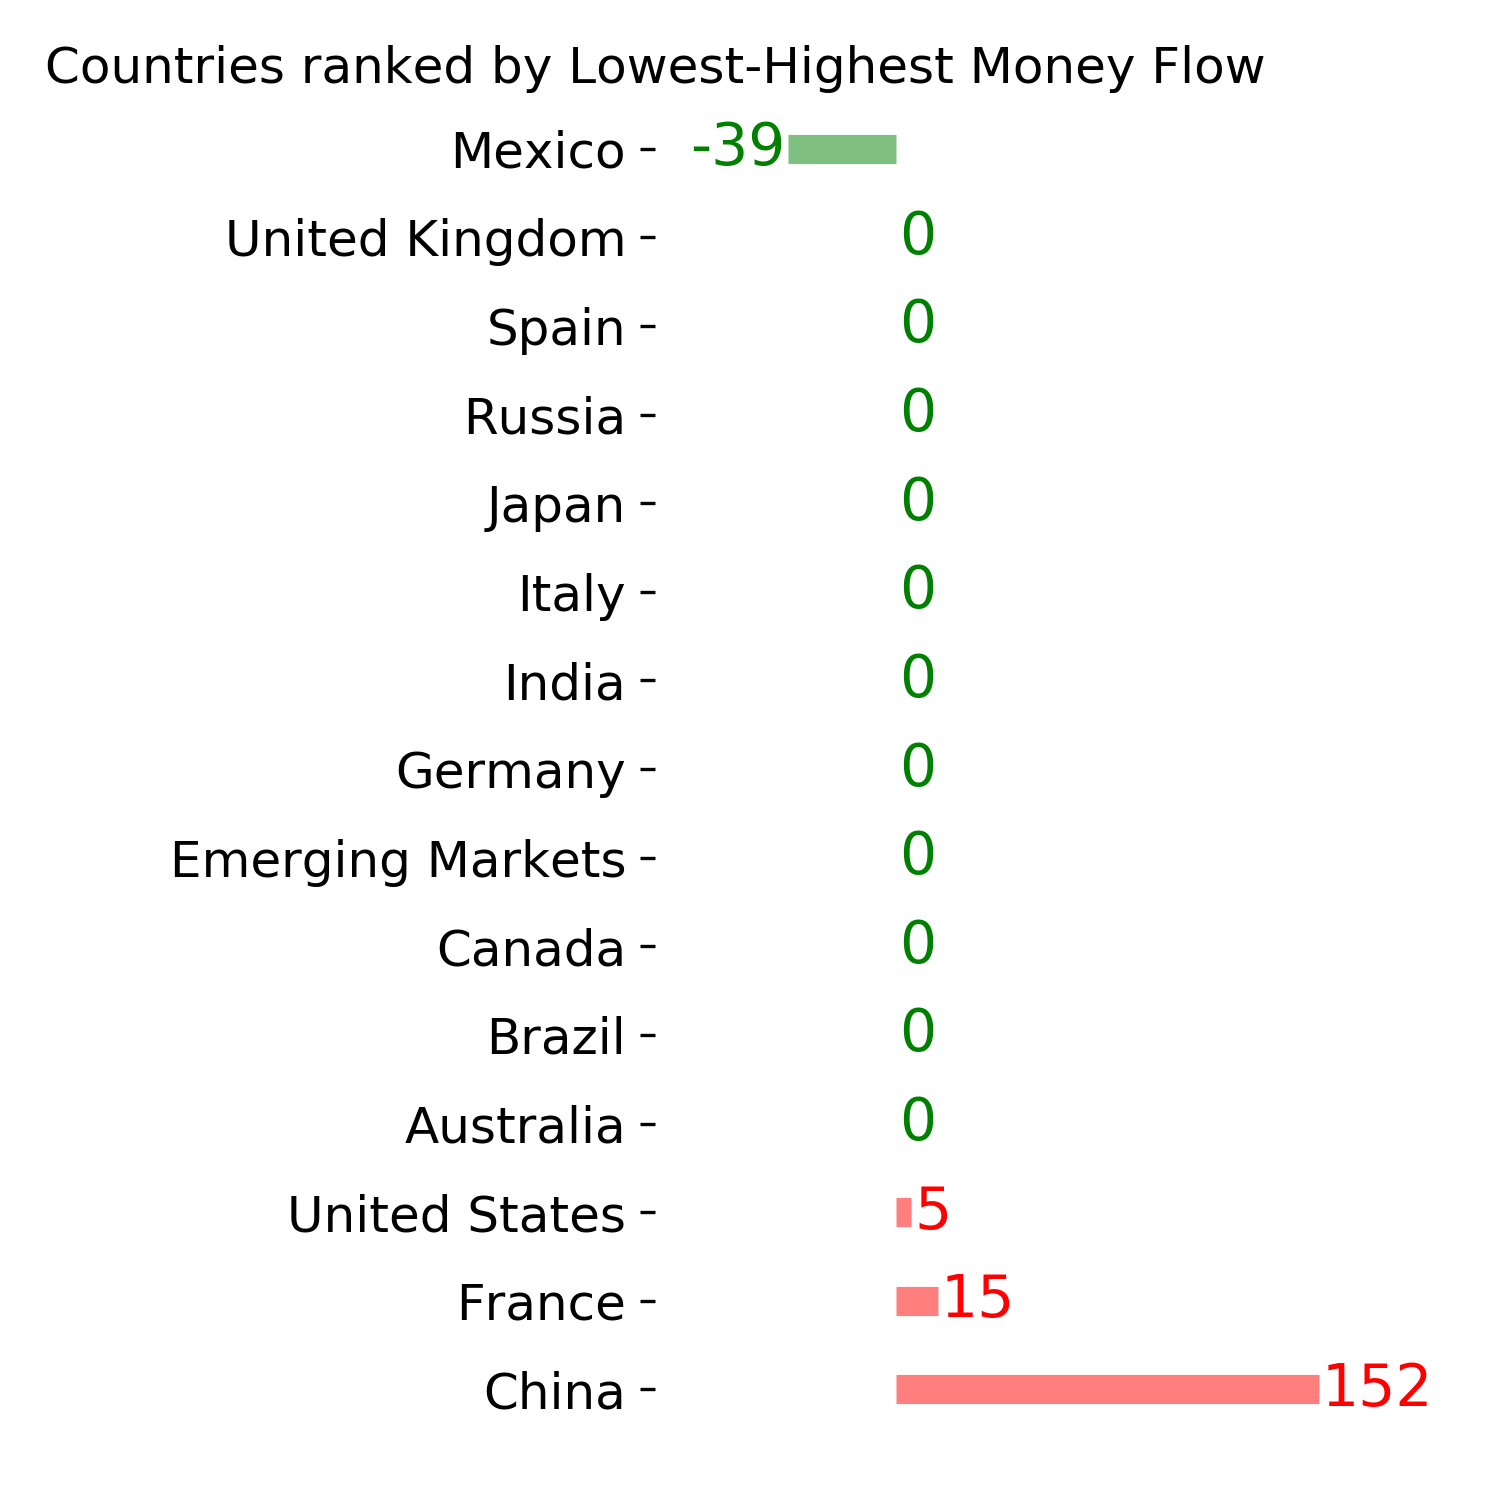
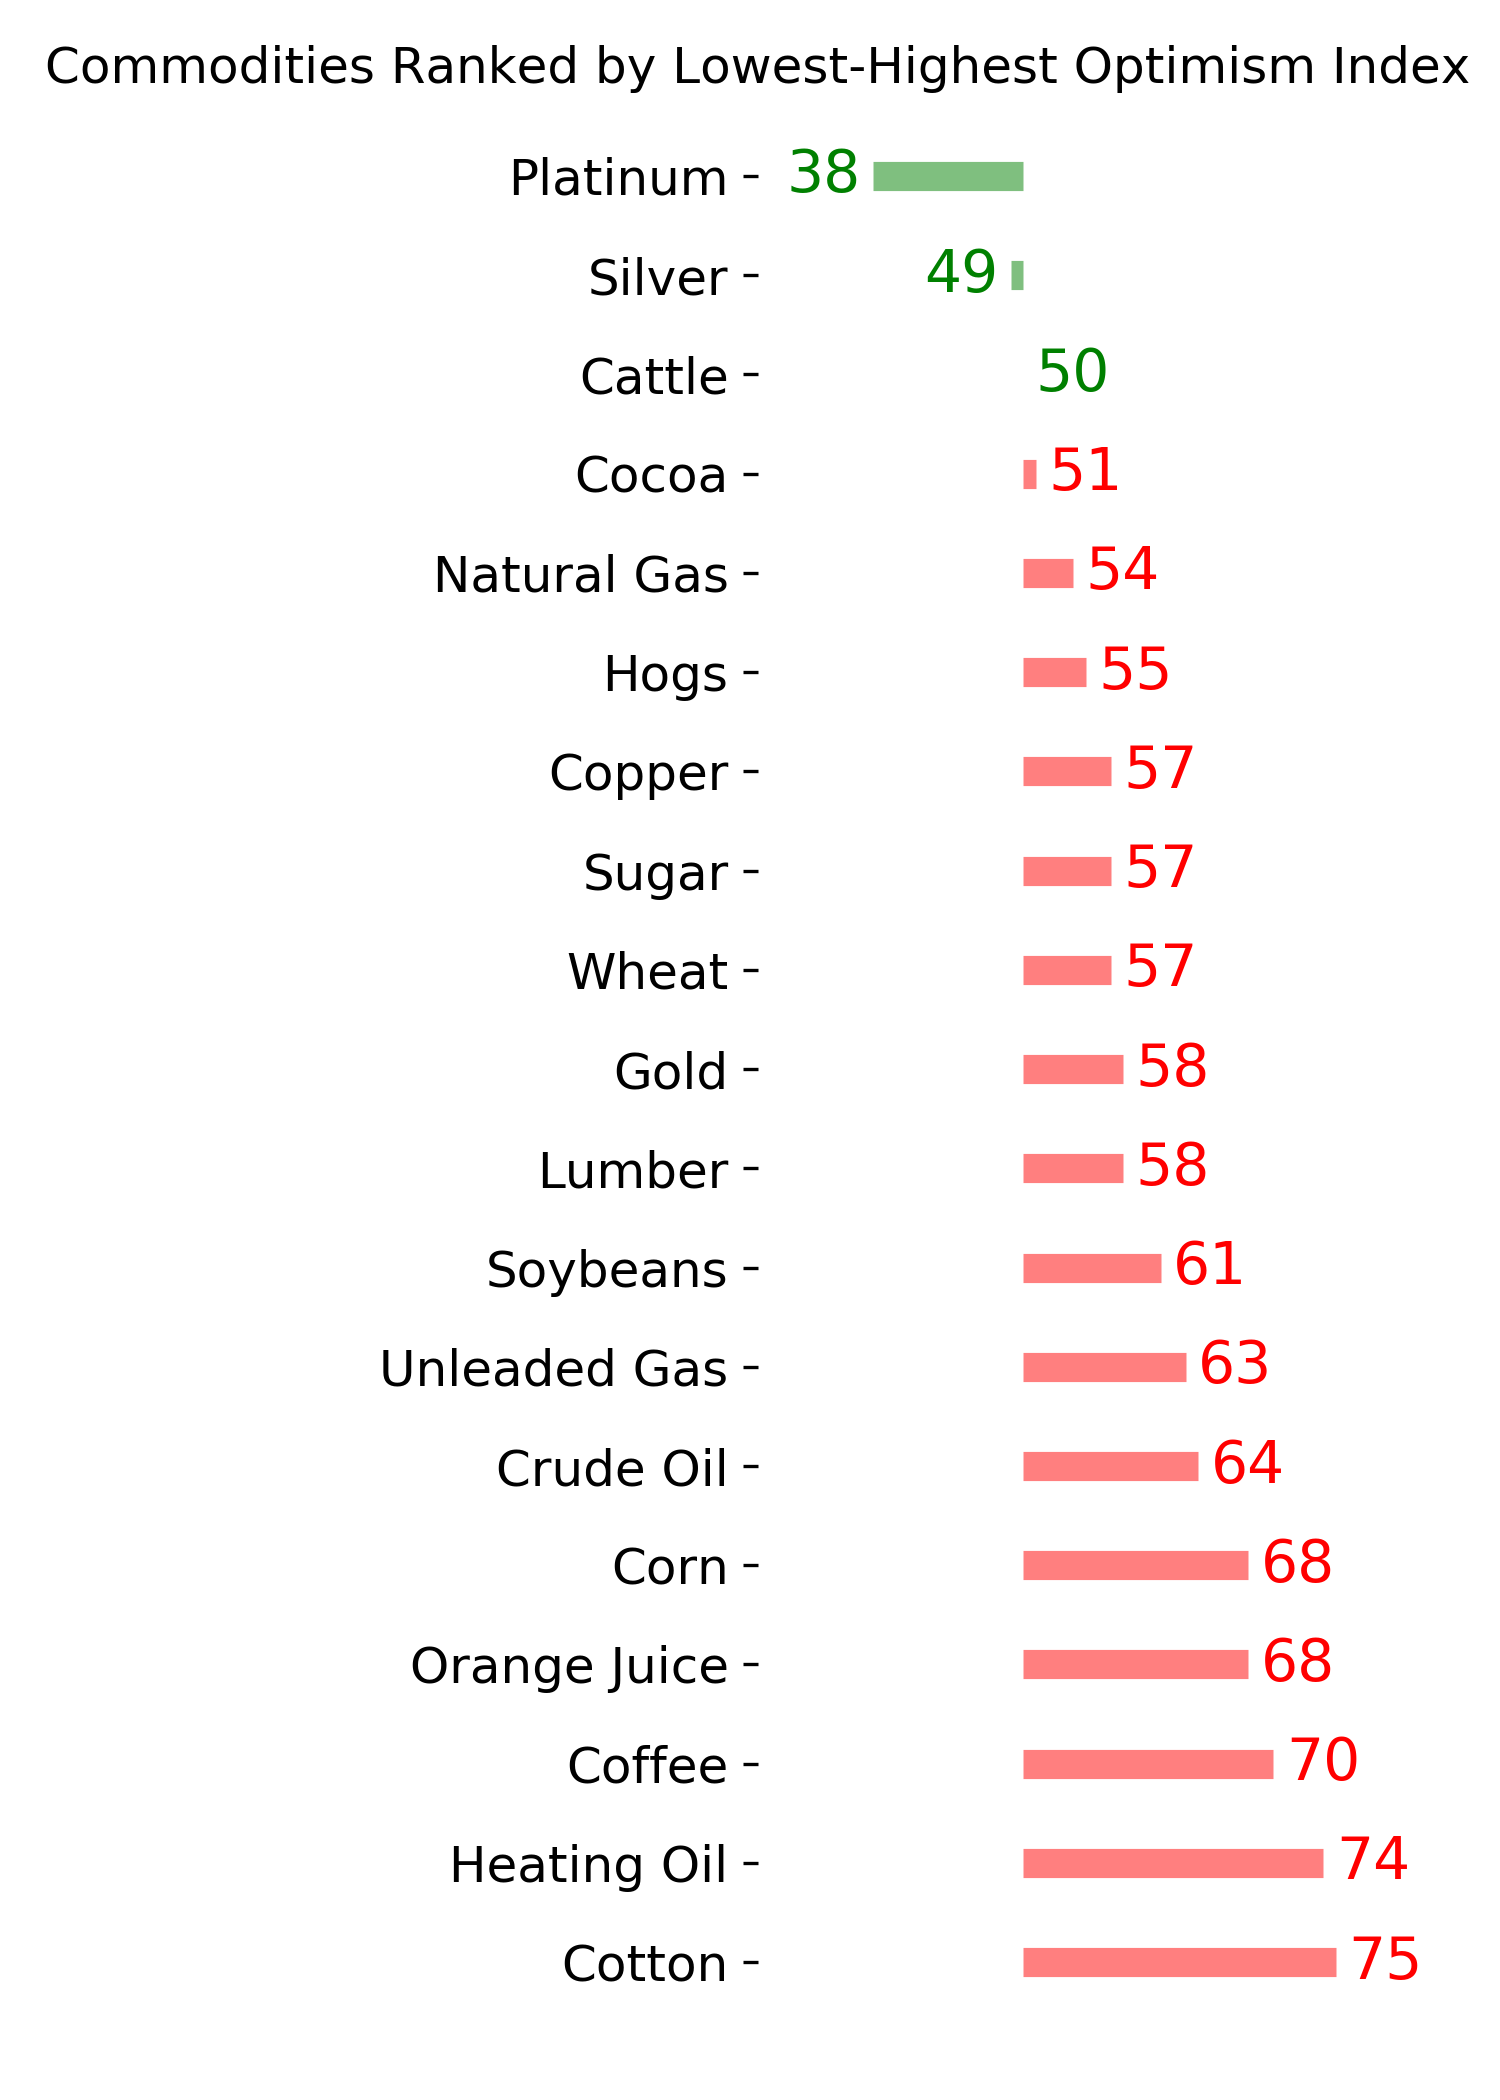
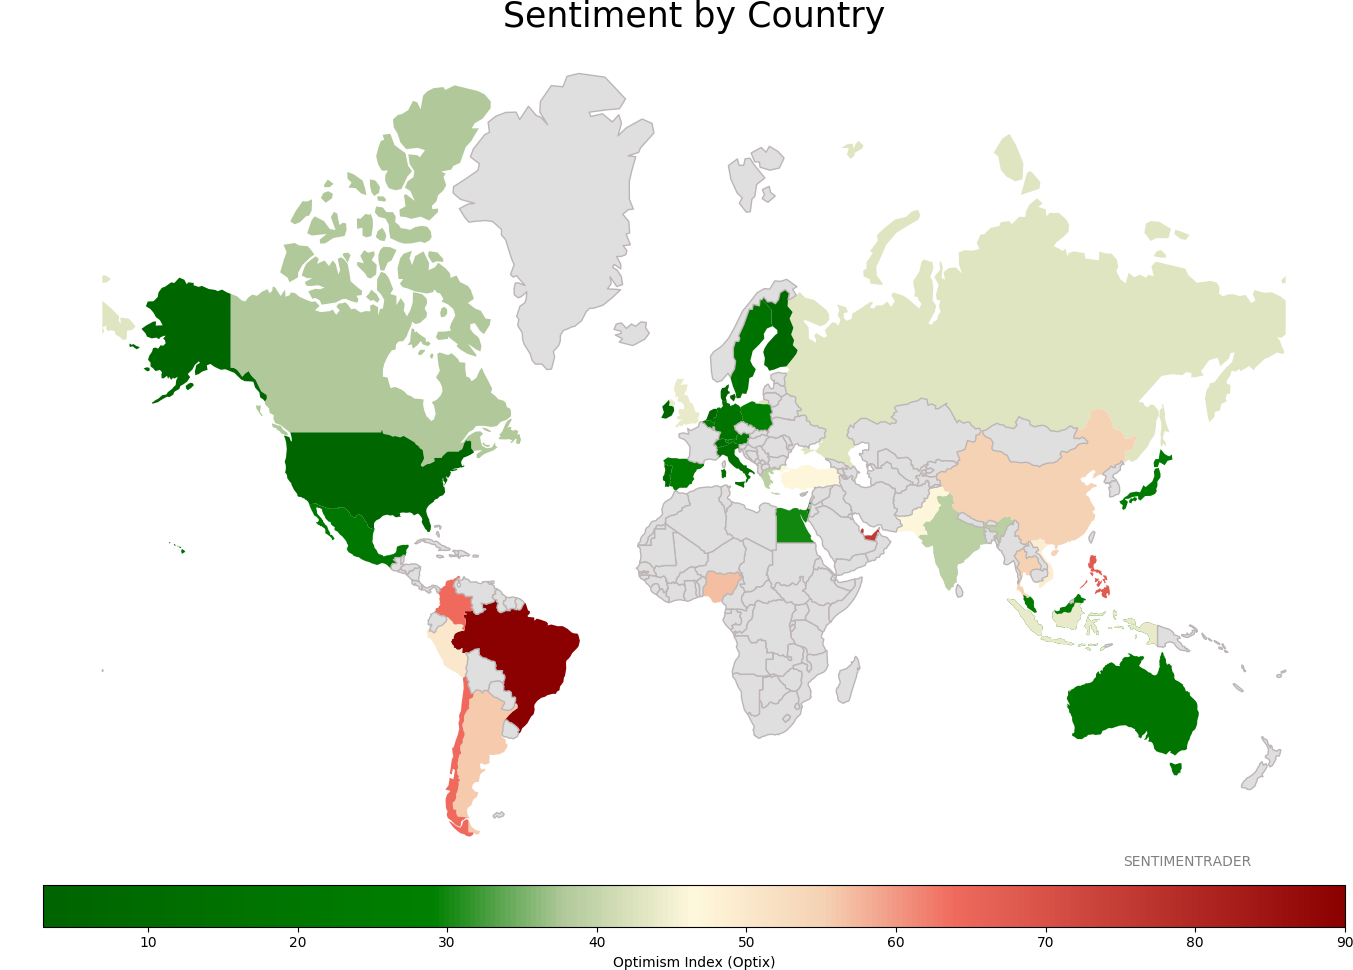
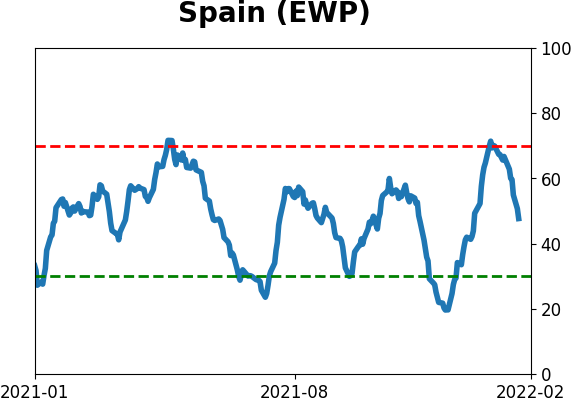
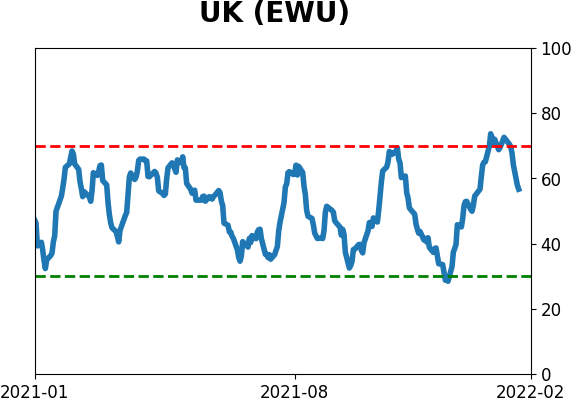
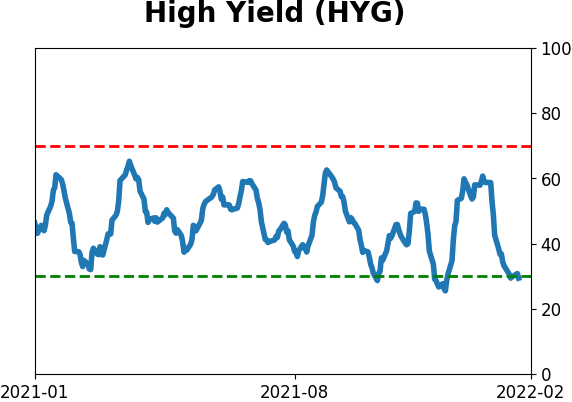
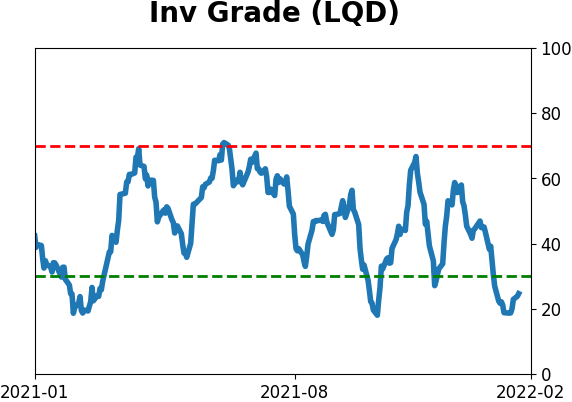
Sentiment Around The World
Optimism Index Thumbnails
|
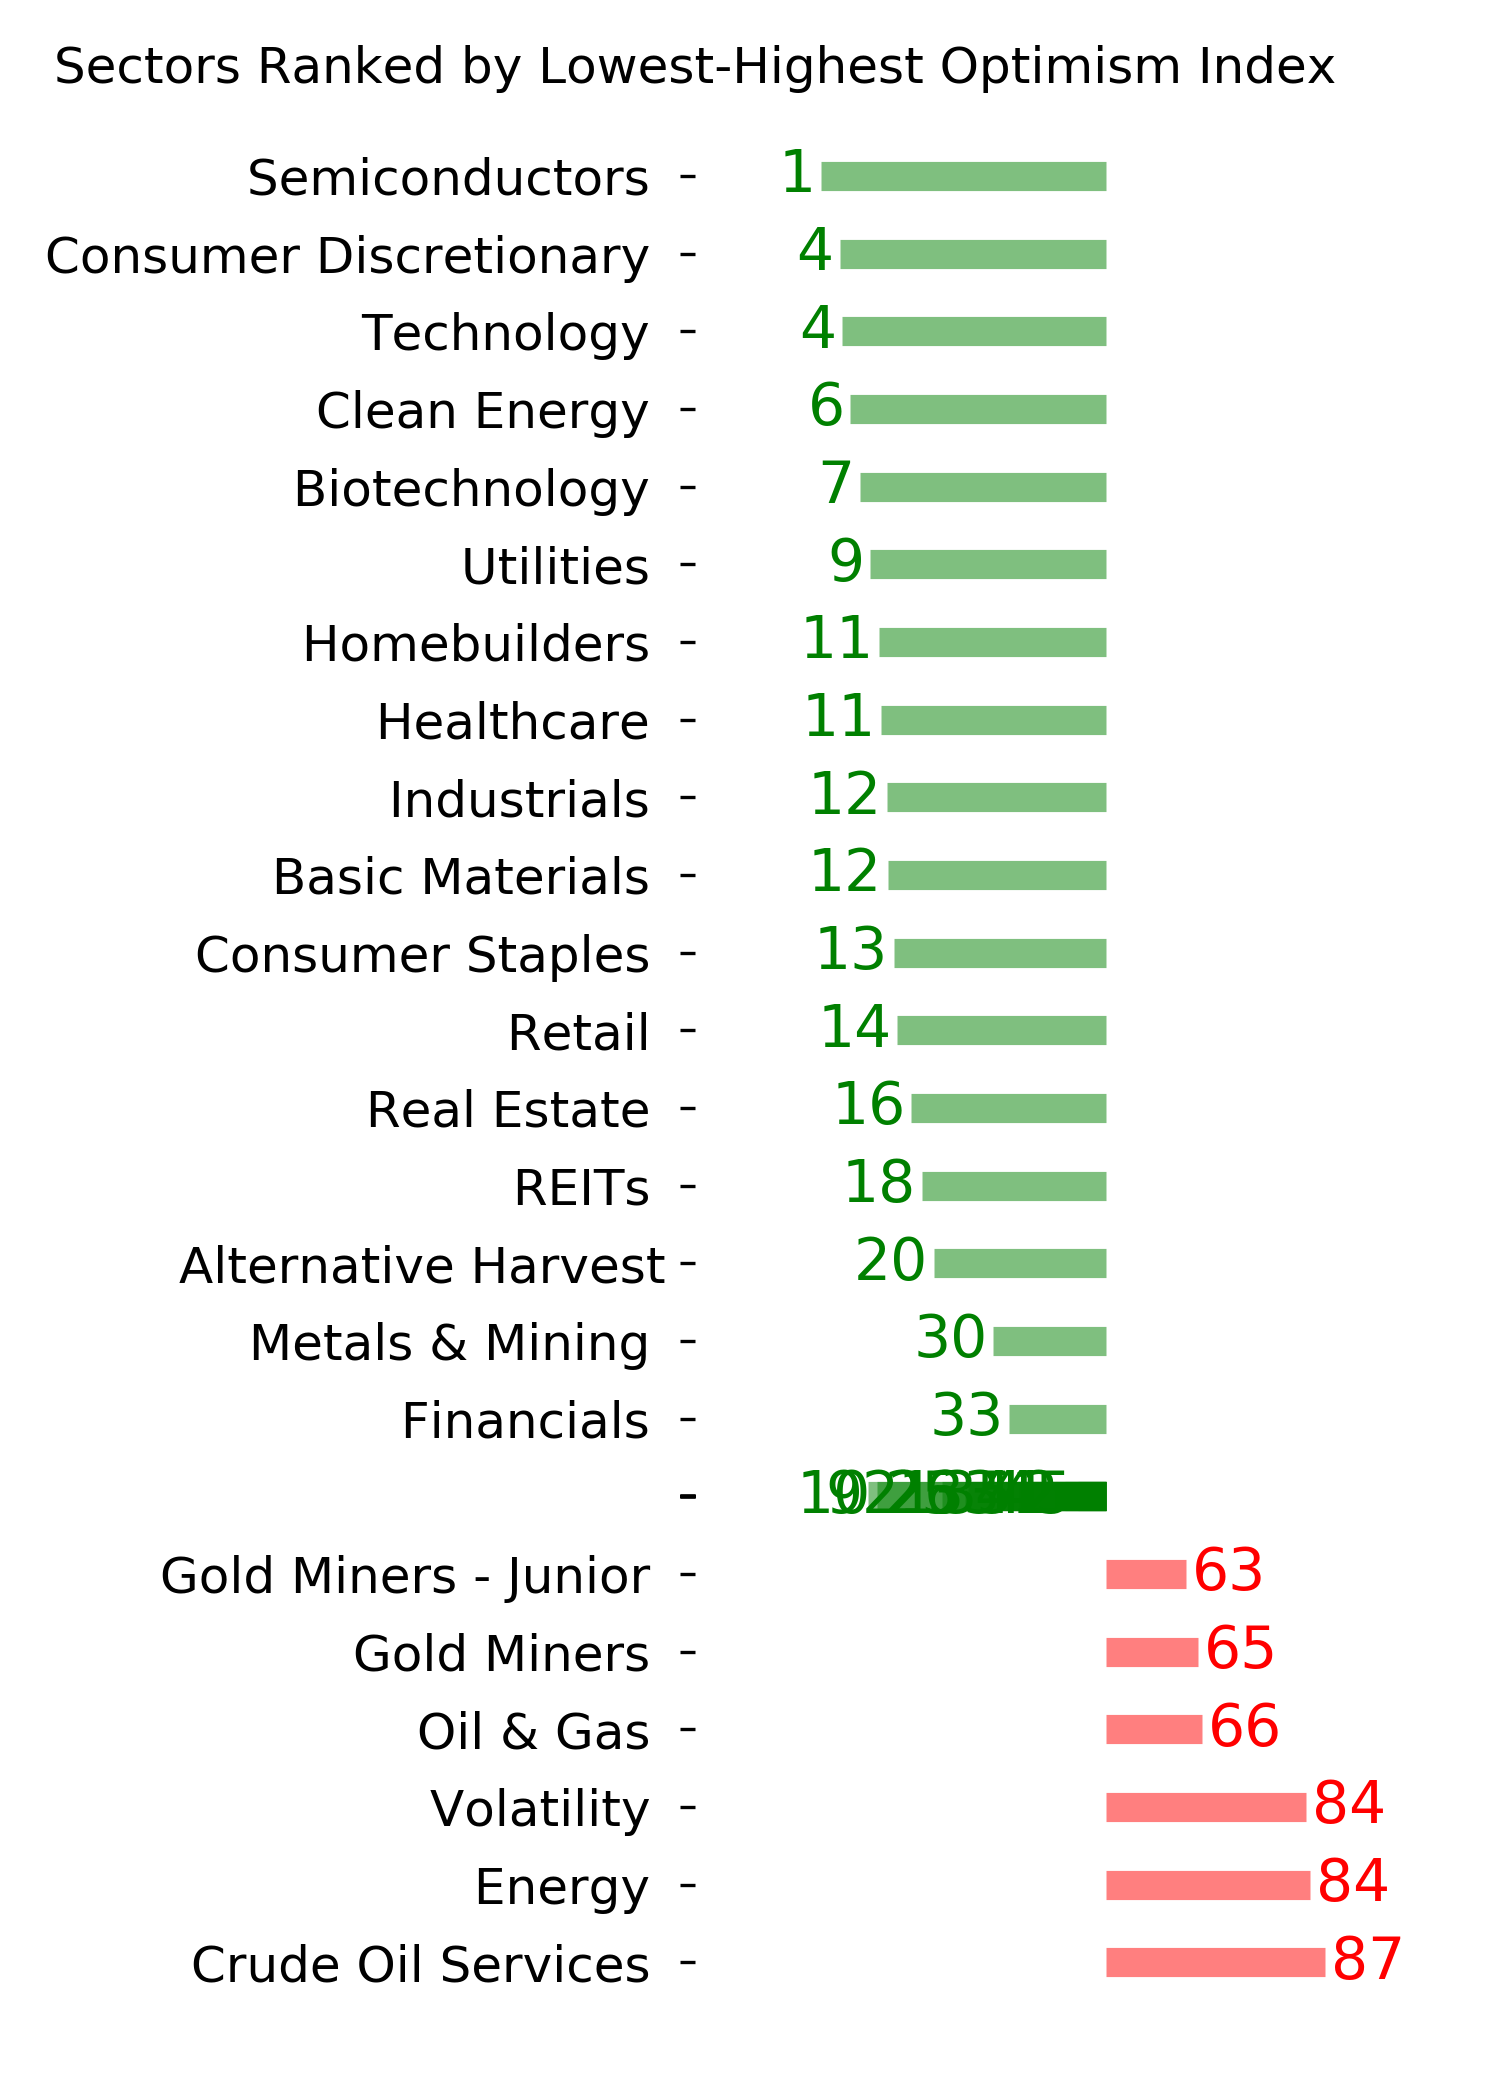
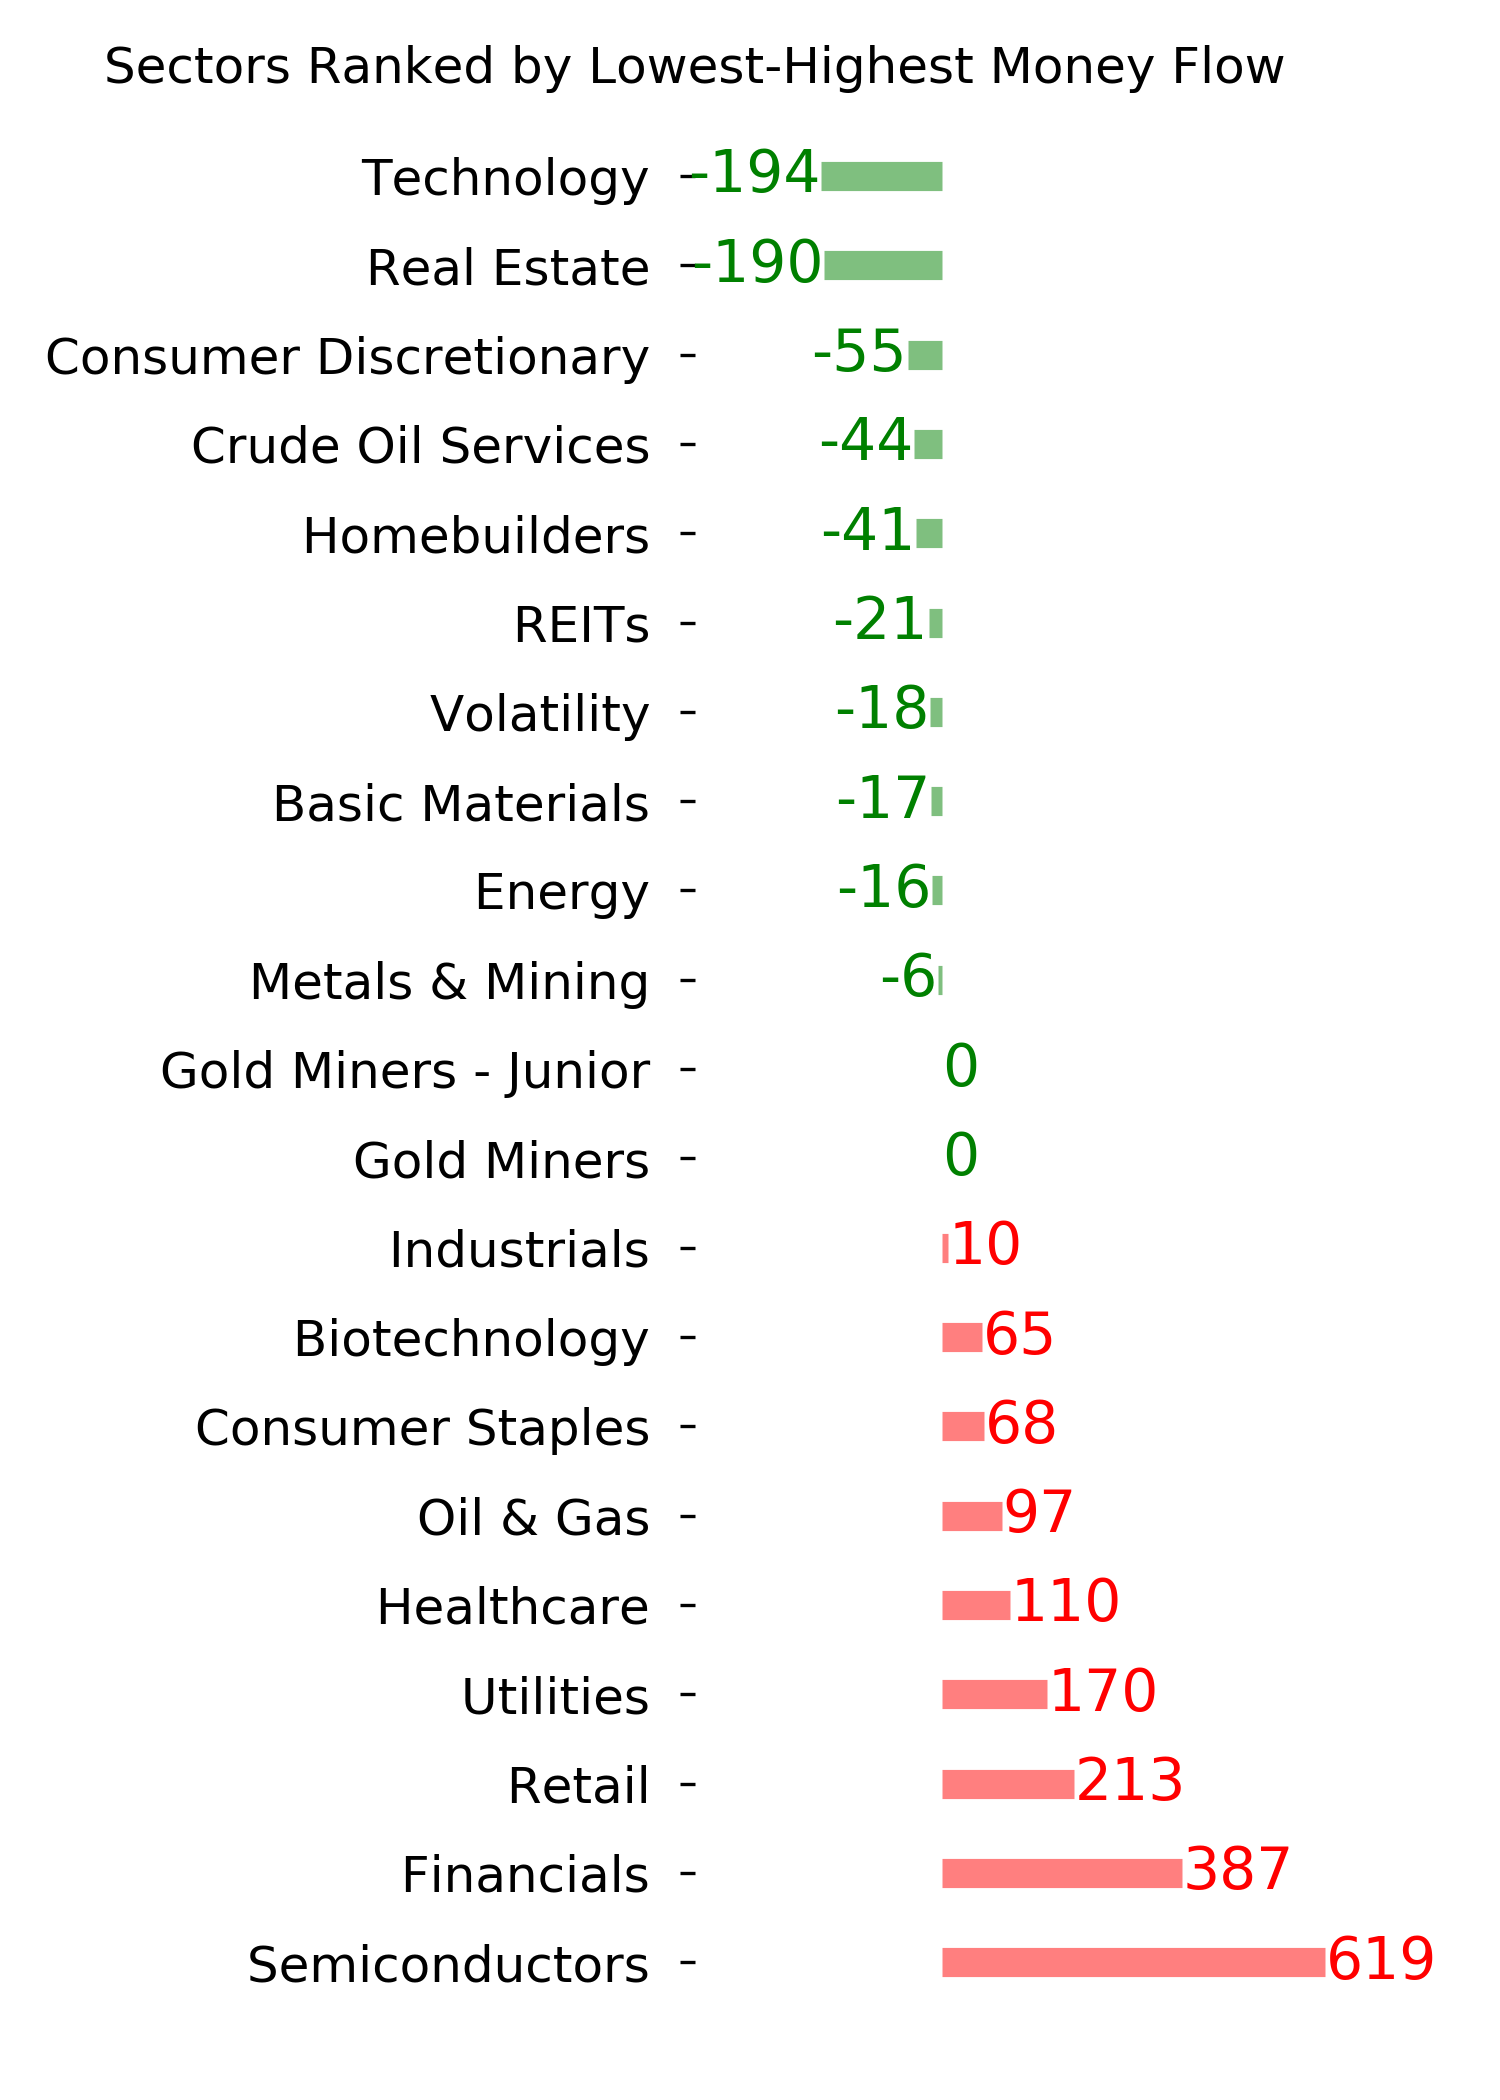
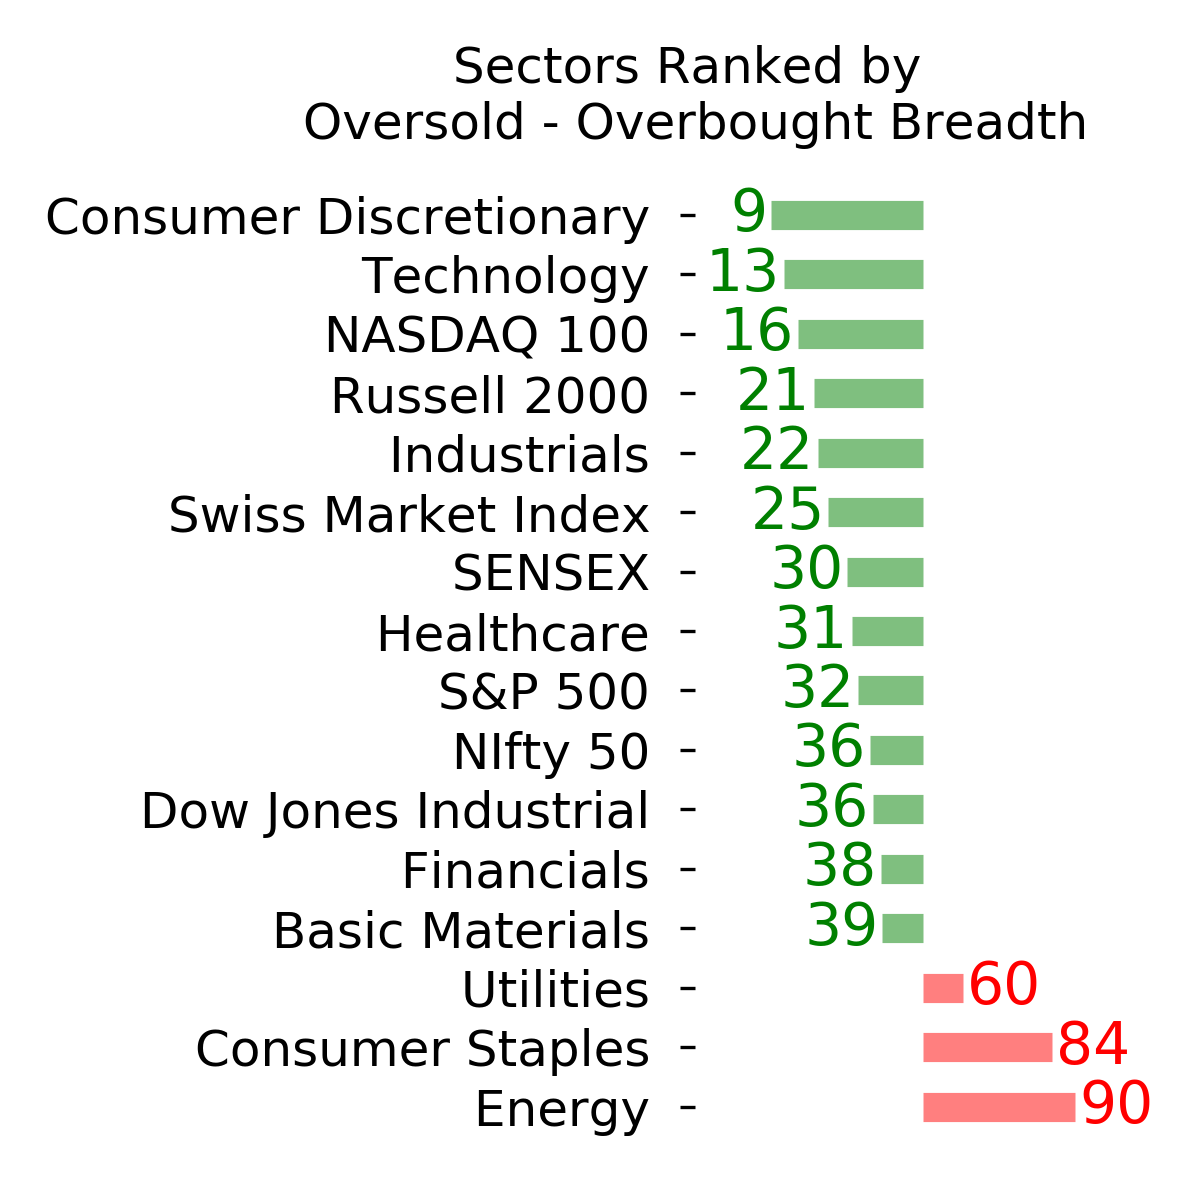
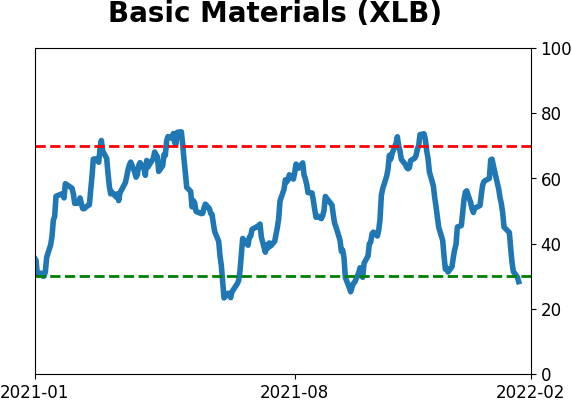
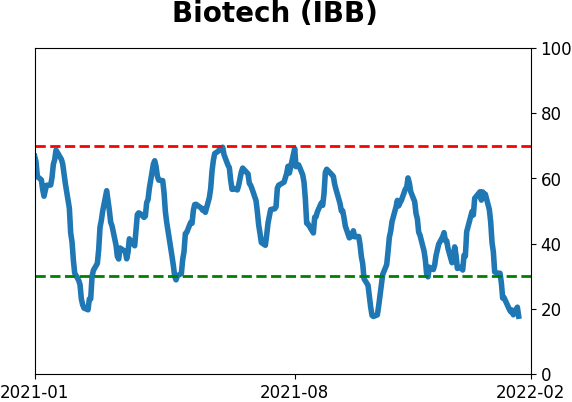
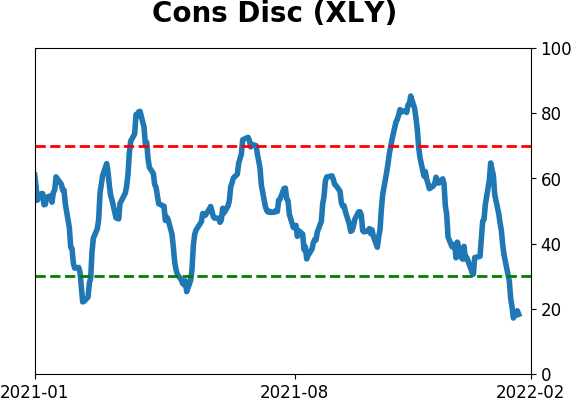
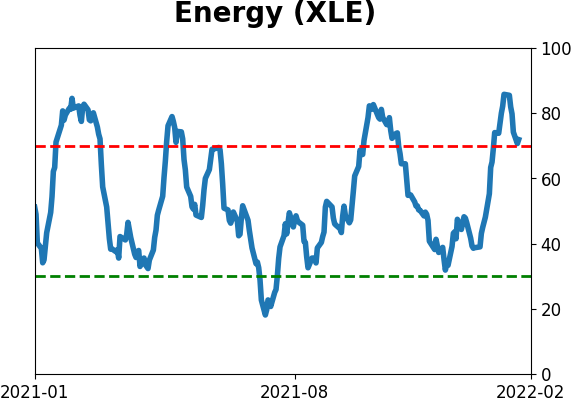
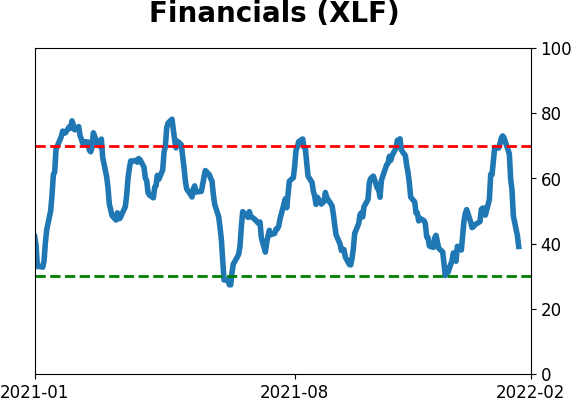
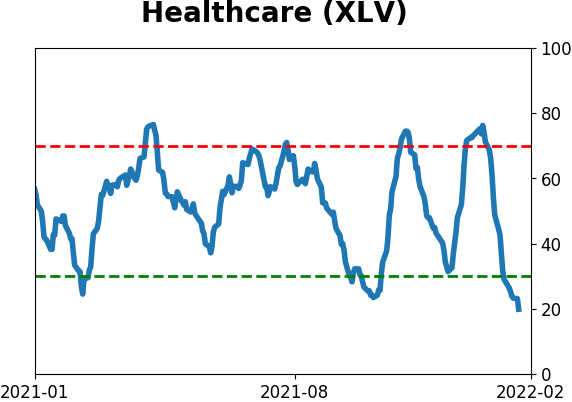
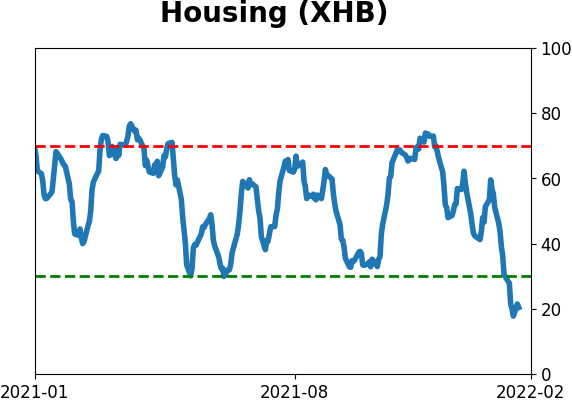
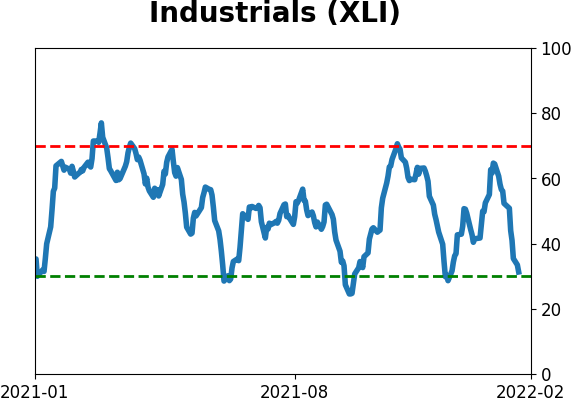
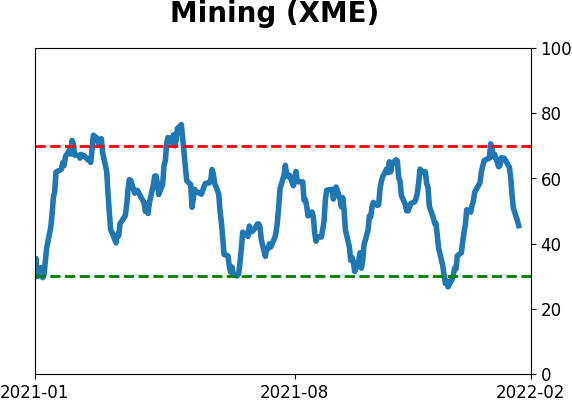
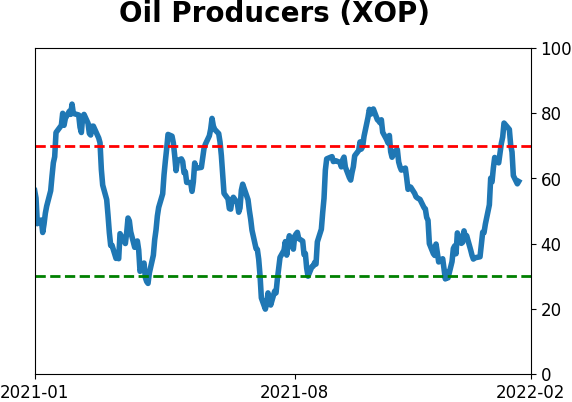
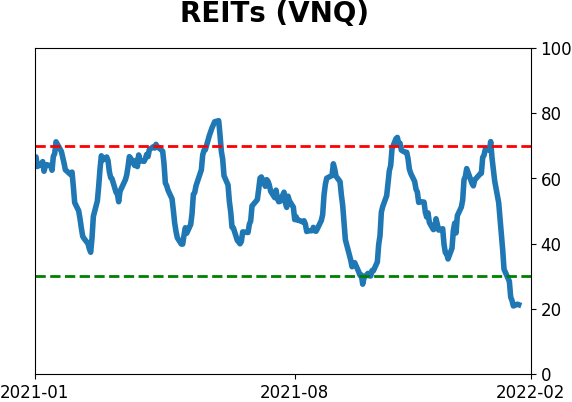
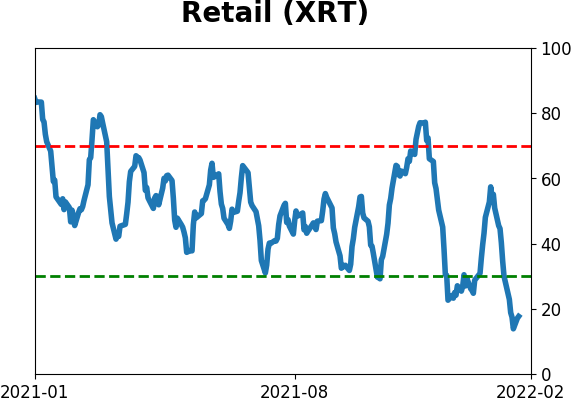
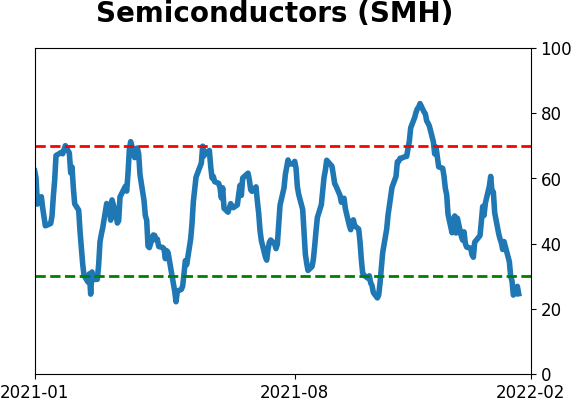
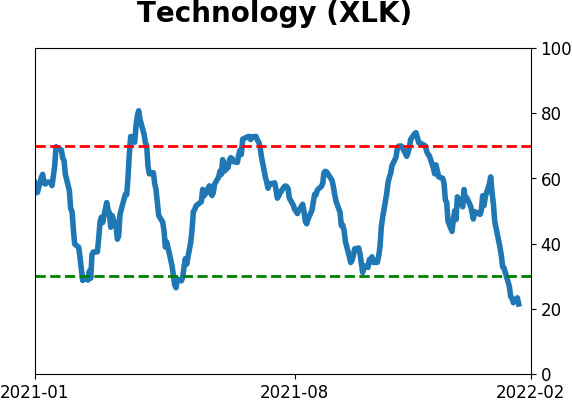
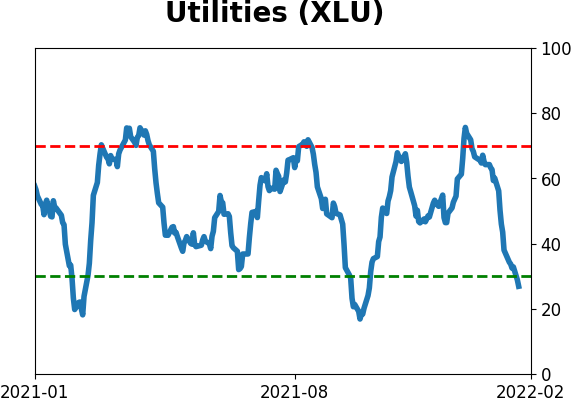
Sector ETF's - 10-Day Moving Average
|
|
|
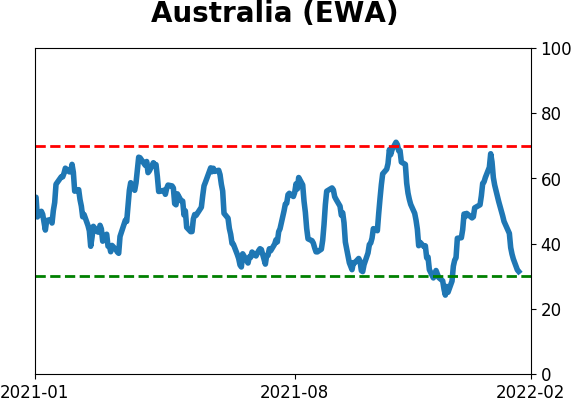
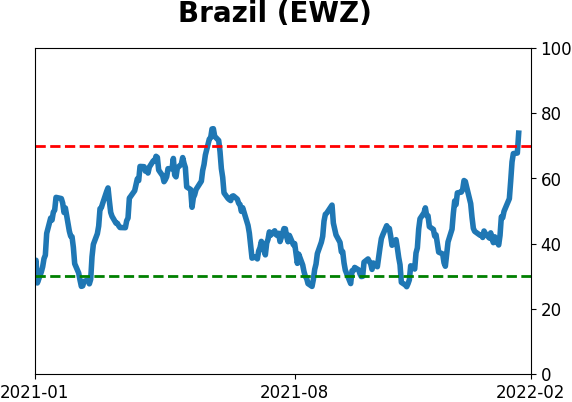
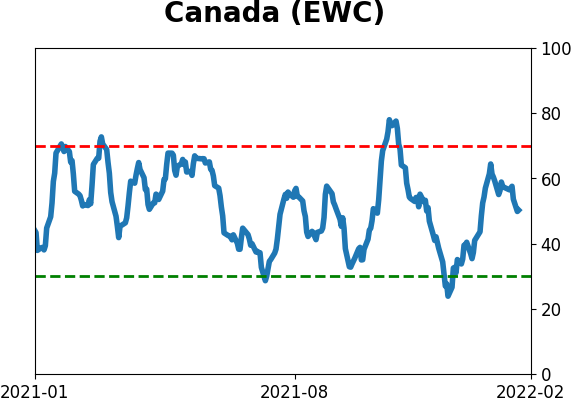
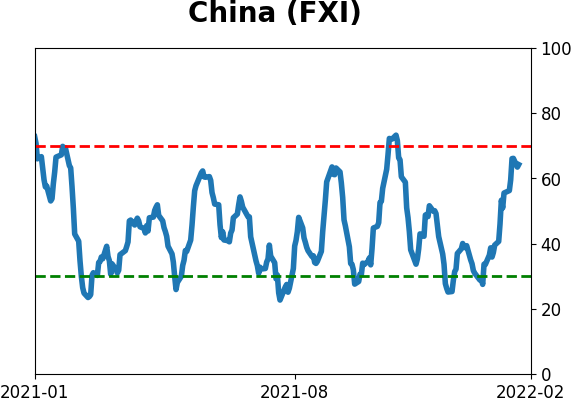
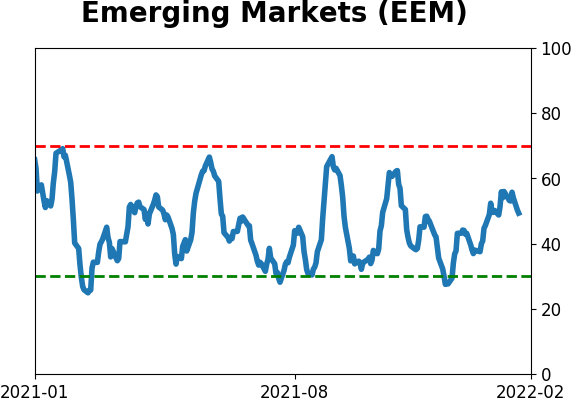
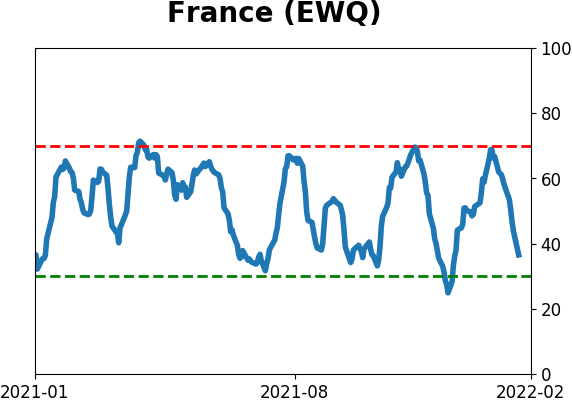
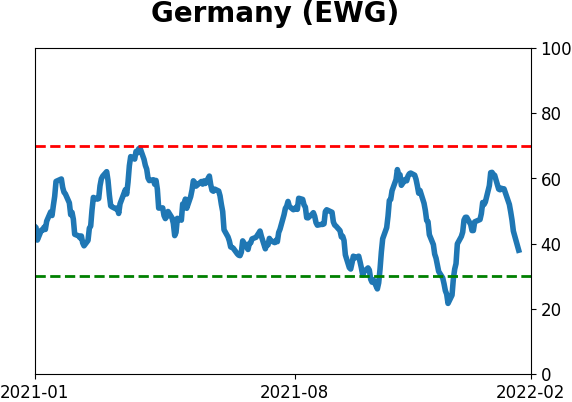
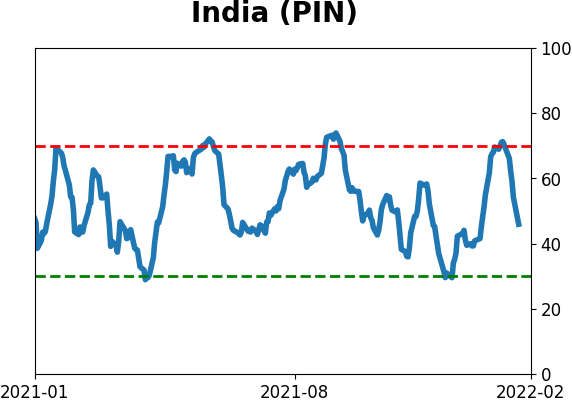
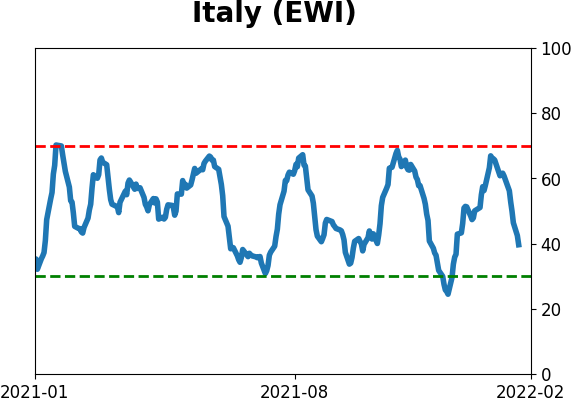
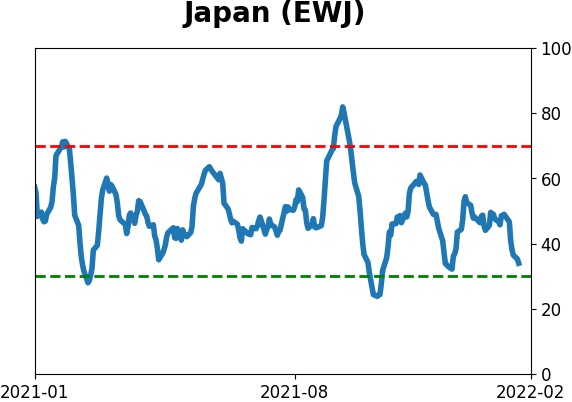
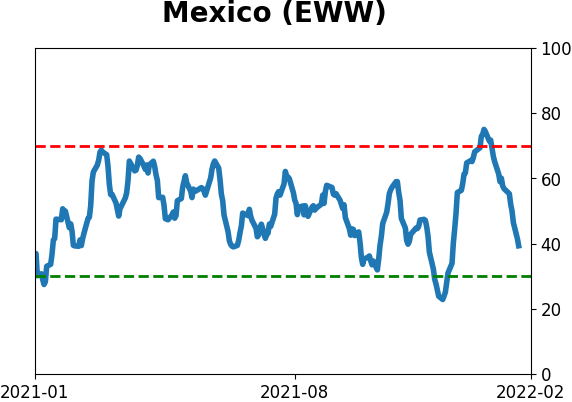
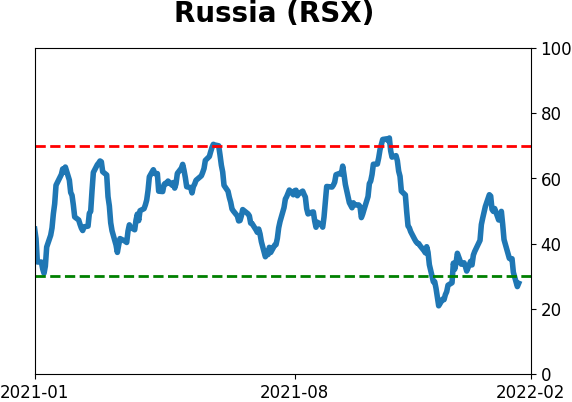
Country ETF's - 10-Day Moving Average
|
|
|
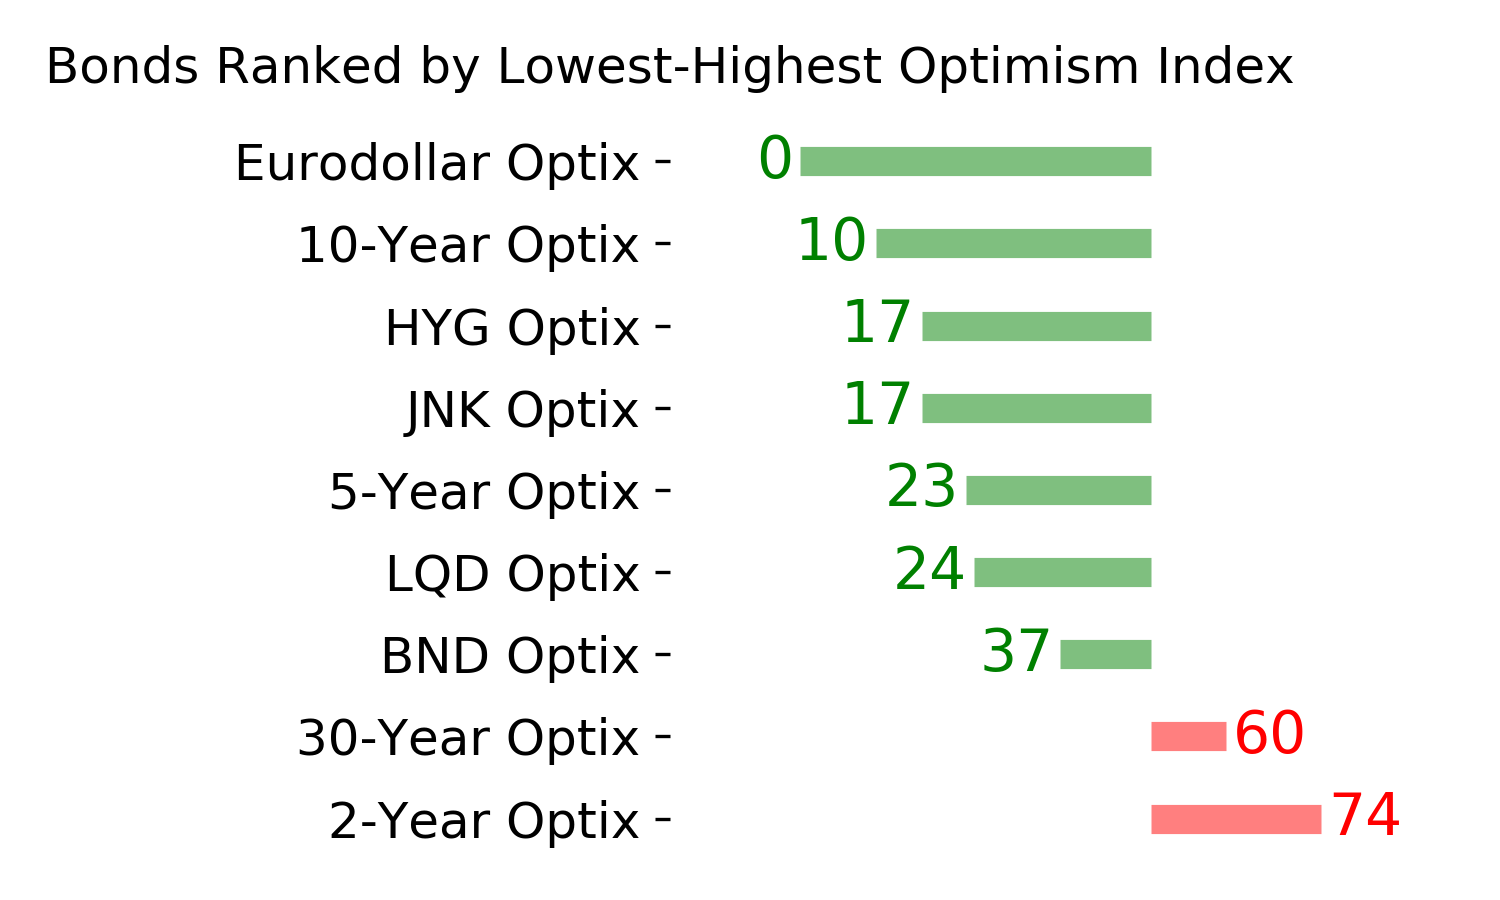
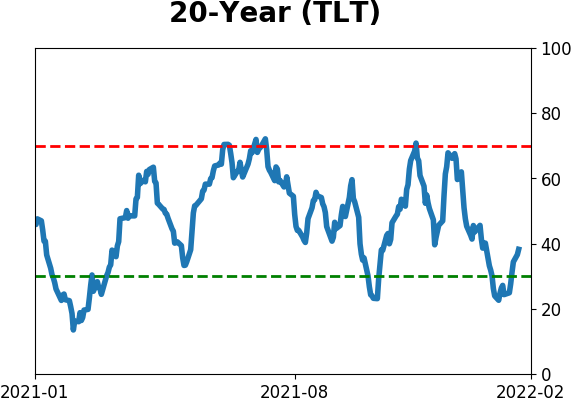
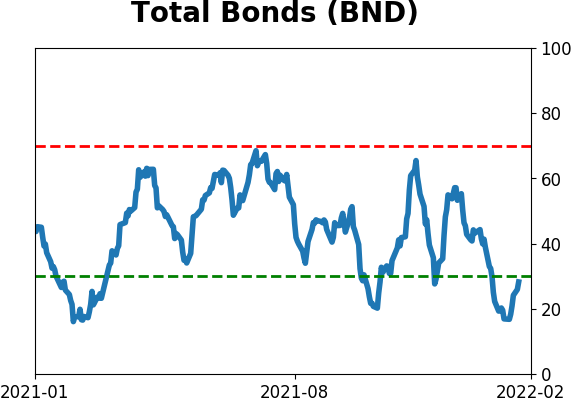
Bond ETF's - 10-Day Moving Average
|
|
|
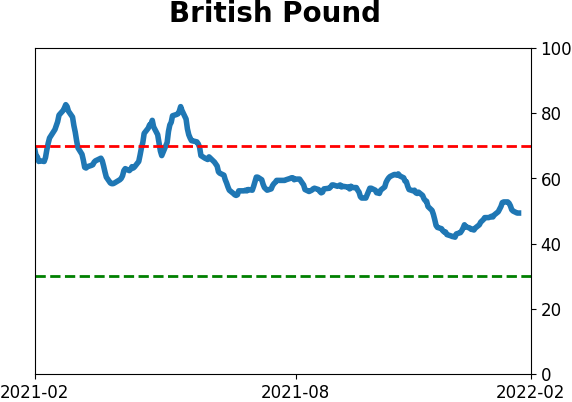
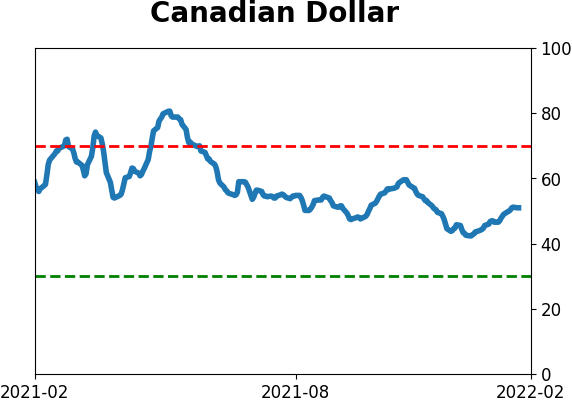
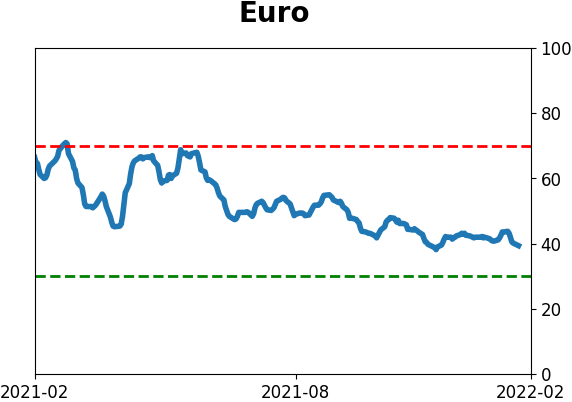
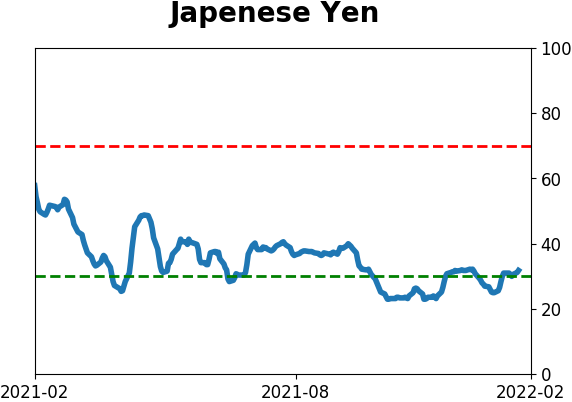
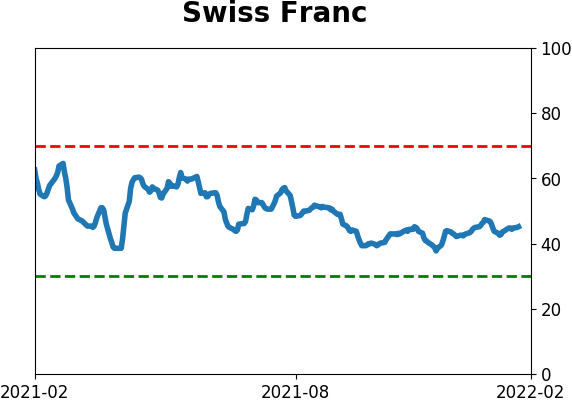
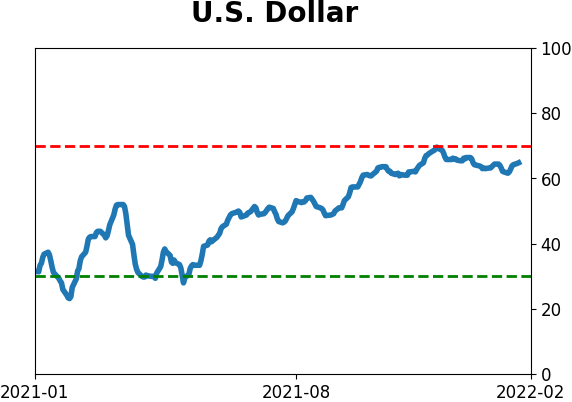
Currency ETF's - 5-Day Moving Average
|
|
|
Commodity ETF's - 5-Day Moving Average
|
|