Headlines
|
|
Weekly Wrap for Feb 26 - A muddled picture in pretty much everything:
While signs of speculation have ebbed thanks to wobbling prices, there is still little evidence of internal deterioration. Even a small pullback generated a big spike in already-elevated volatility, with the selloff in bonds triggering some wild gyrations.
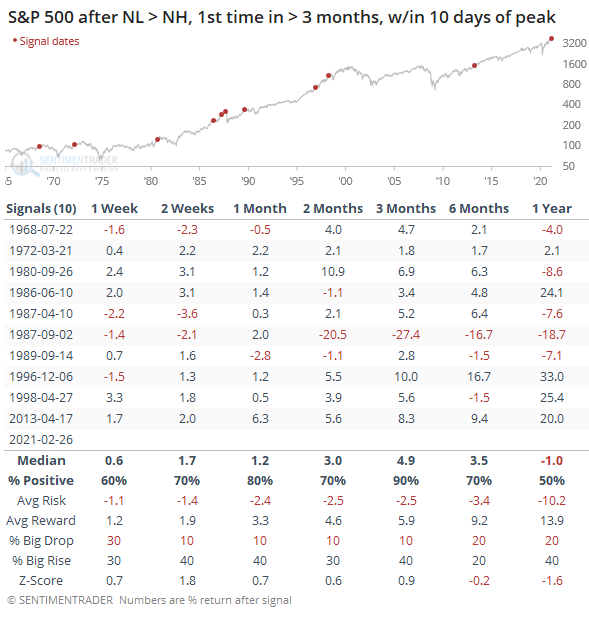
Near miss: Technical warning signs like the Hindenburg Omen and Titanic Syndrome, despite the dopey names, are relatively effective at highlighting internal strife in the market and have proved to be good guides over the years. Both just narrowly missed triggering on Friday. They're more effective as a warning when we see a cluster of readings over a period of weeks, but even single readings are worth noting. While neither triggered, 52-week lows exceeded 52-week highs on the NYSE for the first time in months on Friday, and it occurred within two weeks of the S&P 500 being at a new high. Other times this not-quite-Titanic signal occurred, stocks held up fine in 2013 and 1996. The others mostly saw some kind of tumult within the year.
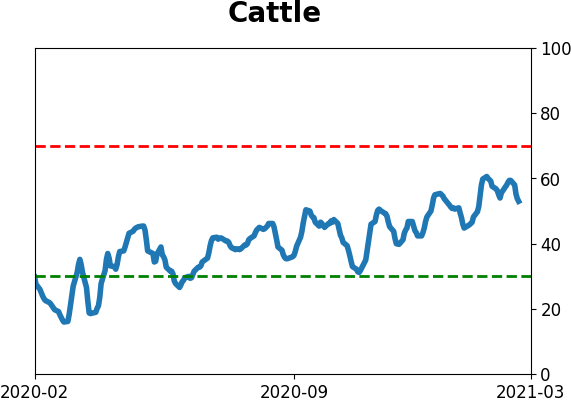
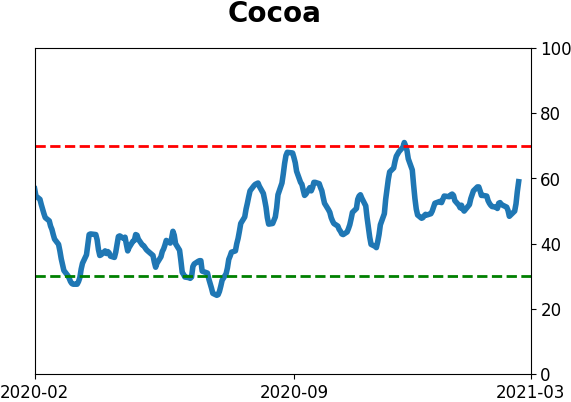
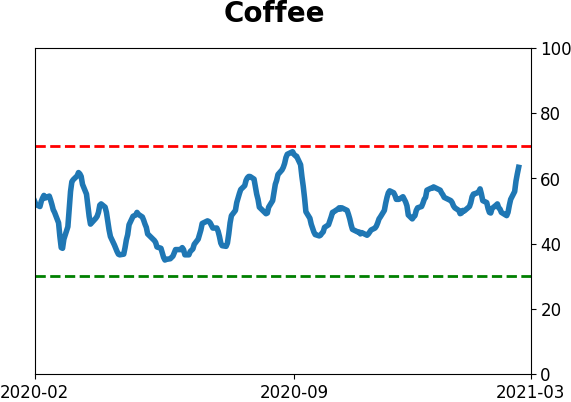
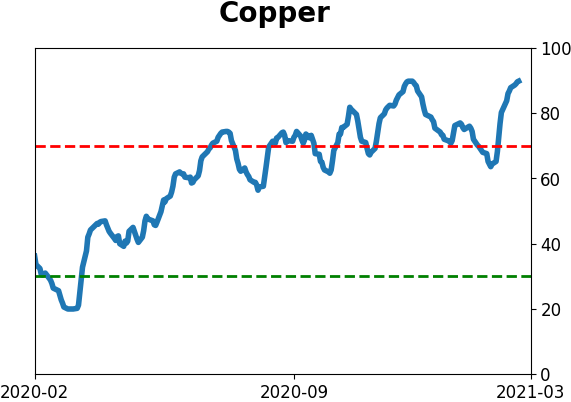
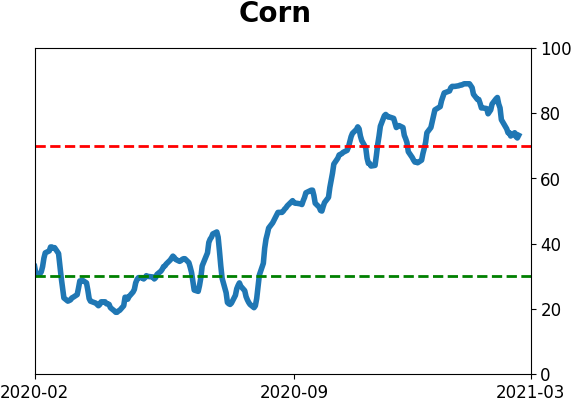
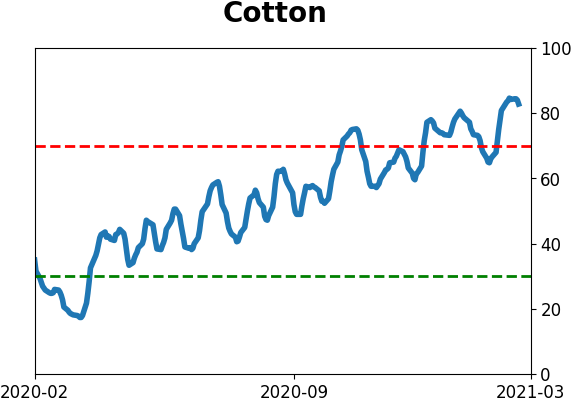
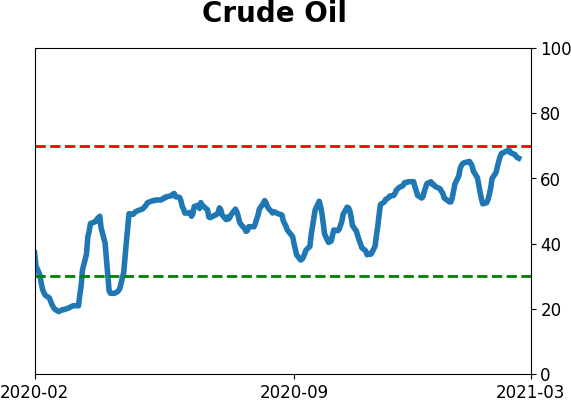
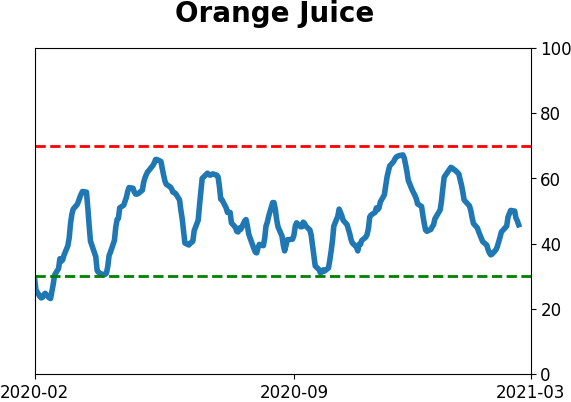
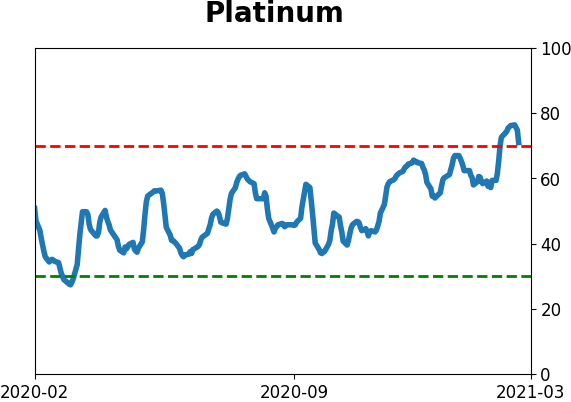
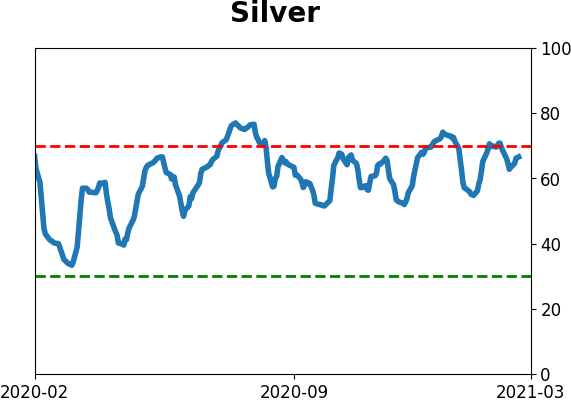
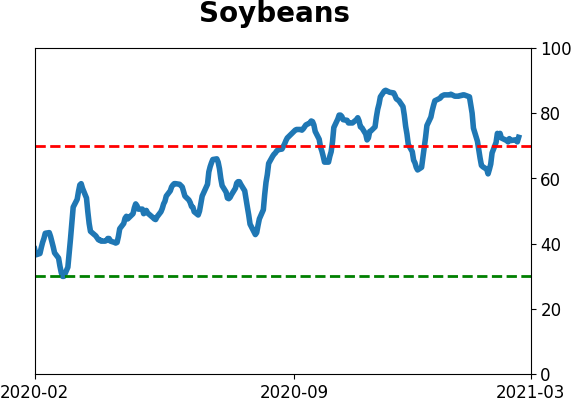
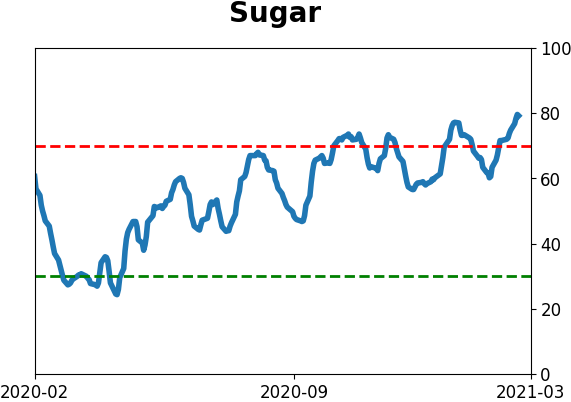
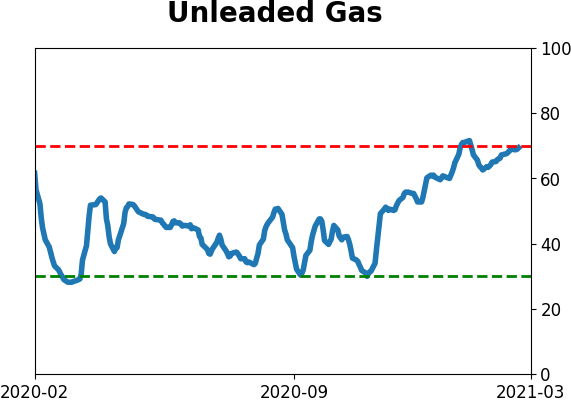
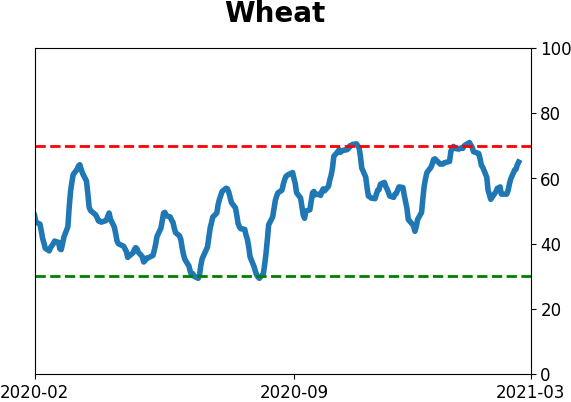
The latest Commitments of Traders report was released, covering positions through Tuesday: The 3-Year Min/Max Screen shows that "smart money" commercial hedgers established new multi-year short exposure in copper and agricultural contracts. In copper, they're holding more than 86,000 contracts net short, a new record, but open interest has grown. As a percentage of open interest, they're holding 32% of contracts net short, near the most in 17 years. This was not a successful signal to sell prior to then, as they regularly held more contracts net short. It's the same story in ag contracts that we've been noting for many months - this is unlike all prior extremes in the past decade when a big short position by hedgers almost immediately put an end to rallies. In 10-year Treasuries, hedgers picked up their buying but remain well below prior extremes, while continuing to hold long positions in the dollar and (almost net long) palladium. They reduced major equity index positions by a small amount and it's not saying much.
Bottom Line:
See the Outlook & Allocations page for more details on these summaries STOCKS: Weak sell
We're in an extremely speculative environment that is enough to suggest a defensive posture. Internal breadth and momentum have mostly remained positive, so a more strenuous sell wouldn't trigger unless that changed. BONDS: Weak buy
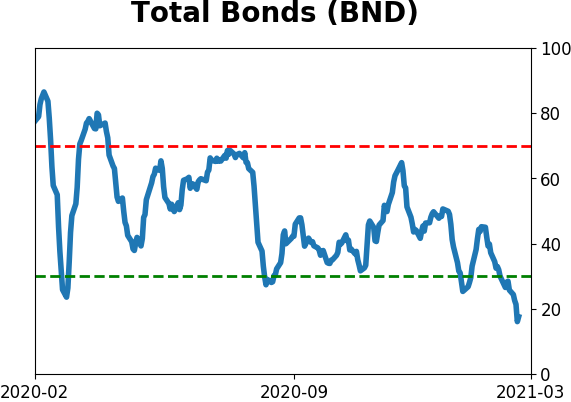
Various parts of the market have been hit in recent weeks, with mild oversold conditions. The Bond Optimism Index is now about as low as it gets during healthy bond market environments. GOLD: Weak buy
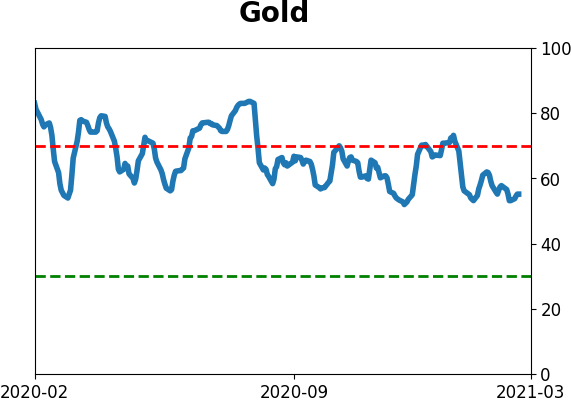
A dollar trying to rebound from a severe short position has weighed on gold and miners. The types of signals they've given in recent weeks, within the context of their recent surge, have usually resulted in higher prices over a medium- to long-term time frame.
|
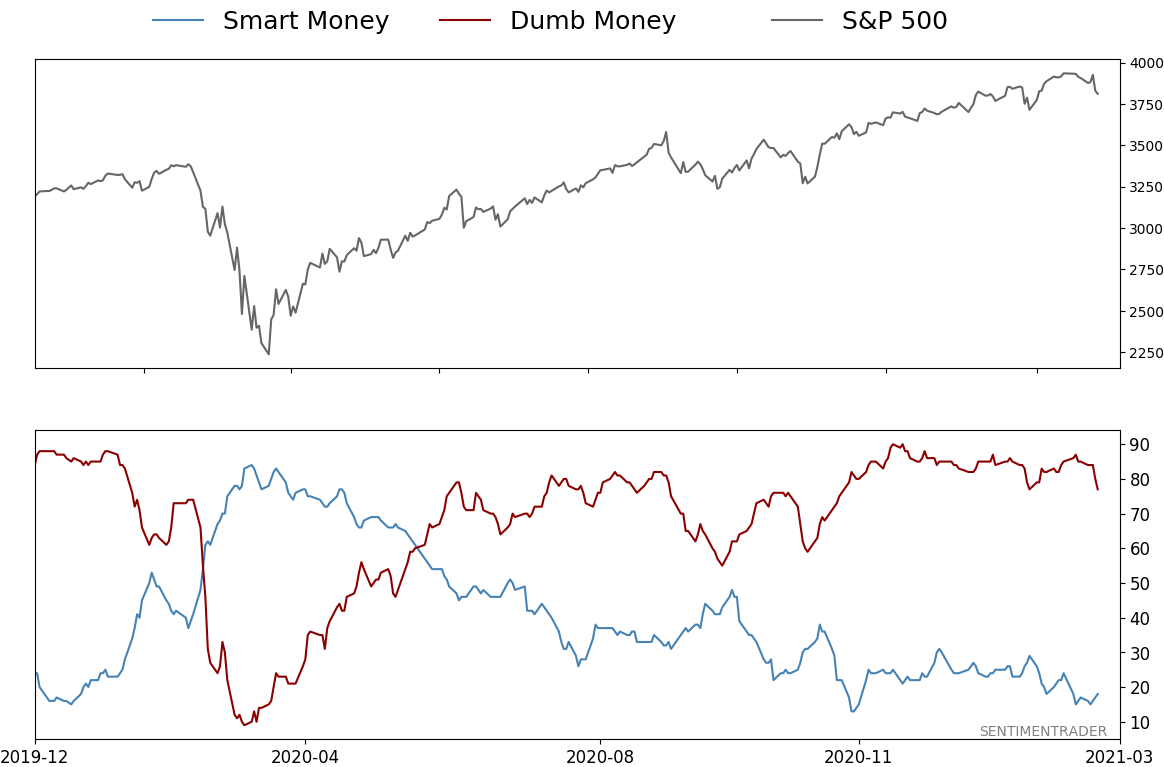
Smart / Dumb Money Confidence
|
Smart Money Confidence: 18%
Dumb Money Confidence: 77%
|
|
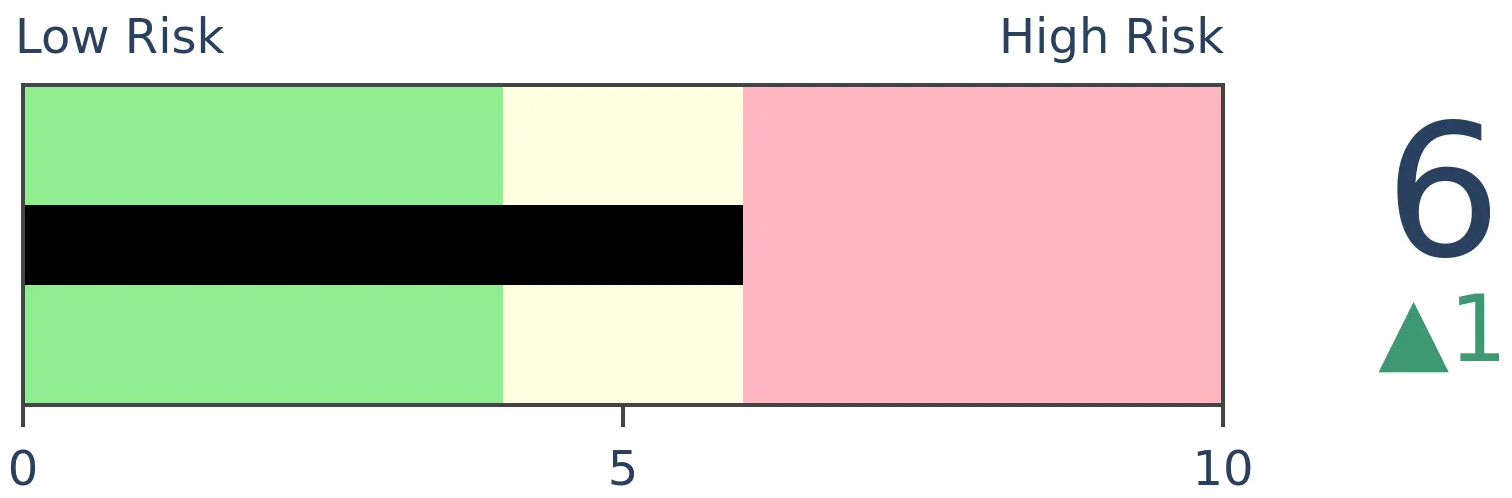
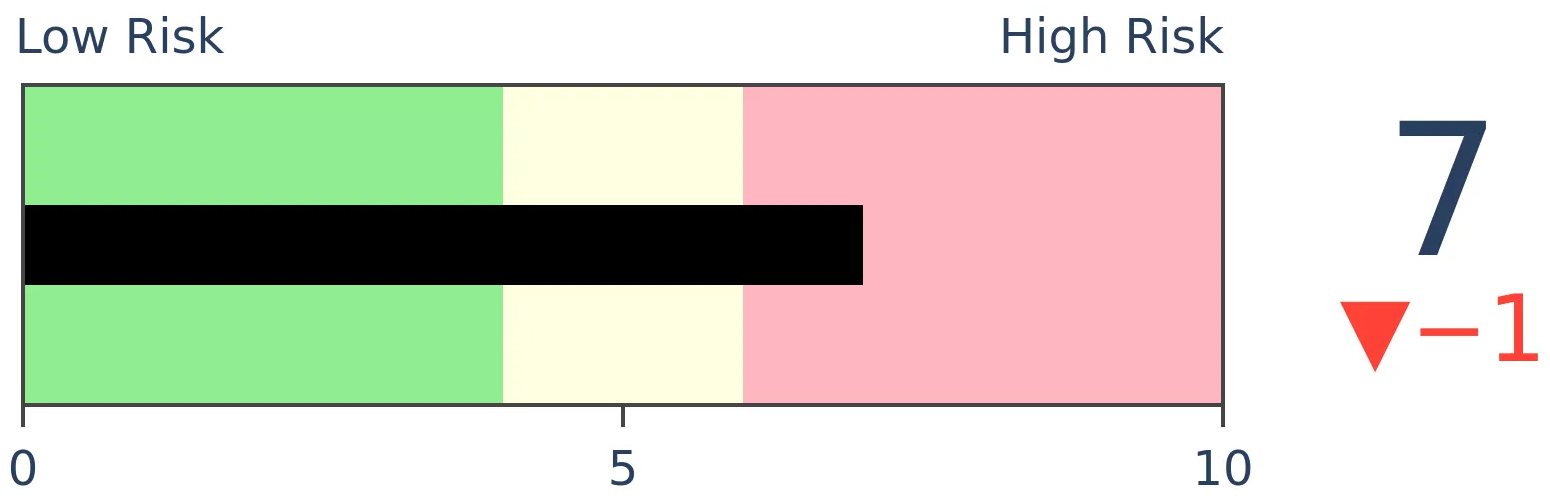
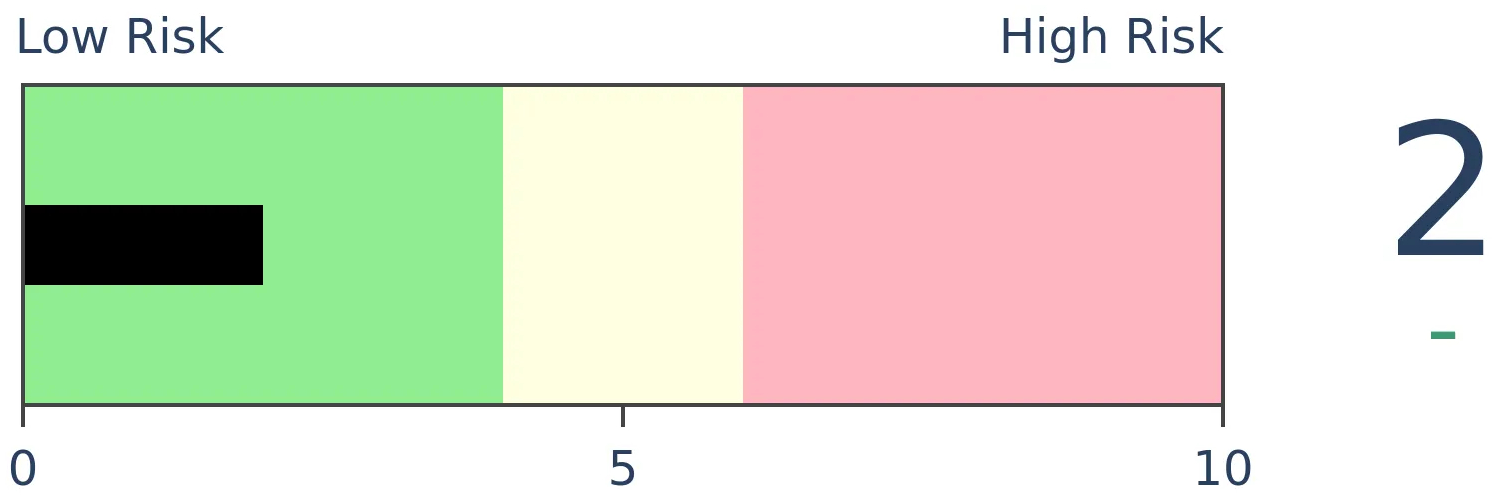
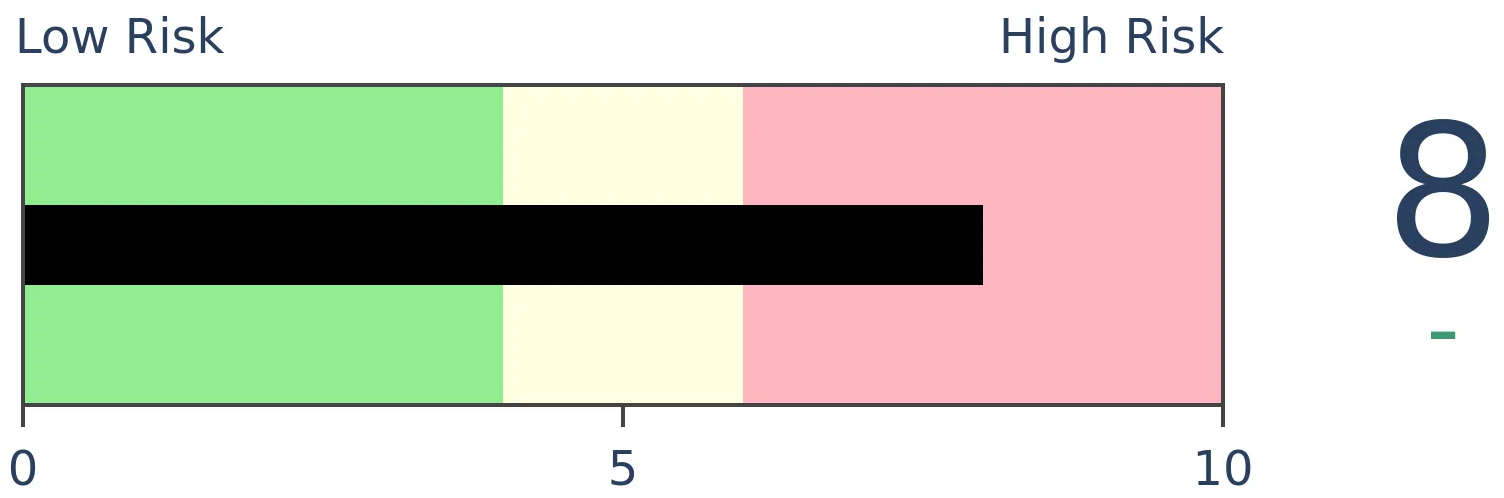
Risk Levels
Stocks Short-Term
|
Stocks Medium-Term
|
|
Bonds

|
Crude Oil

|
|
Gold
|
Agriculture
|
|
Research
BOTTOM LINE
While signs of speculation have ebbed thanks to wobbling prices, there is still little evidence of internal deterioration. Even a small pullback generated a big spike in already-elevated volatility, with the selloff in bonds triggering some wild gyrations.
FORECAST / TIMEFRAME
None
|
The goal of the Weekly Wrap is to summarize our recent research. Some of it includes premium content (underlined links), but we're highlighting the key focus of the research for all. Sometimes there is a lot to digest, with this summary meant to highlight the highest conviction ideas we discussed. Tags will show any related symbols and time frames related to the research.
| STOCKS |
 |
|
|
While a little froth has come off the top of the recent speculative fervor, breadth and momentum remain strong. We're still not seeing consistent and widespread signs of internal deterioration that normally precedes or coincides with a sustained pullback.
The biggest caveat is simply that things have been so positive for so long.
The 50-day average of net new highs is now the highest in at least 14 years. Other times it first reached a very high level, HYG struggled over the next couple of months according to the Backtest Engine. It first became extreme a little over a month ago, so it has been defying gravity since then. It has been a challenge for it to levitate much longer.
Breadth metrics have been solid lately thanks to relatively good performance among smaller stocks, which have an outsized influence on breadth measures. Using the total return on small-cap stocks versus large-cap stocks going back to 1926, this is indeed the best relative performance for small stocks through trading day #34 since 2000, even though it's far from their best-ever.
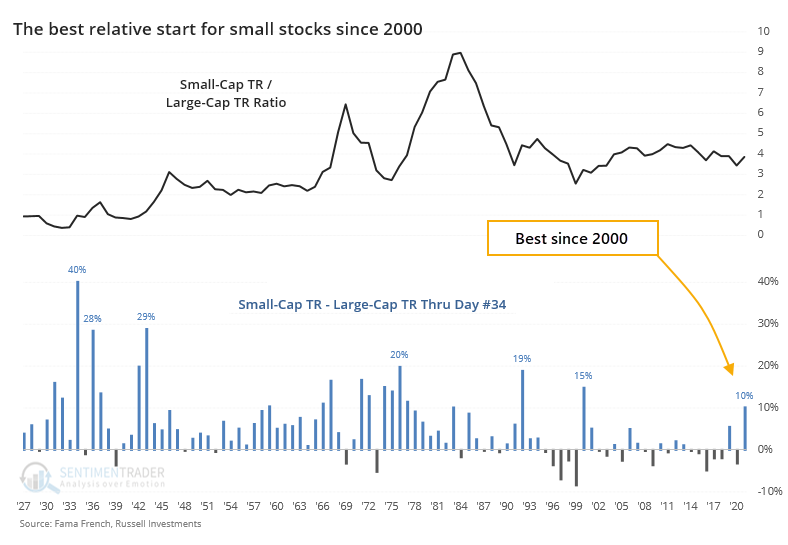
As for what it might mean, smaller stocks continued to outperform larger stocks in the shorter-term, but over the next 6 months or so, larger stocks tended to assert dominance.
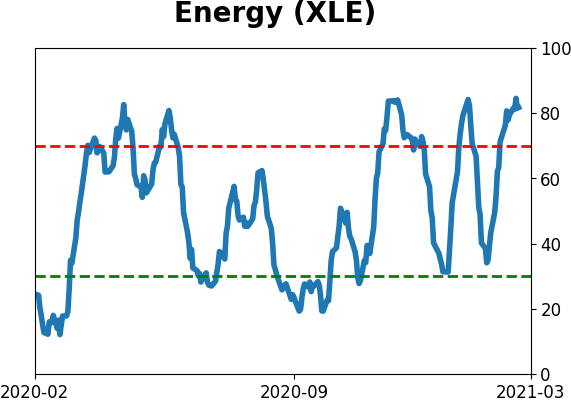
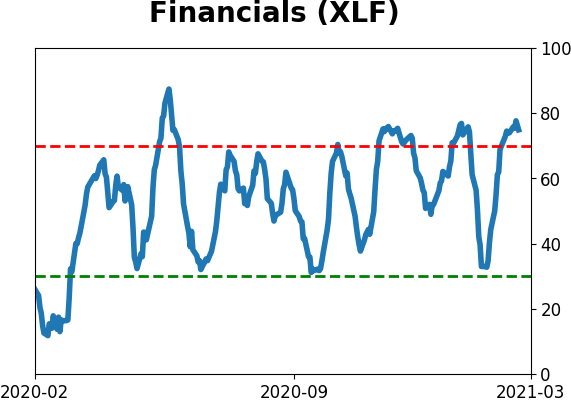
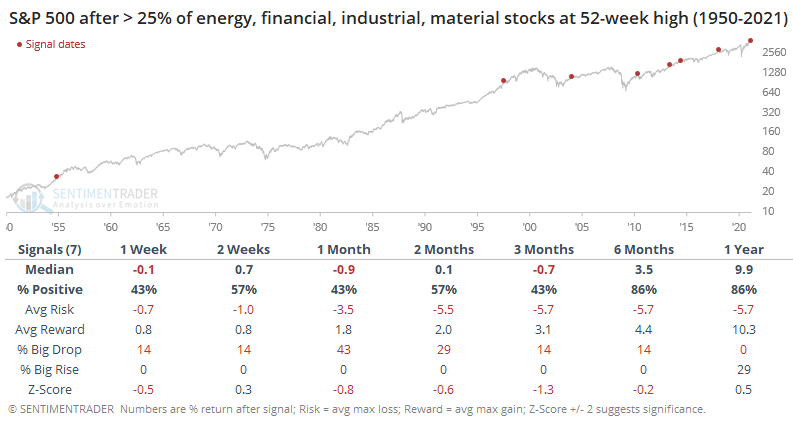
Earlier in the week, financial stocks enjoyed a broad breakout, with nearly 30% of stocks in the sector breaking out to at least a 52-week high. Then they were joined by a bunch of recovery-sector buddies, too. At least 30% of member stocks in Energy, Financials, Industrials, and Materials reached a new high on Wednesday. That's among the most impressive breakouts in 70 years for sectors geared to an economic recovery.
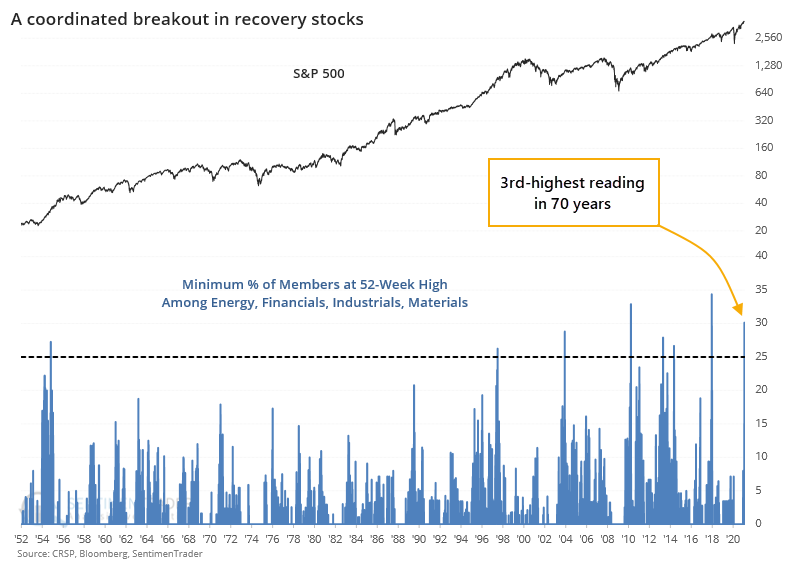
While the assumption that this is a good sign for the broader market holds up in the long-term, the short- to medium-term was more likely to show exhaustion, with a poor risk/reward ratio over the next few months.
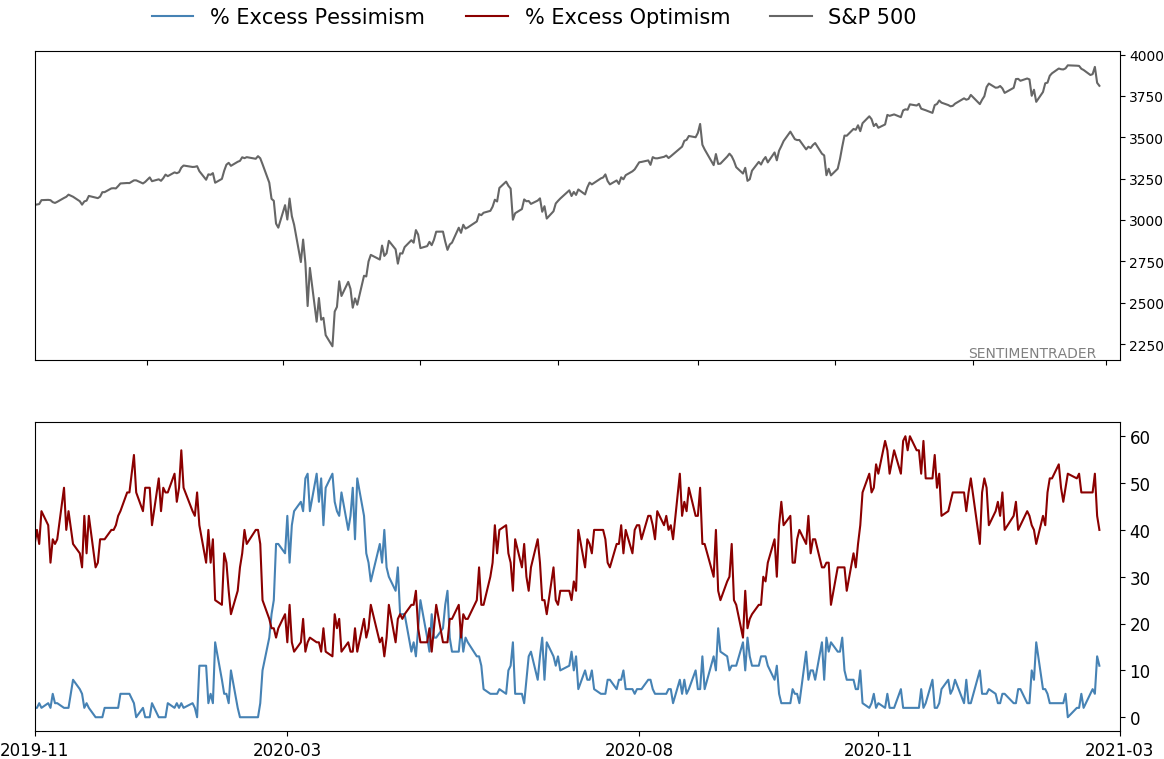
One odd wrinkle is that heading into this week, the VIX had been curiously high relative to realized volatility. This has usually suggested "irrational" fear among investors, with a tendency to lead to gains for stocks.
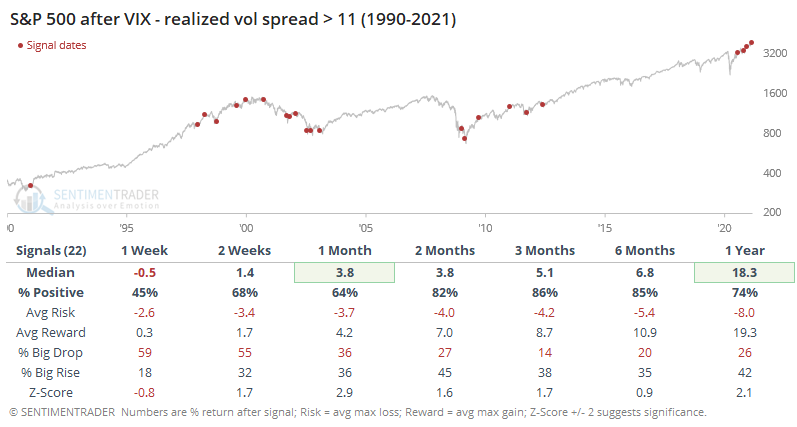
However, we've never seen the VIX so elevated above realized volatility, for so long. The 50-day average of this spread is near record highs, which is more likely to happen when stocks are selling off than when they're rallying. There have been only two other times it has been this wide while stocks are trading at or near a 52-week high - June 1998, and October 2009. Neither were terrible for stocks, especially longer-term, but in the interim, there were some issues.
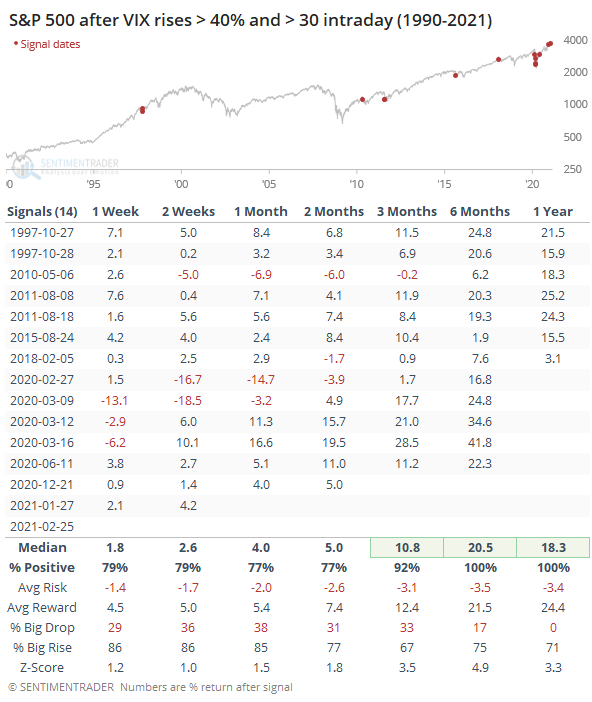
Even though it was already somewhat high, it spiked even further on Thursday. While that preceded a few nasty surprises for short-term traders, for longer-term investors these surges proved to be good entry points with particularly good characteristics 6 months later.
So, we've seen record speculative activity, sprinkled with some spikes in fear, which is odd. But we still have not seen consistent deterioration under the surface, either in the U.S. or overseas.
Dean highlighted impressive participation in the Asia-Pacific region using a breadth composite that uses the percentage of issues above their 200-day moving average and percentage spread between 252-day highs and lows. The composite remains firm across several country indices across the Asia-Pacific region.
While off the best levels, market participation remains very positive for the Nikkei 225, for example.
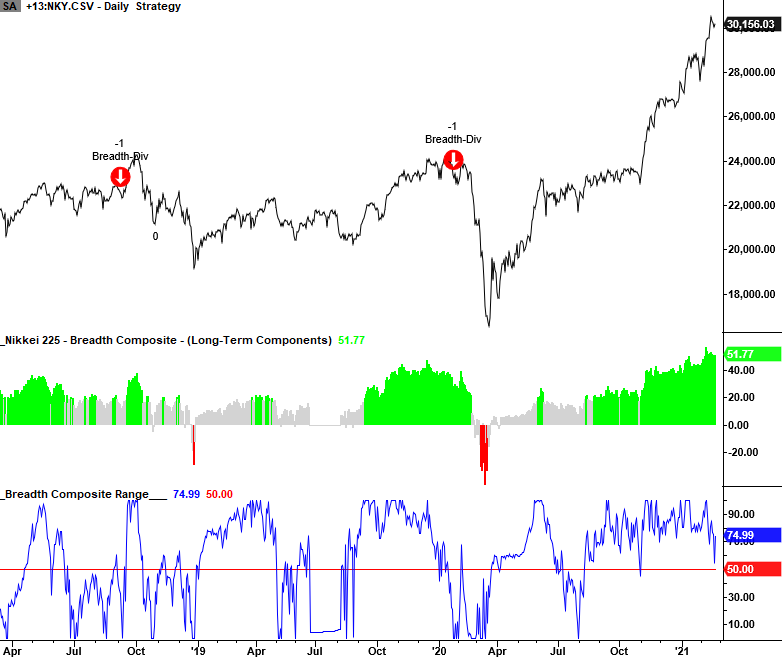
When divergences occur, he likes to see them across several countries simultaneously, but the global reflation/recovery story remains constructive so far with no warning signs triggering yet.
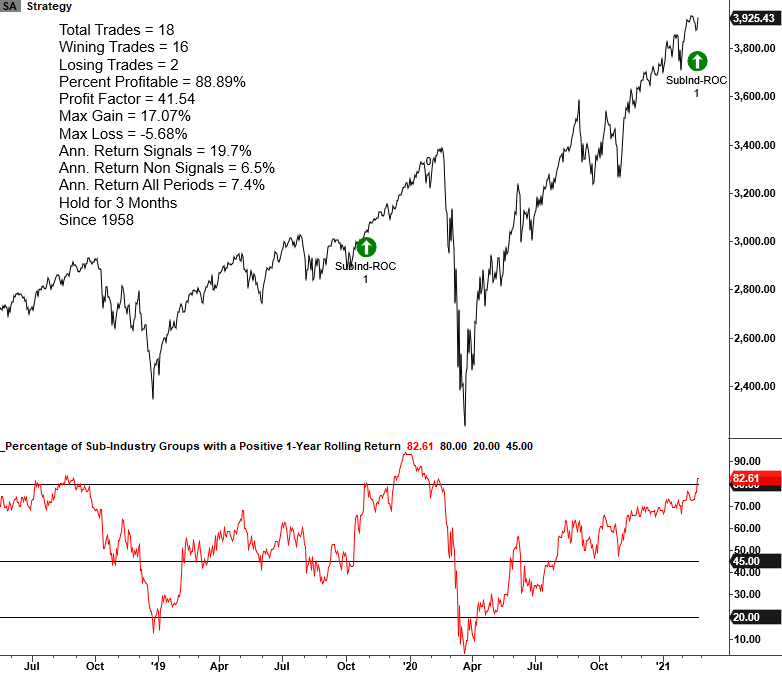
Dean also noted that in his Tactical Composite Trend Model (TCTM) update last week, one of the ten components in the Composite Confirmation Model (CCM) had failed to register a buy signal post the pandemic low. The indicator measures the percentage of sub-industry groups with a positive 1-year rolling return.
It has taken a while, but it just triggered. Buying after these signals and holding for 3 months resulted in 16 wins out of 18 attempts.
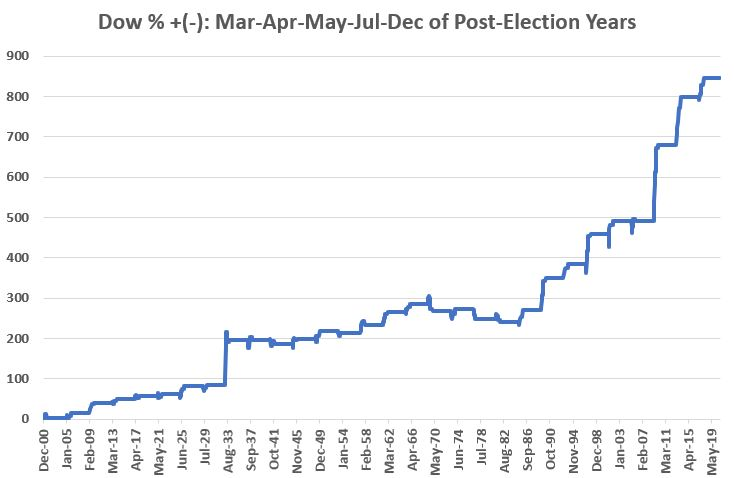
If we put any faith in post-presidential-election seasonality, then any pullbacks from the speculative fervor should be somewhat limited. Jay pointed out that the next few months have a positive bias. During post-election years the most favorable months have been March, April, May, July, and December.
The chart below displays the cumulative price % +(-) for the Dow Jones Industrials Average ONLY during these 5 months.
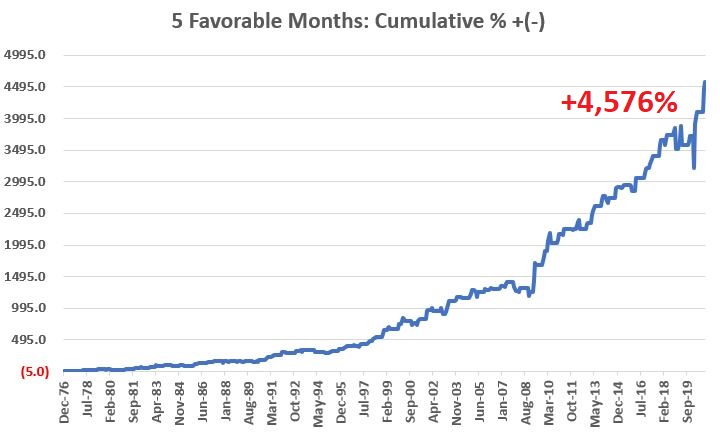
He also highlighted a specific sector that has consistently behaved well during the springs and again toward the ends of most years - Consumer Discretionary.
He looked at the Discretionary sector's total return during March, April, May, November, and December versus all other months from January 1977 through December 2020. The chart below displays the cumulative total return for the sector ONLY during the 5 "favorable" months, with gains that far surpassed all of the other months.
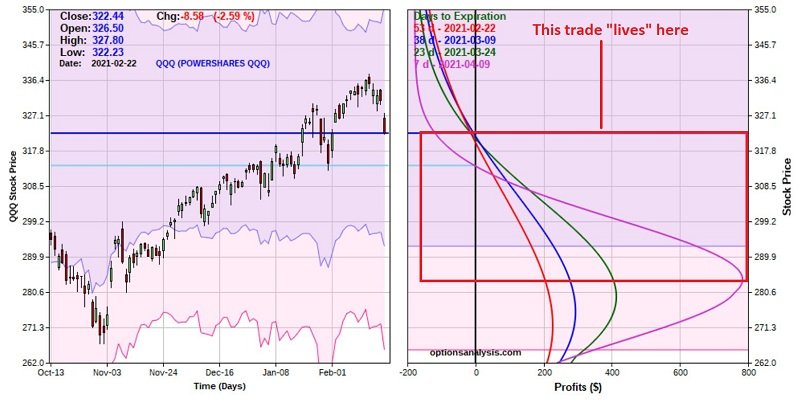
Since there is so much conflicting data right now, especially over a medium-term time frame, Jay outlined a way to trade a potential run-of-the-mill pullback via a "quick and dirty" hedge on QQQ. Technically, it's a 1x2x1 put butterfly spread, and if QQQ were to suffer a mild but not catastrophic decline over the next couple of months, it would provide an excellent risk/reward hedge.
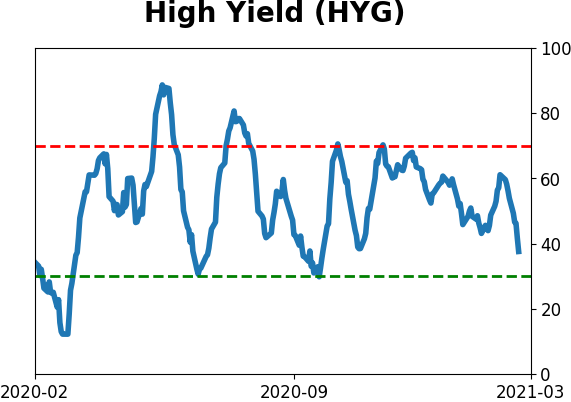
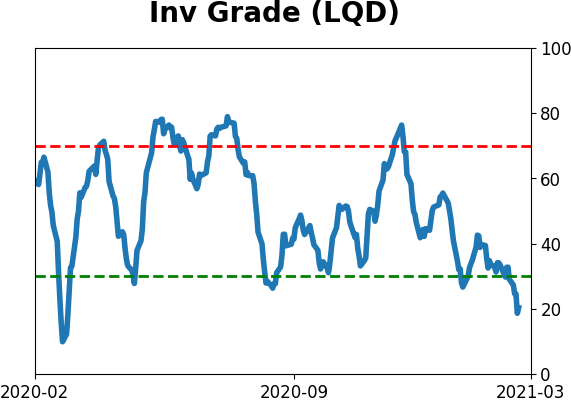
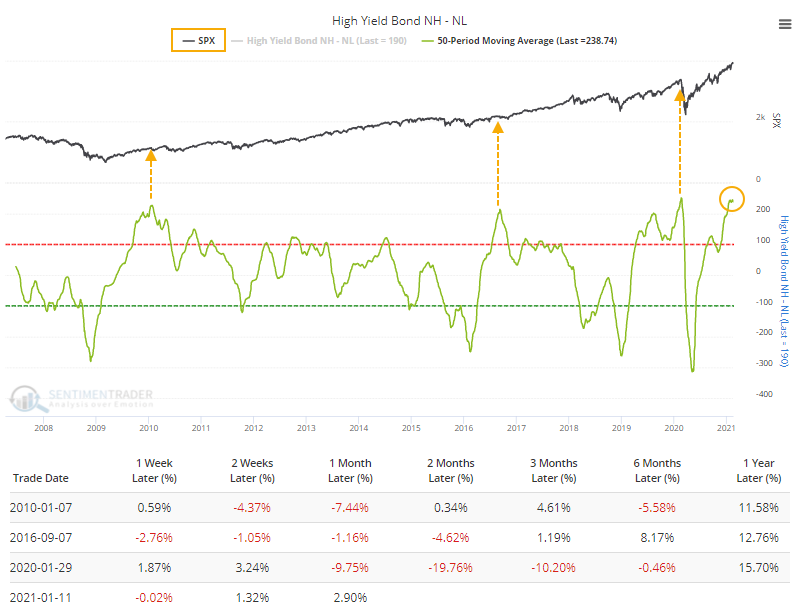
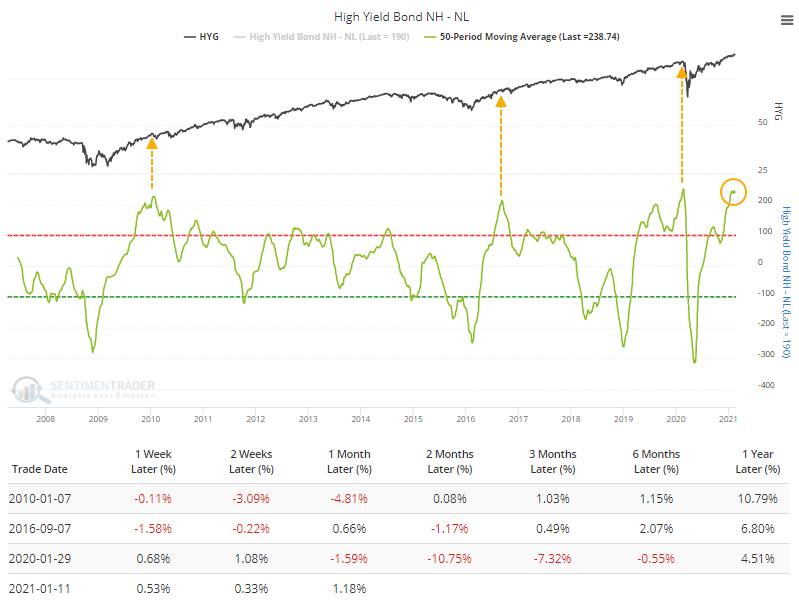
Fund flows in HYG have been quite negative (but not as negative as investment-grade funds like LQD or Treasury funds like TLT). But that hasn't had much of an impact on the internal health of that market.
One of the primary gauges for that is the net percentage of high-yield bonds that are hitting 52-week highs minus those falling to 52-week lows. If it's positive, then it's a good sign for both high-yield bonds and the stock market.
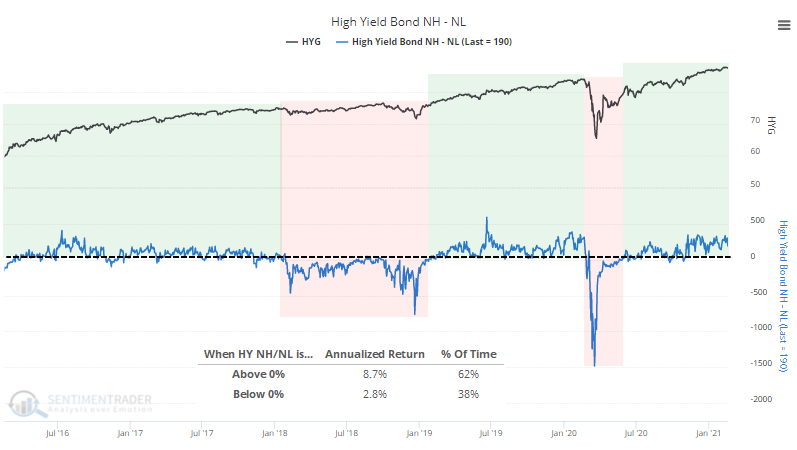
The biggest caveat is simply that things have been so positive for so long. After these instances, by the time there were more new lows than new highs, the declines were about over.
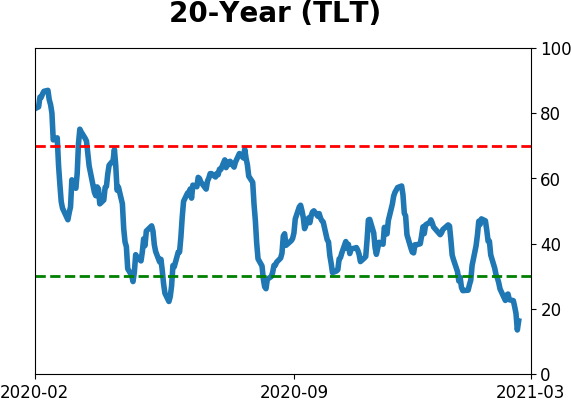
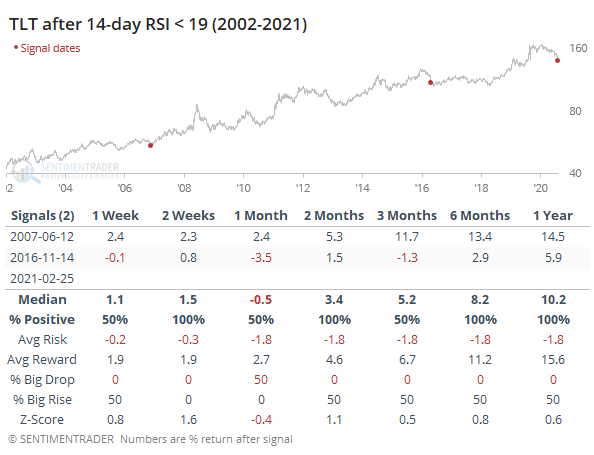
It's been in Treasuries, especially longer-term ones, where the most trouble has been. We don't often see the bond market break like it did this week. For the most popular Treasury bond fund, TLT, the selling pressure has been enough that its 14-day Relative Strength Index (RSI) fell below 19 for only the 3rd time in its history.
One difference this time is how quickly that 10-year yields cycled from a 1-year low to 1-year high. When Dean looked at prior cycles, there was a tendency to see yields continue to rise (prices to fall), especially when yields were cycling up from a very low level like they are now.
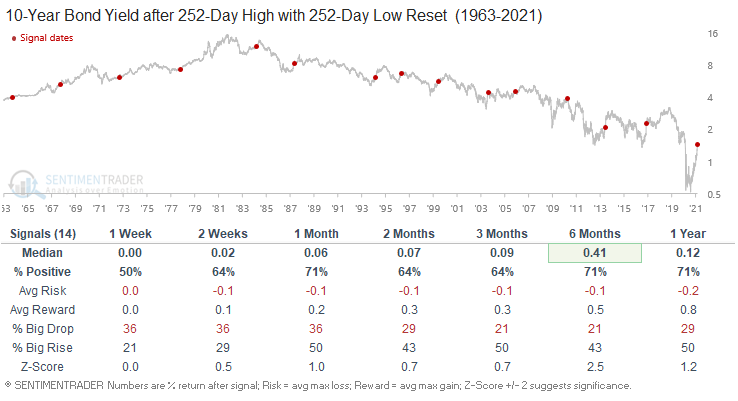
This raises the probability that any oversold condition in note/bond prices now would only lead to a temporary reprieve.
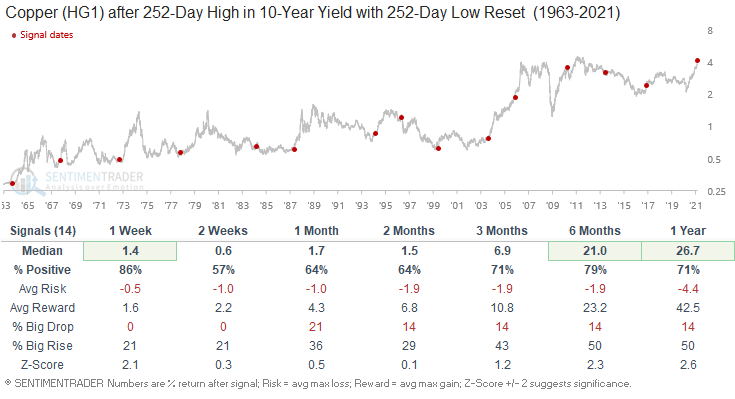
Jay added to an earlier piece from Dean about copper's recent run.
In Dean's piece, he highlighted that it is significant when copper rises more than 49% in 12 months. The chart below displays the 252-trading day percentage price change in the price of copper as well as the +49% "line of demarcation". As you can see, it is not something that happens often.
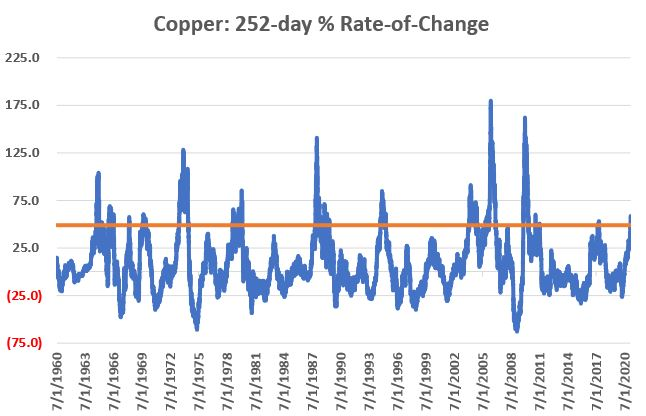
The test he did involved buying a copper contract if copper is up +49% or more over the latest 252 trading day period for the first time in 63 trading days. Once a thrust like that occurs, we will hold until either copper rises 30% or more from the day of the thrust signal, or 126 trading days go by.
The chart below shows the cumulative hypothetical dollar gain by taking advantage of copper's momentum.
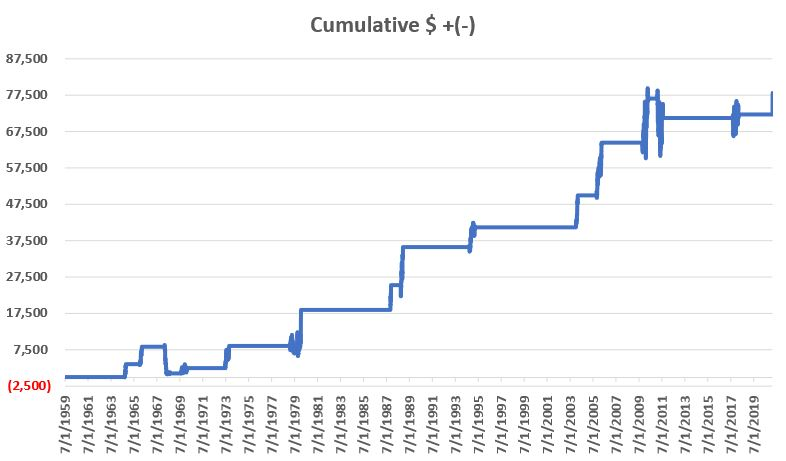
In addition, when Dean looked at the cycle of 10-year yields from a 1-year low to 1-year high, one of the best performers going forward was copper.
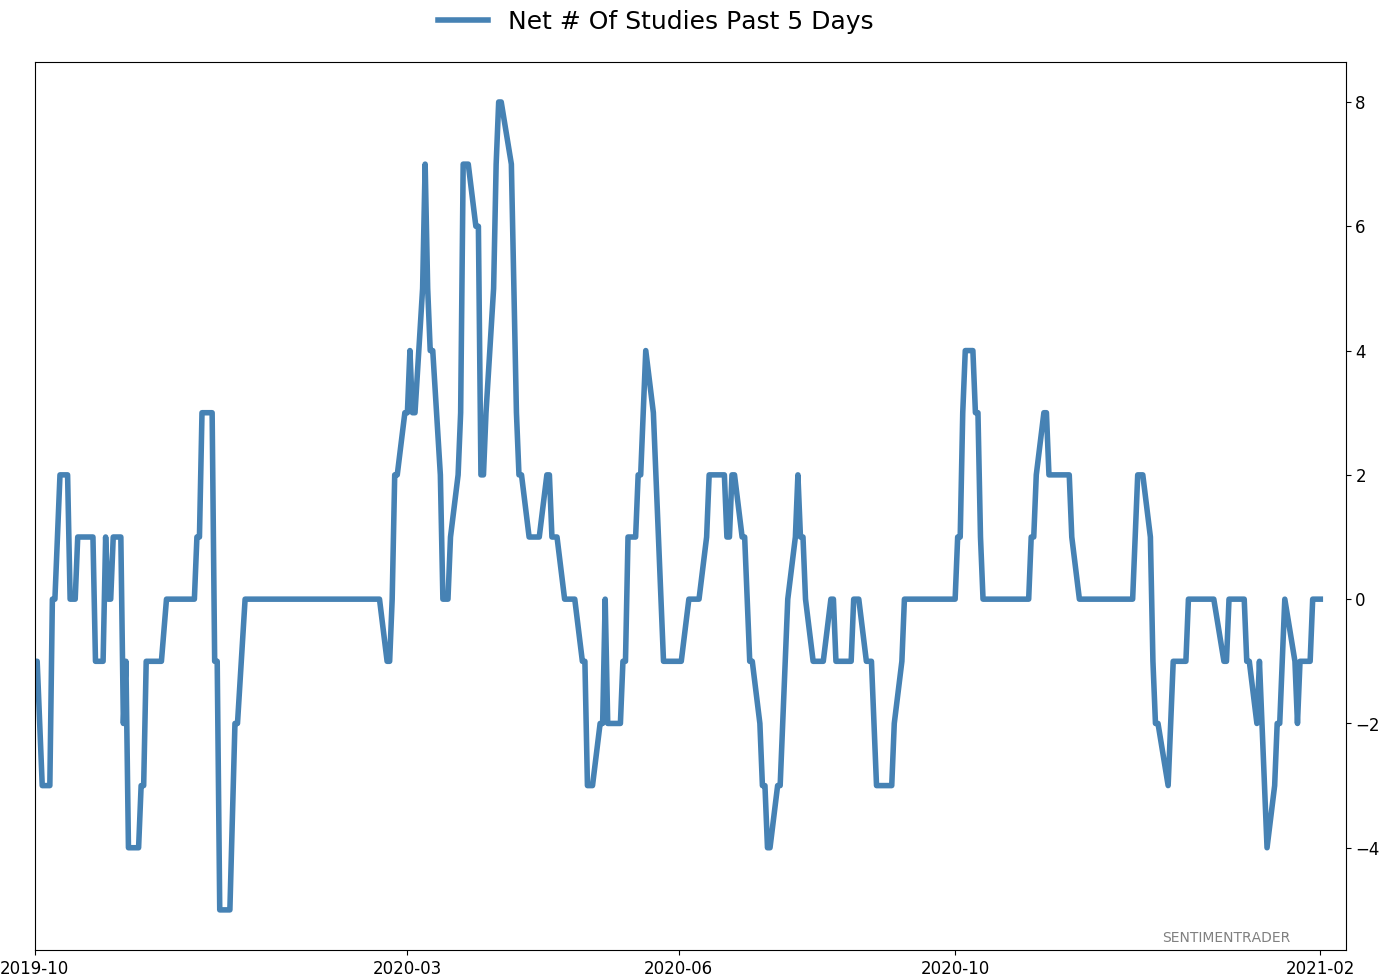
Active Studies
| Time Frame | Bullish | Bearish | | Short-Term | 0 | 0 | | Medium-Term | 2 | 8 | | Long-Term | 16 | 3 |
|
Indicators at Extremes
Portfolio
| Position | Description | Weight % | Added / Reduced | Date | | Stocks | RSP | 4.9 | Reduced 4% | 2021-02-09 | | Bonds | 30.0% BND, 8.8% SCHP | 38.8 | Added 15.1% | 2021-02-18 | | Commodities | GCC | 2.3 | Reduced 2.1%
| 2020-09-04 | | Precious Metals | GDX | 9.0 | Added 0.1% | 2021-02-18 | | Special Situations | 7.3% XLE, 4.8% PSCE | 12.1 | Reduced 5.6% | 2021-02-18 | | Cash | | 32.8 | | |
|
Updates (Changes made today are underlined)
With a market that has seen the kinds of broad participation and big breath thrusts like we did in the fall, it's hard to become too negative. Those kinds of conditions have consistently preceded higher returns over the next 6-12 months. It's the interim that's more of an issue. Even conditions like that haven't prevented some shorter-term pullbacks. And when we combine an environment where speculation is rampant and recent days have seen an increase in cracks under the surface of the indexes, it's enough to become more defensive over a short- to medium-term time frame. We still don't have much confirmation from the price action in the indexes, so those who are more conservative would likely wait before increasing cash levels. I've decreased risk exposure a bit more, mainly in terms of energy stocks and the ANGL fund, while adding more to the broader bond market. RETURN YTD: 5.2% 2020: 8.1%, 2019: 12.6%, 2018: 0.6%, 2017: 3.8%, 2016: 17.1%, 2015: 9.2%, 2014: 14.5%, 2013: 2.2%, 2012: 10.8%, 2011: 16.5%, 2010: 15.3%, 2009: 23.9%, 2008: 16.2%, 2007: 7.8%
|
|
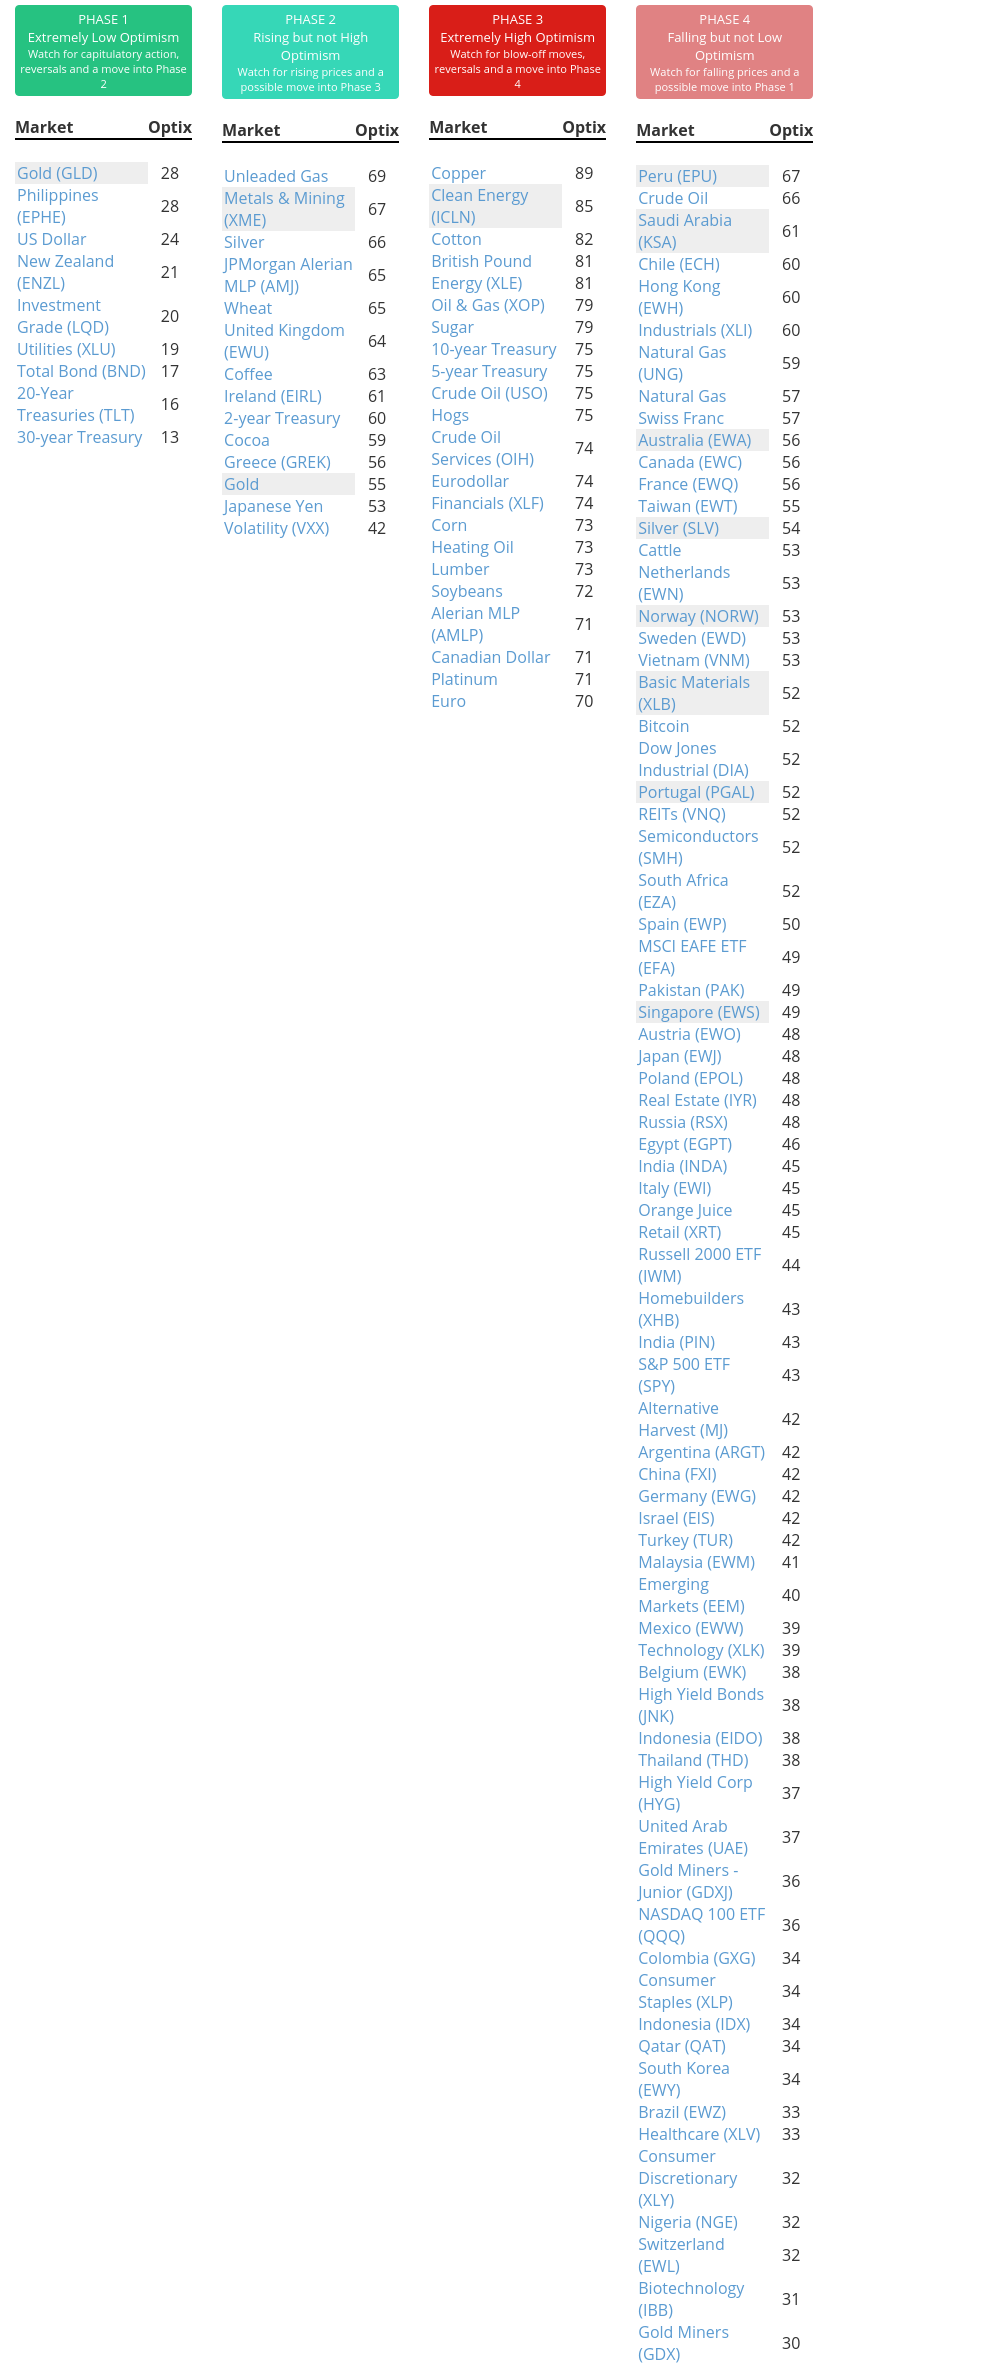
Phase Table
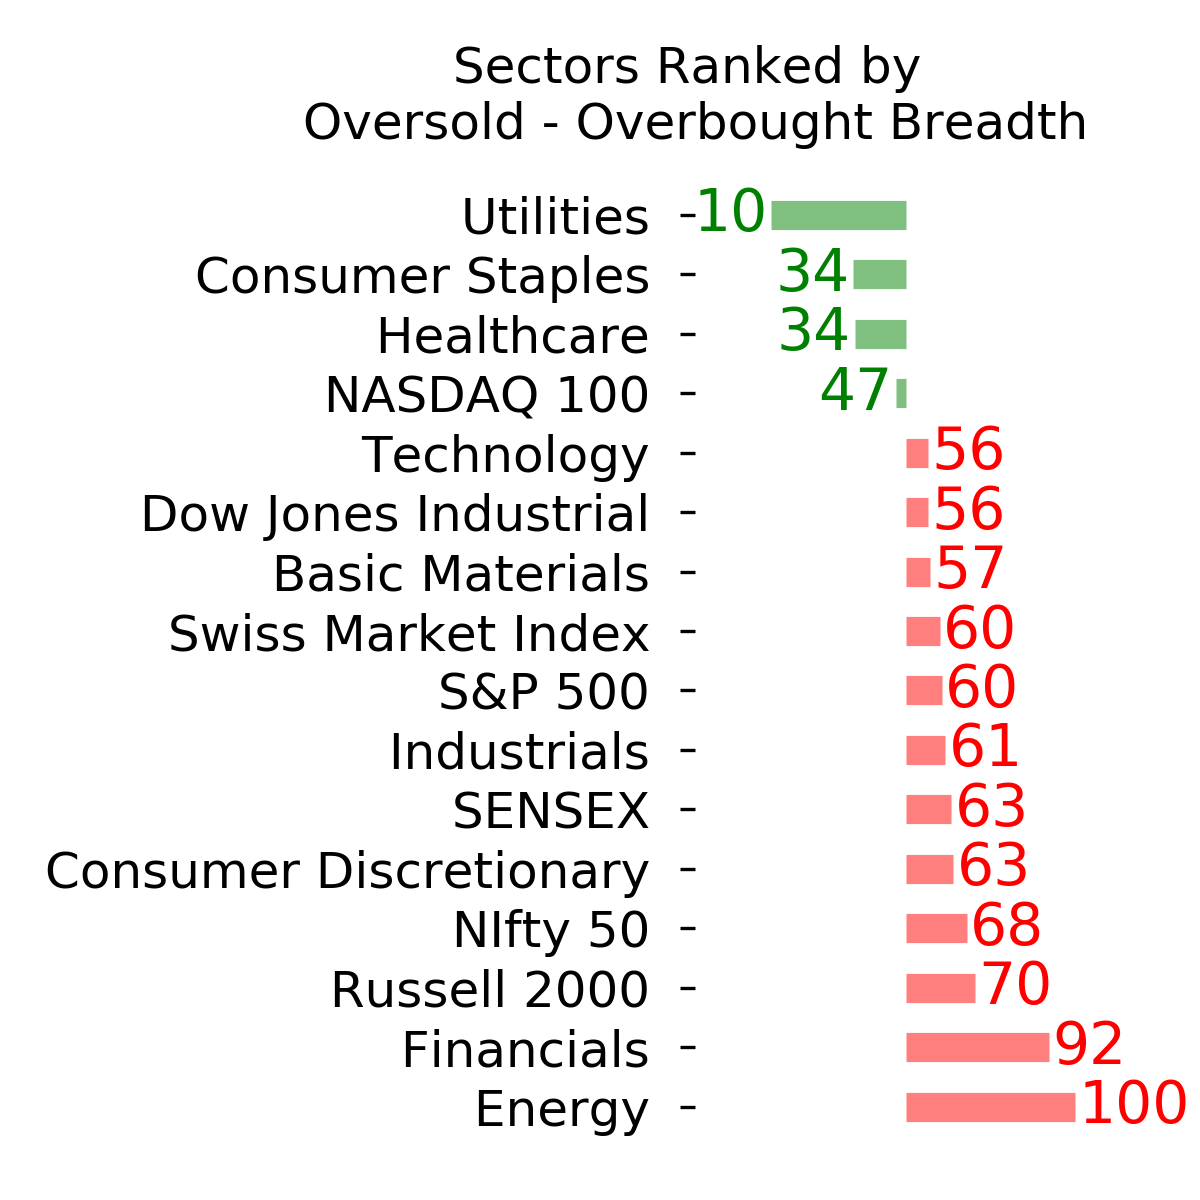
Ranks
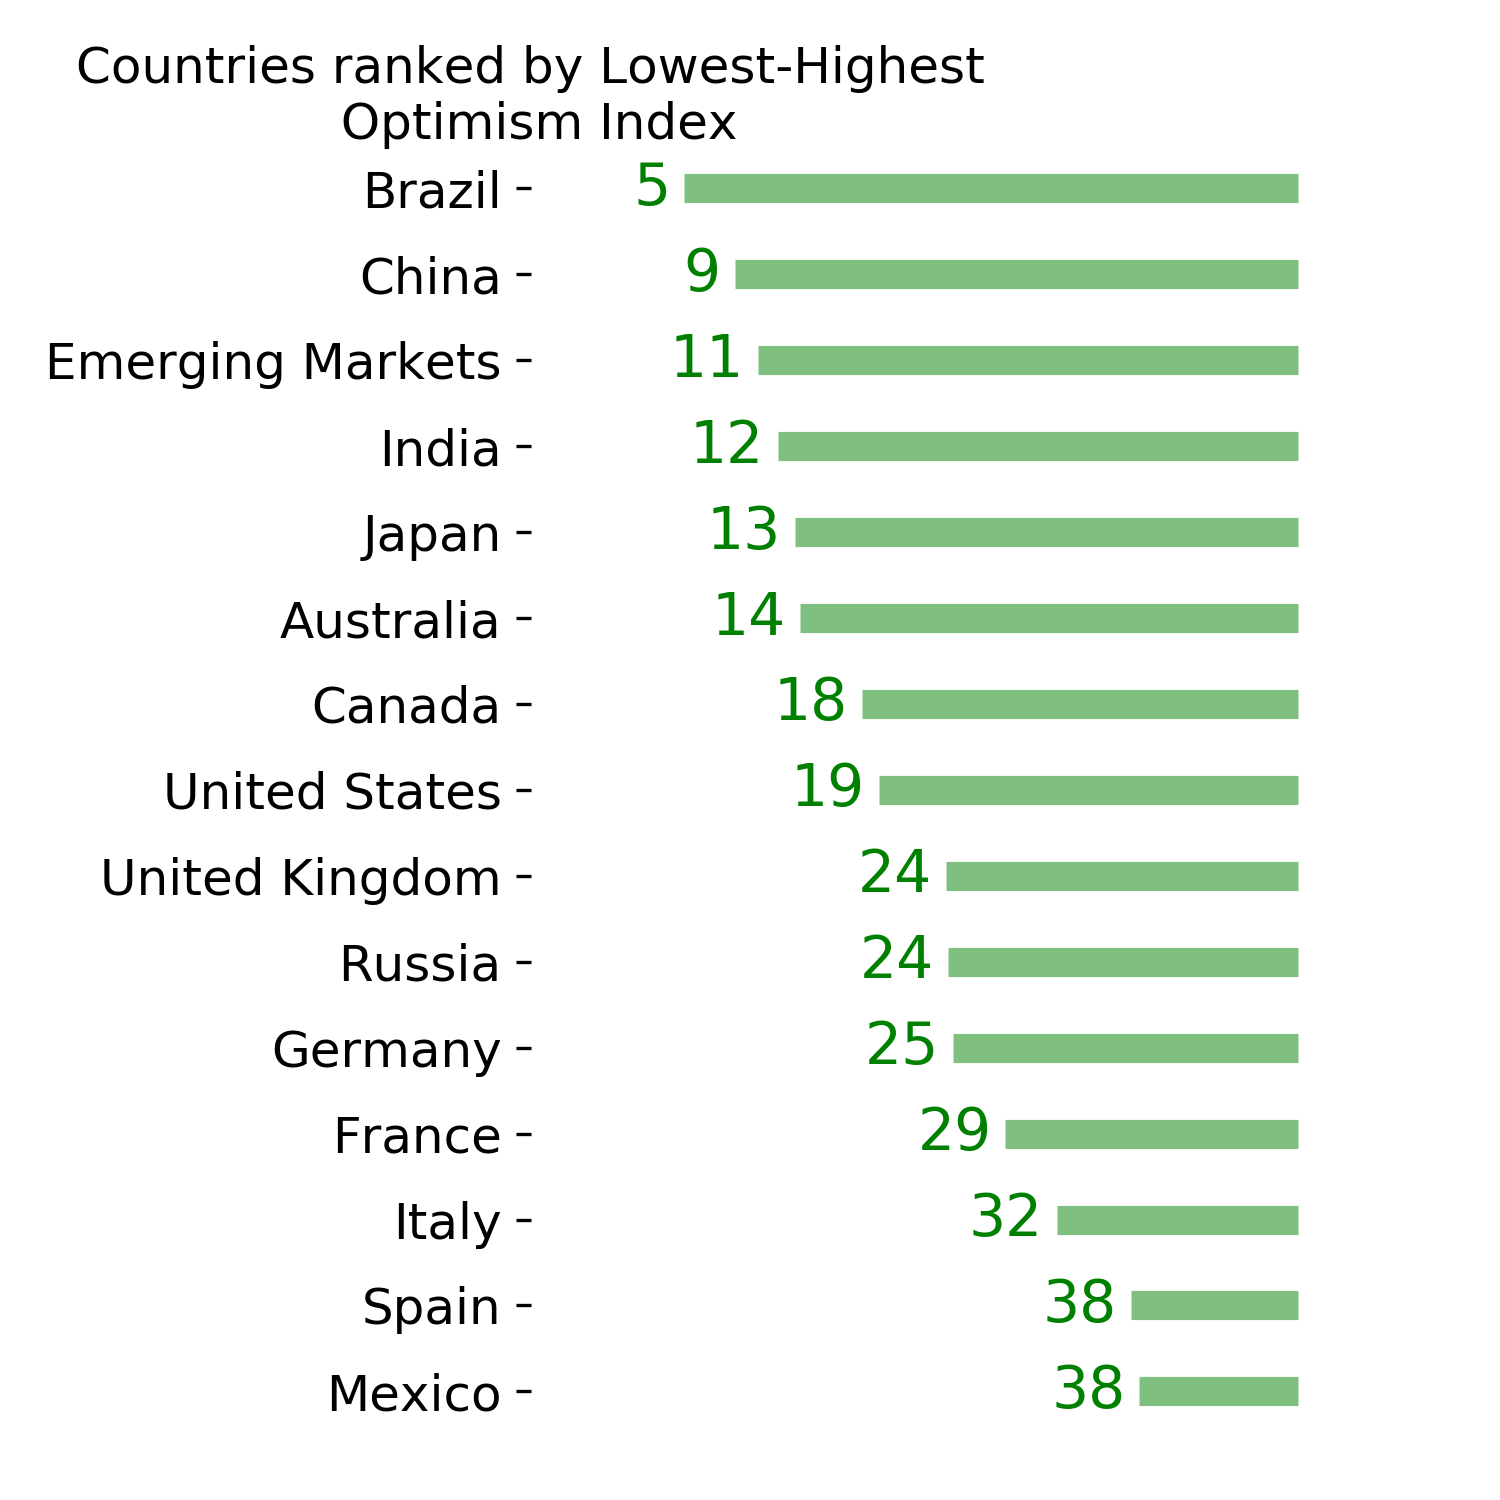
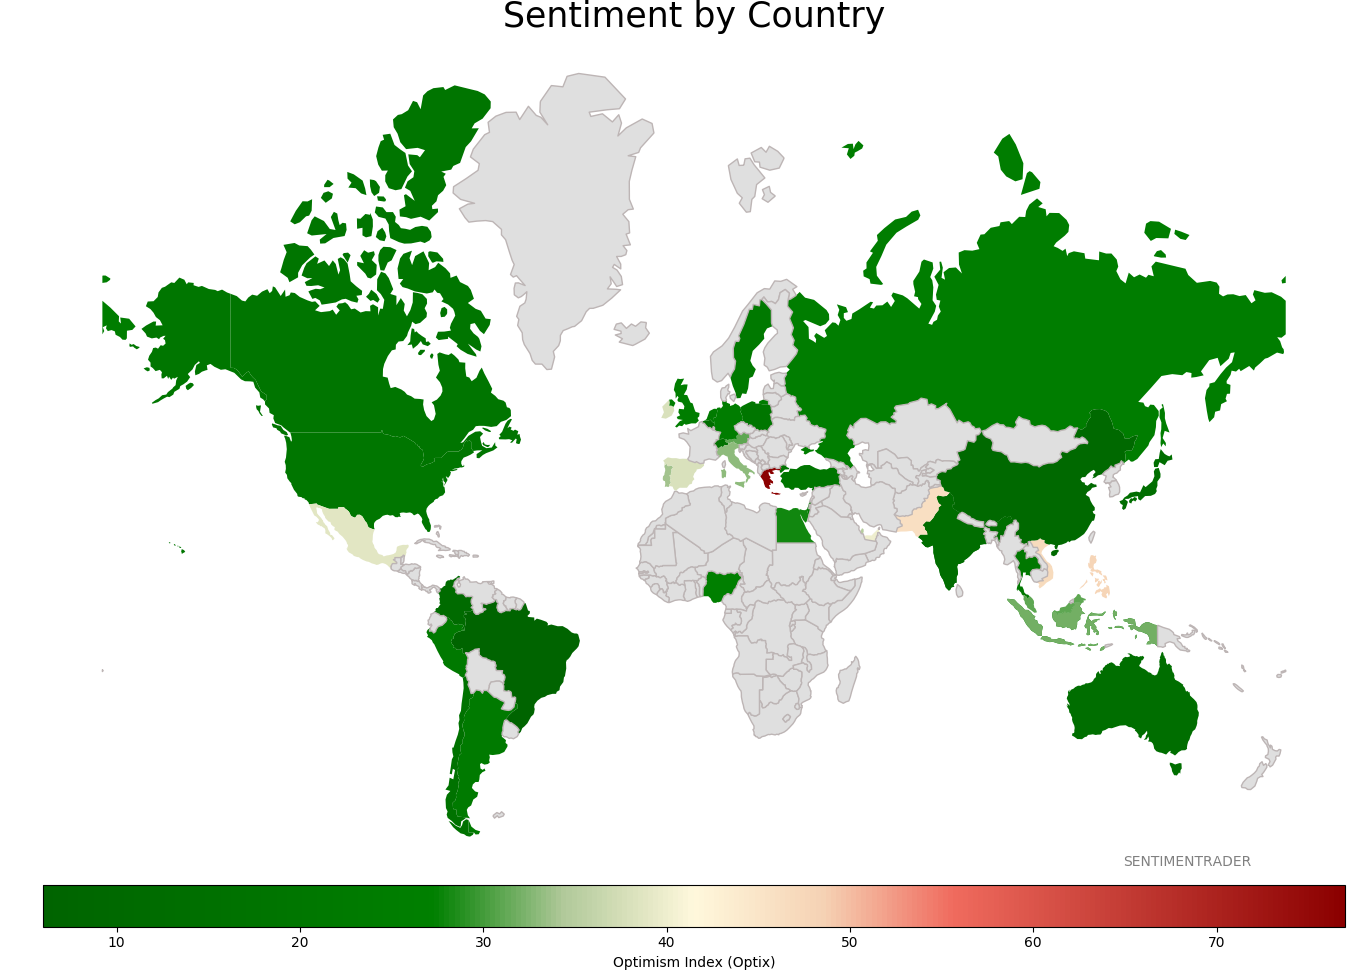
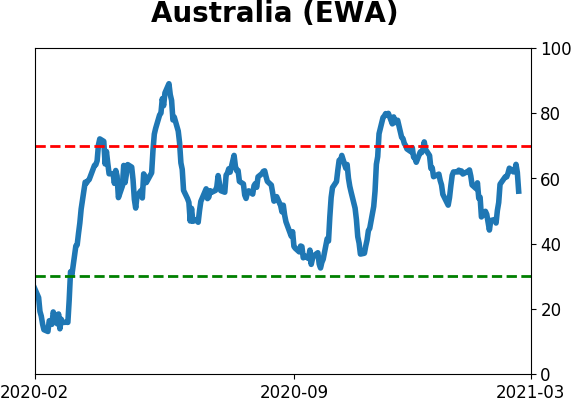
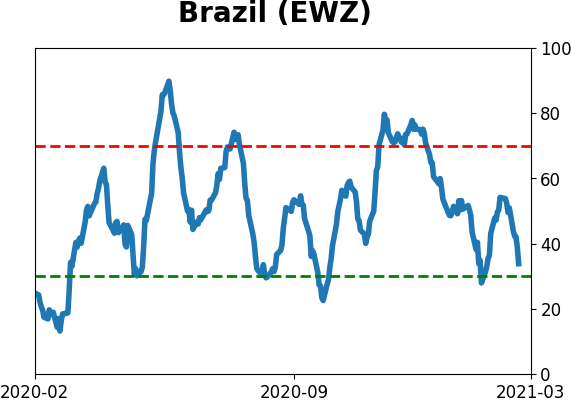
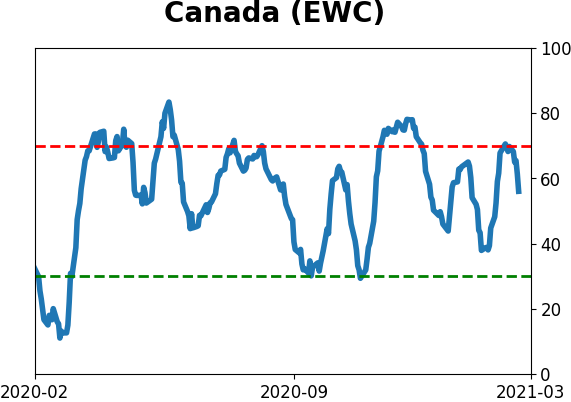
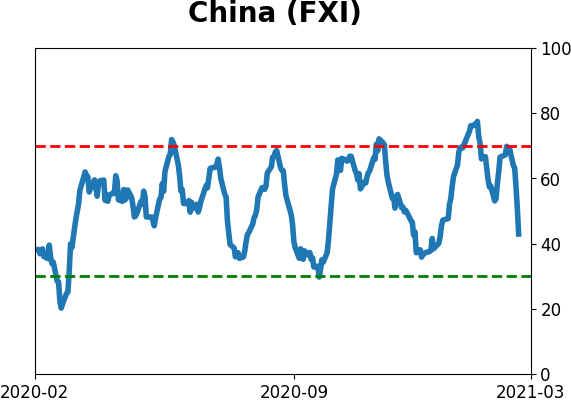
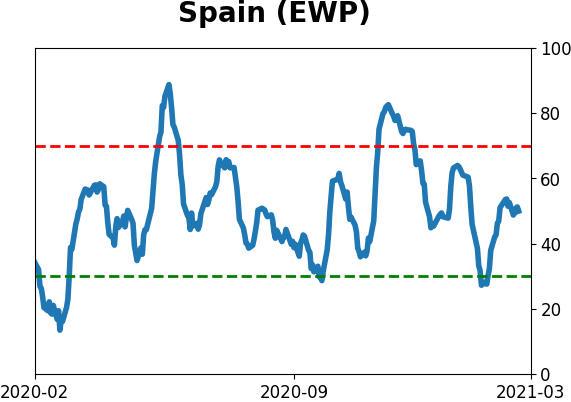
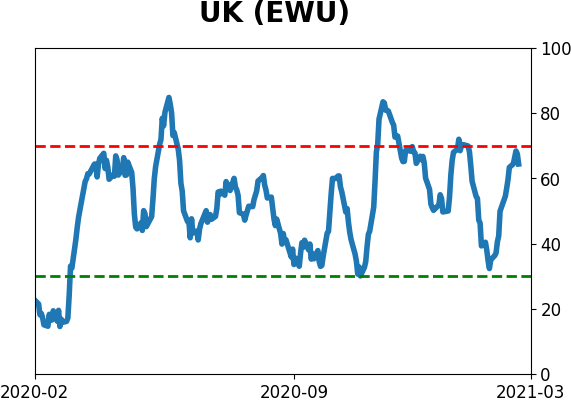
Sentiment Around The World
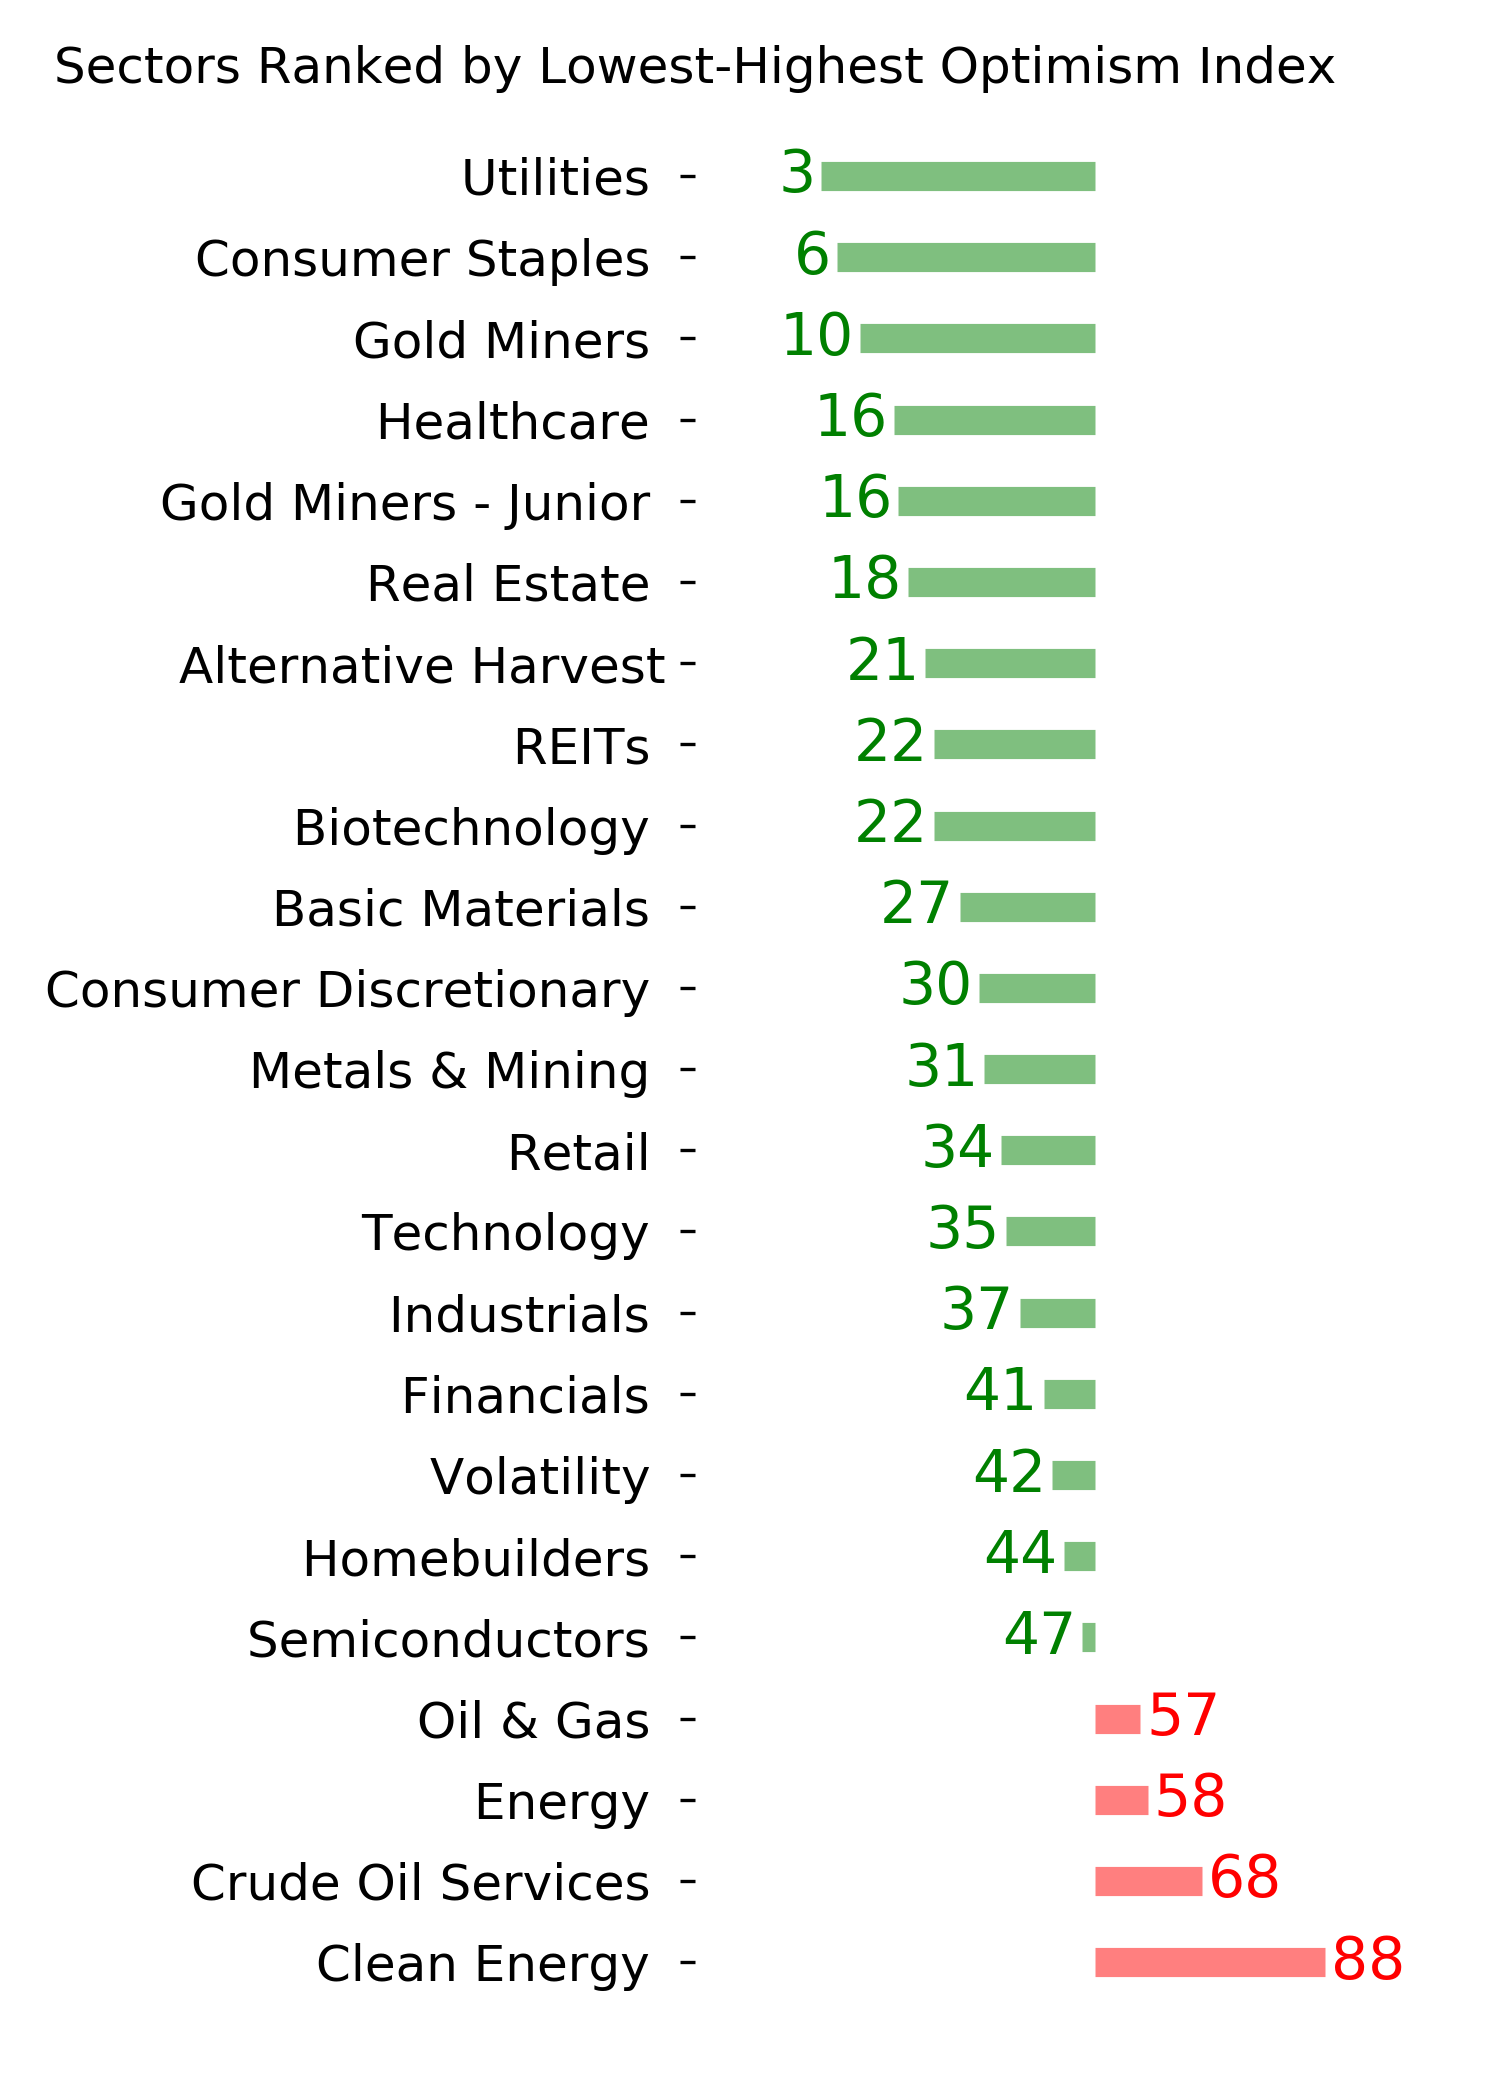
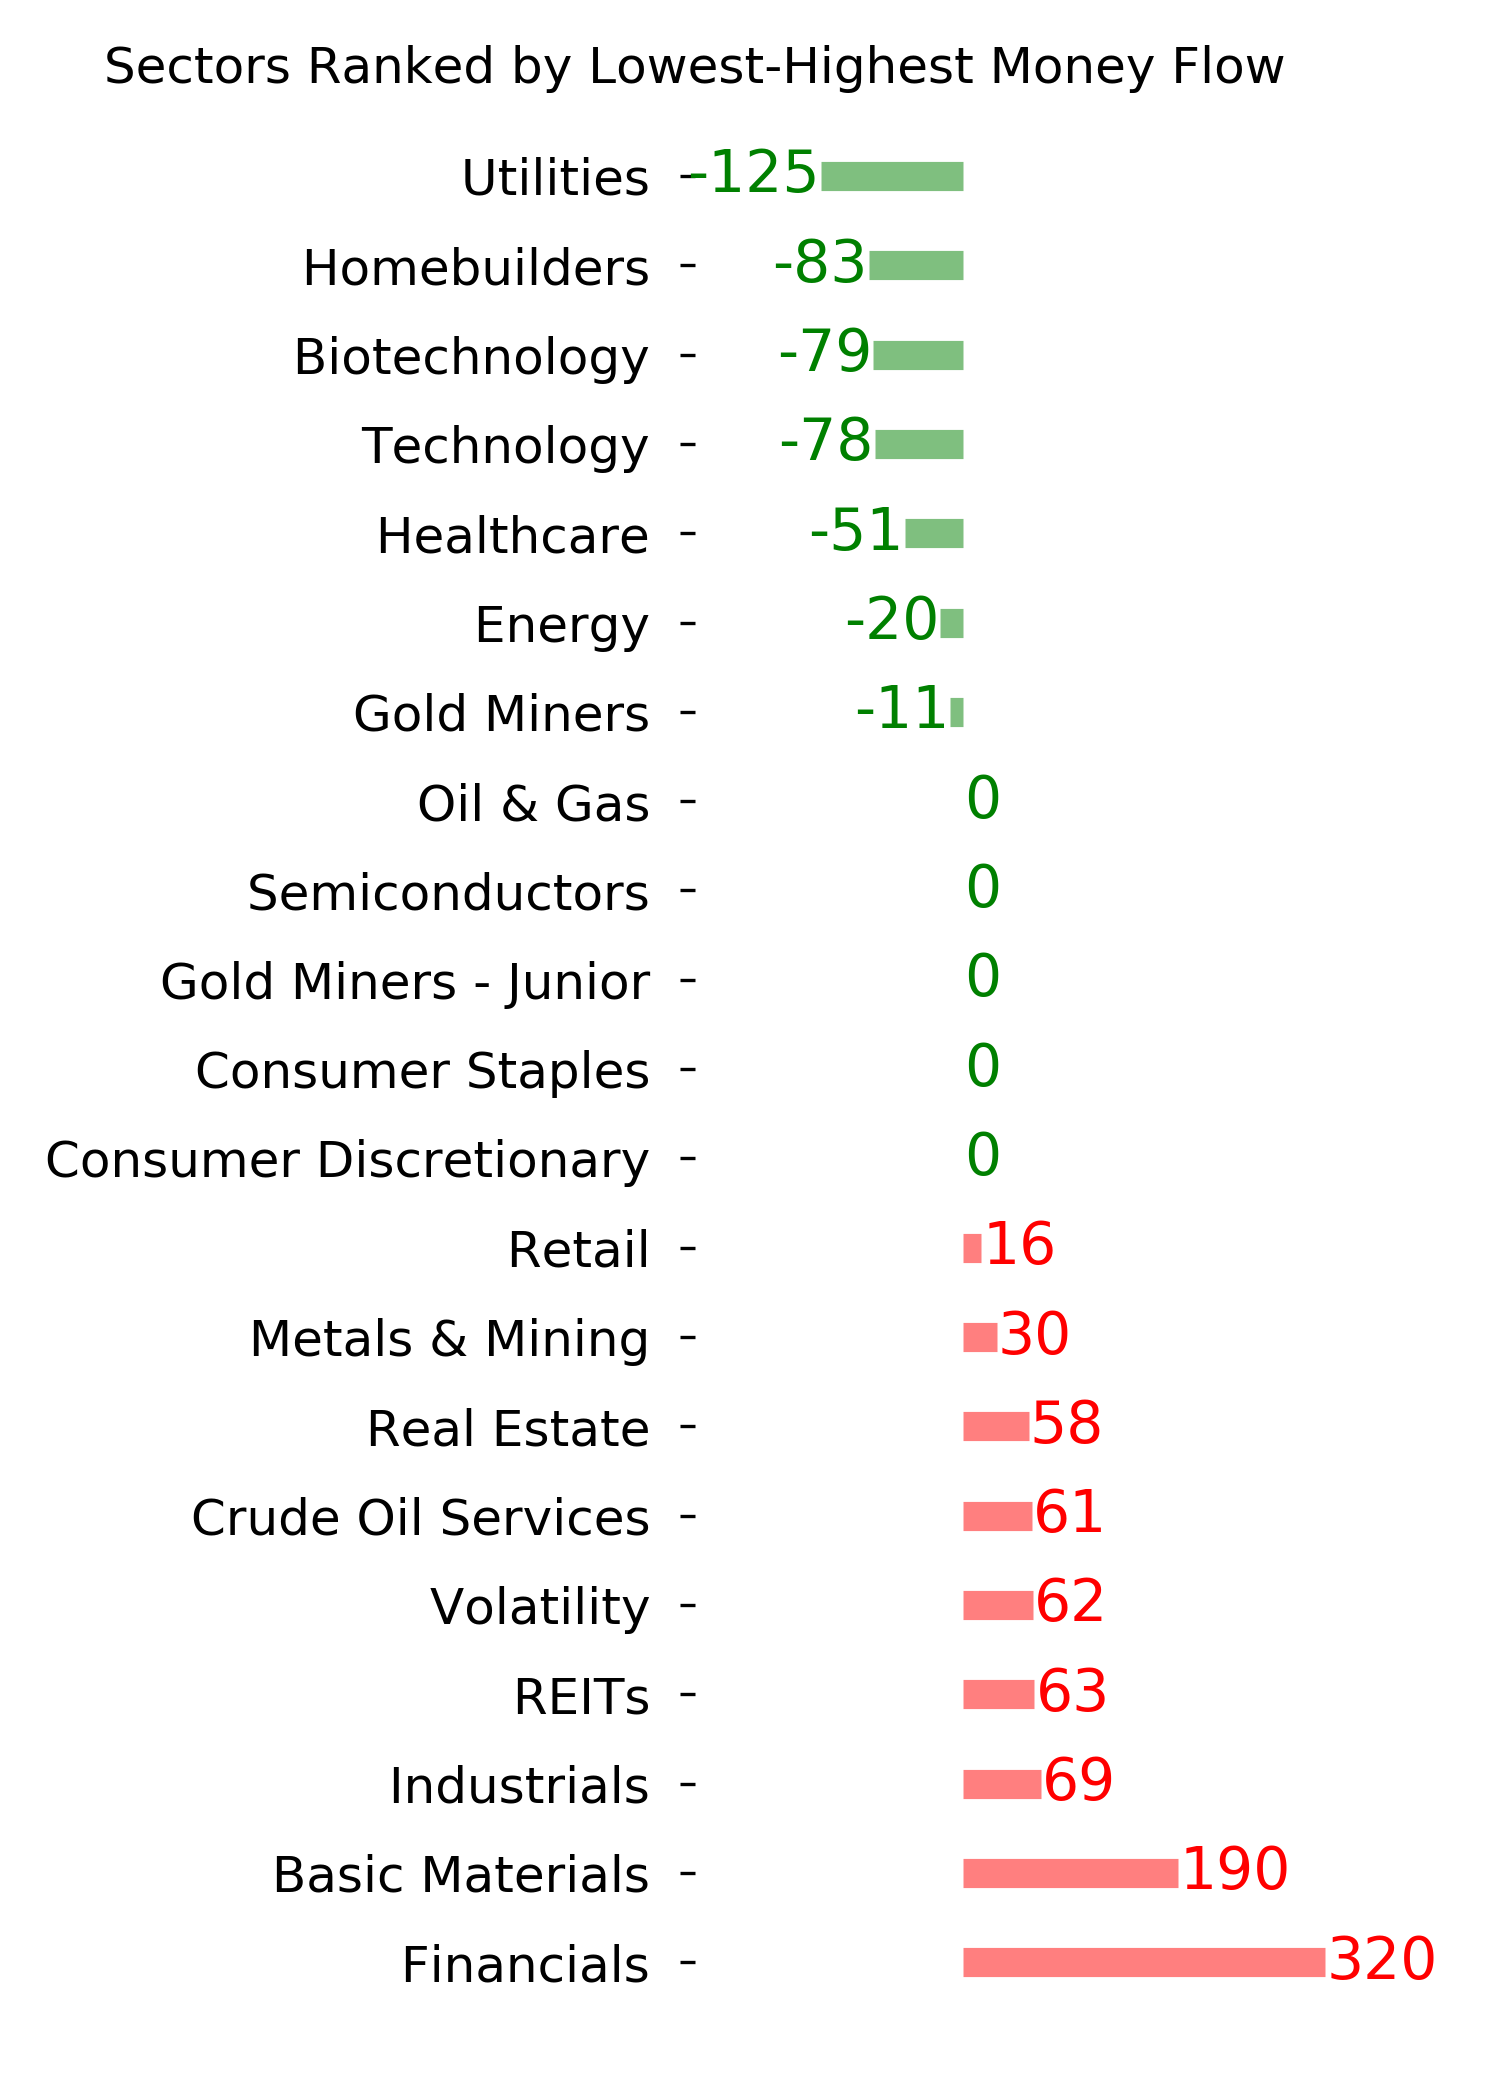
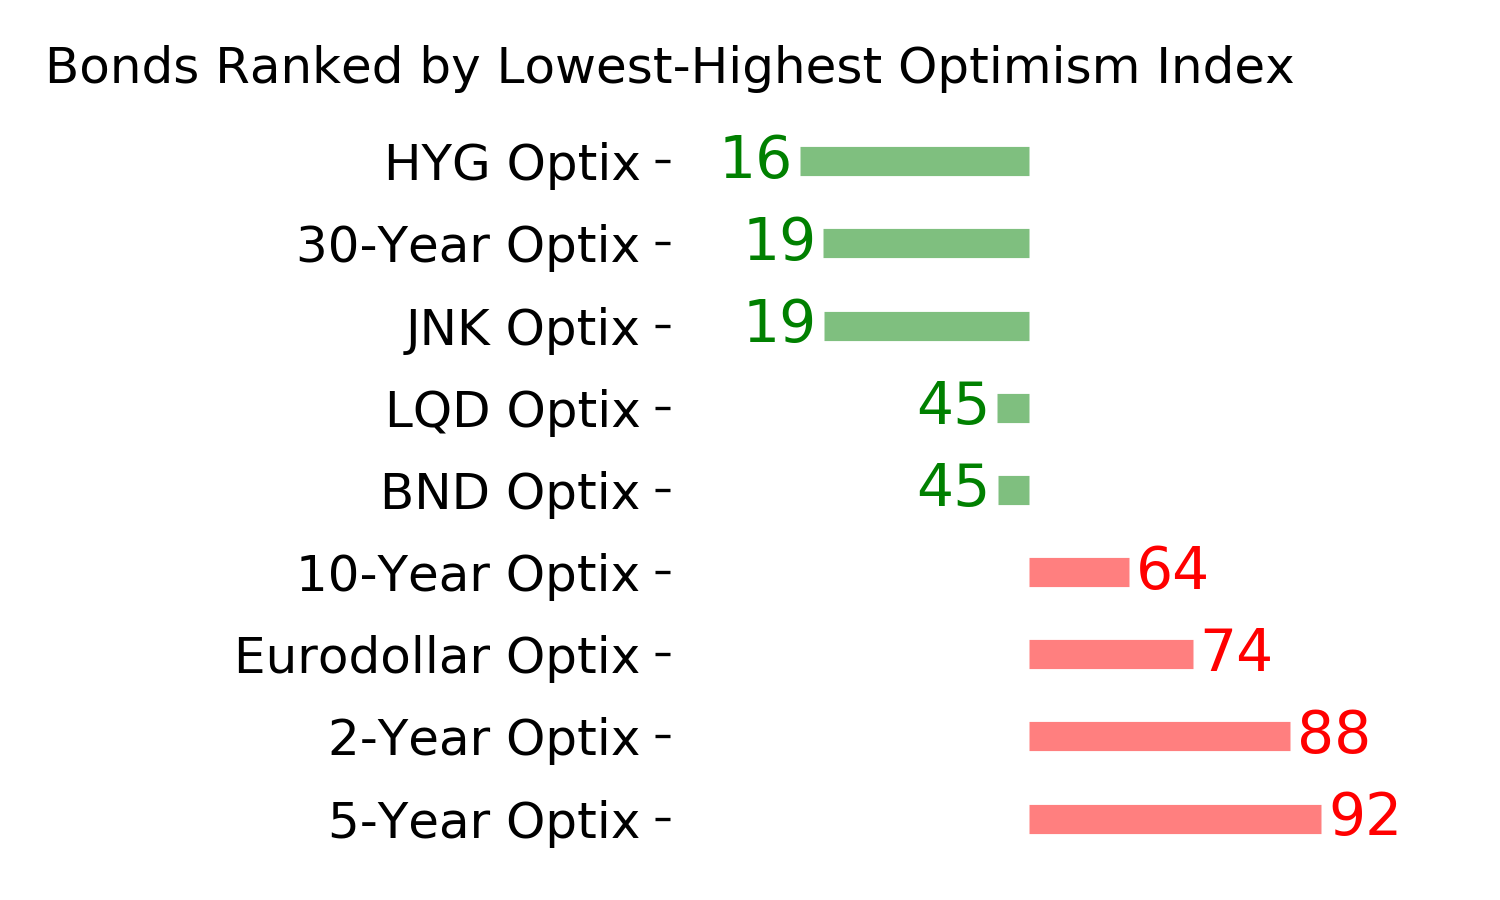
Optimism Index Thumbnails
|
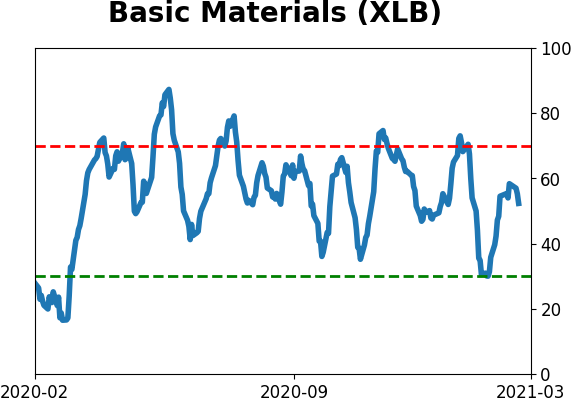
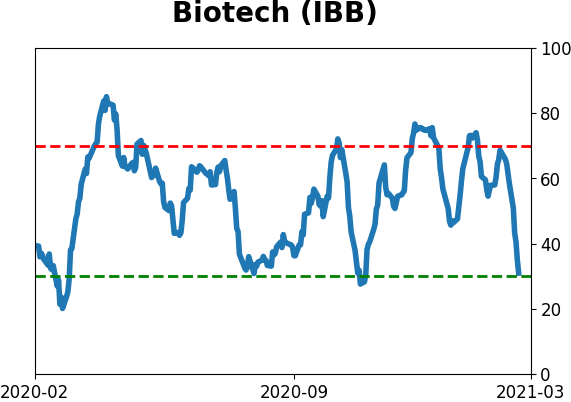
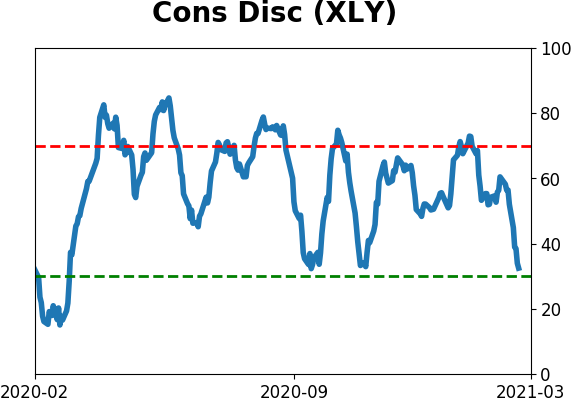
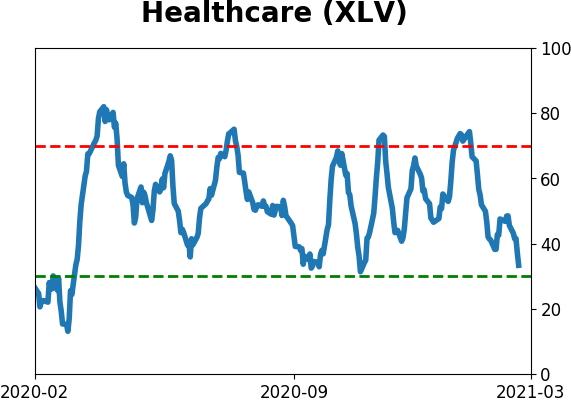
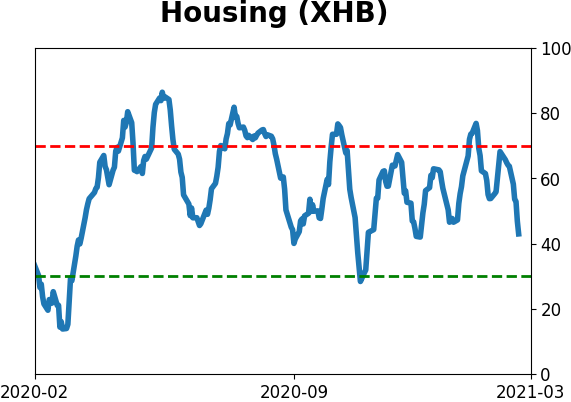
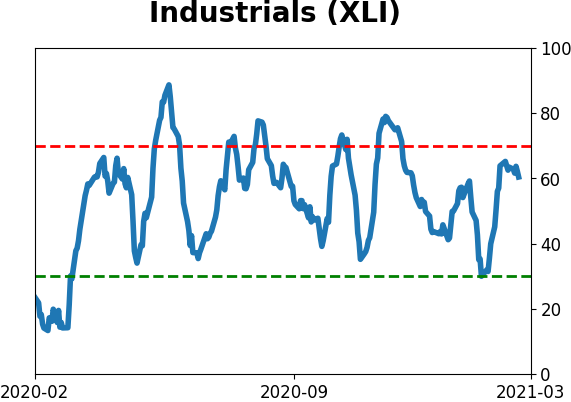
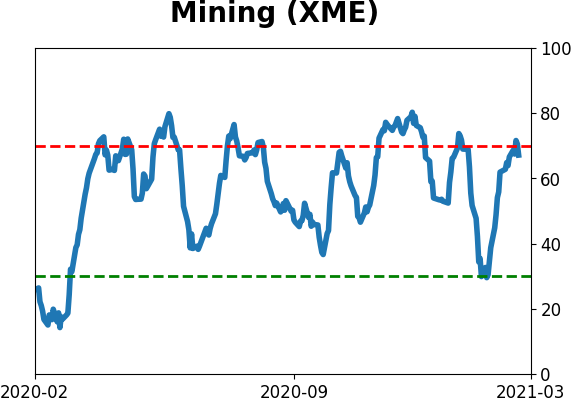
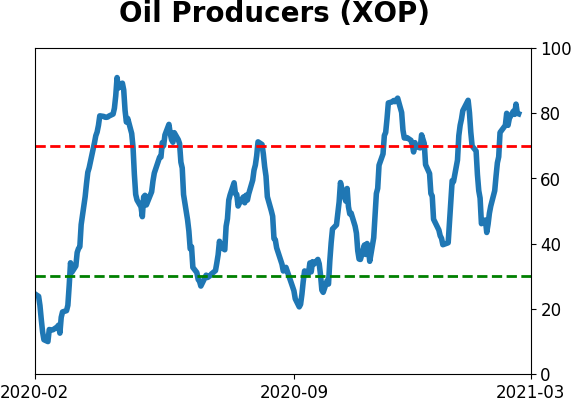
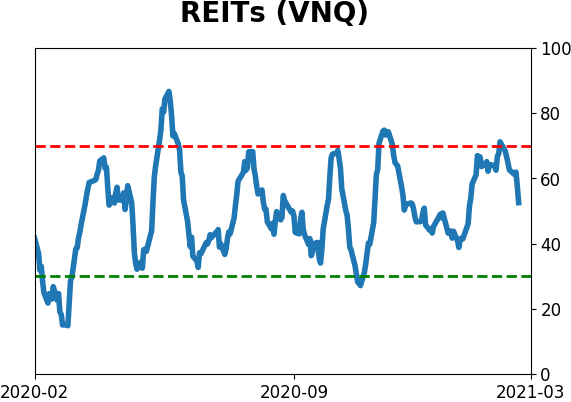
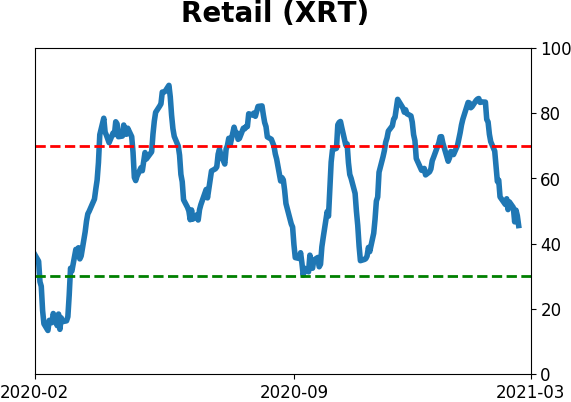
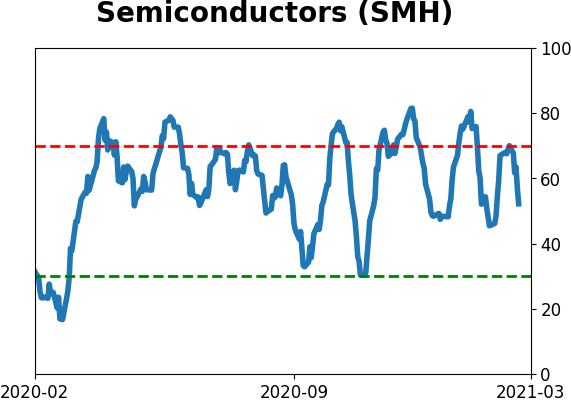
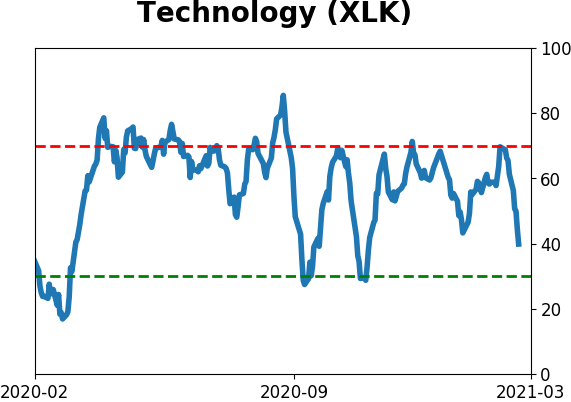
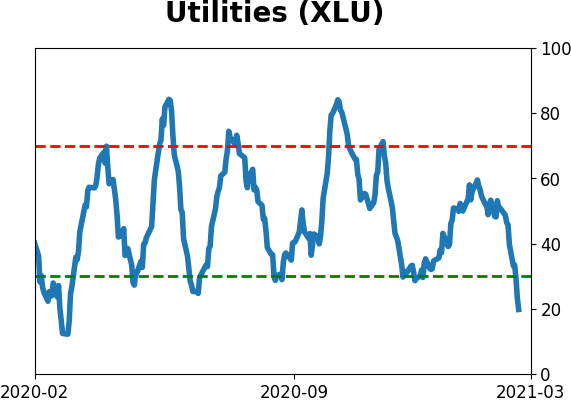
Sector ETF's - 10-Day Moving Average
|
|
|
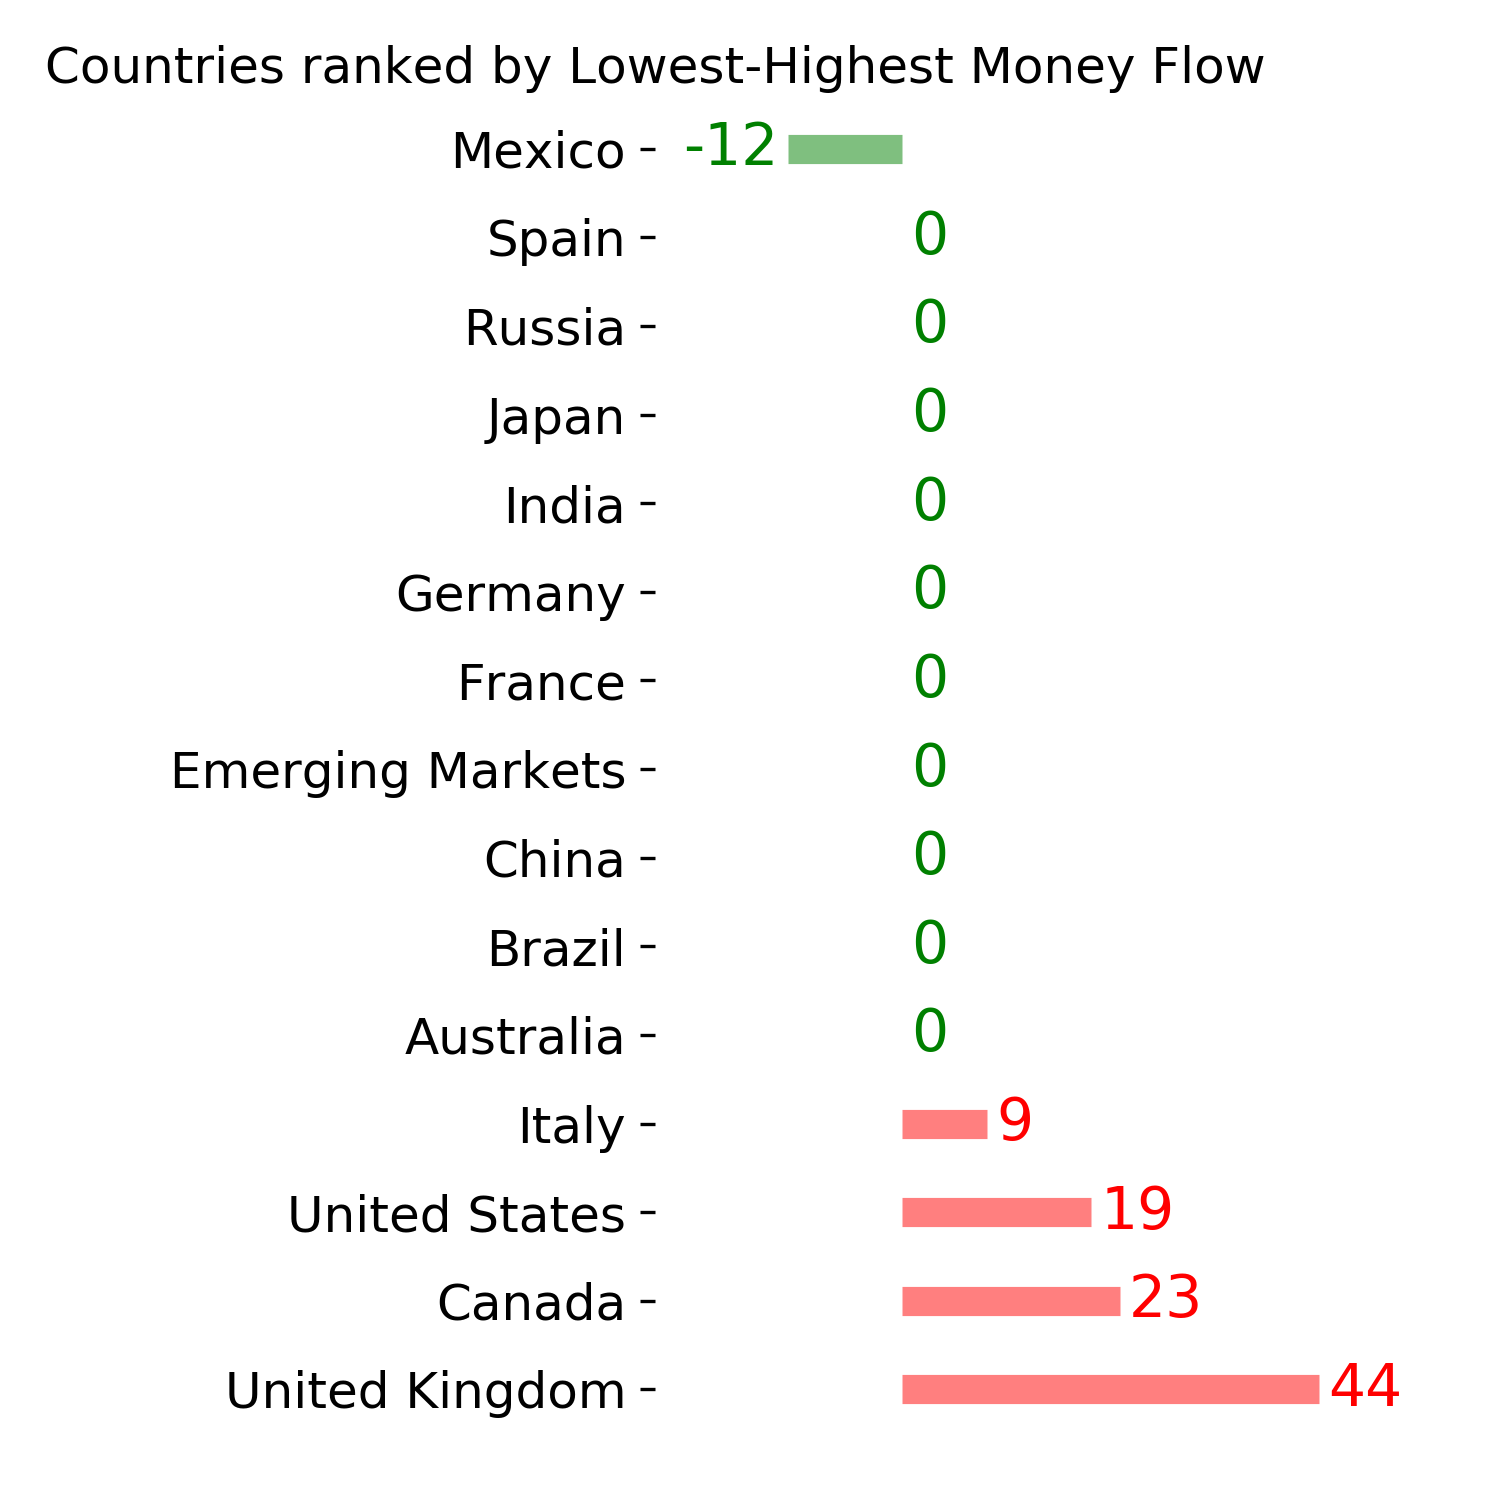
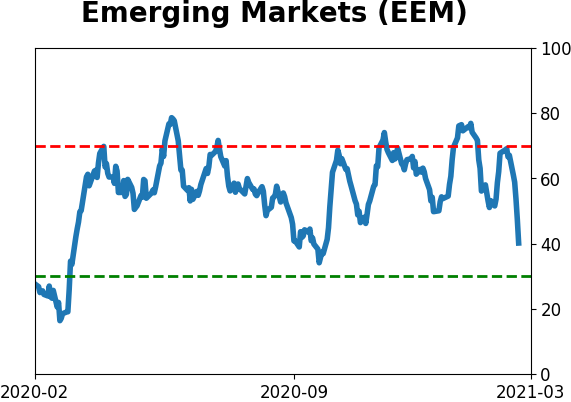
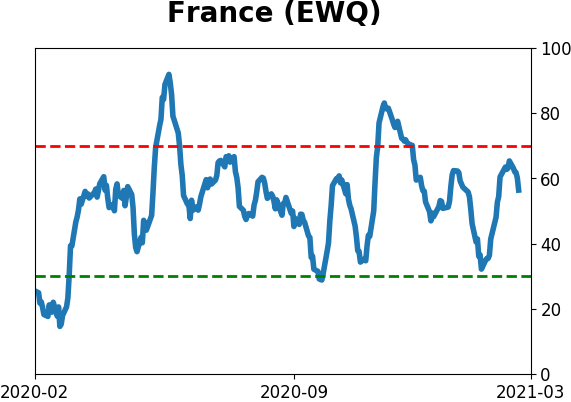
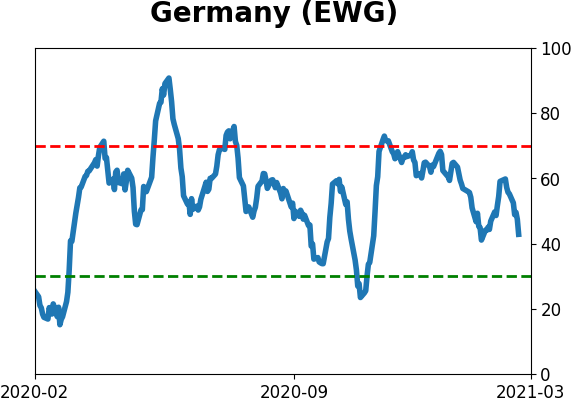
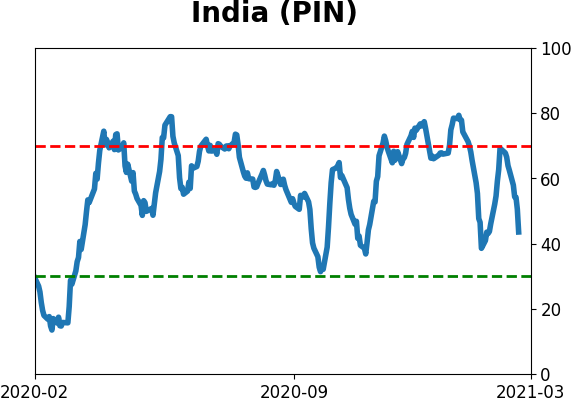
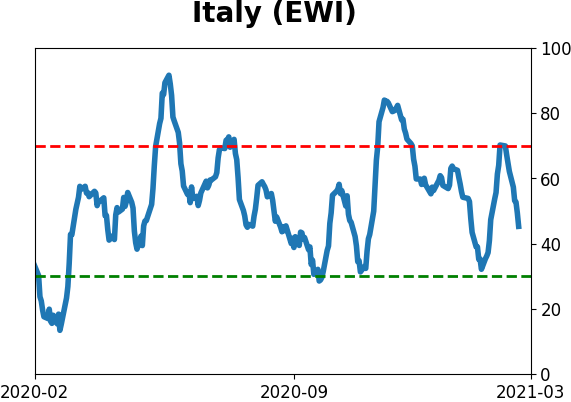
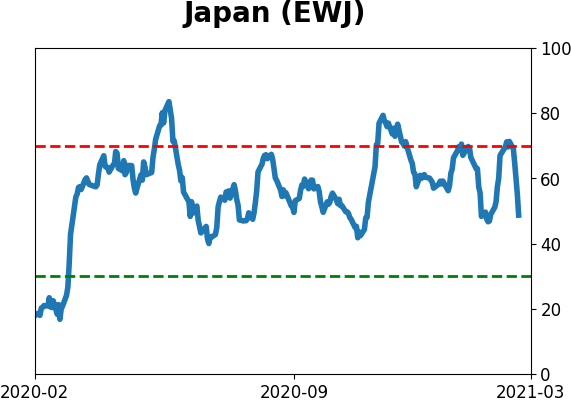
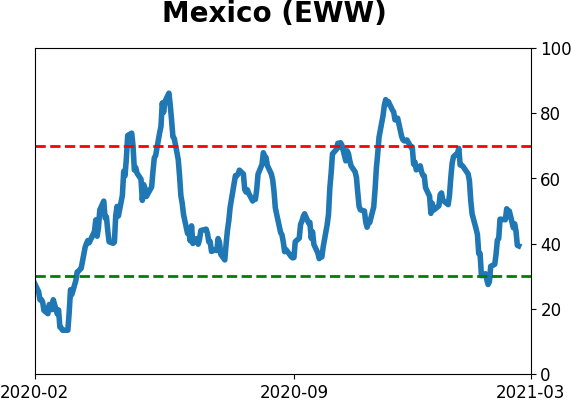
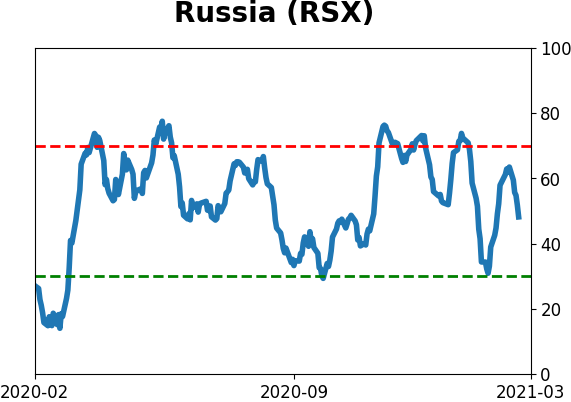
Country ETF's - 10-Day Moving Average
|
|
|
Bond ETF's - 10-Day Moving Average
|
|
|
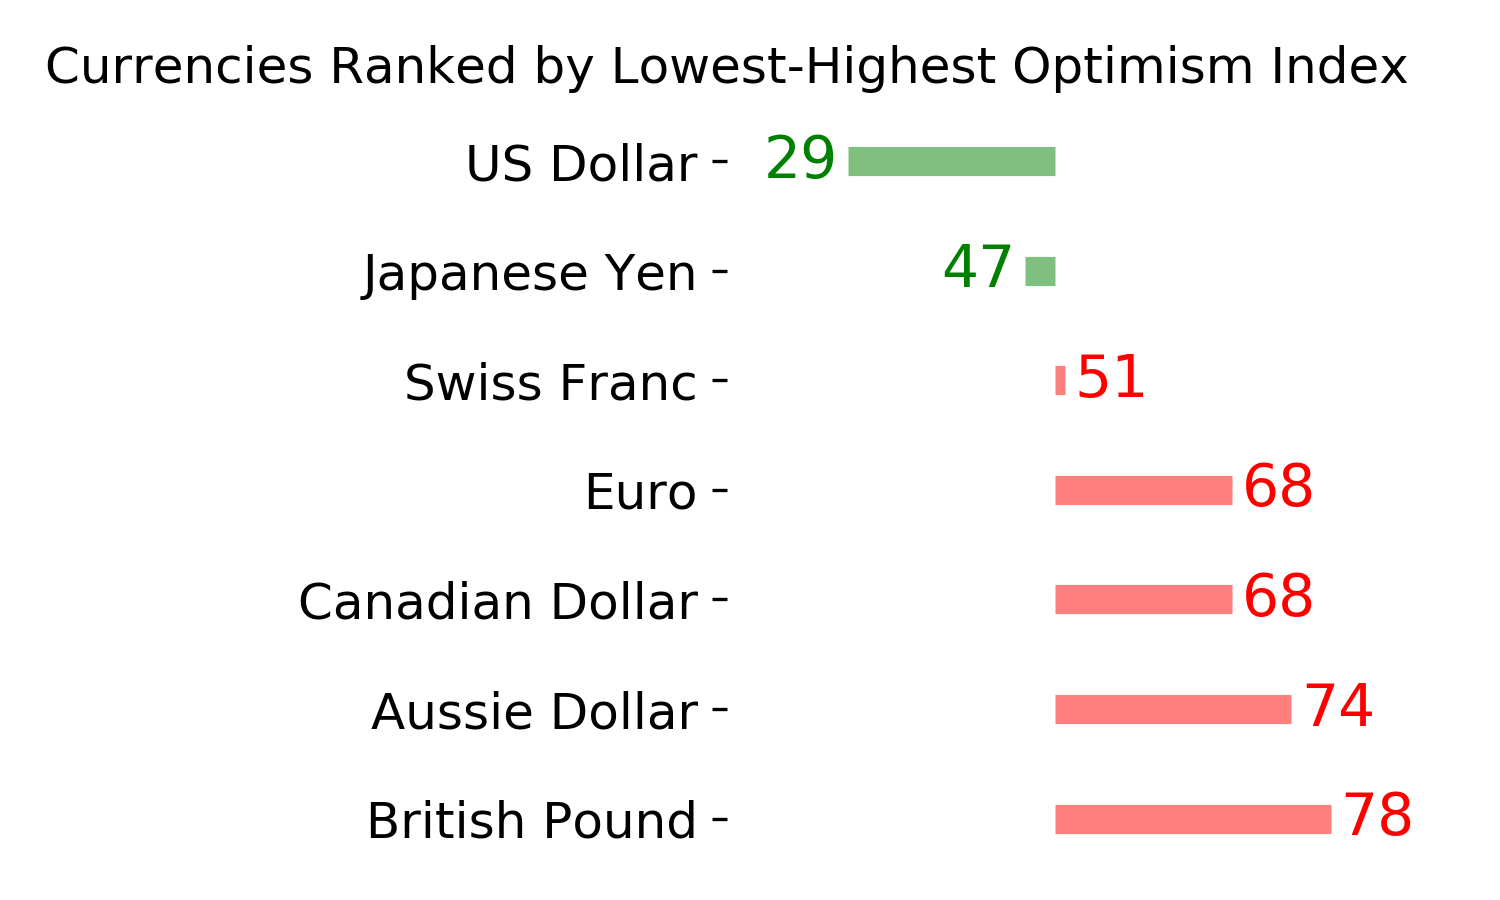
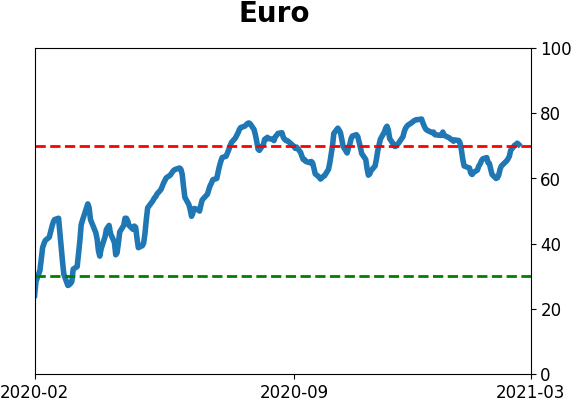
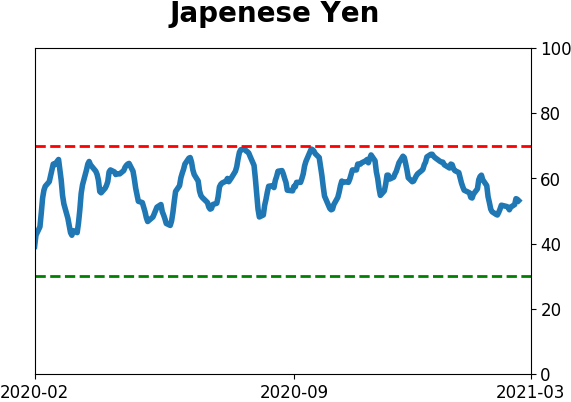
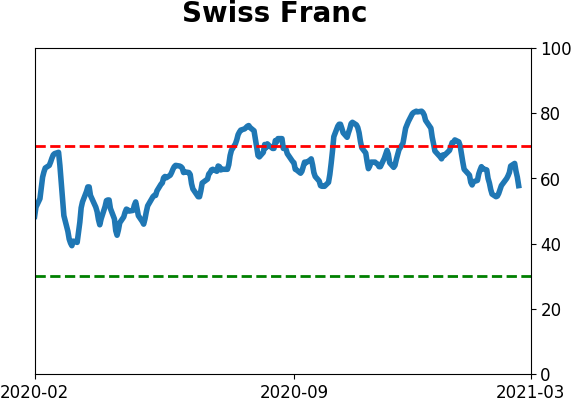
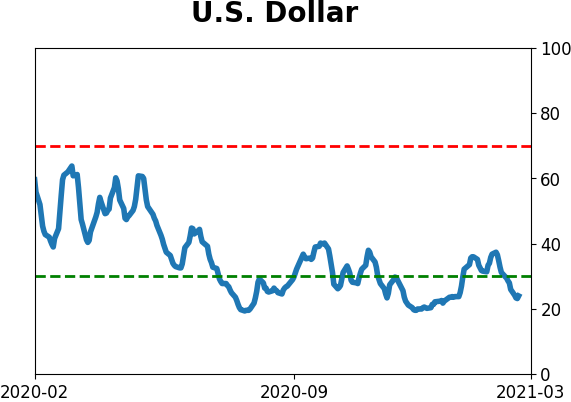
Currency ETF's - 5-Day Moving Average
|
|
|
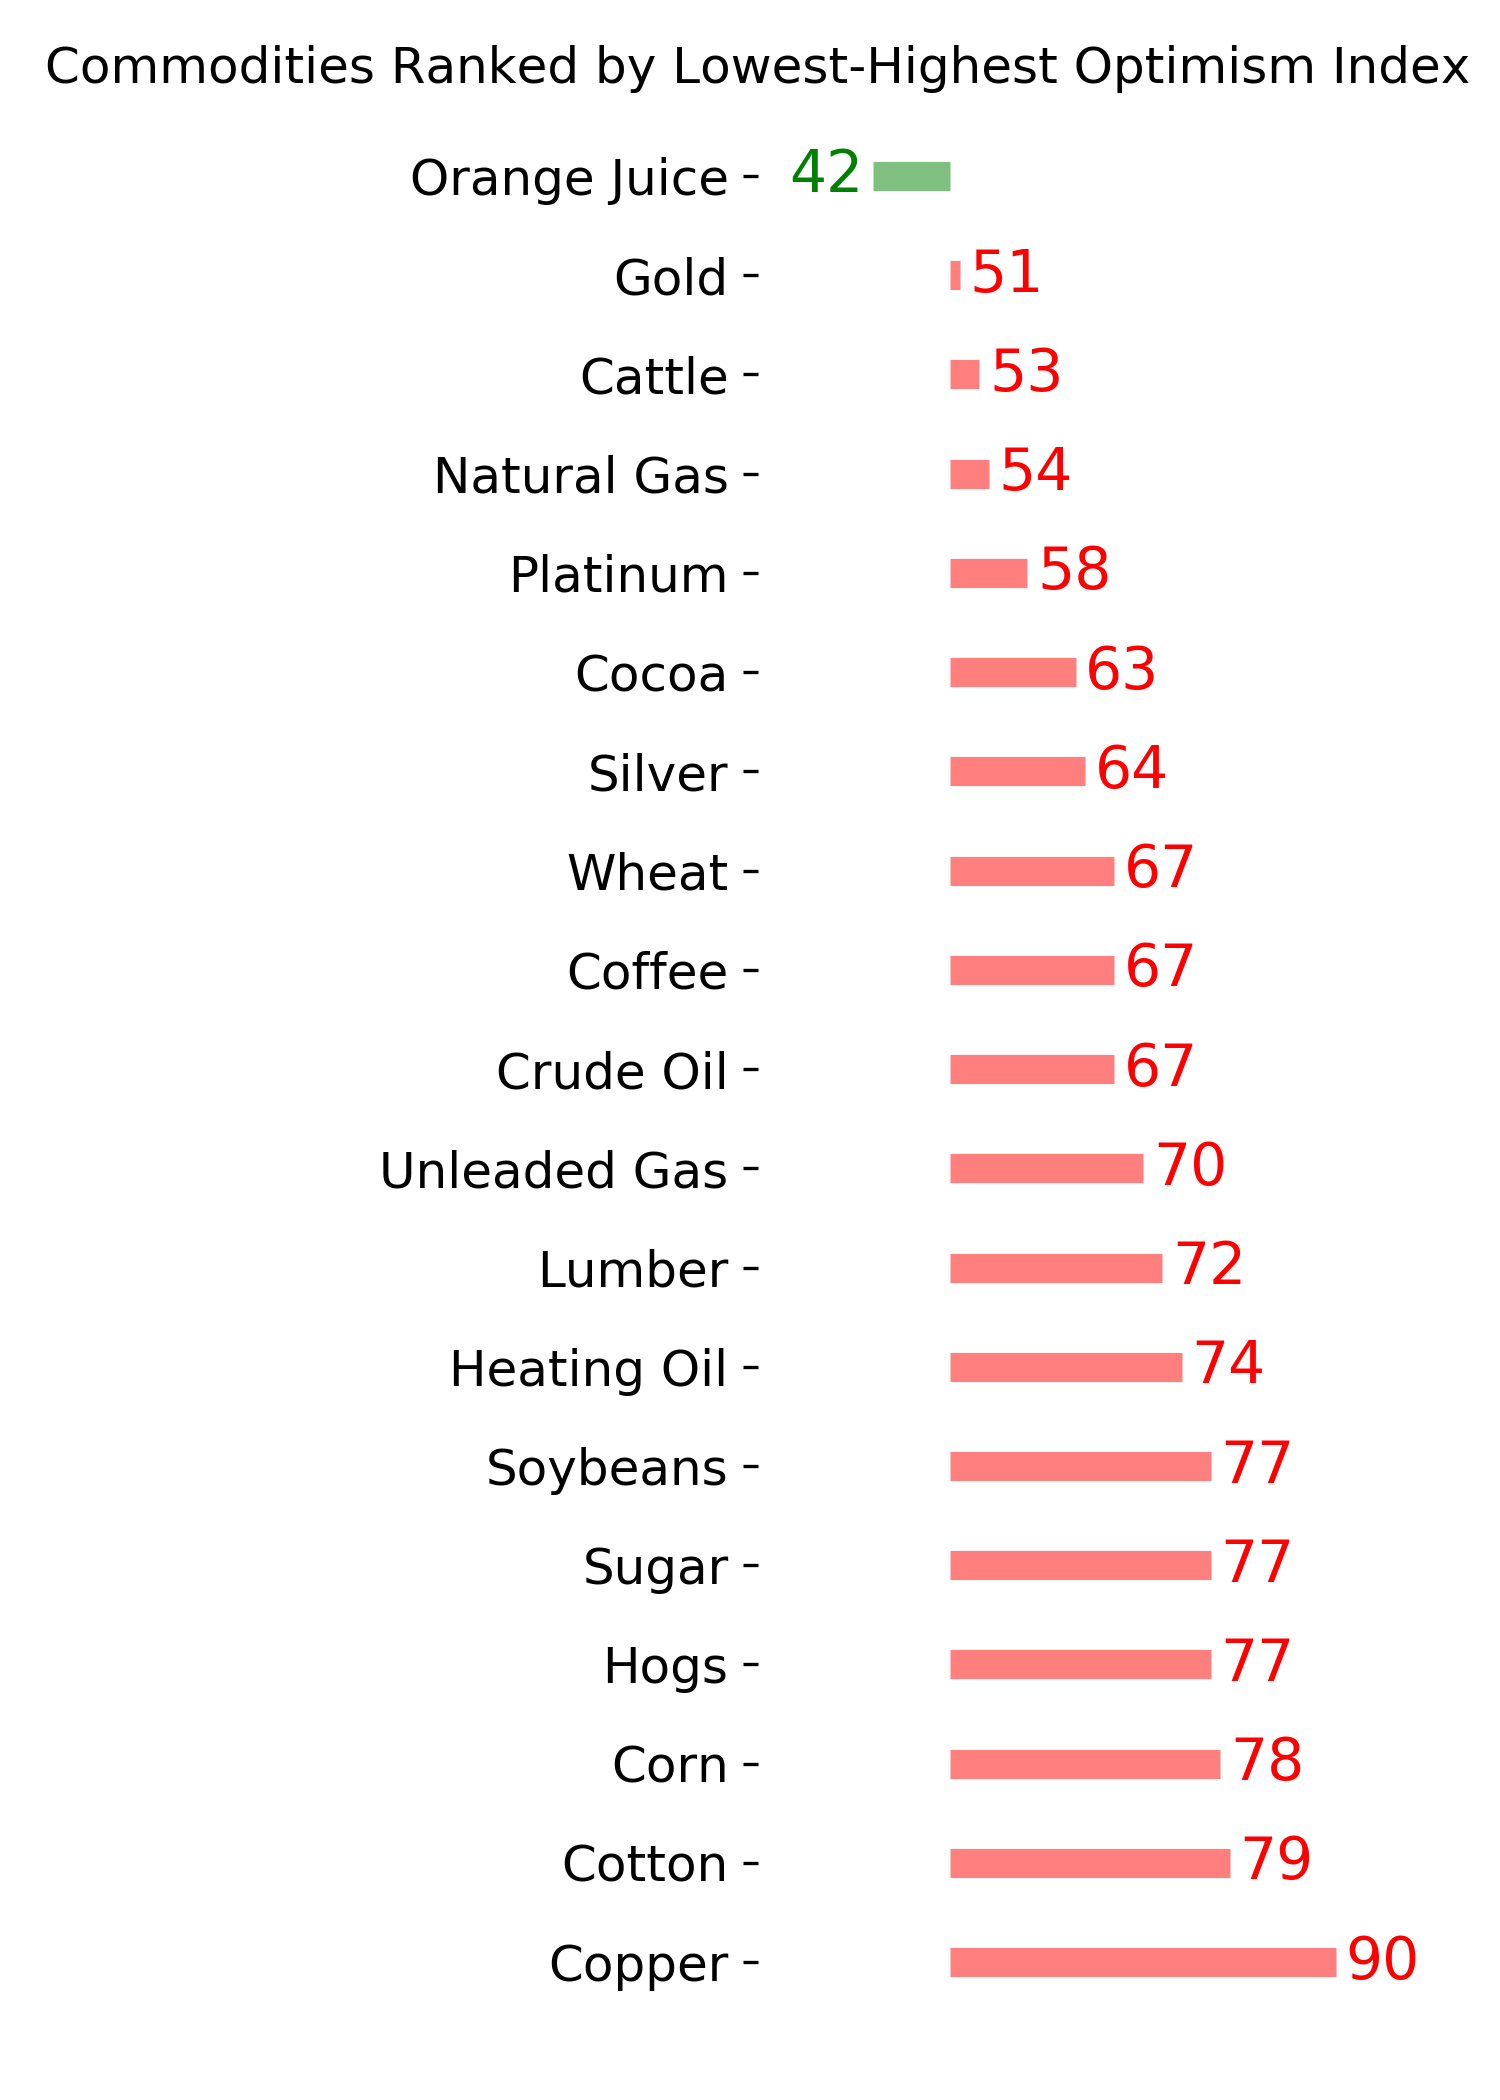
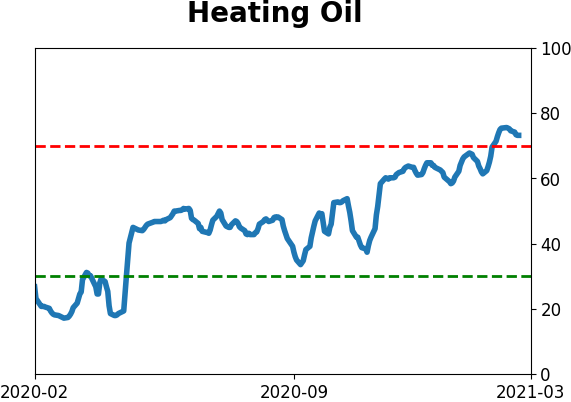
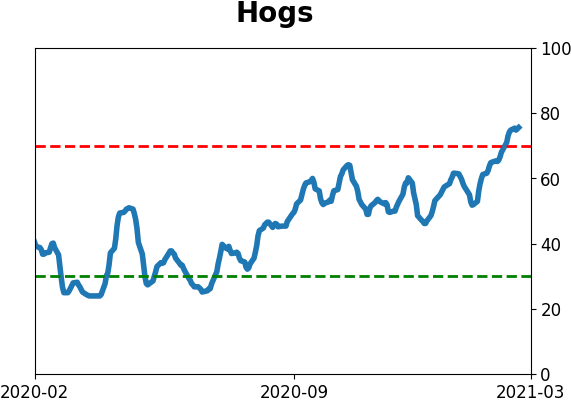
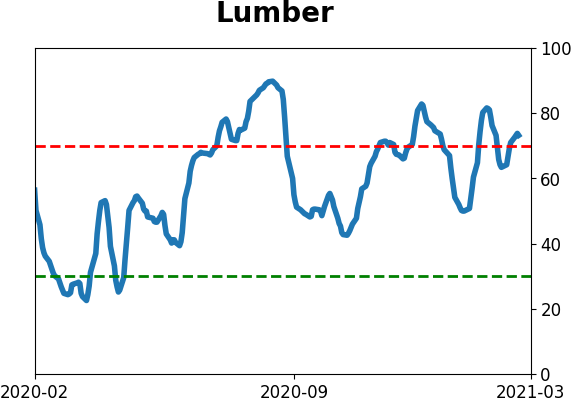
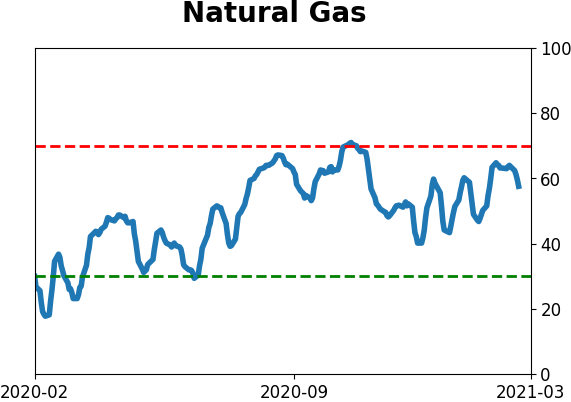
Commodity ETF's - 5-Day Moving Average
|
|