Headlines
|
|
Why "financials over tech" may be just beginning:
Investors have rotated out of technology stocks and into financials in recent months, enough to push the ratio between the sectors to an extreme. Other cycles have tended to keep going, favoring financials over tech, in the months ahead.
50-day average goes bye-bye: For the first time in almost 4 months, the S&P 500 closed more than a tiny bit below its 50-day moving average. It ended its streak within 15 days of sitting at a 3-year high, a sign of ebbing momentum. Of the 19 other times it behaved similarly since 1928, it tended to see further selling over the next week, with a positive return 42% of the time. But by 2 months later, it was higher 84% of the time, averaging +4.4%.
Bottom Line:
See the Outlook & Allocations page for more details on these summaries STOCKS: Weak sell
The extreme speculation registered in January and February is starting to get wrung out. Internal dynamics have mostly held up, so a return to neutral sentiment conditions would improve for the forward risk/reward profile substantially. BONDS: Weak buy
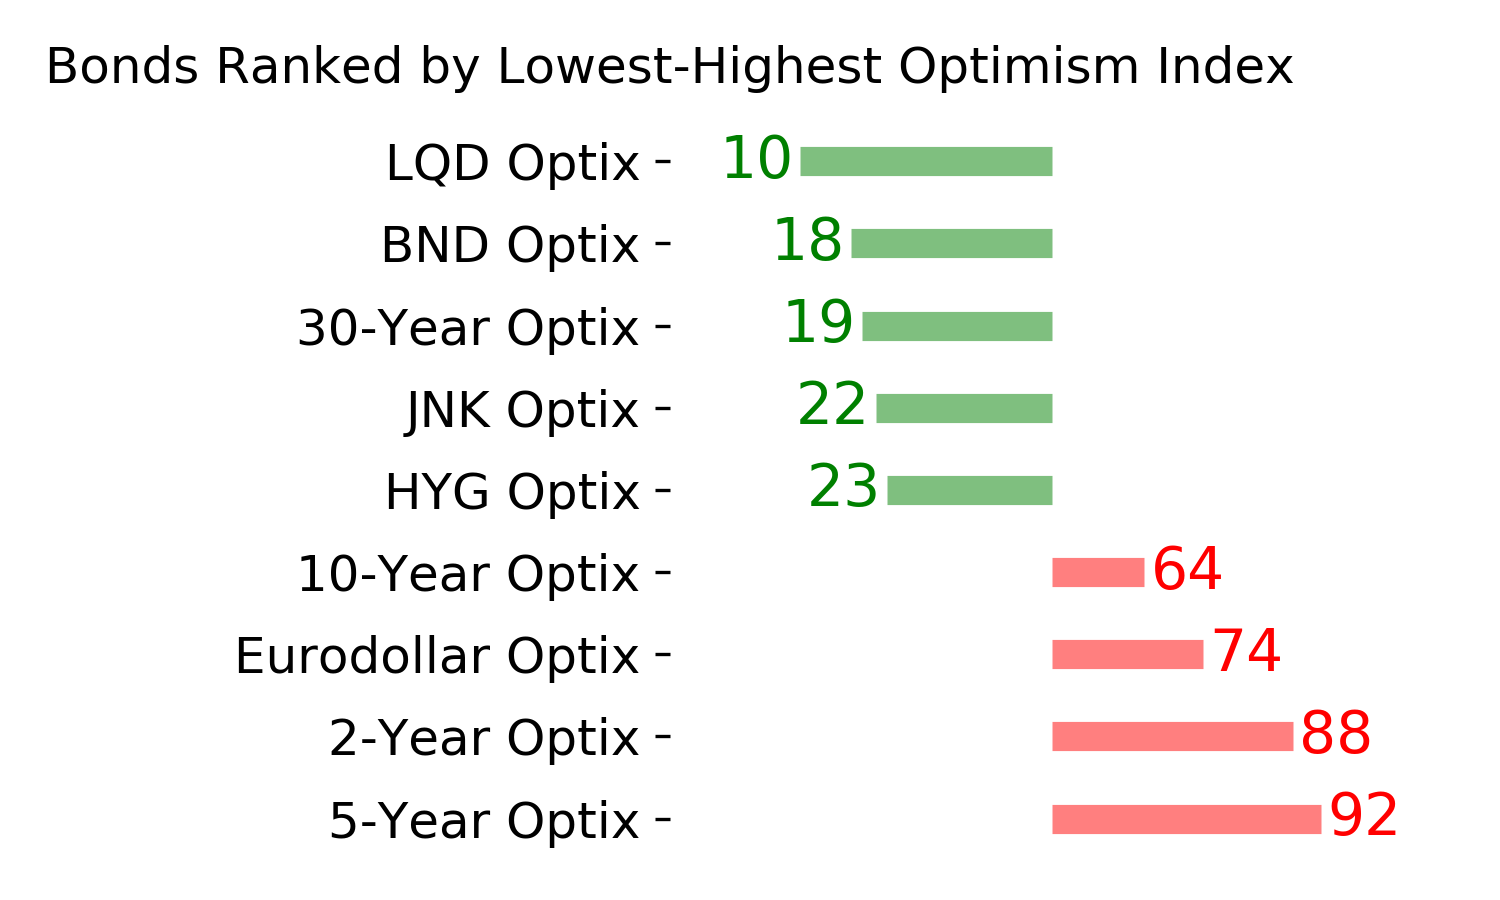
Various parts of the market have been hit in recent weeks, with mild oversold conditions. The Bond Optimism Index is now about as low as it gets during healthy bond market environments. Fixed income isn't responding well, so that needs to be monitored in case its transitioning to a longer-term negative market environment. GOLD: Weak buy
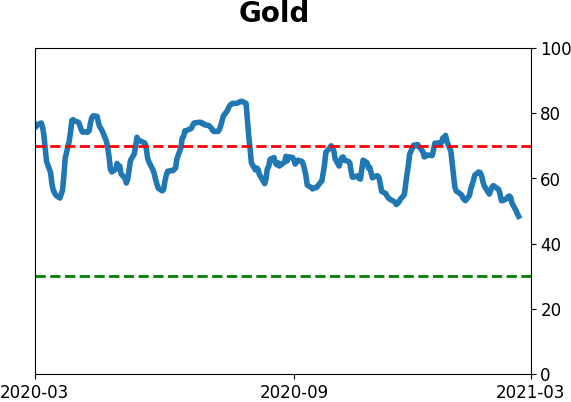
A dollar trying to rebound from a severe short position has weighed on gold and miners. The types of signals they've given in recent weeks, within the context of their recent surge, have usually resulted in higher prices over a medium- to long-term time frame. Like bonds, gold and miners aren't responding very well, and this needs to be monitored.
|
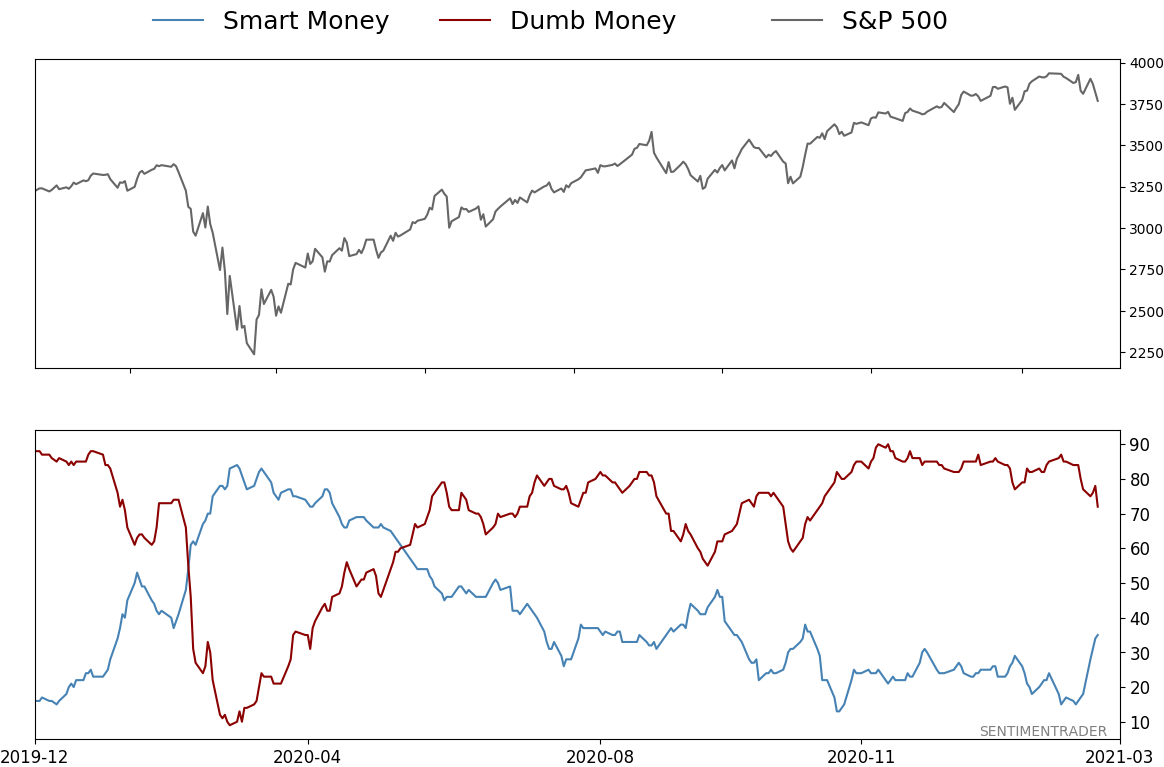
Smart / Dumb Money Confidence
|
Smart Money Confidence: 35%
Dumb Money Confidence: 72%
|
|
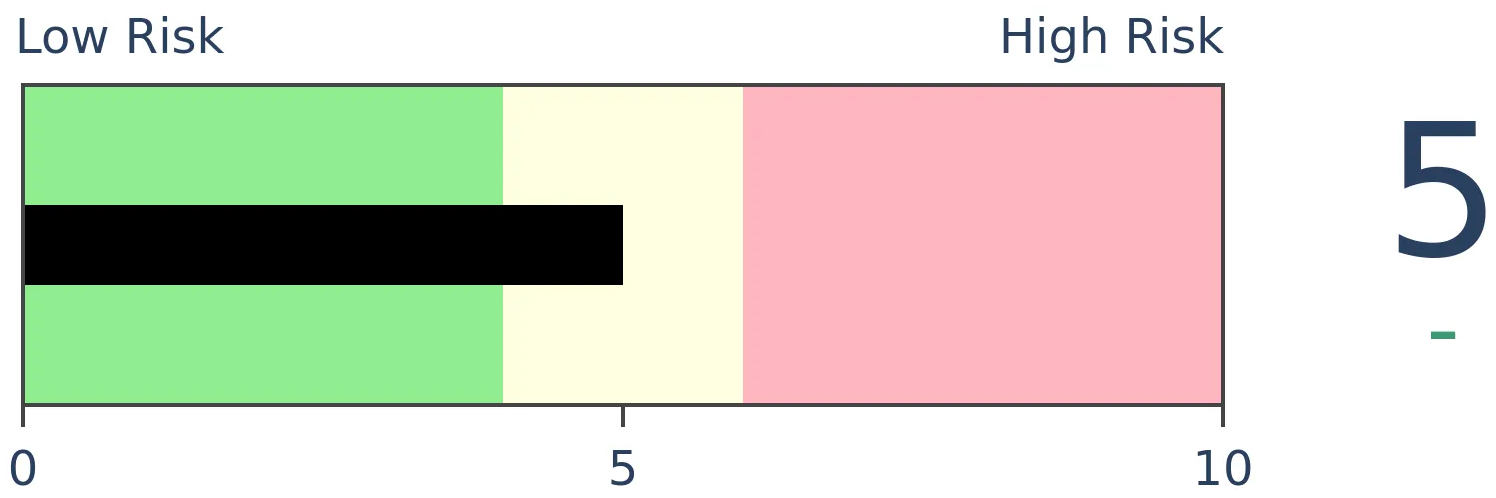
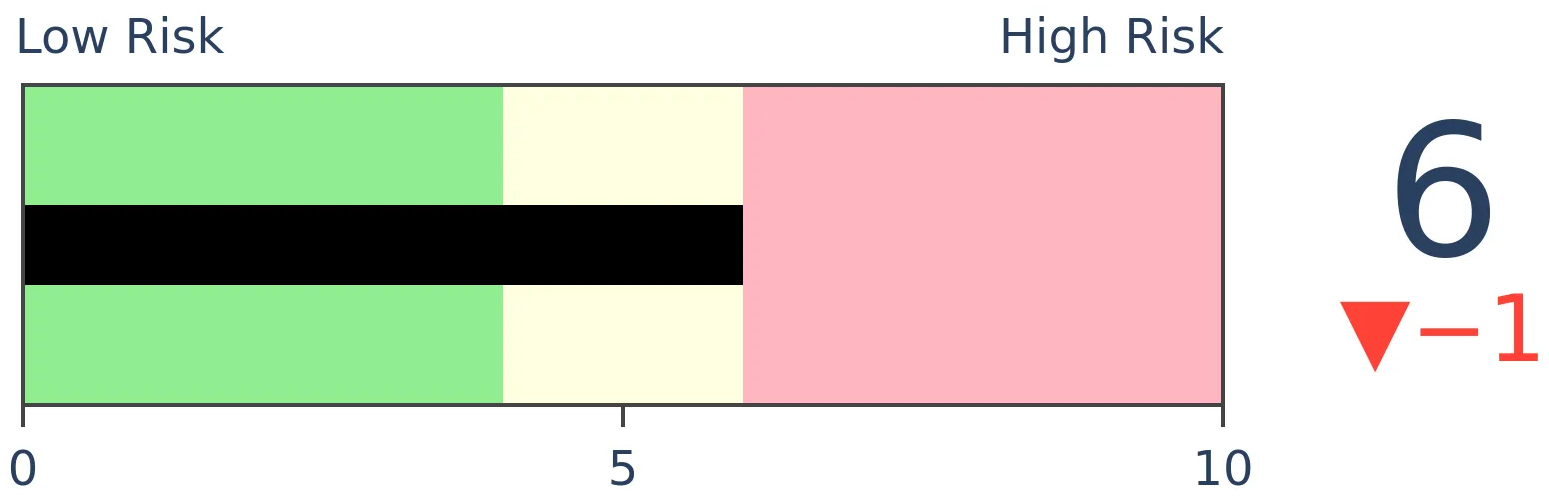
Risk Levels
Stocks Short-Term
|
Stocks Medium-Term
|
|
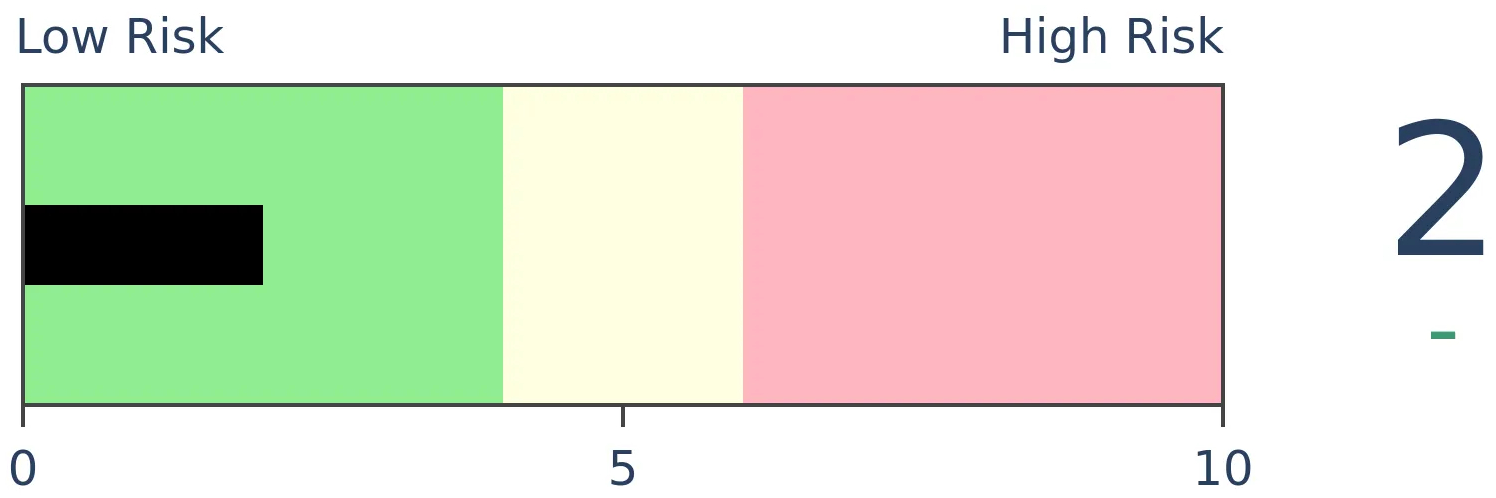
Bonds
|
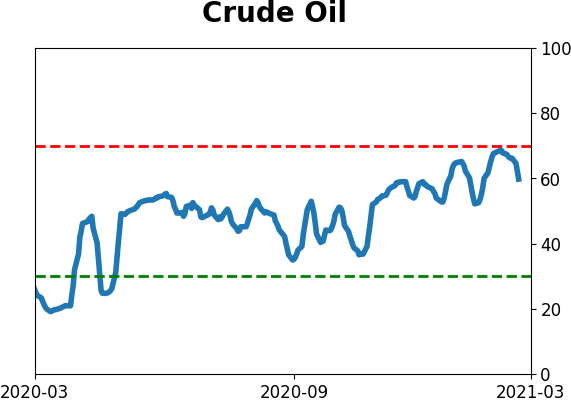
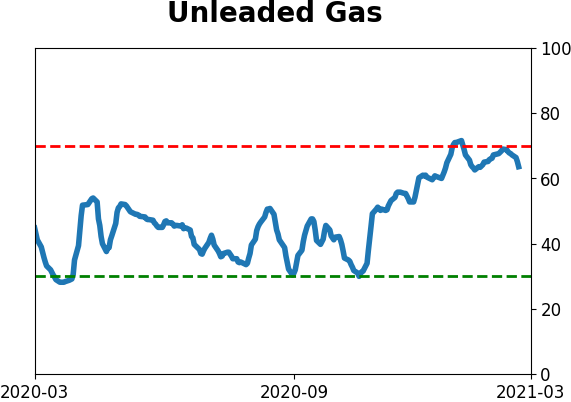
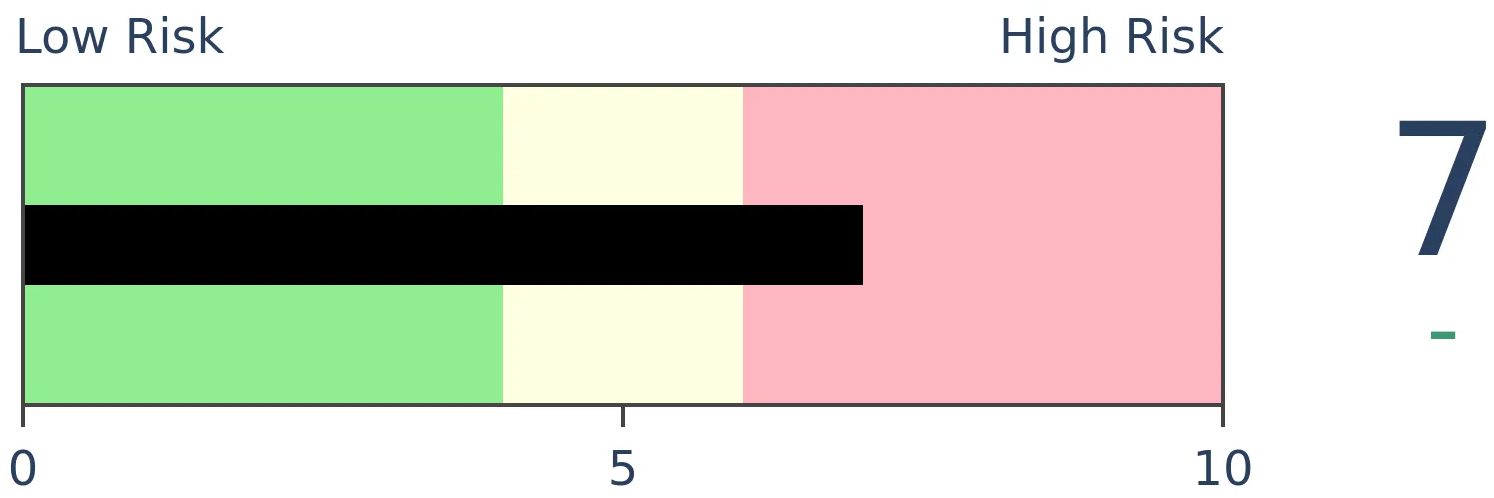
Crude Oil
|
|
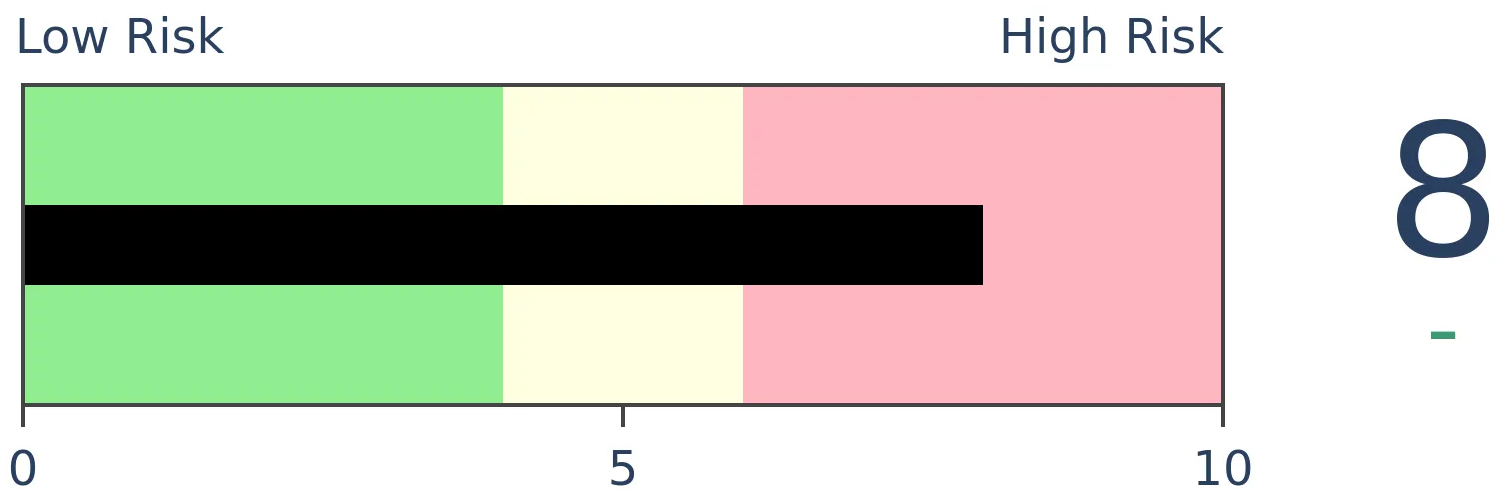
Gold

|
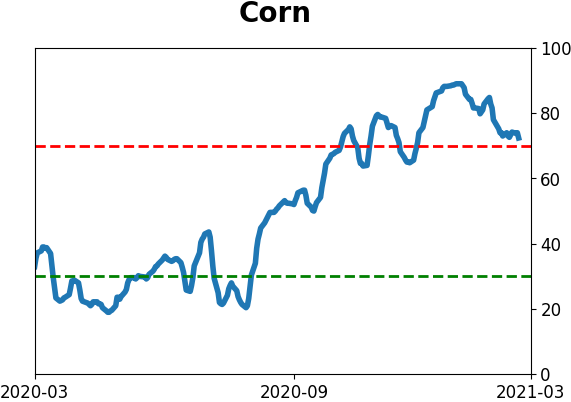
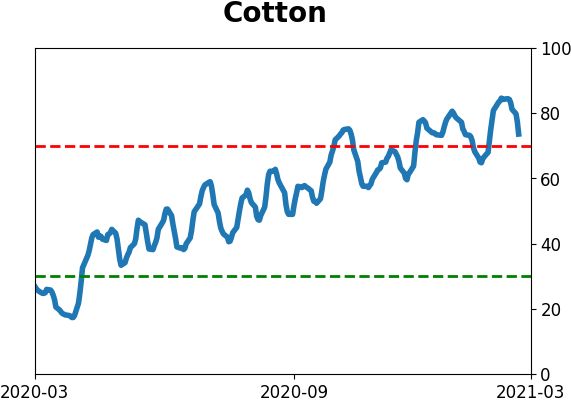
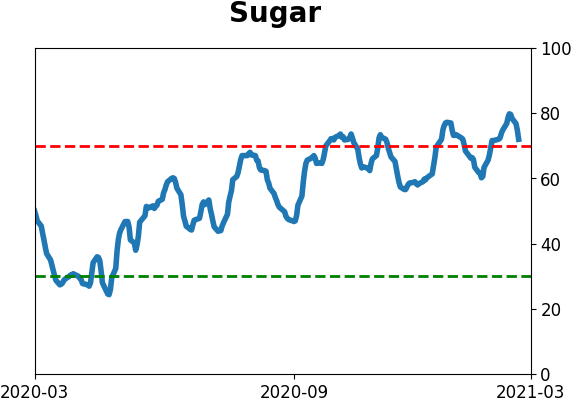
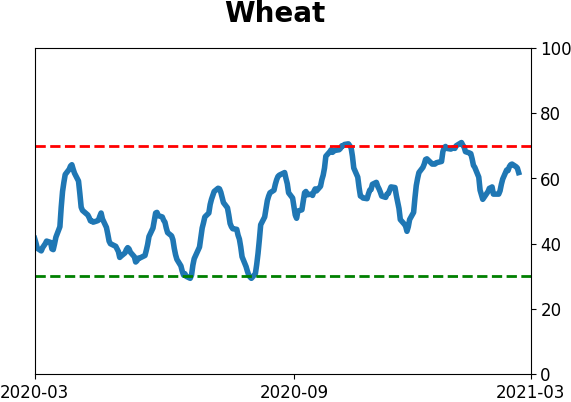
Agriculture
|
|
Research
BOTTOM LINE
Investors have rotated out of technology stocks and into financials in recent months, enough to push the ratio between the sectors to an extreme. Other cycles have tended to keep going, favoring financials over tech, in the months ahead.
FORECAST / TIMEFRAME
None
|
Thanks to investors resetting their view on interest rates, there has been a swift and meaningful rotation out of technology stocks and into financials. It has only increased in intensity in recent days.
When looking at the ratio between the two sectors, it has now cycled from being more than 2 standard deviations above its 9-month trend to 2 standard deviations below.
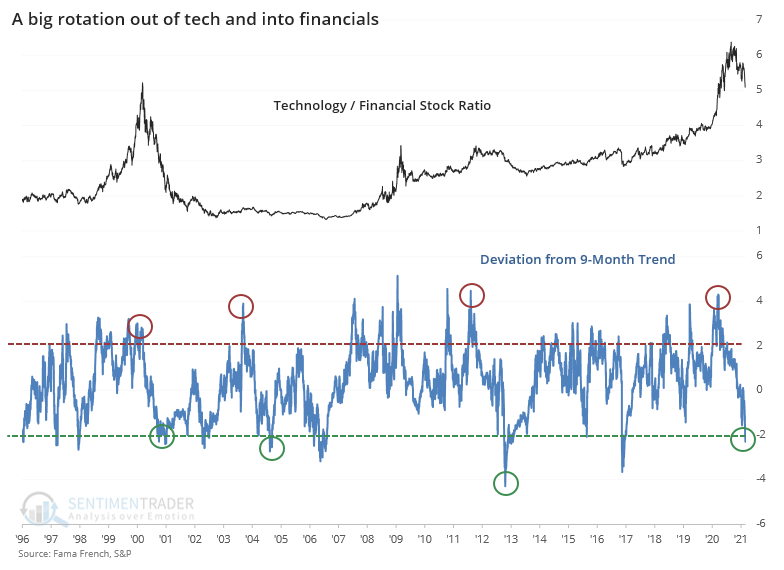
Whether this means anything for the broader market is debatable. The table below shows S&P 500 returns after the ratio cycled from +2 to -2 standard deviations. To avoid those times when there was a quick and volatile change (mostly prior to 1950), only those cycles that took longer than 100 days are included. The current cycle lasted 158 days.
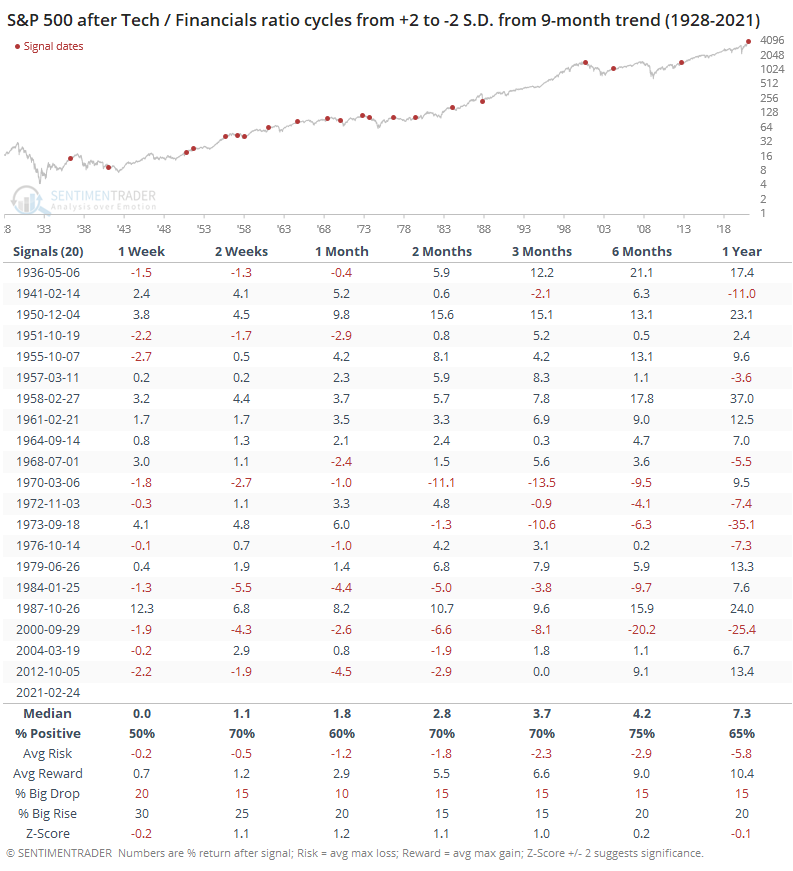
Forward returns for the S&P were fine, even a bit above random over the medium-term. Nothing much to see here.
It was more consistent as an indicator for the ratio between the sectors, as tech stocks tended to keep underperforming relative to financials when there were similar resets.
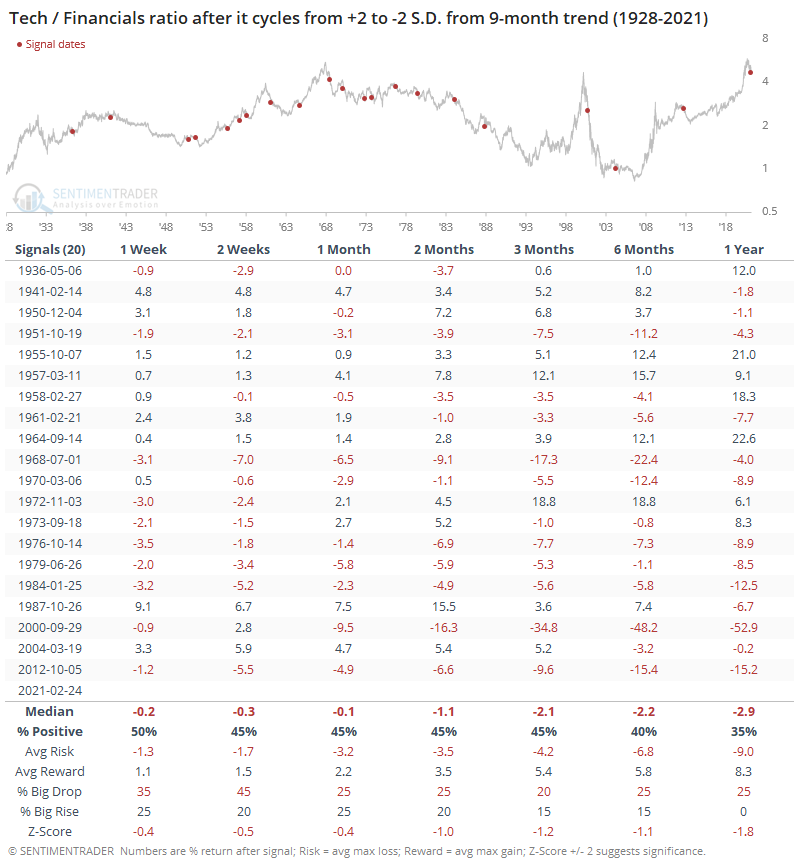
Especially since 1970, the tech / financials ratio had a strong tendency to keep declining, with returns well below what was seen during more normal conditions.
This suggests that the underlying fundamental shift that has triggered this reset in expectations is much more likely to keep going, favoring financial stocks over technology-related stocks, than it is to revert to its prior trend.
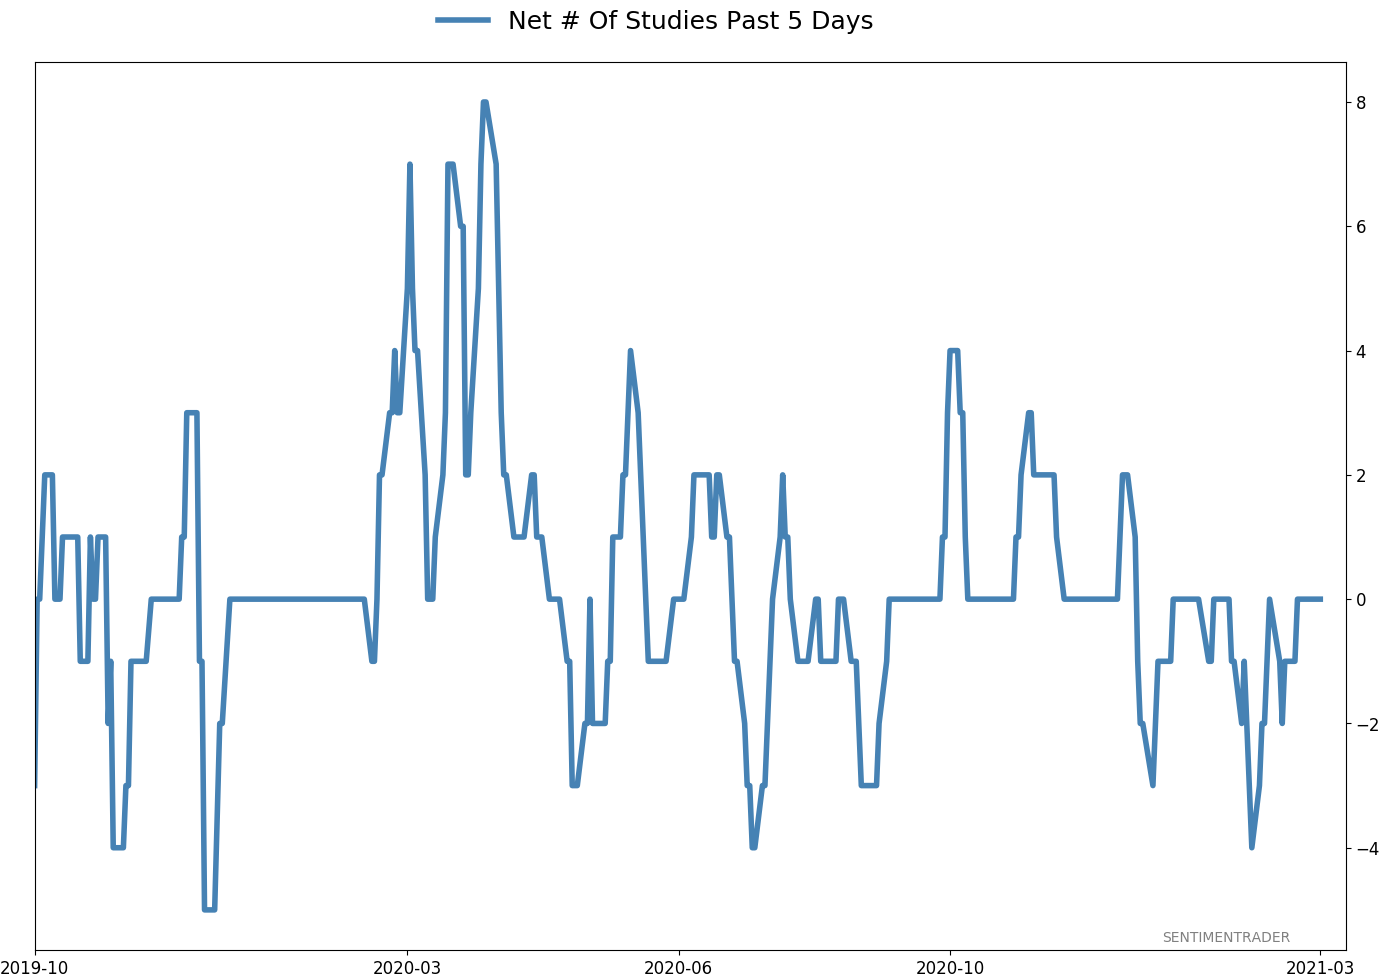
Active Studies
| Time Frame | Bullish | Bearish | | Short-Term | 0 | 0 | | Medium-Term | 2 | 8 | | Long-Term | 16 | 3 |
|
Indicators at Extremes
Portfolio
| Position | Description | Weight % | Added / Reduced | Date | | Stocks | RSP | 4.9 | Reduced 4% | 2021-02-09 | | Bonds | 30.0% BND, 8.8% SCHP | 38.8 | Added 15.1% | 2021-02-18 | | Commodities | GCC | 2.3 | Reduced 2.1%
| 2020-09-04 | | Precious Metals | GDX | 9.0 | Added 0.1% | 2021-02-18 | | Special Situations | 7.3% XLE, 4.8% PSCE | 12.1 | Reduced 5.6% | 2021-02-18 | | Cash | | 32.8 | | |
|
Updates (Changes made today are underlined)
With a market that has seen the kinds of broad participation and big breath thrusts like we did in the fall, it's hard to become too negative. Those kinds of conditions have consistently preceded higher returns over the next 6-12 months. It's the interim that's more of an issue. Even conditions like that haven't prevented some shorter-term pullbacks. And when we combine an environment where speculation is rampant and recent days have seen an increase in cracks under the surface of the indexes, it's enough to become more defensive over a short- to medium-term time frame. We still don't have much confirmation from the price action in the indexes, so those who are more conservative would likely wait before increasing cash levels. I've decreased risk exposure a bit more, mainly in terms of energy stocks and the ANGL fund, while adding more to the broader bond market. RETURN YTD: 5.7% 2020: 8.1%, 2019: 12.6%, 2018: 0.6%, 2017: 3.8%, 2016: 17.1%, 2015: 9.2%, 2014: 14.5%, 2013: 2.2%, 2012: 10.8%, 2011: 16.5%, 2010: 15.3%, 2009: 23.9%, 2008: 16.2%, 2007: 7.8%
|
|
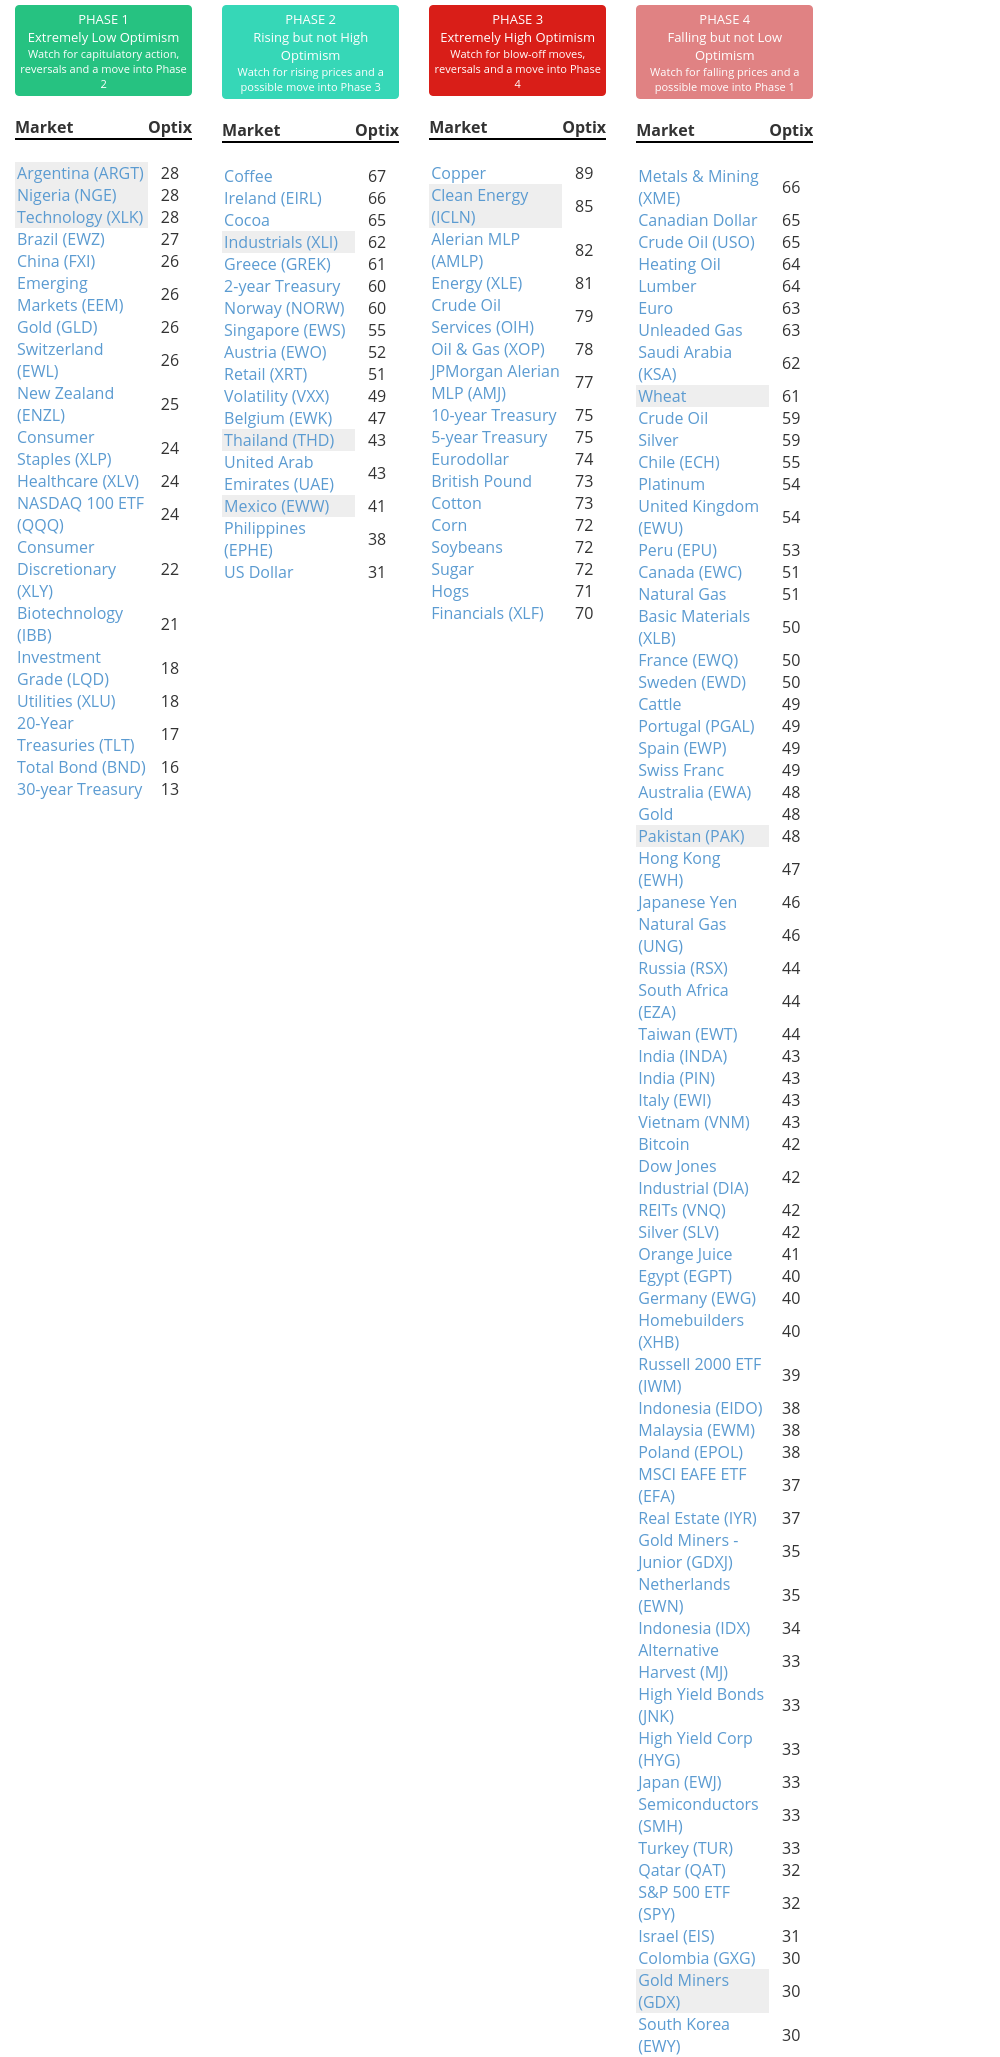
Phase Table
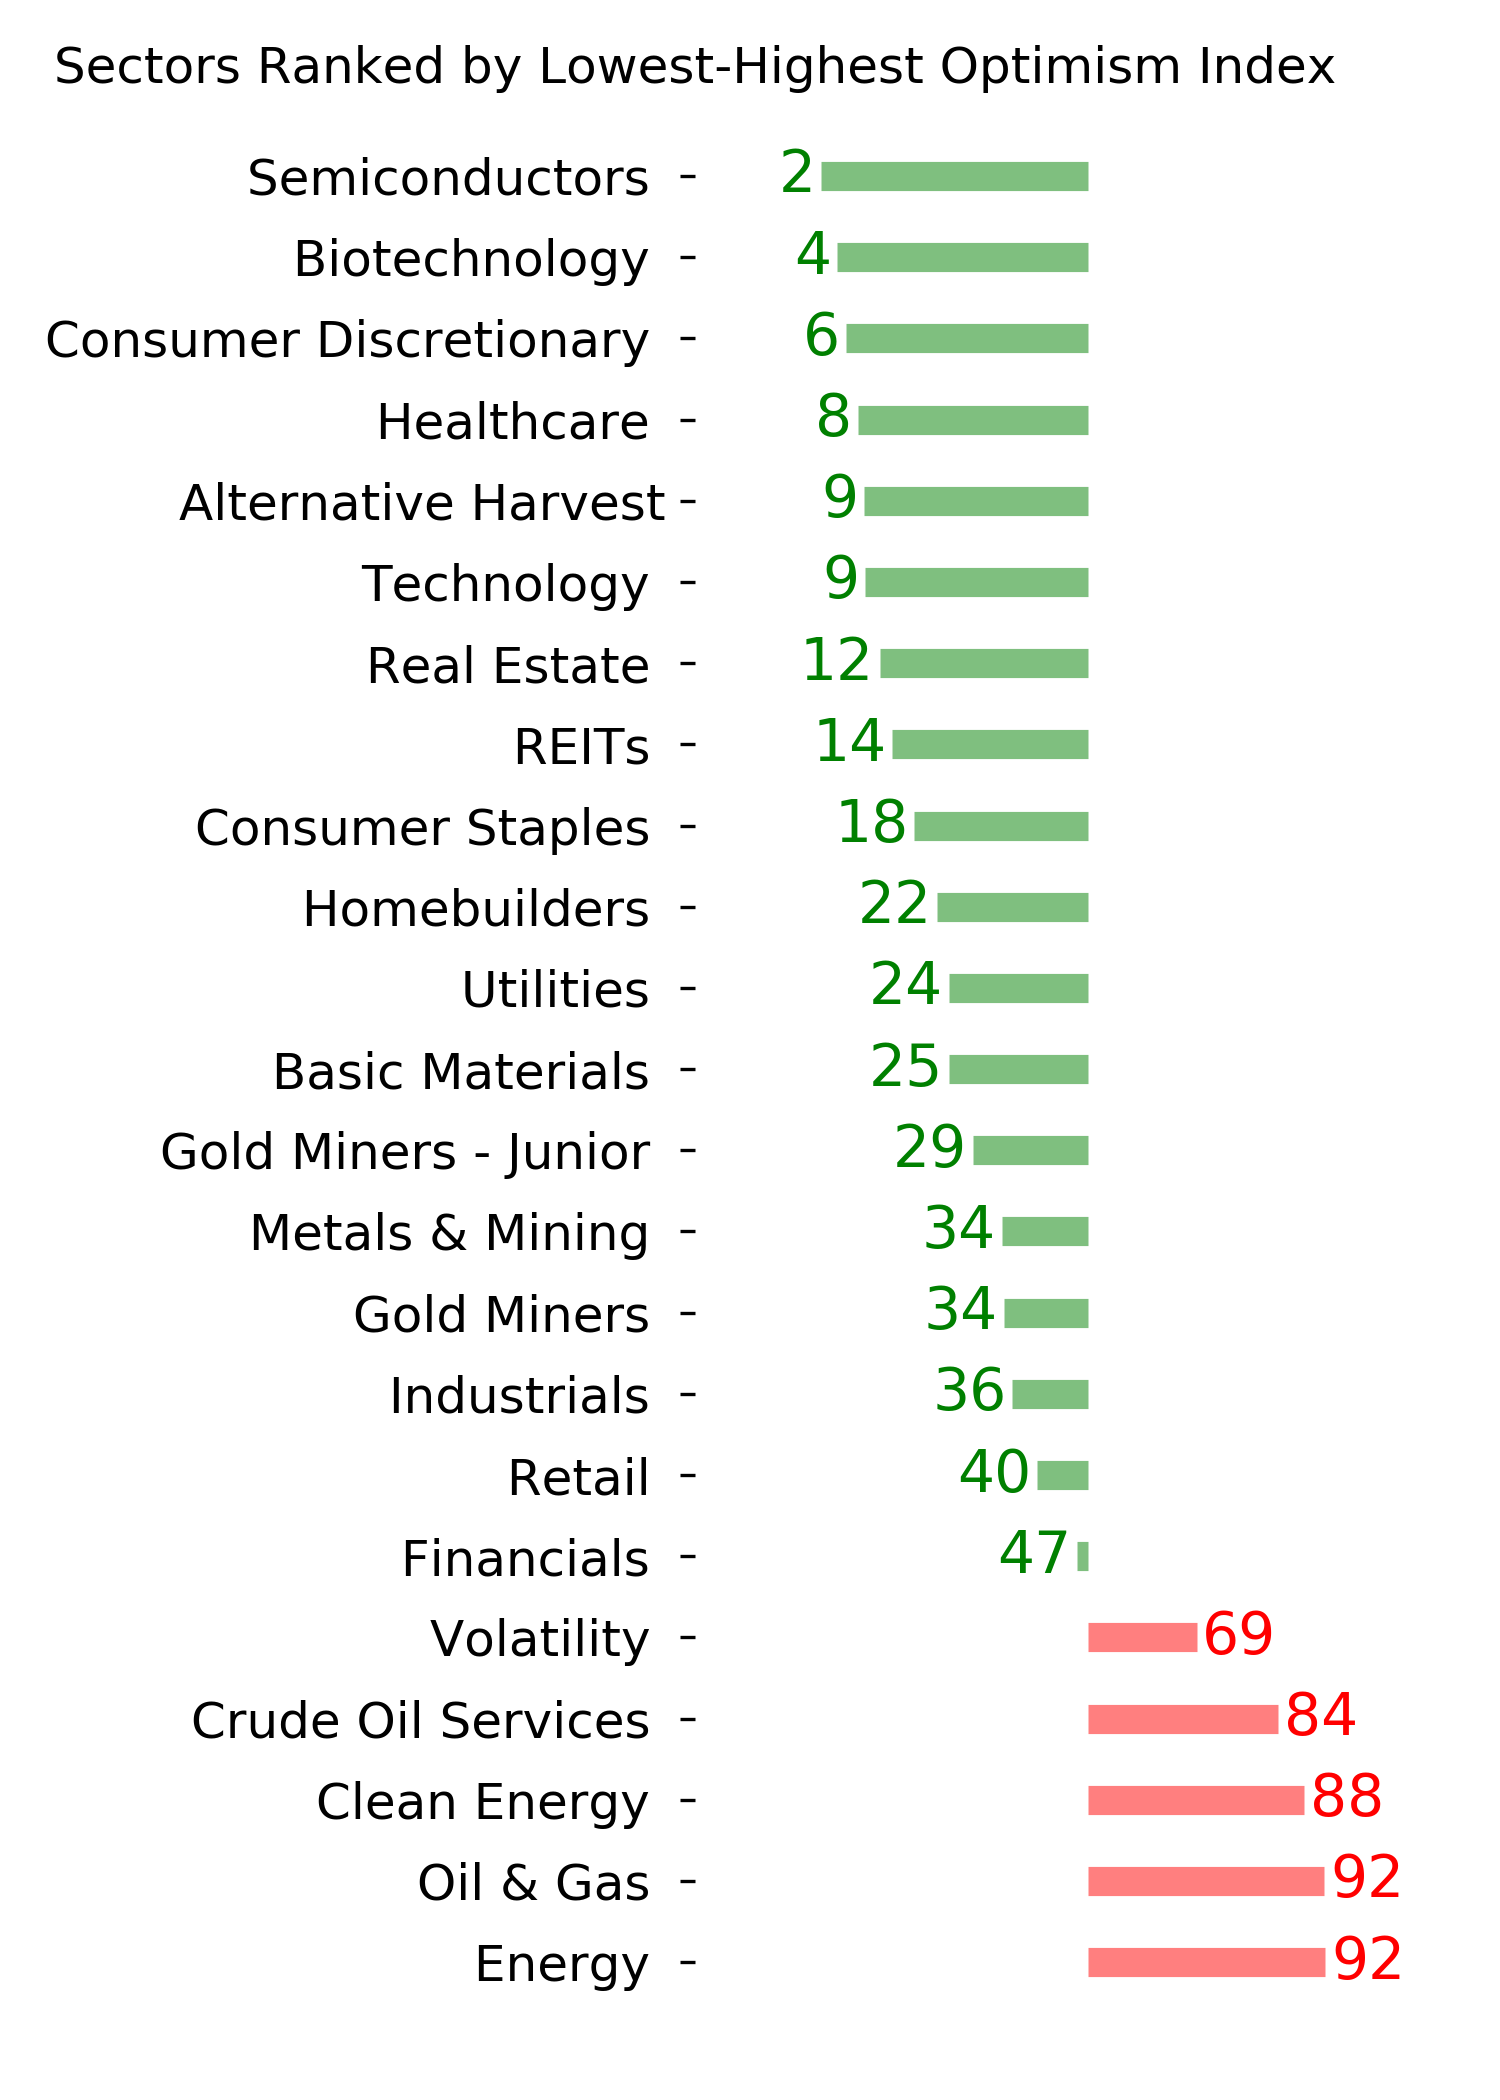
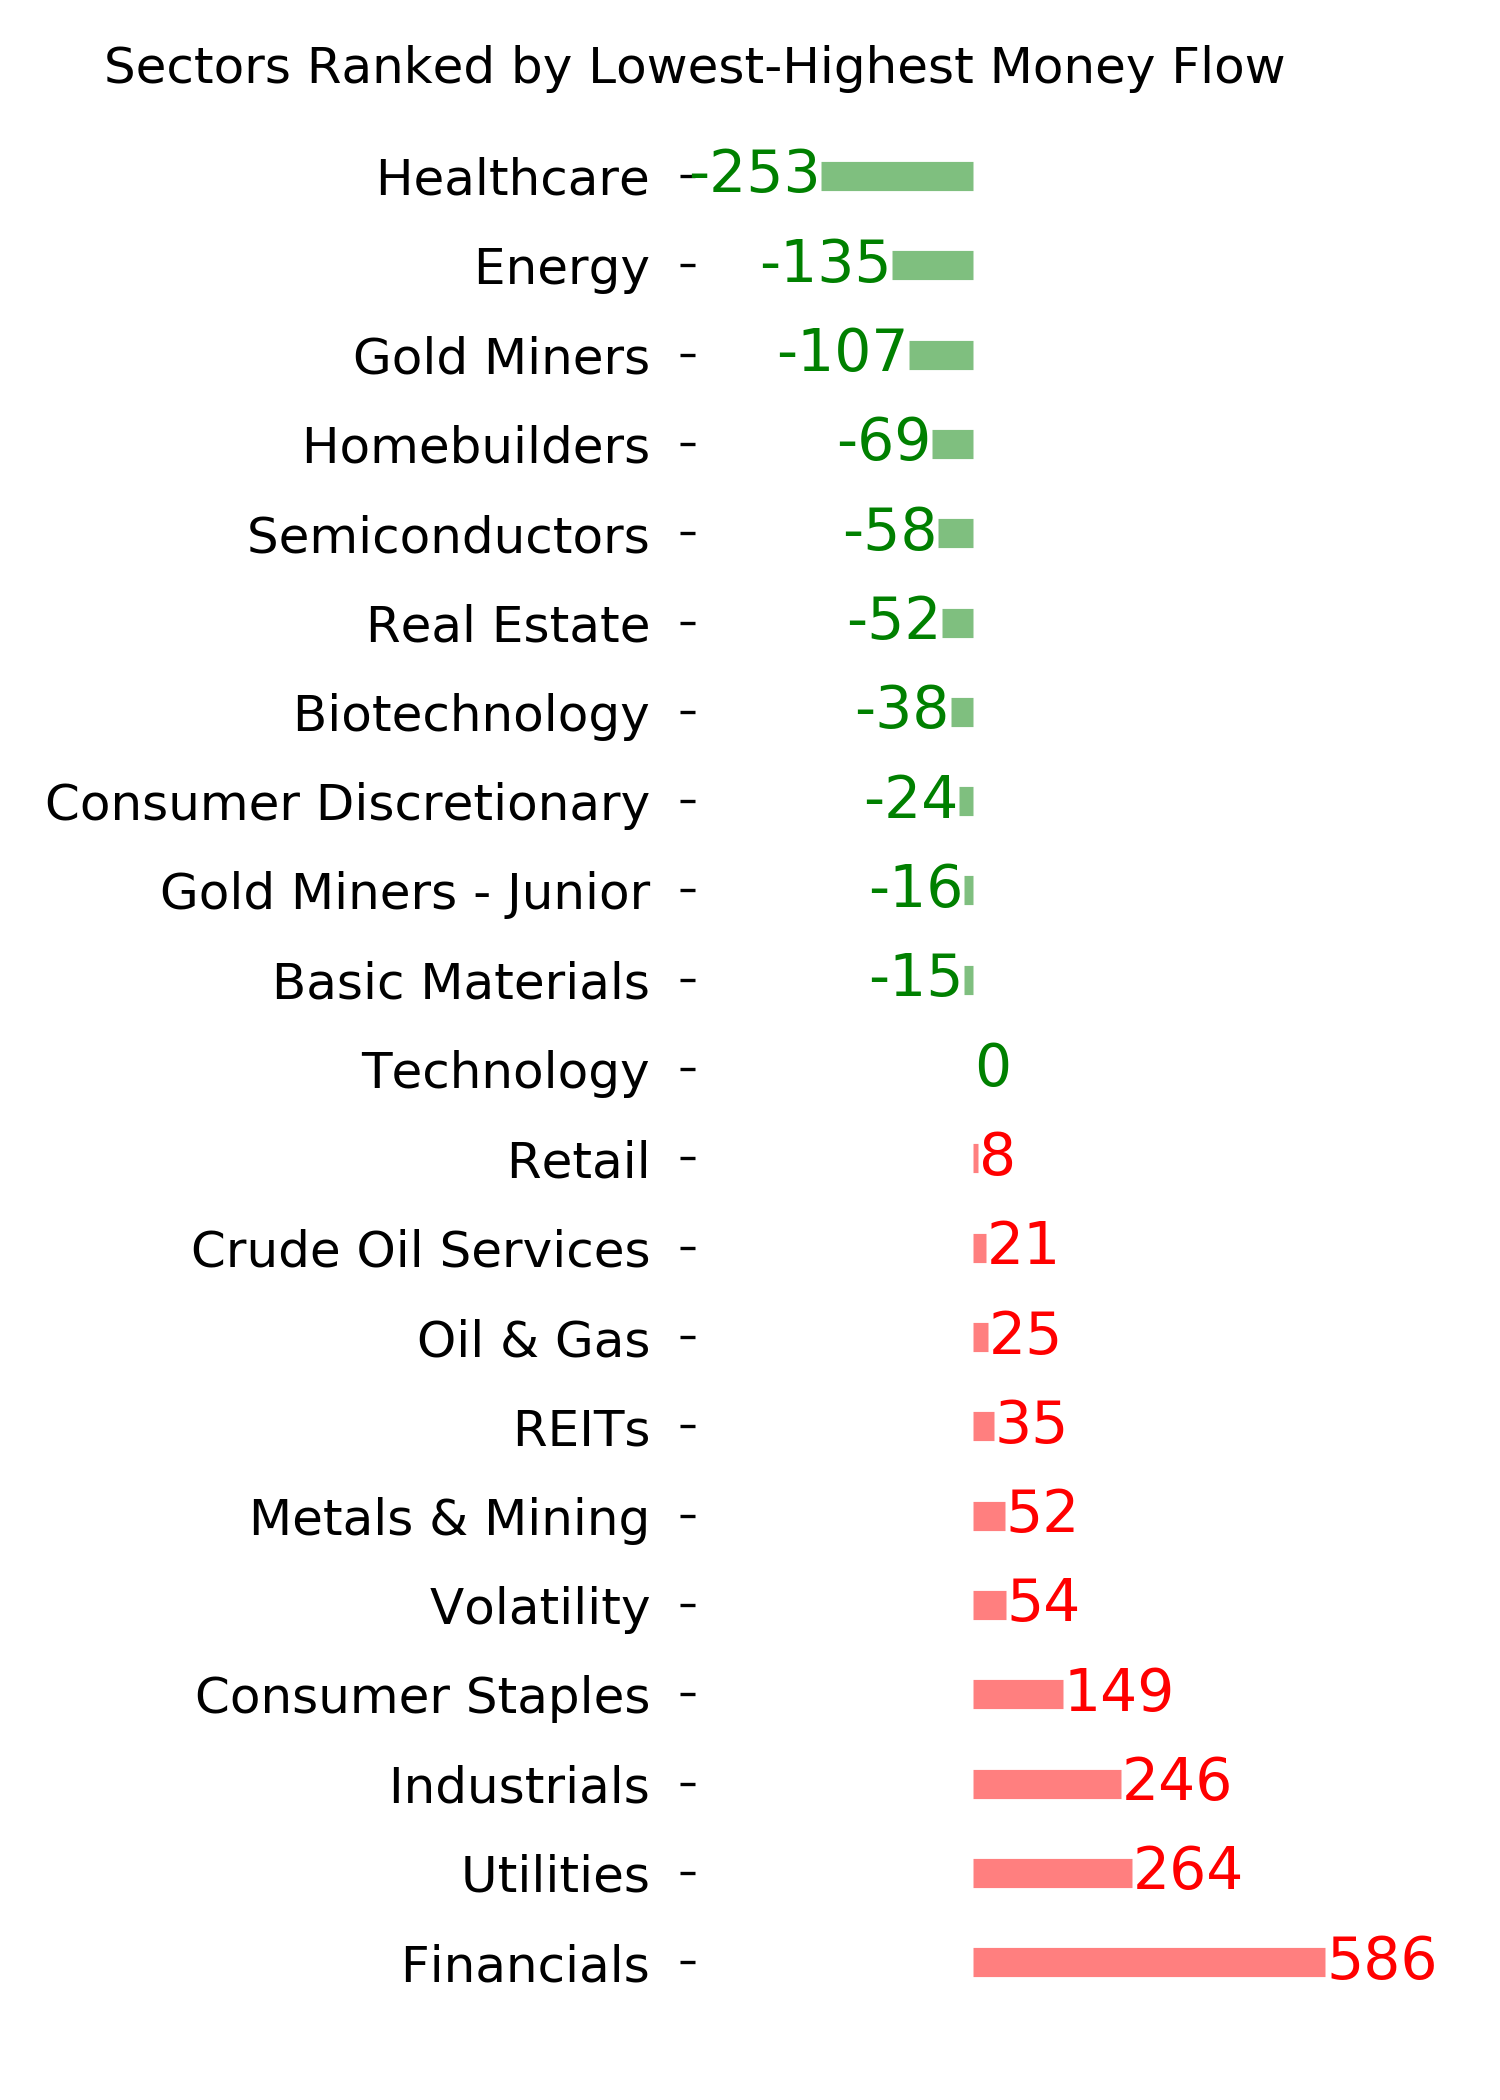
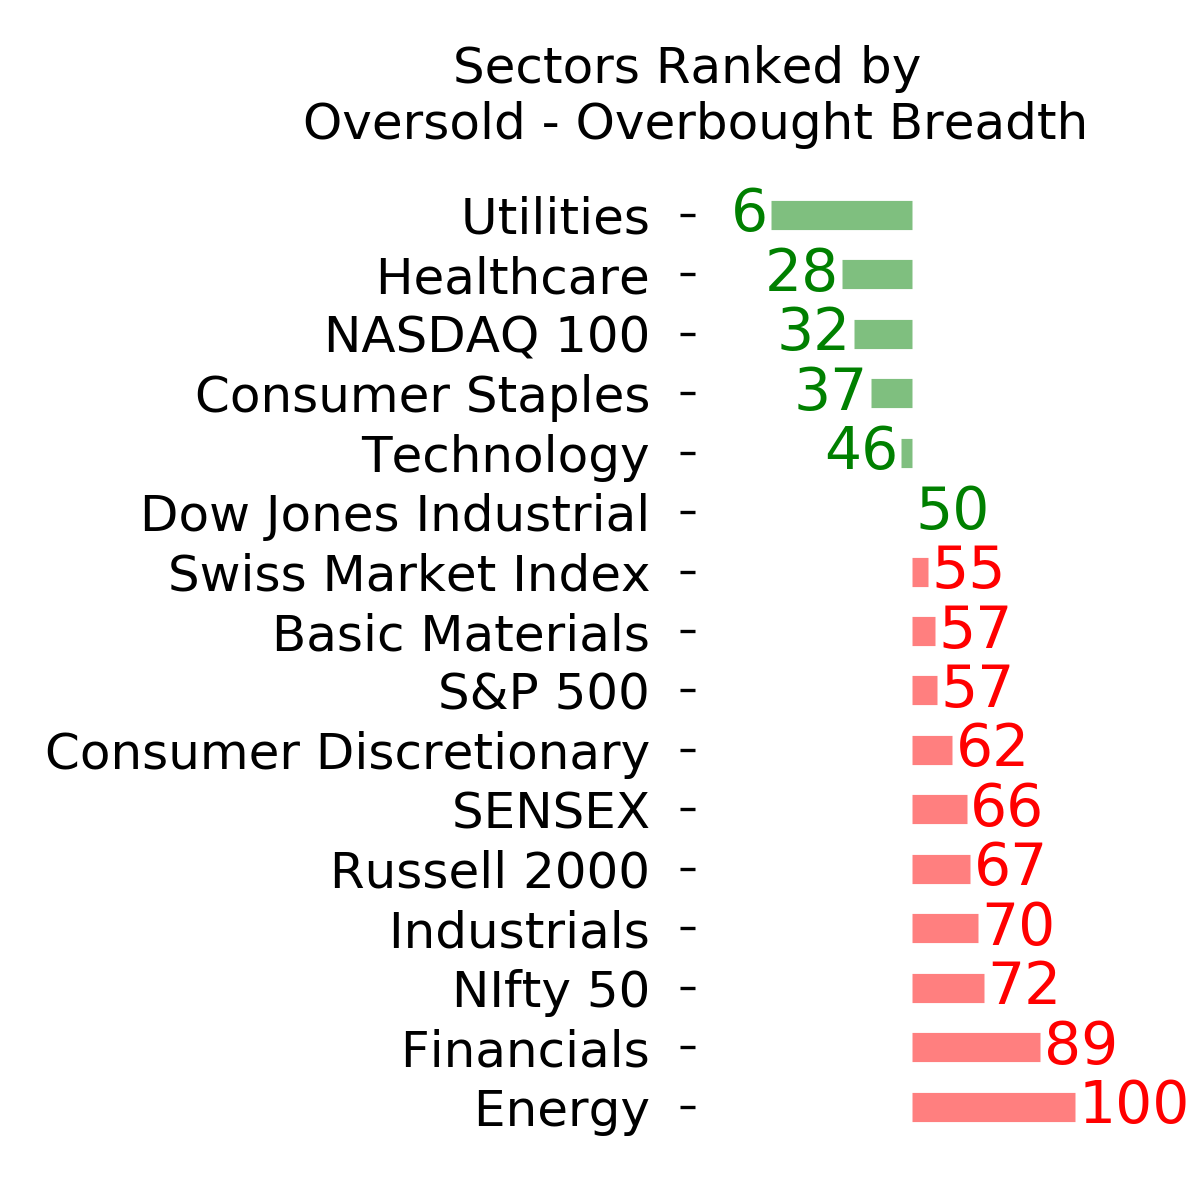
Ranks
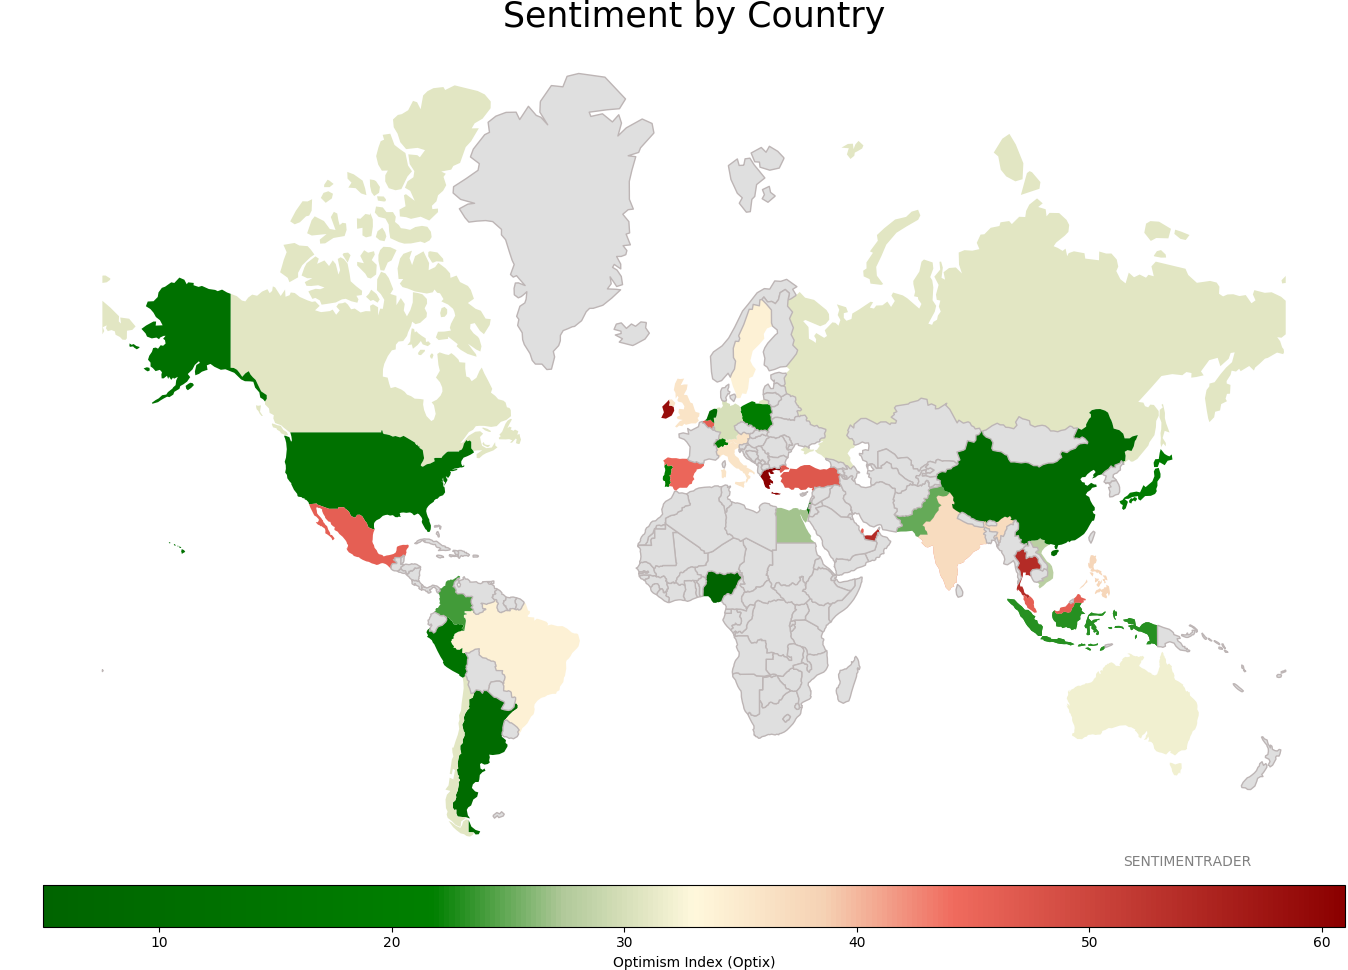
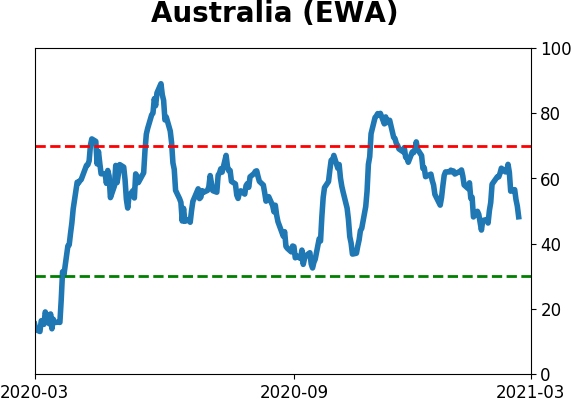
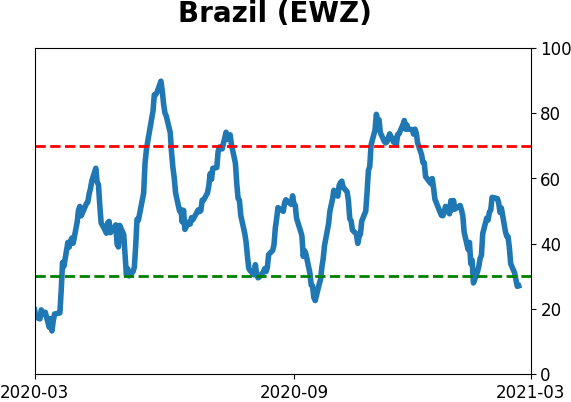
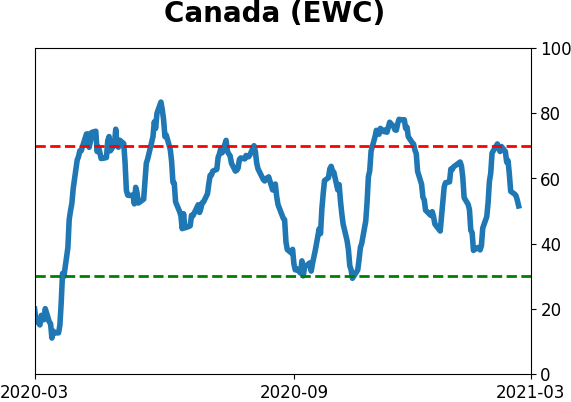
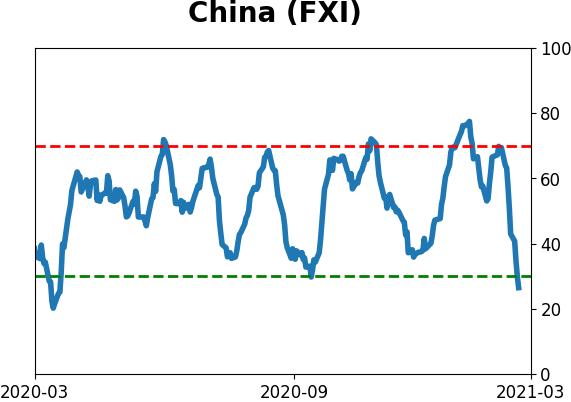
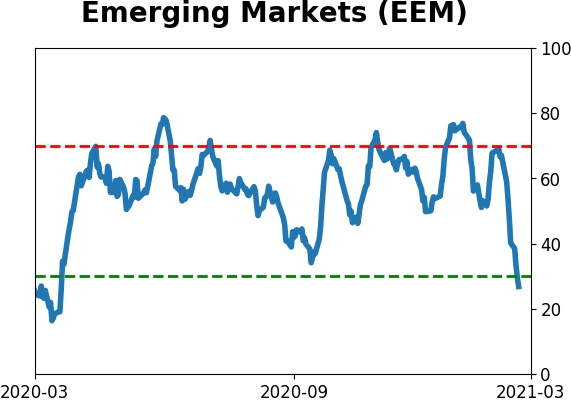
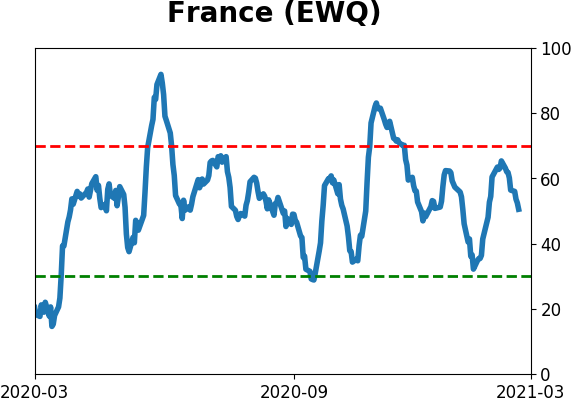
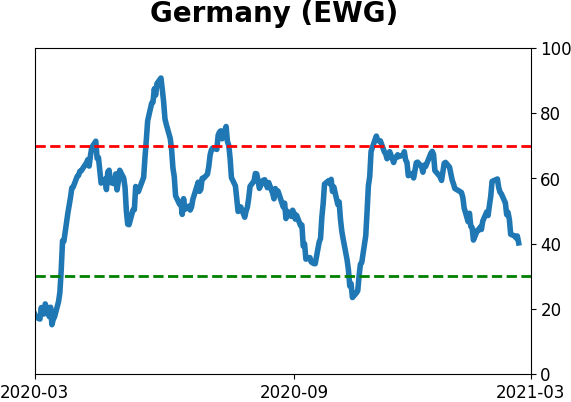
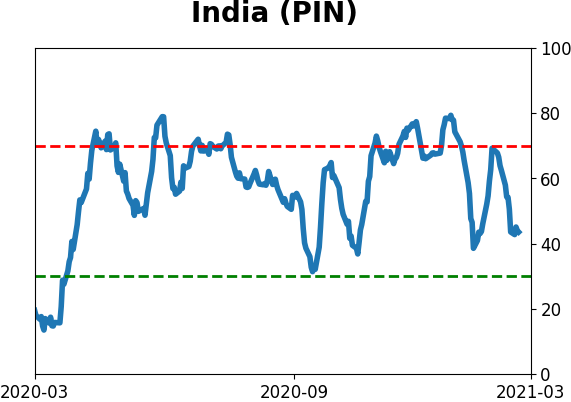
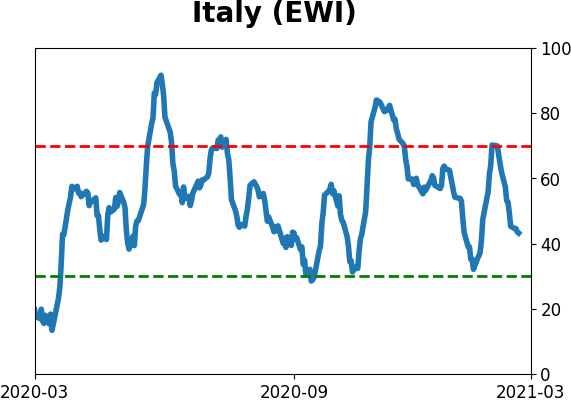
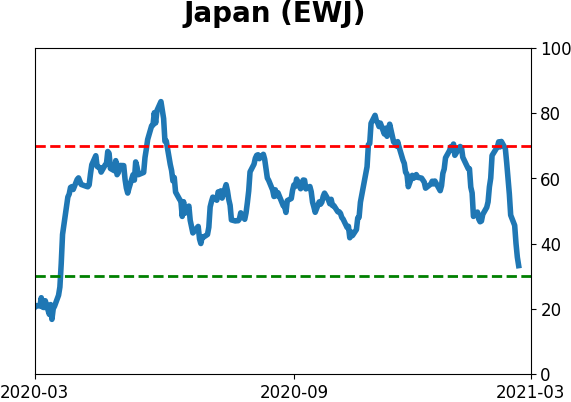
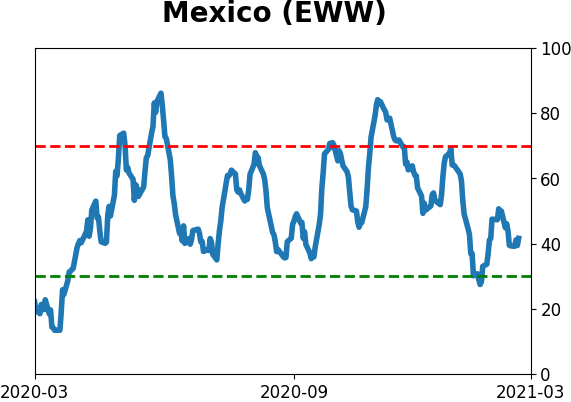
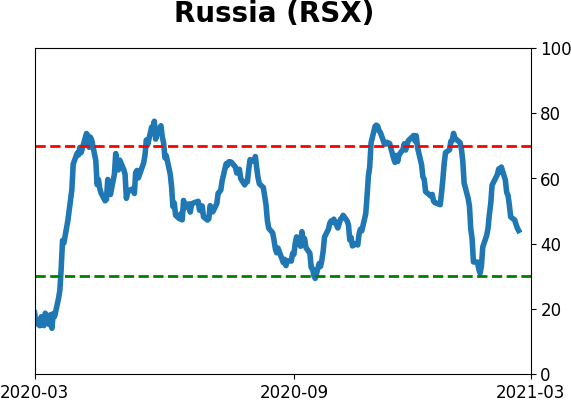
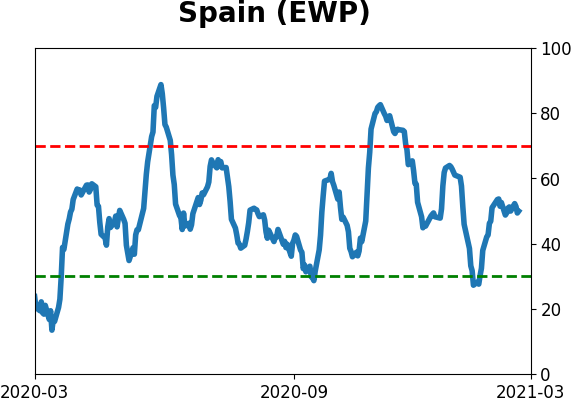
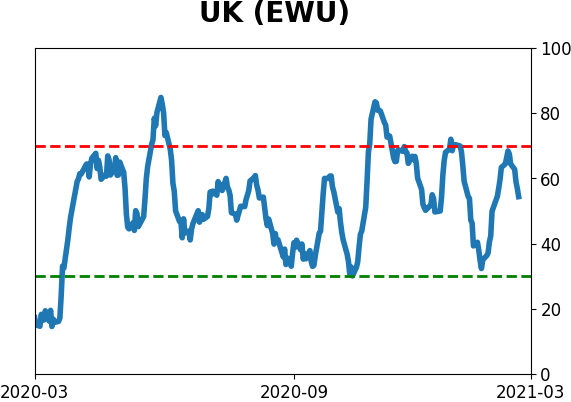
Sentiment Around The World
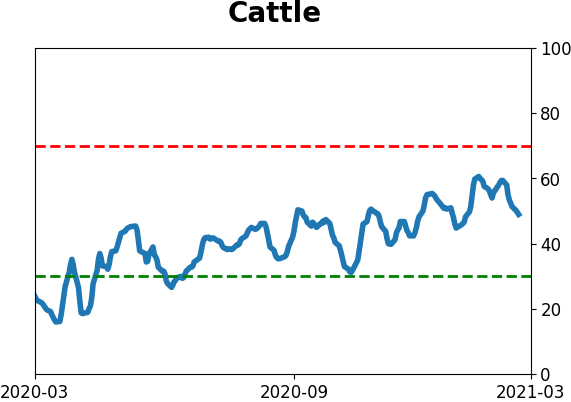
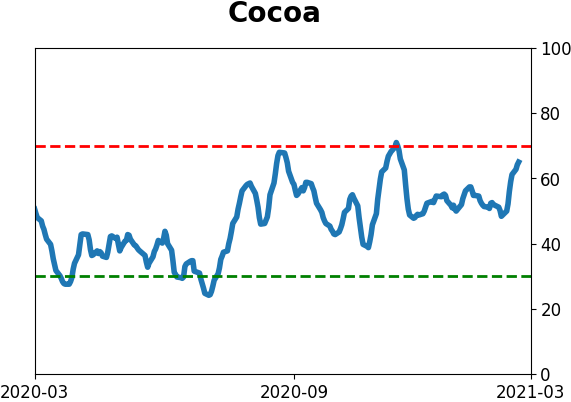
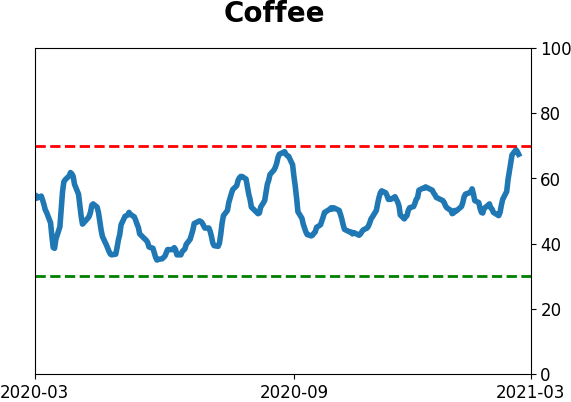
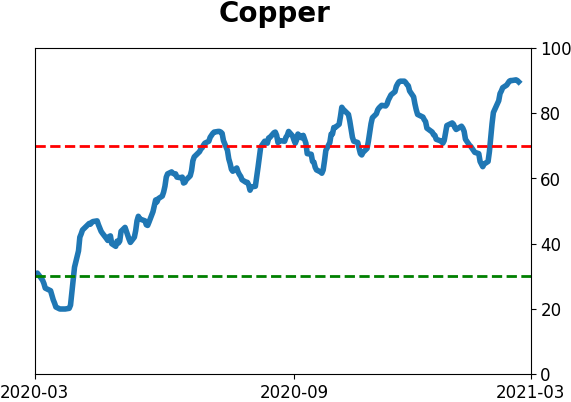
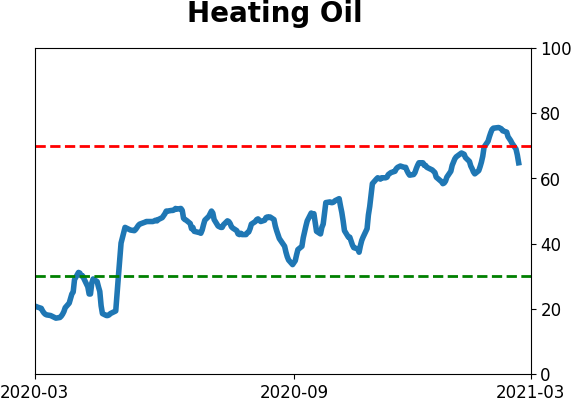
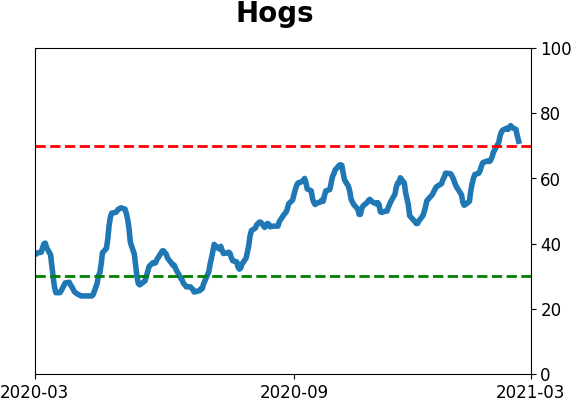
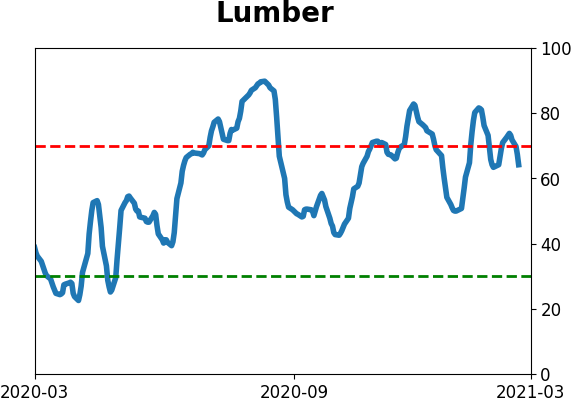
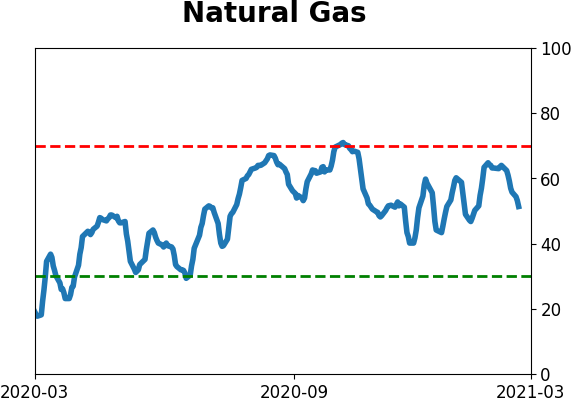
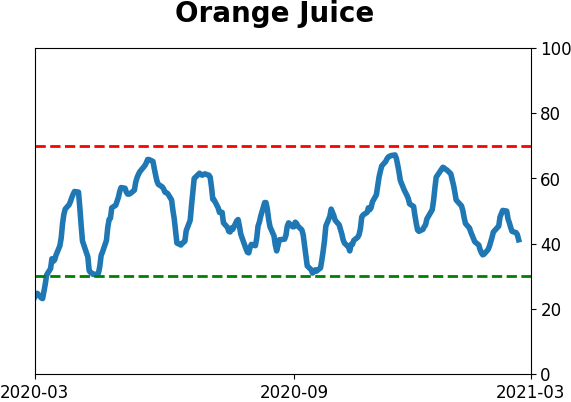
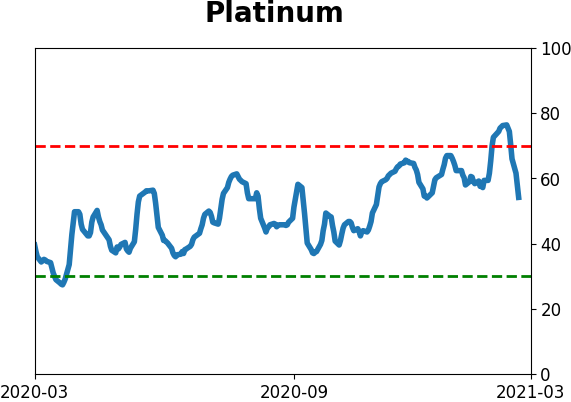
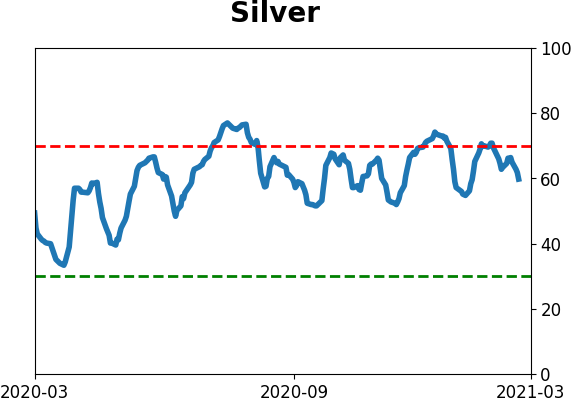
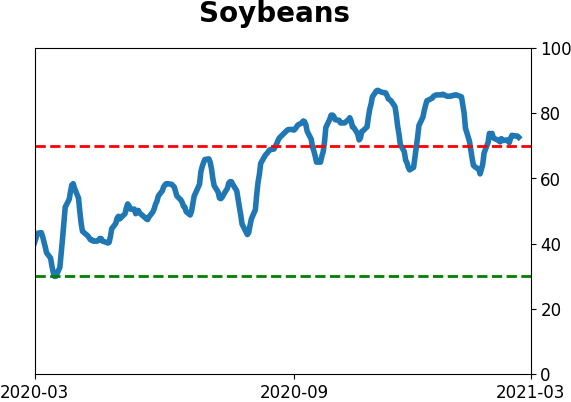
Optimism Index Thumbnails
|
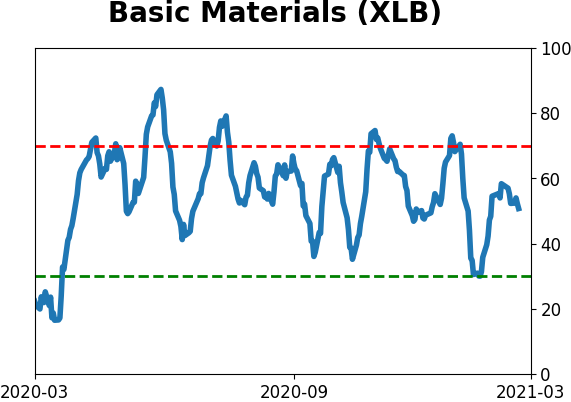
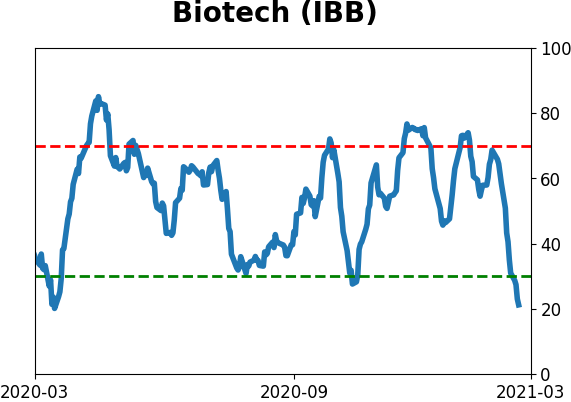
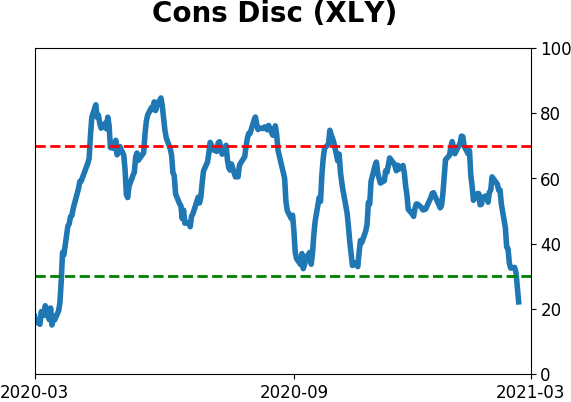
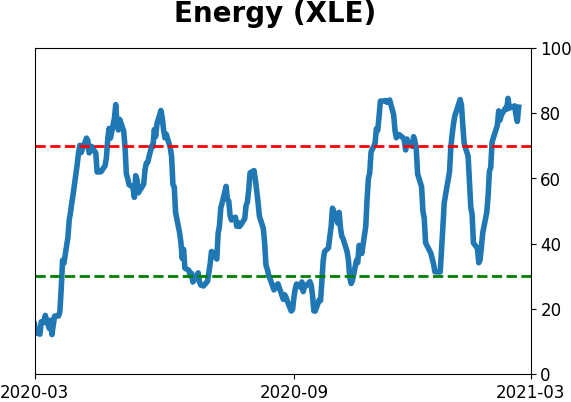
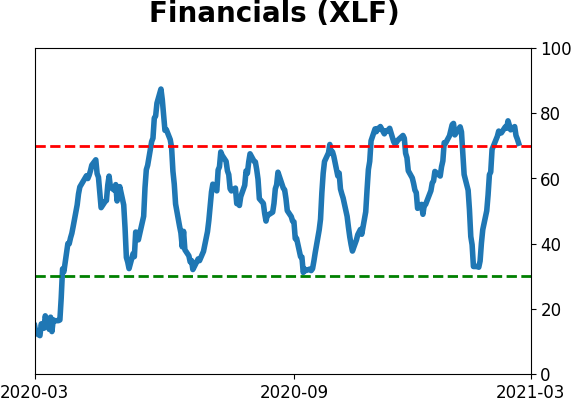
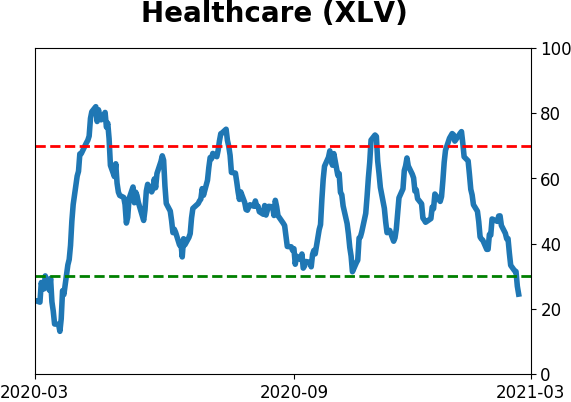
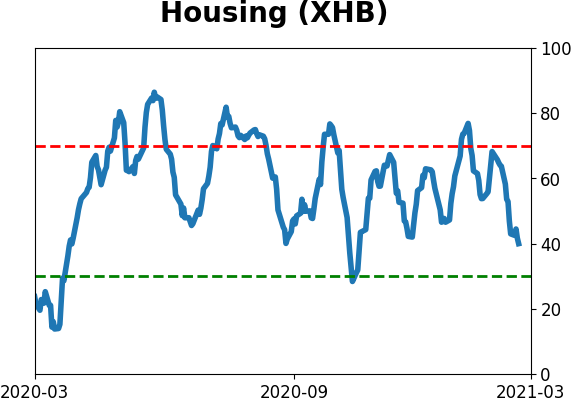
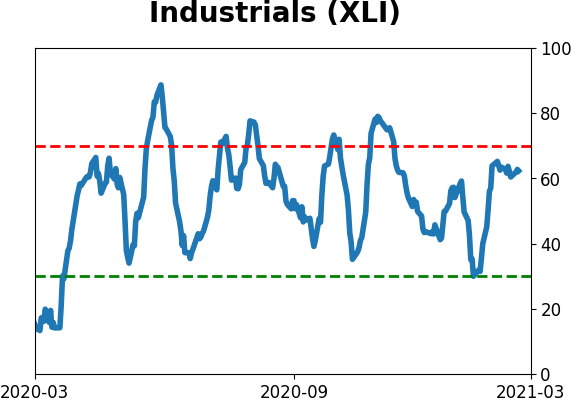
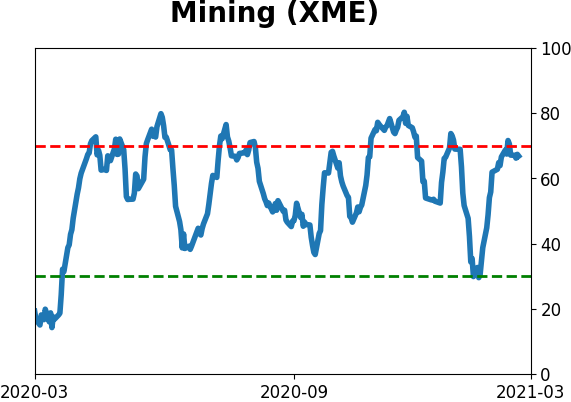
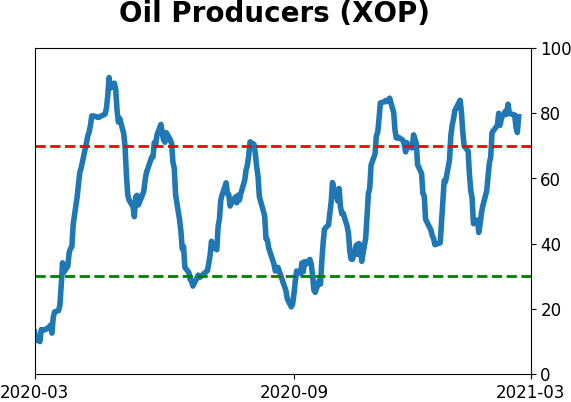
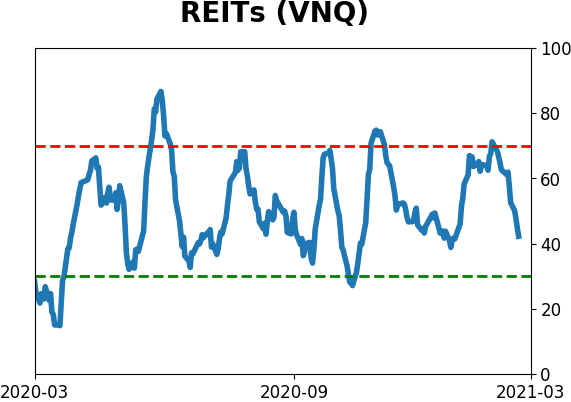
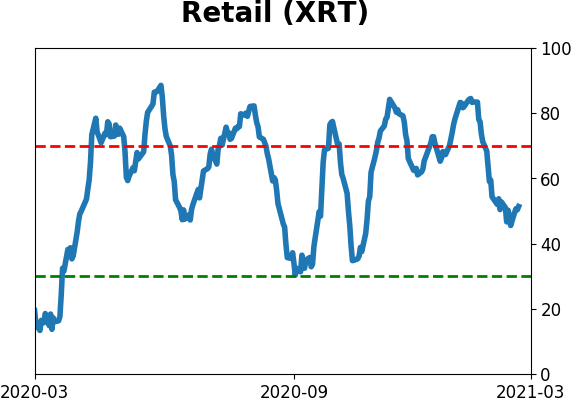
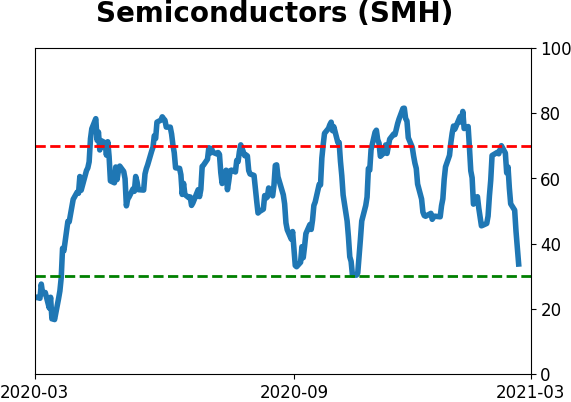
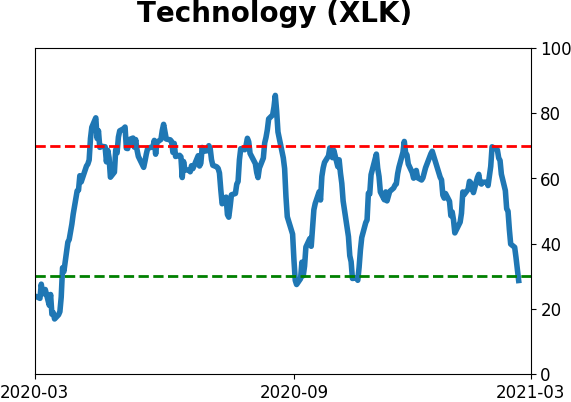
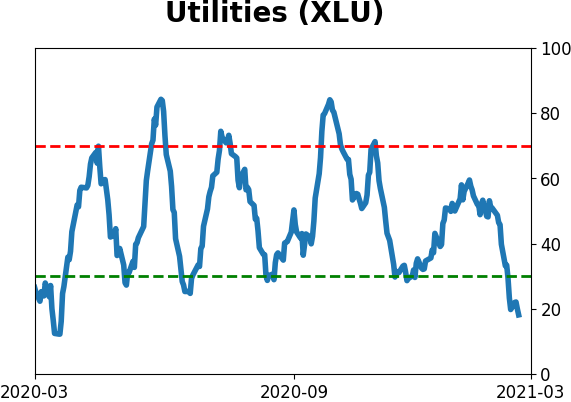
Sector ETF's - 10-Day Moving Average
|
|
|
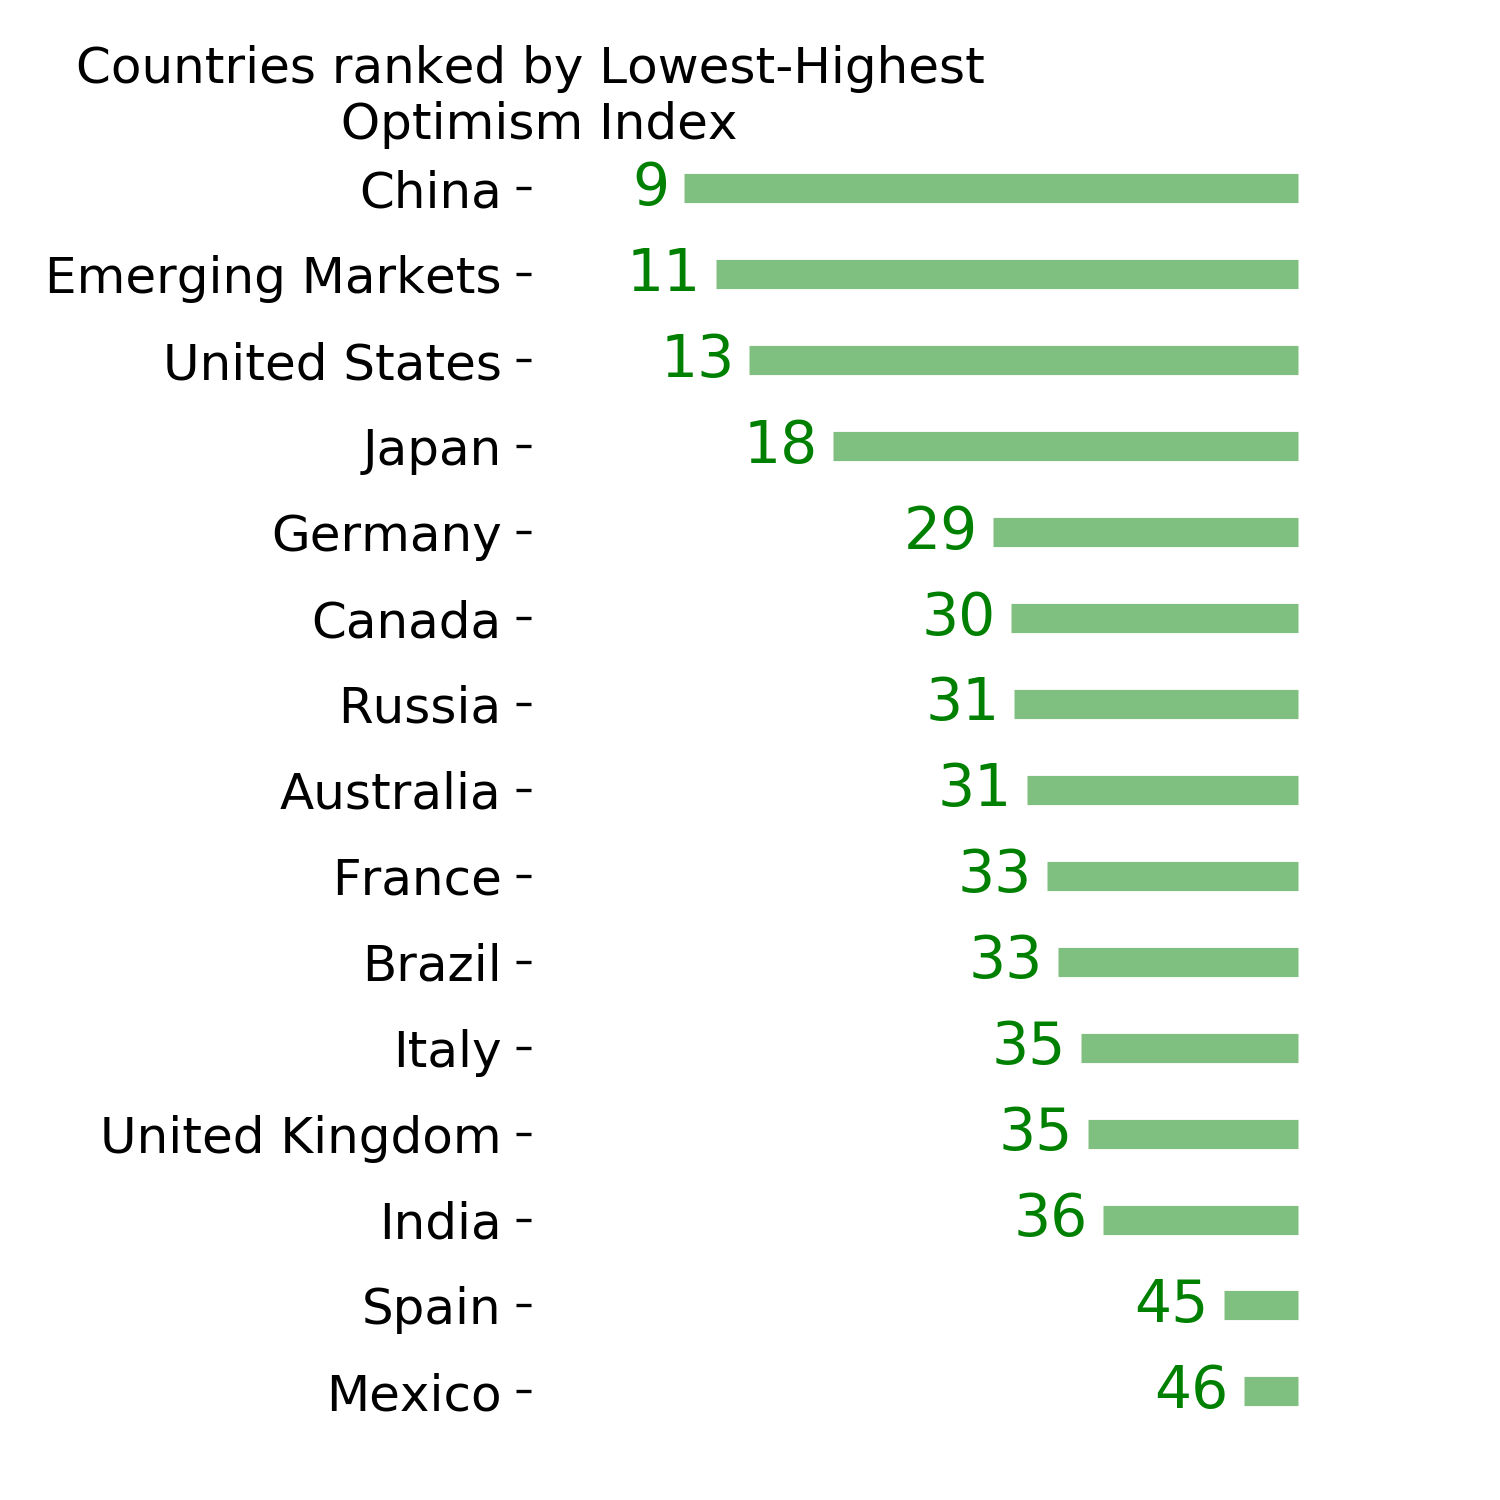
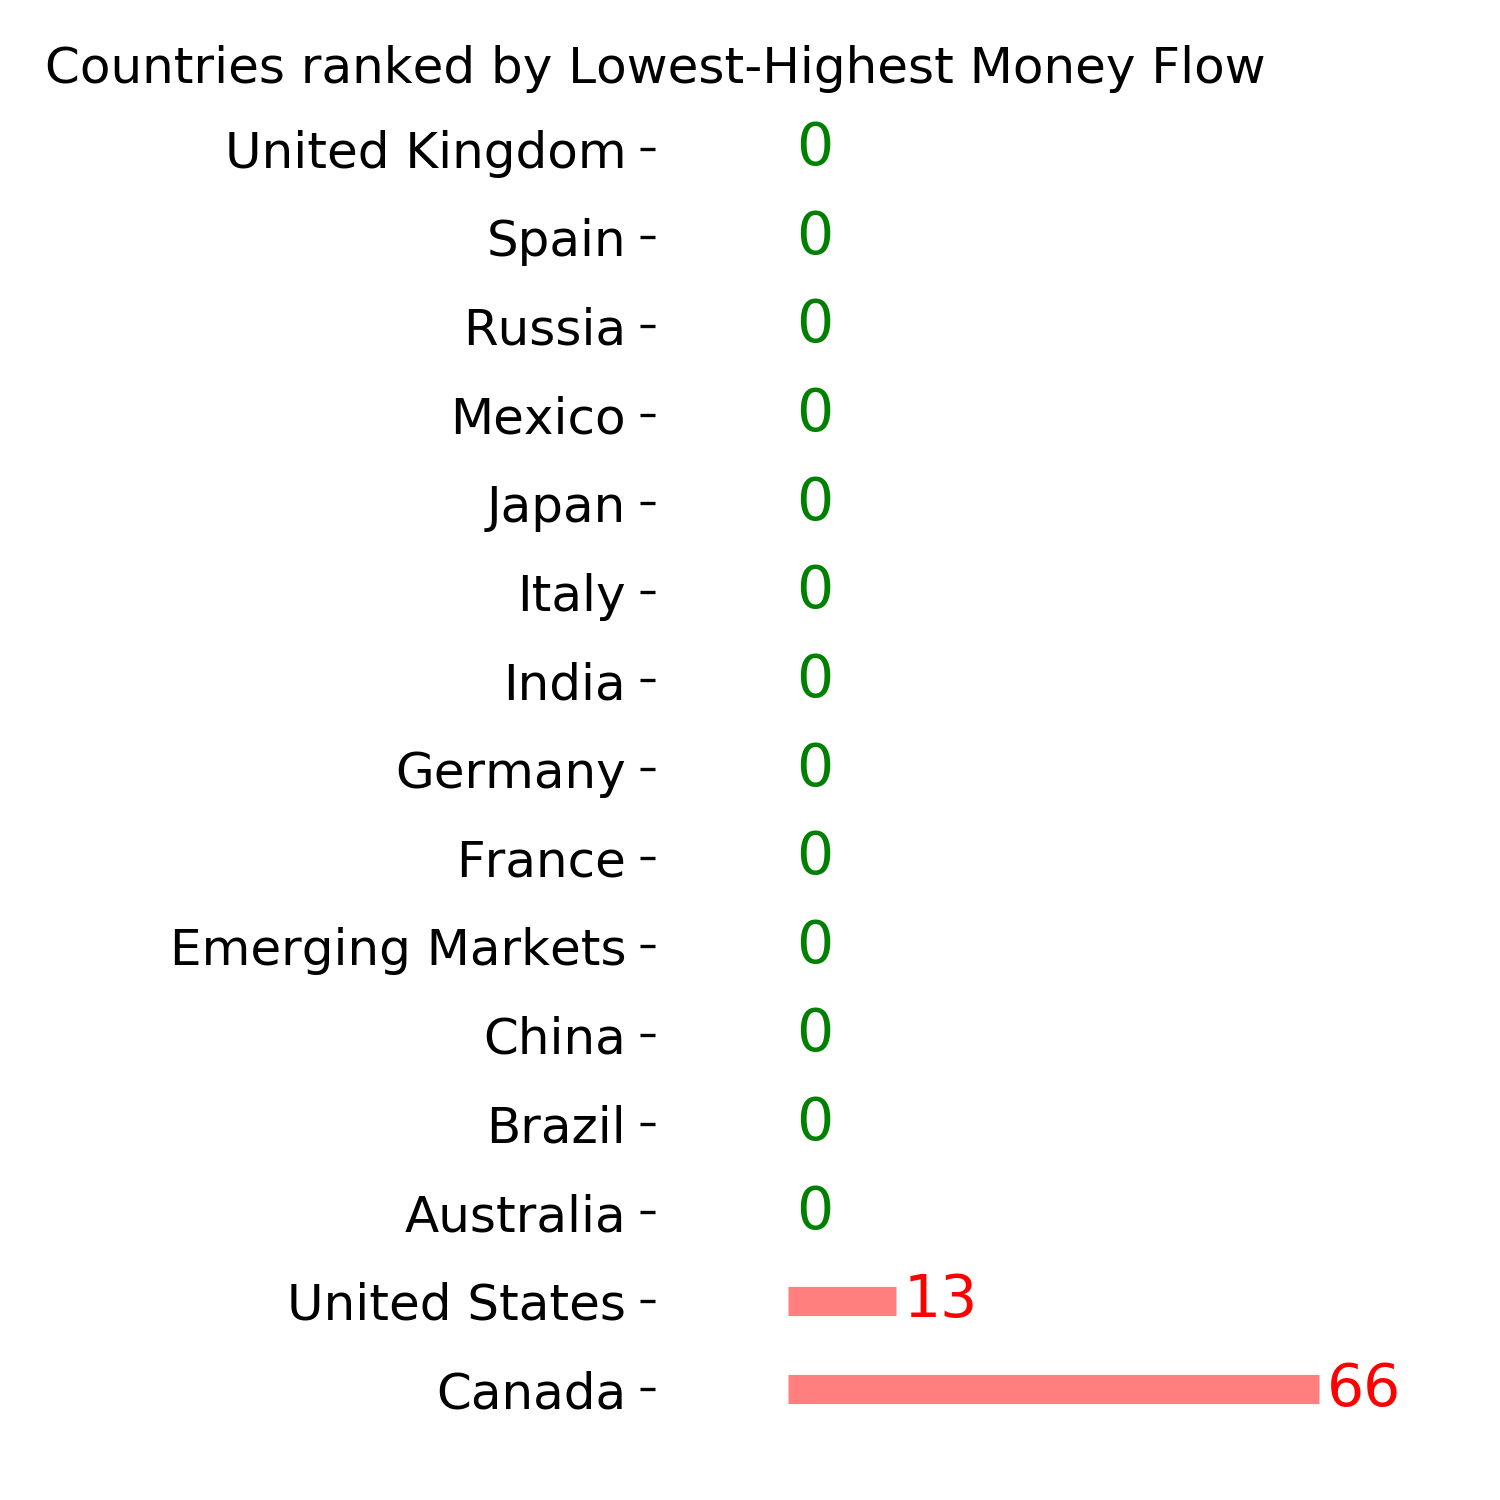
Country ETF's - 10-Day Moving Average
|
|
|
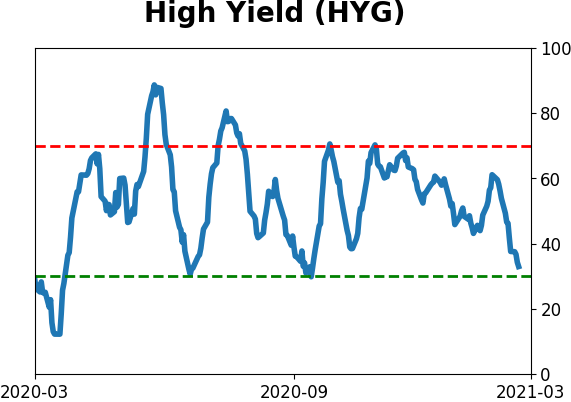
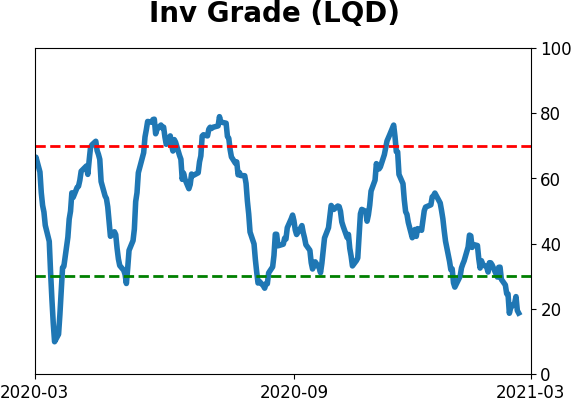
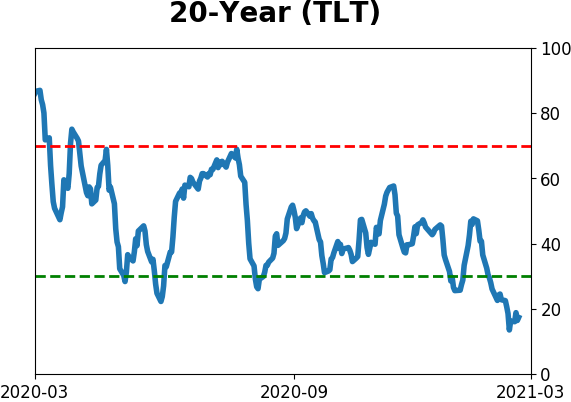
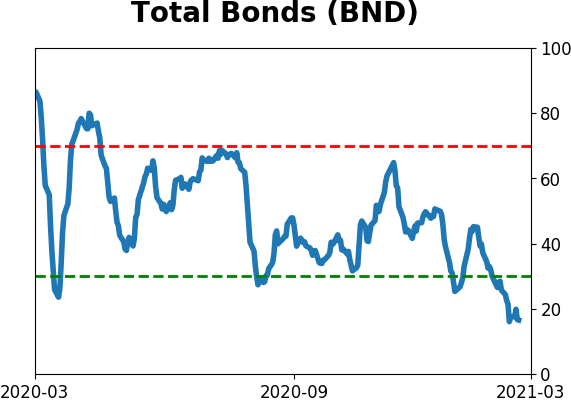
Bond ETF's - 10-Day Moving Average
|
|
|
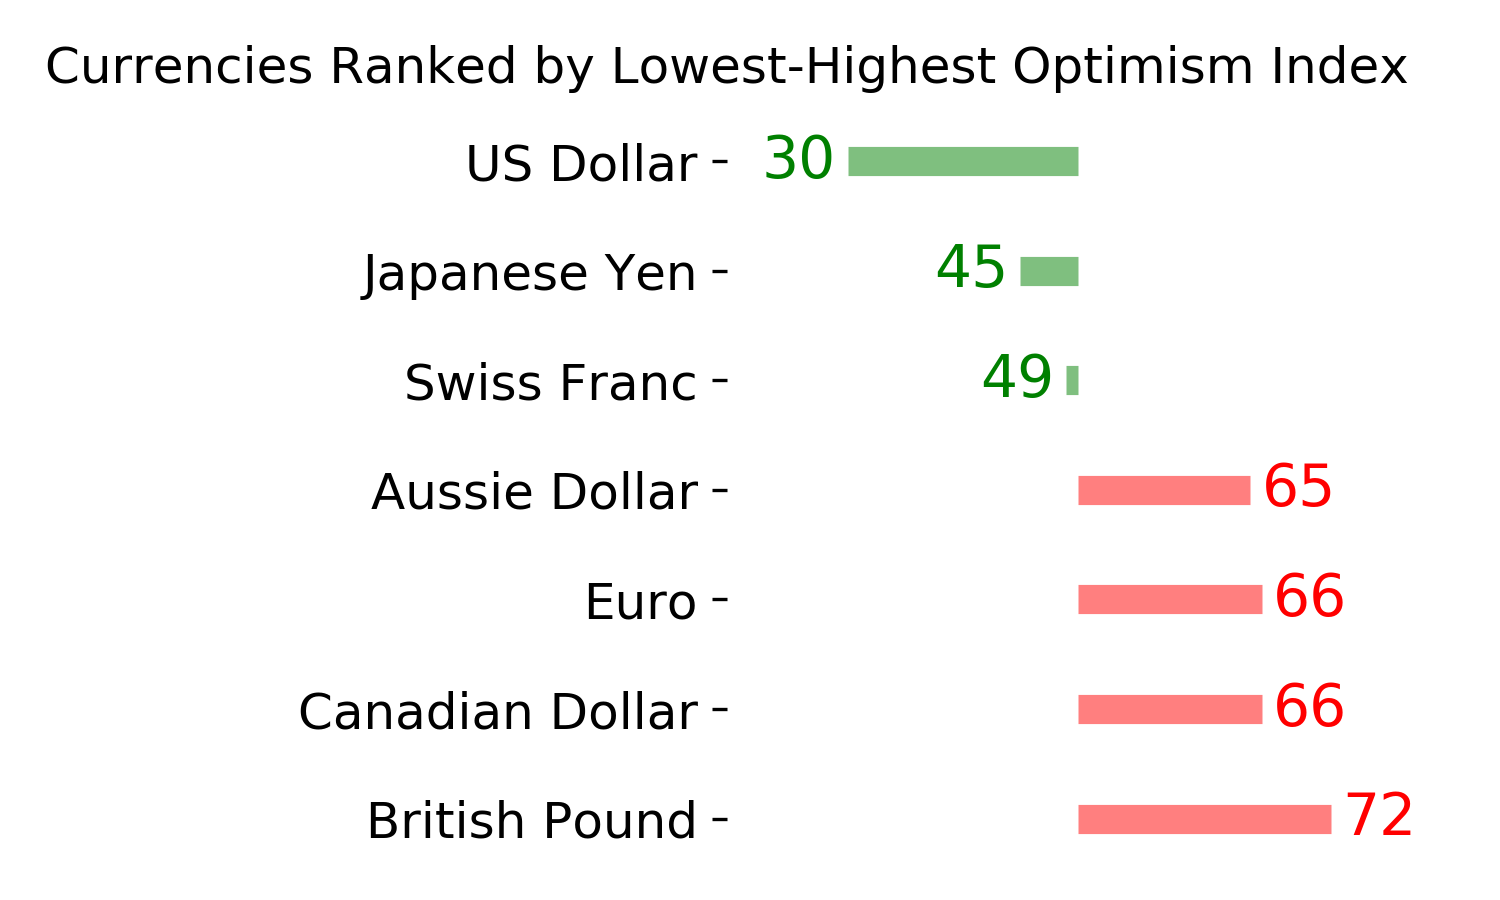
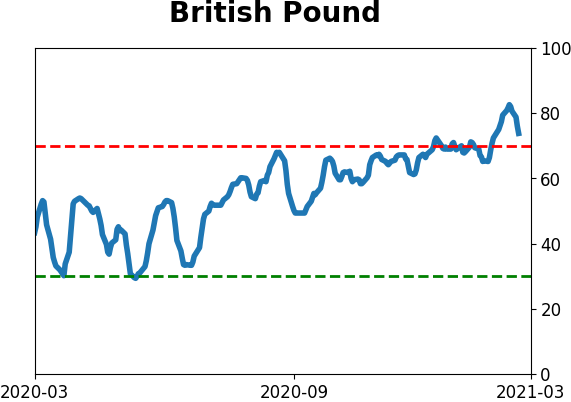
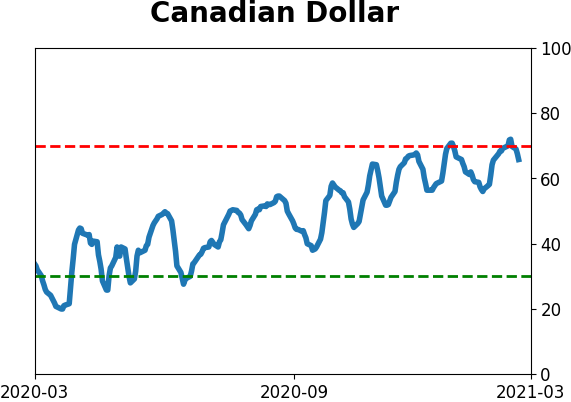
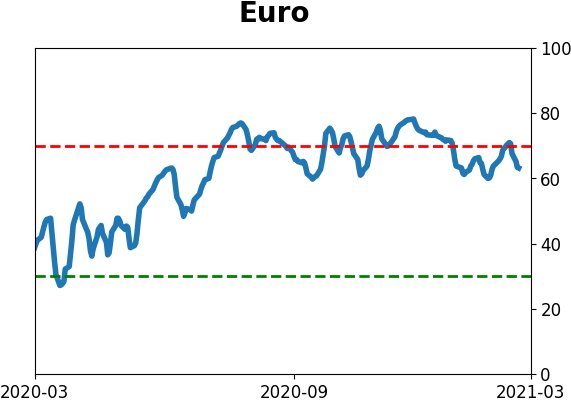
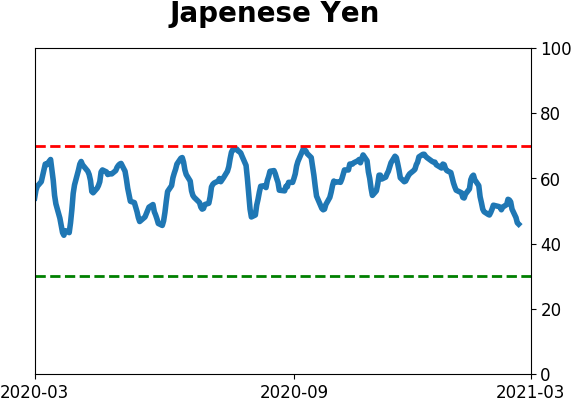
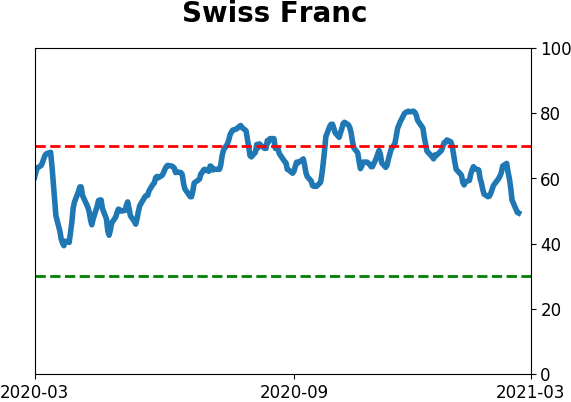
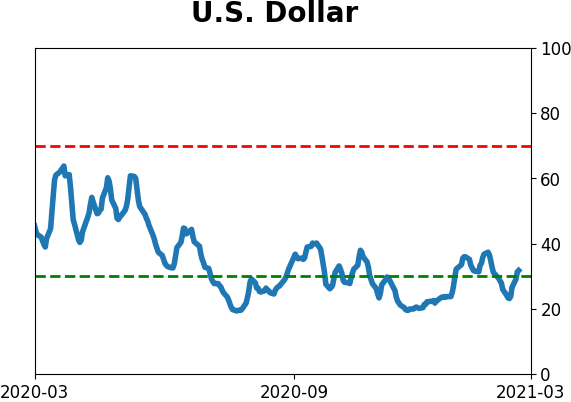
Currency ETF's - 5-Day Moving Average
|
|
|
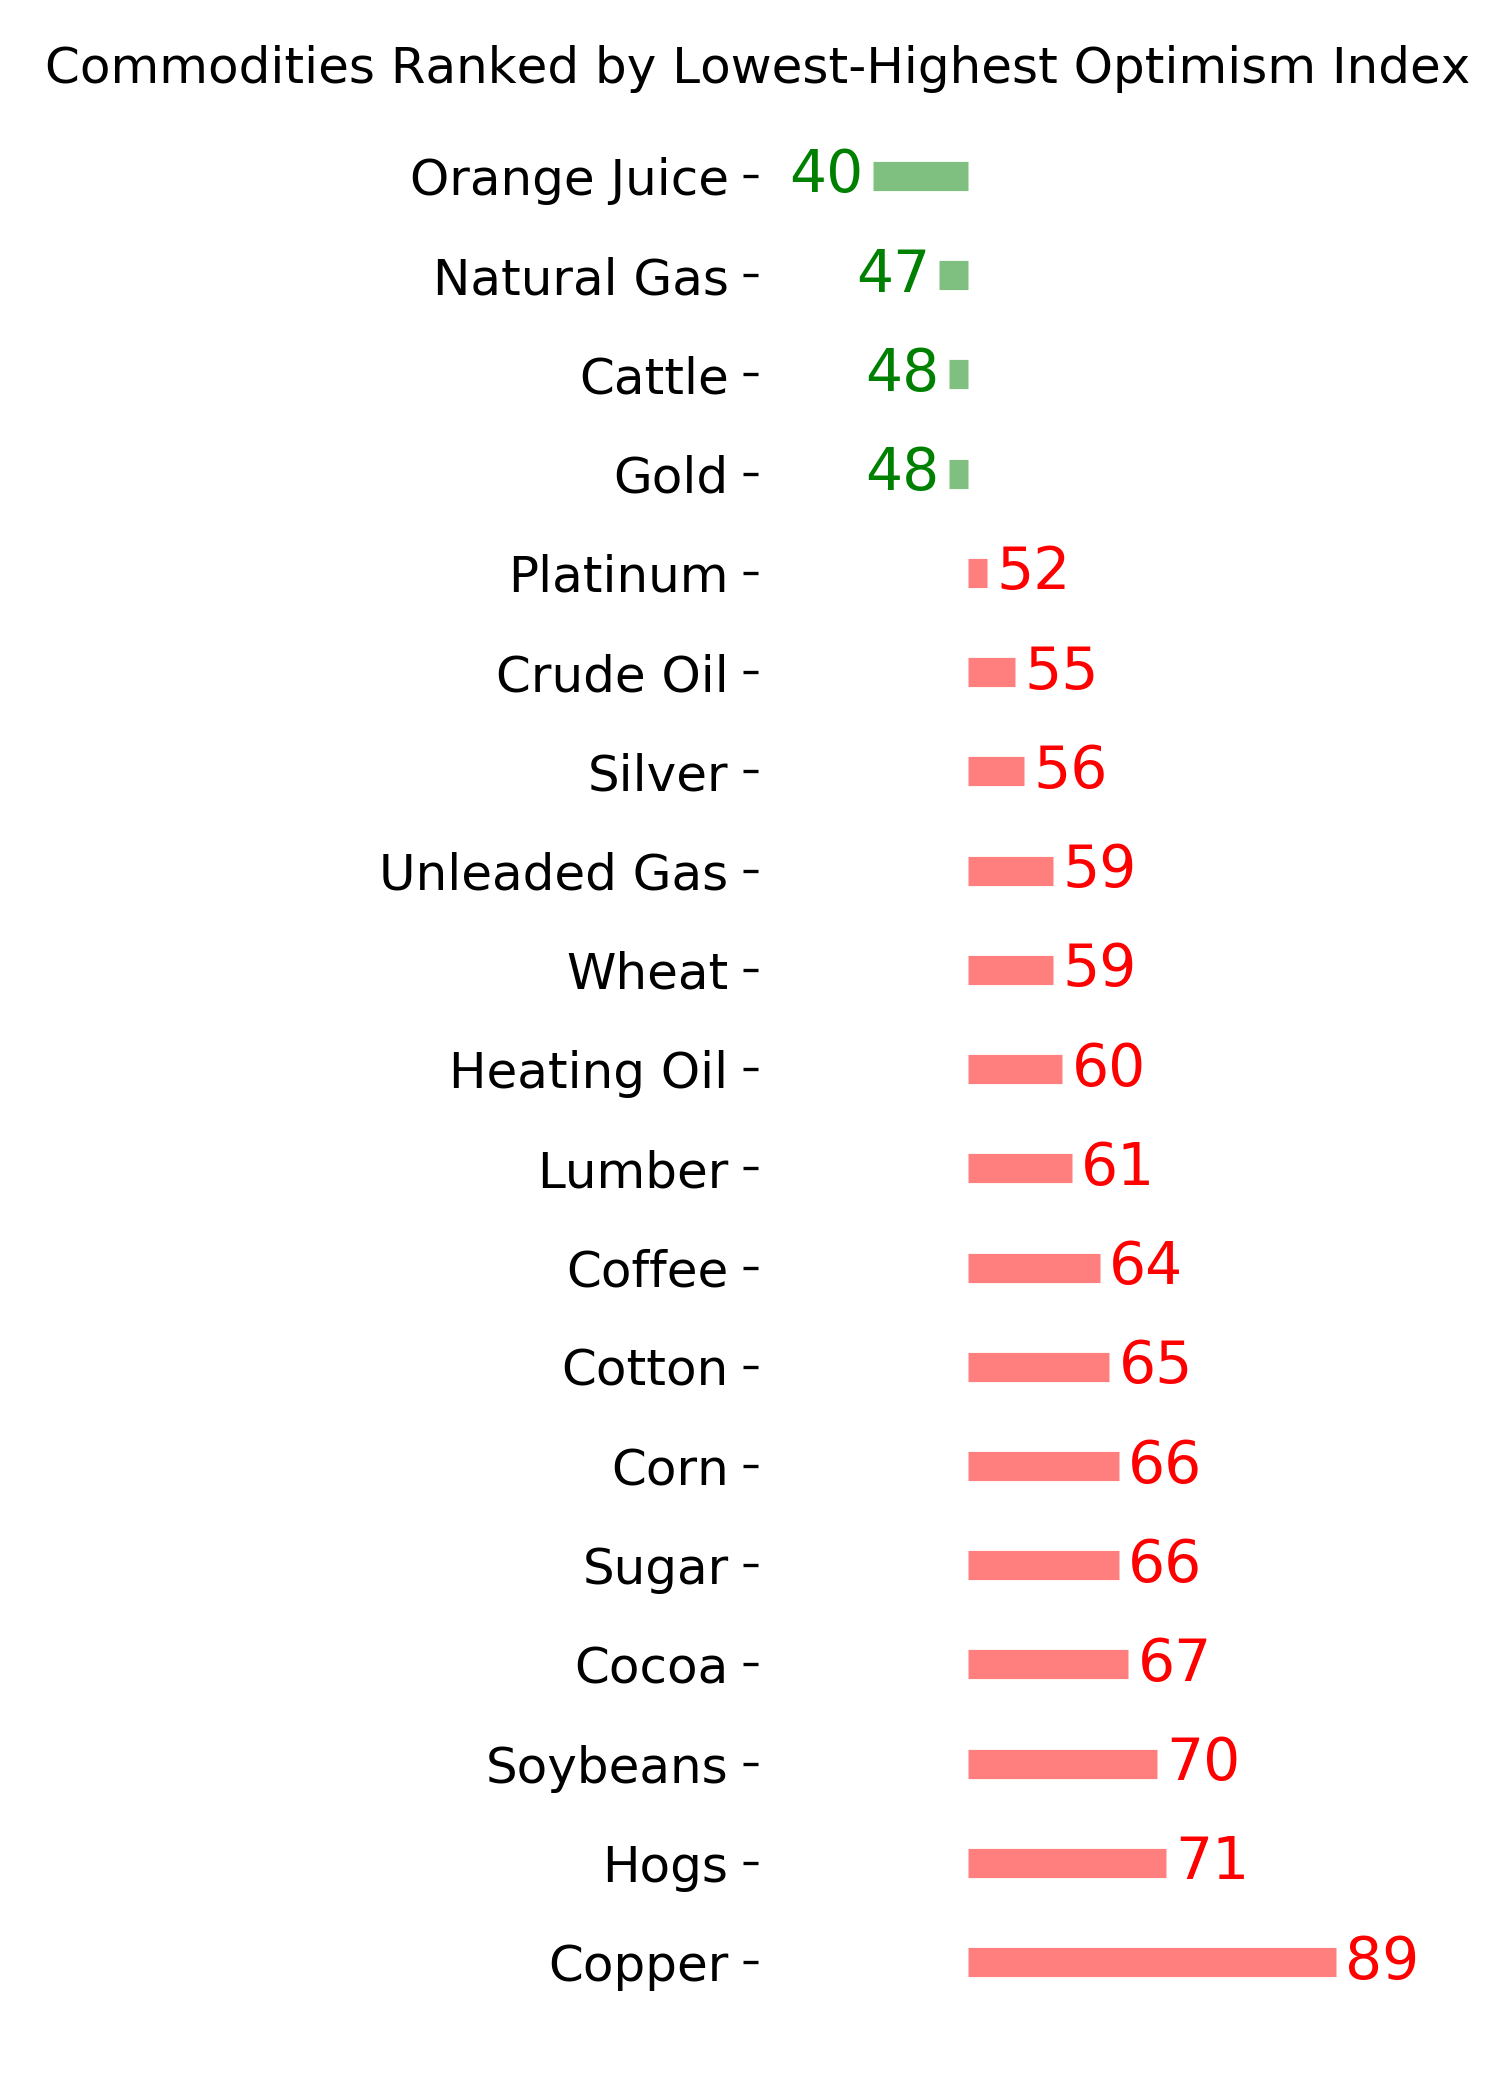
Commodity ETF's - 5-Day Moving Average
|
|