Headlines
|
|
Weekly reversal in S&P 500 and its stocks:
The S&P 500 enjoyed a large weekly reversal from a low, one of the largest in 20 years. There was also a near record number of selling climaxes among stocks in the index.
Bear market probability is on the verge of plunging:
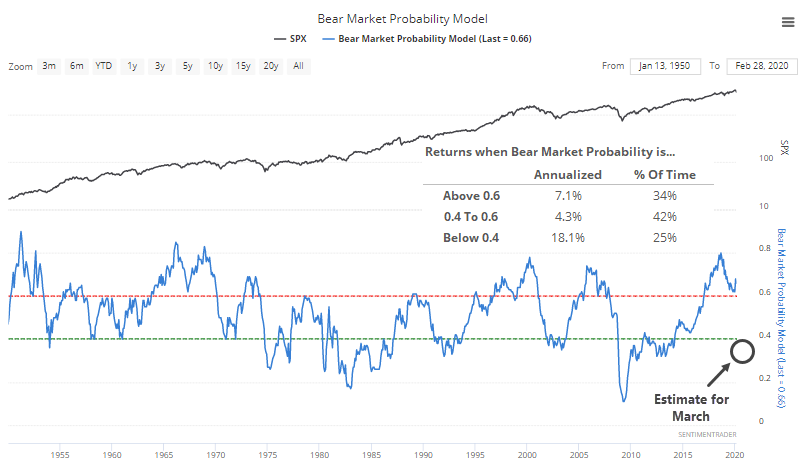
In the fall of 2018, the Bear Market Probability Model suggested an 80% chance of a bear market ahead, one of the highest readings since 1950. Based on the latest estimates, that could now plunge to below 40%.
Premium Note: Reminder on preferences:
A quick reminder about how to set your email preferences and choose only the kinds of research pieces you want to see.
Premium Note: Confidence in stocks pulls back from record:
One of the worst tumbles in Wall Street history put a damper on what had been record consumer confidence in a rising stock market. But it didn't decline as much as we might think...or that contrarians would prefer.
Premium Note: MACD buy signals - continued:
An extremely large number of U.S. stocks have triggered MACD buy signals.
Premium Note: Change in short term trend:
Most stocks were in a very persistent short term downtrend over the past few weeks. Now that stocks are rallying, most stocks are in a short term uptrend.
Premium Note: Sentiment is curling up:
Sentiment is starting to curl up after hitting extreme pessimism over the past few weeks.
Premium Note: Rebound pattern:
The S&P 500 rallied more than -17% after one of the most epic 5 week crashes in market history. Can the rally be sustained?
|
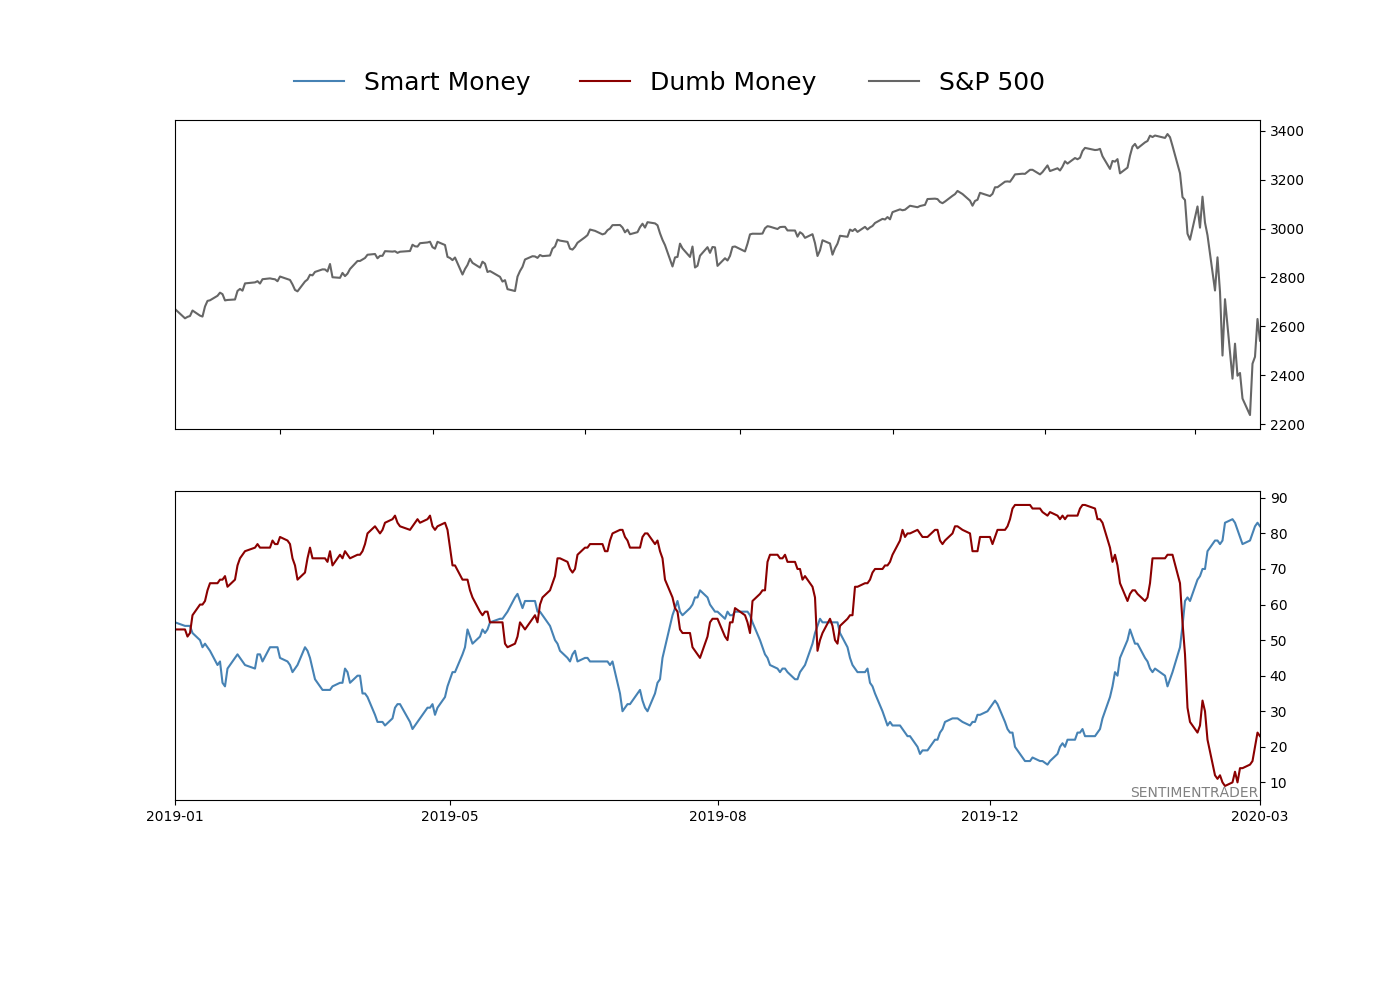
Smart / Dumb Money Confidence
|
Smart Money Confidence: 82%
Dumb Money Confidence: 23%
|
|
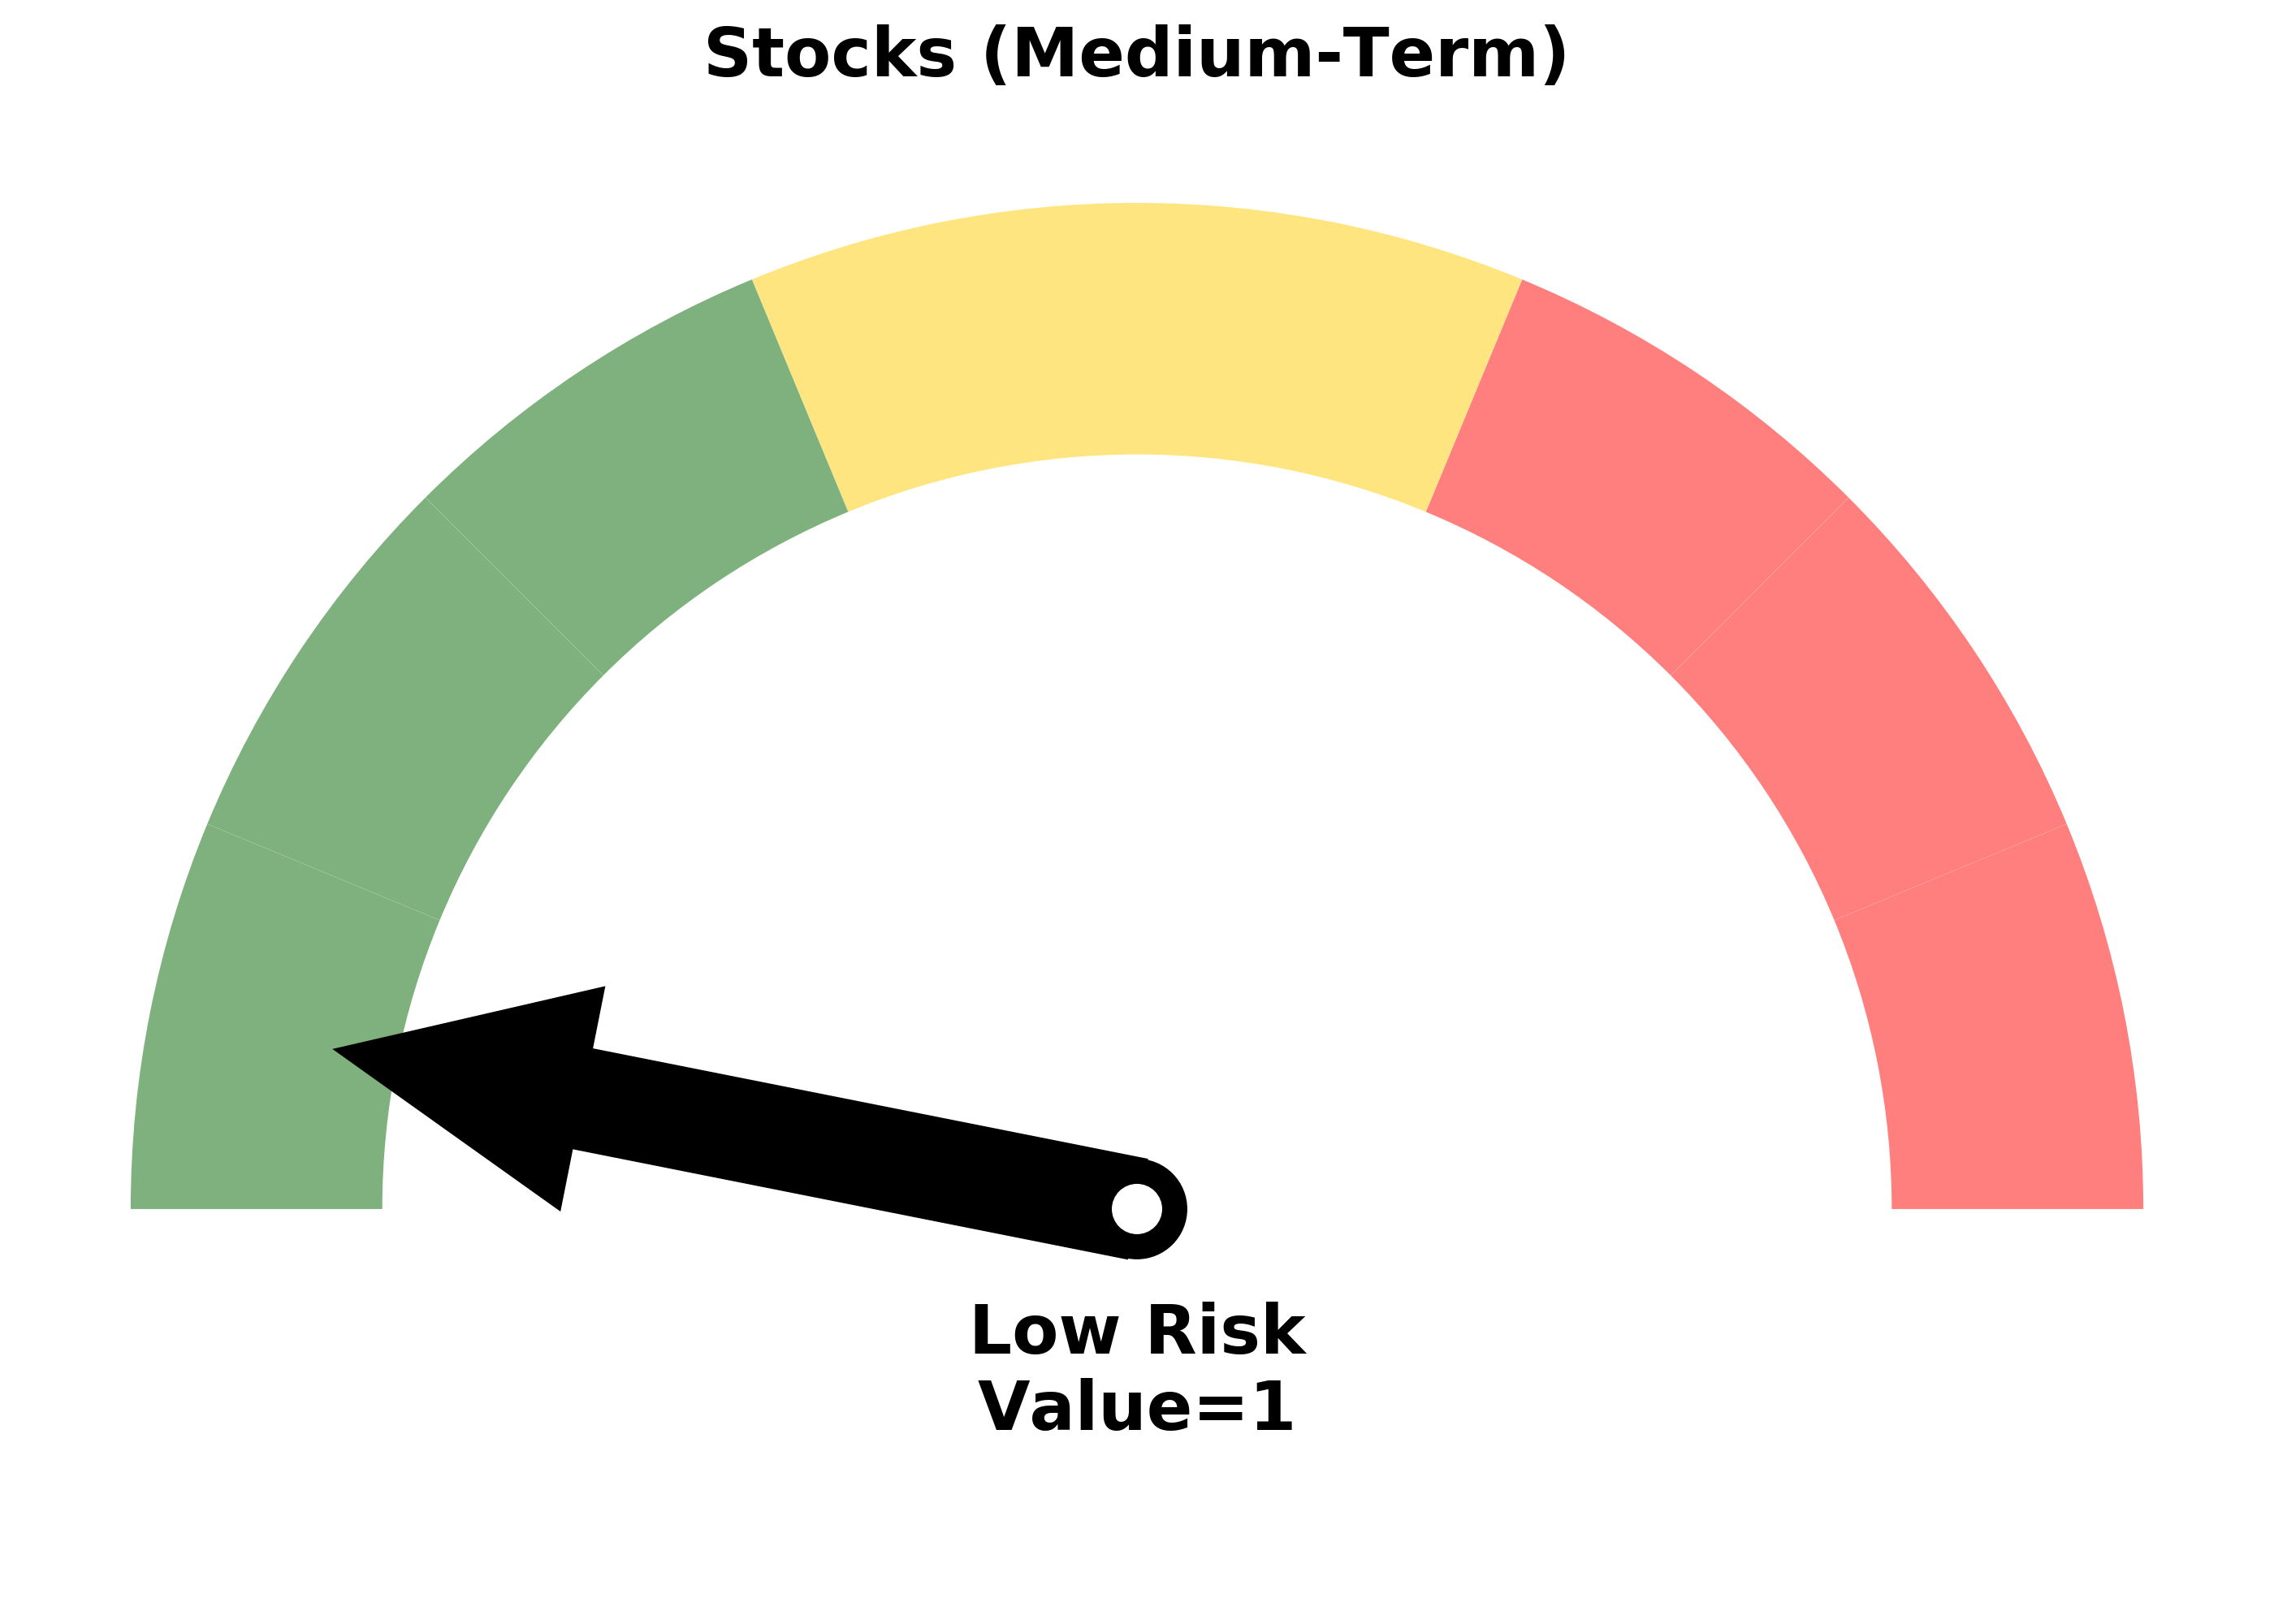
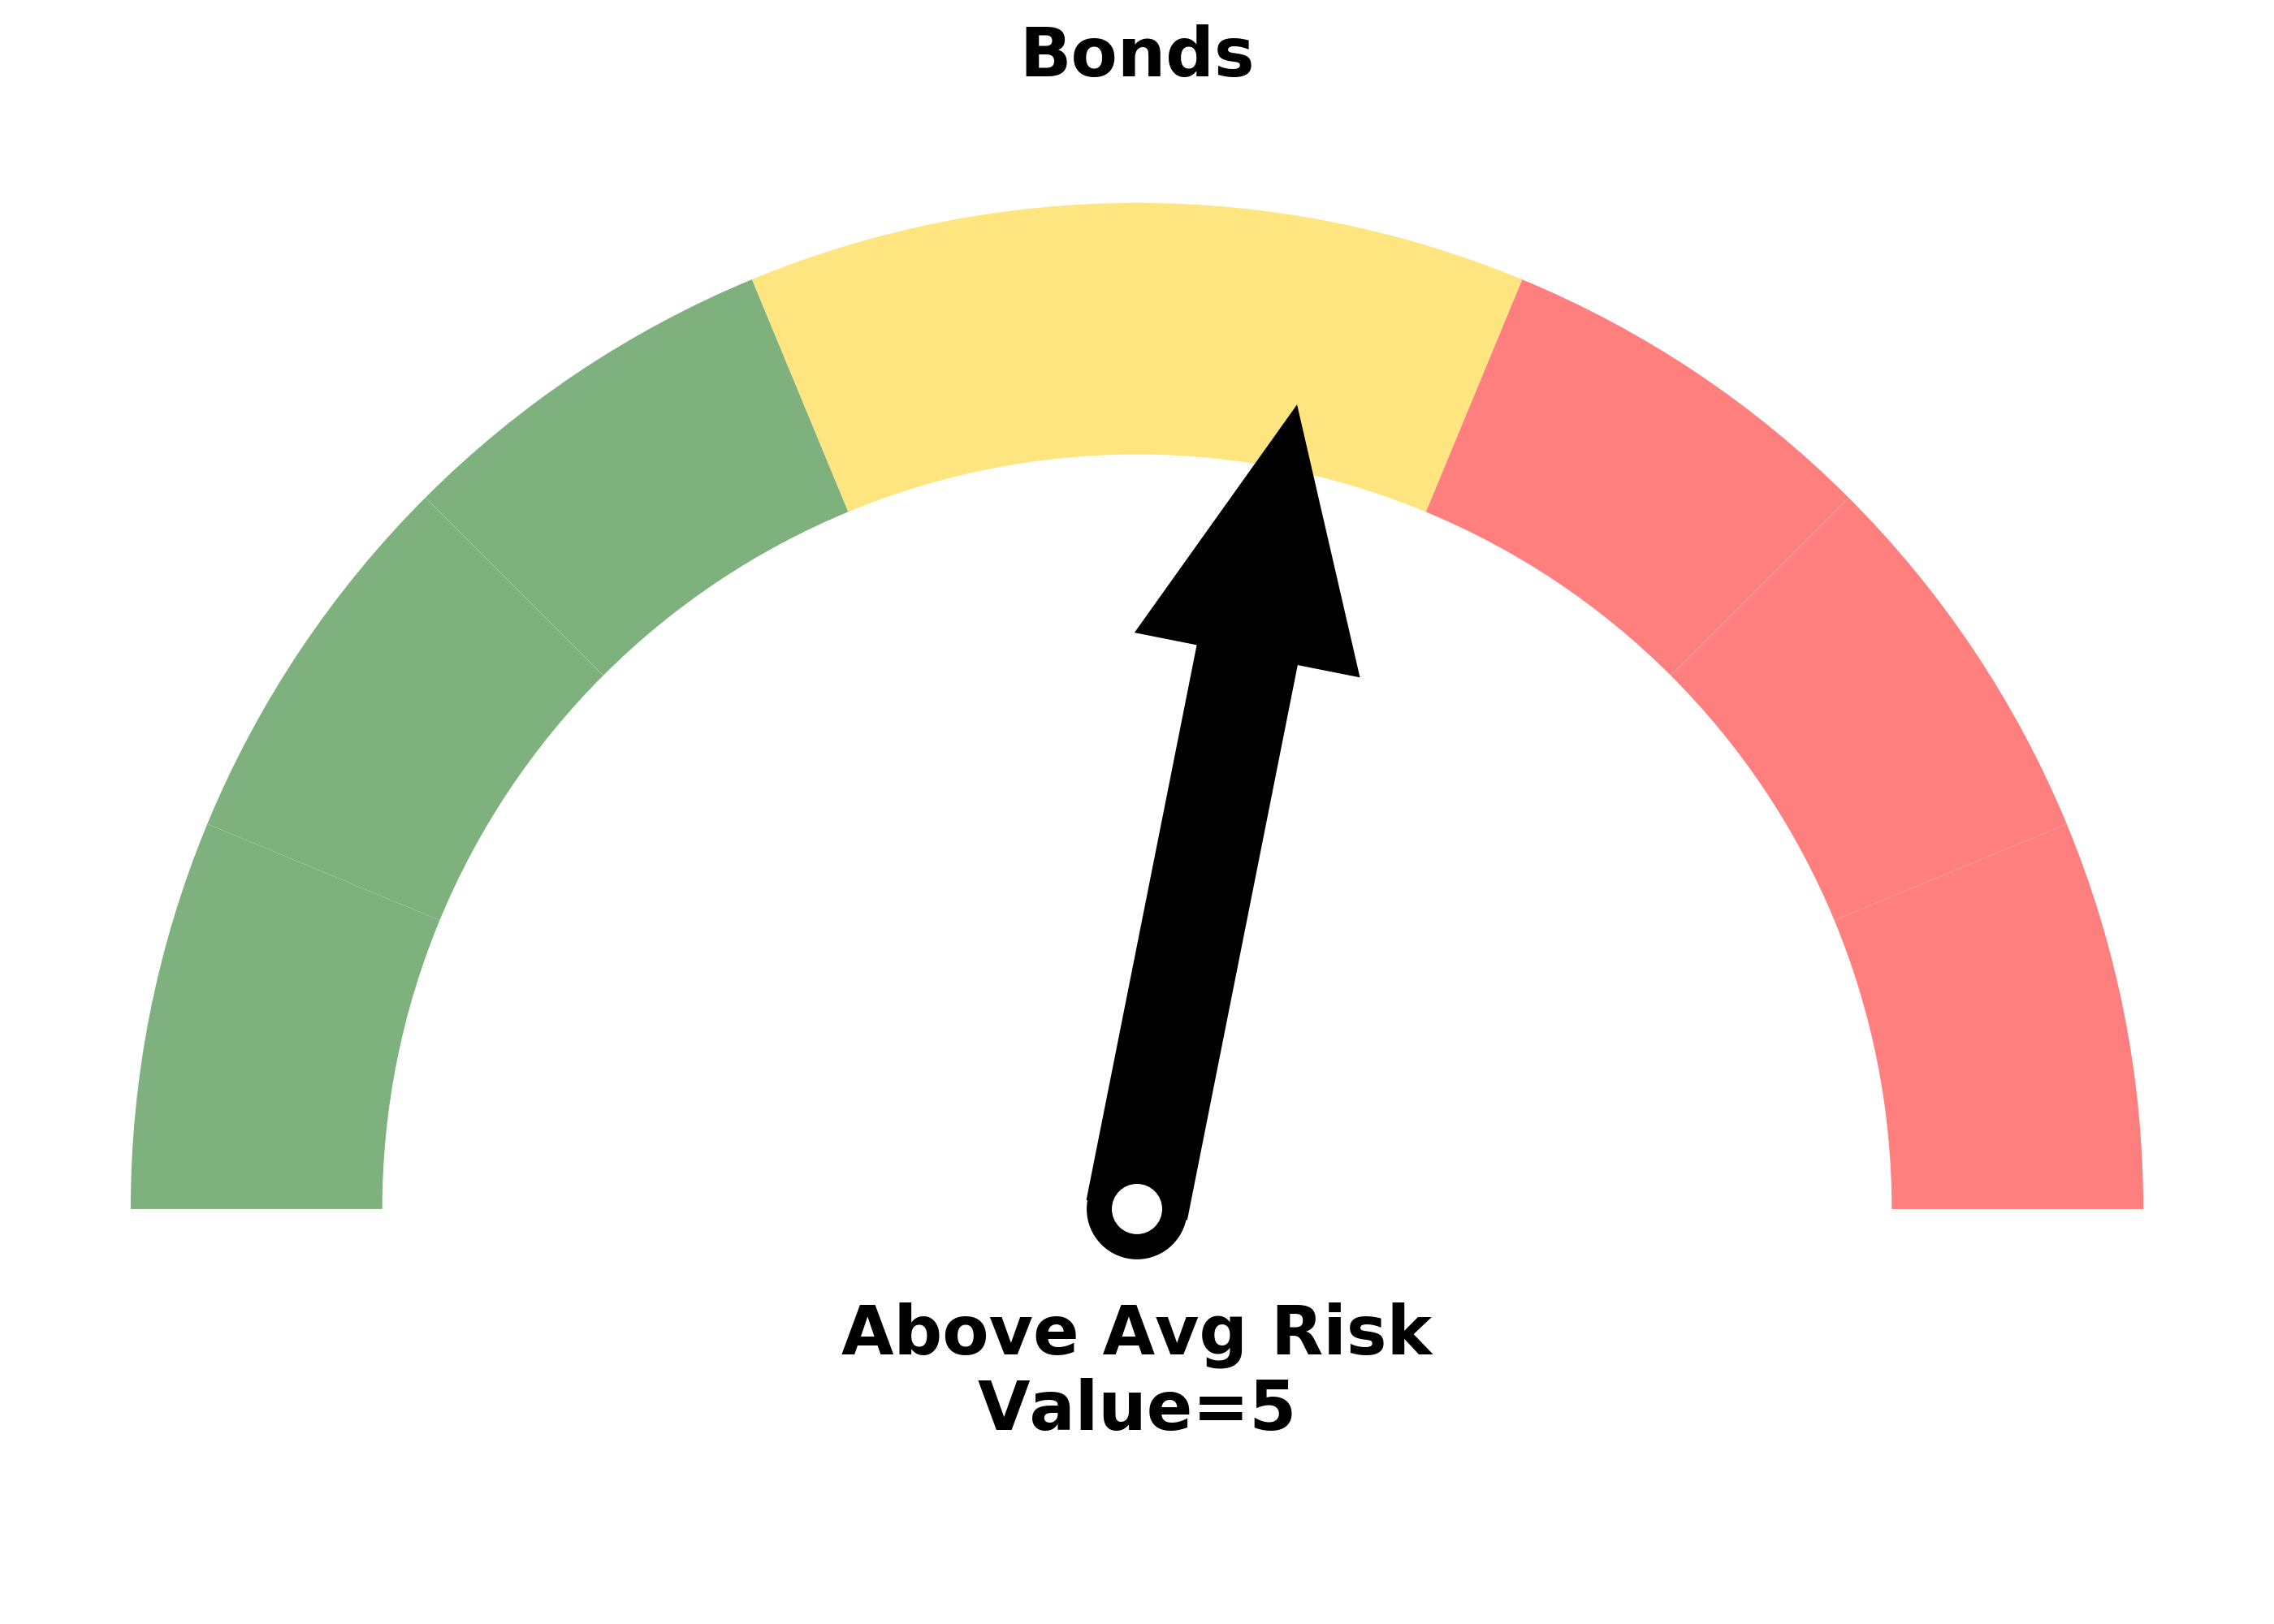
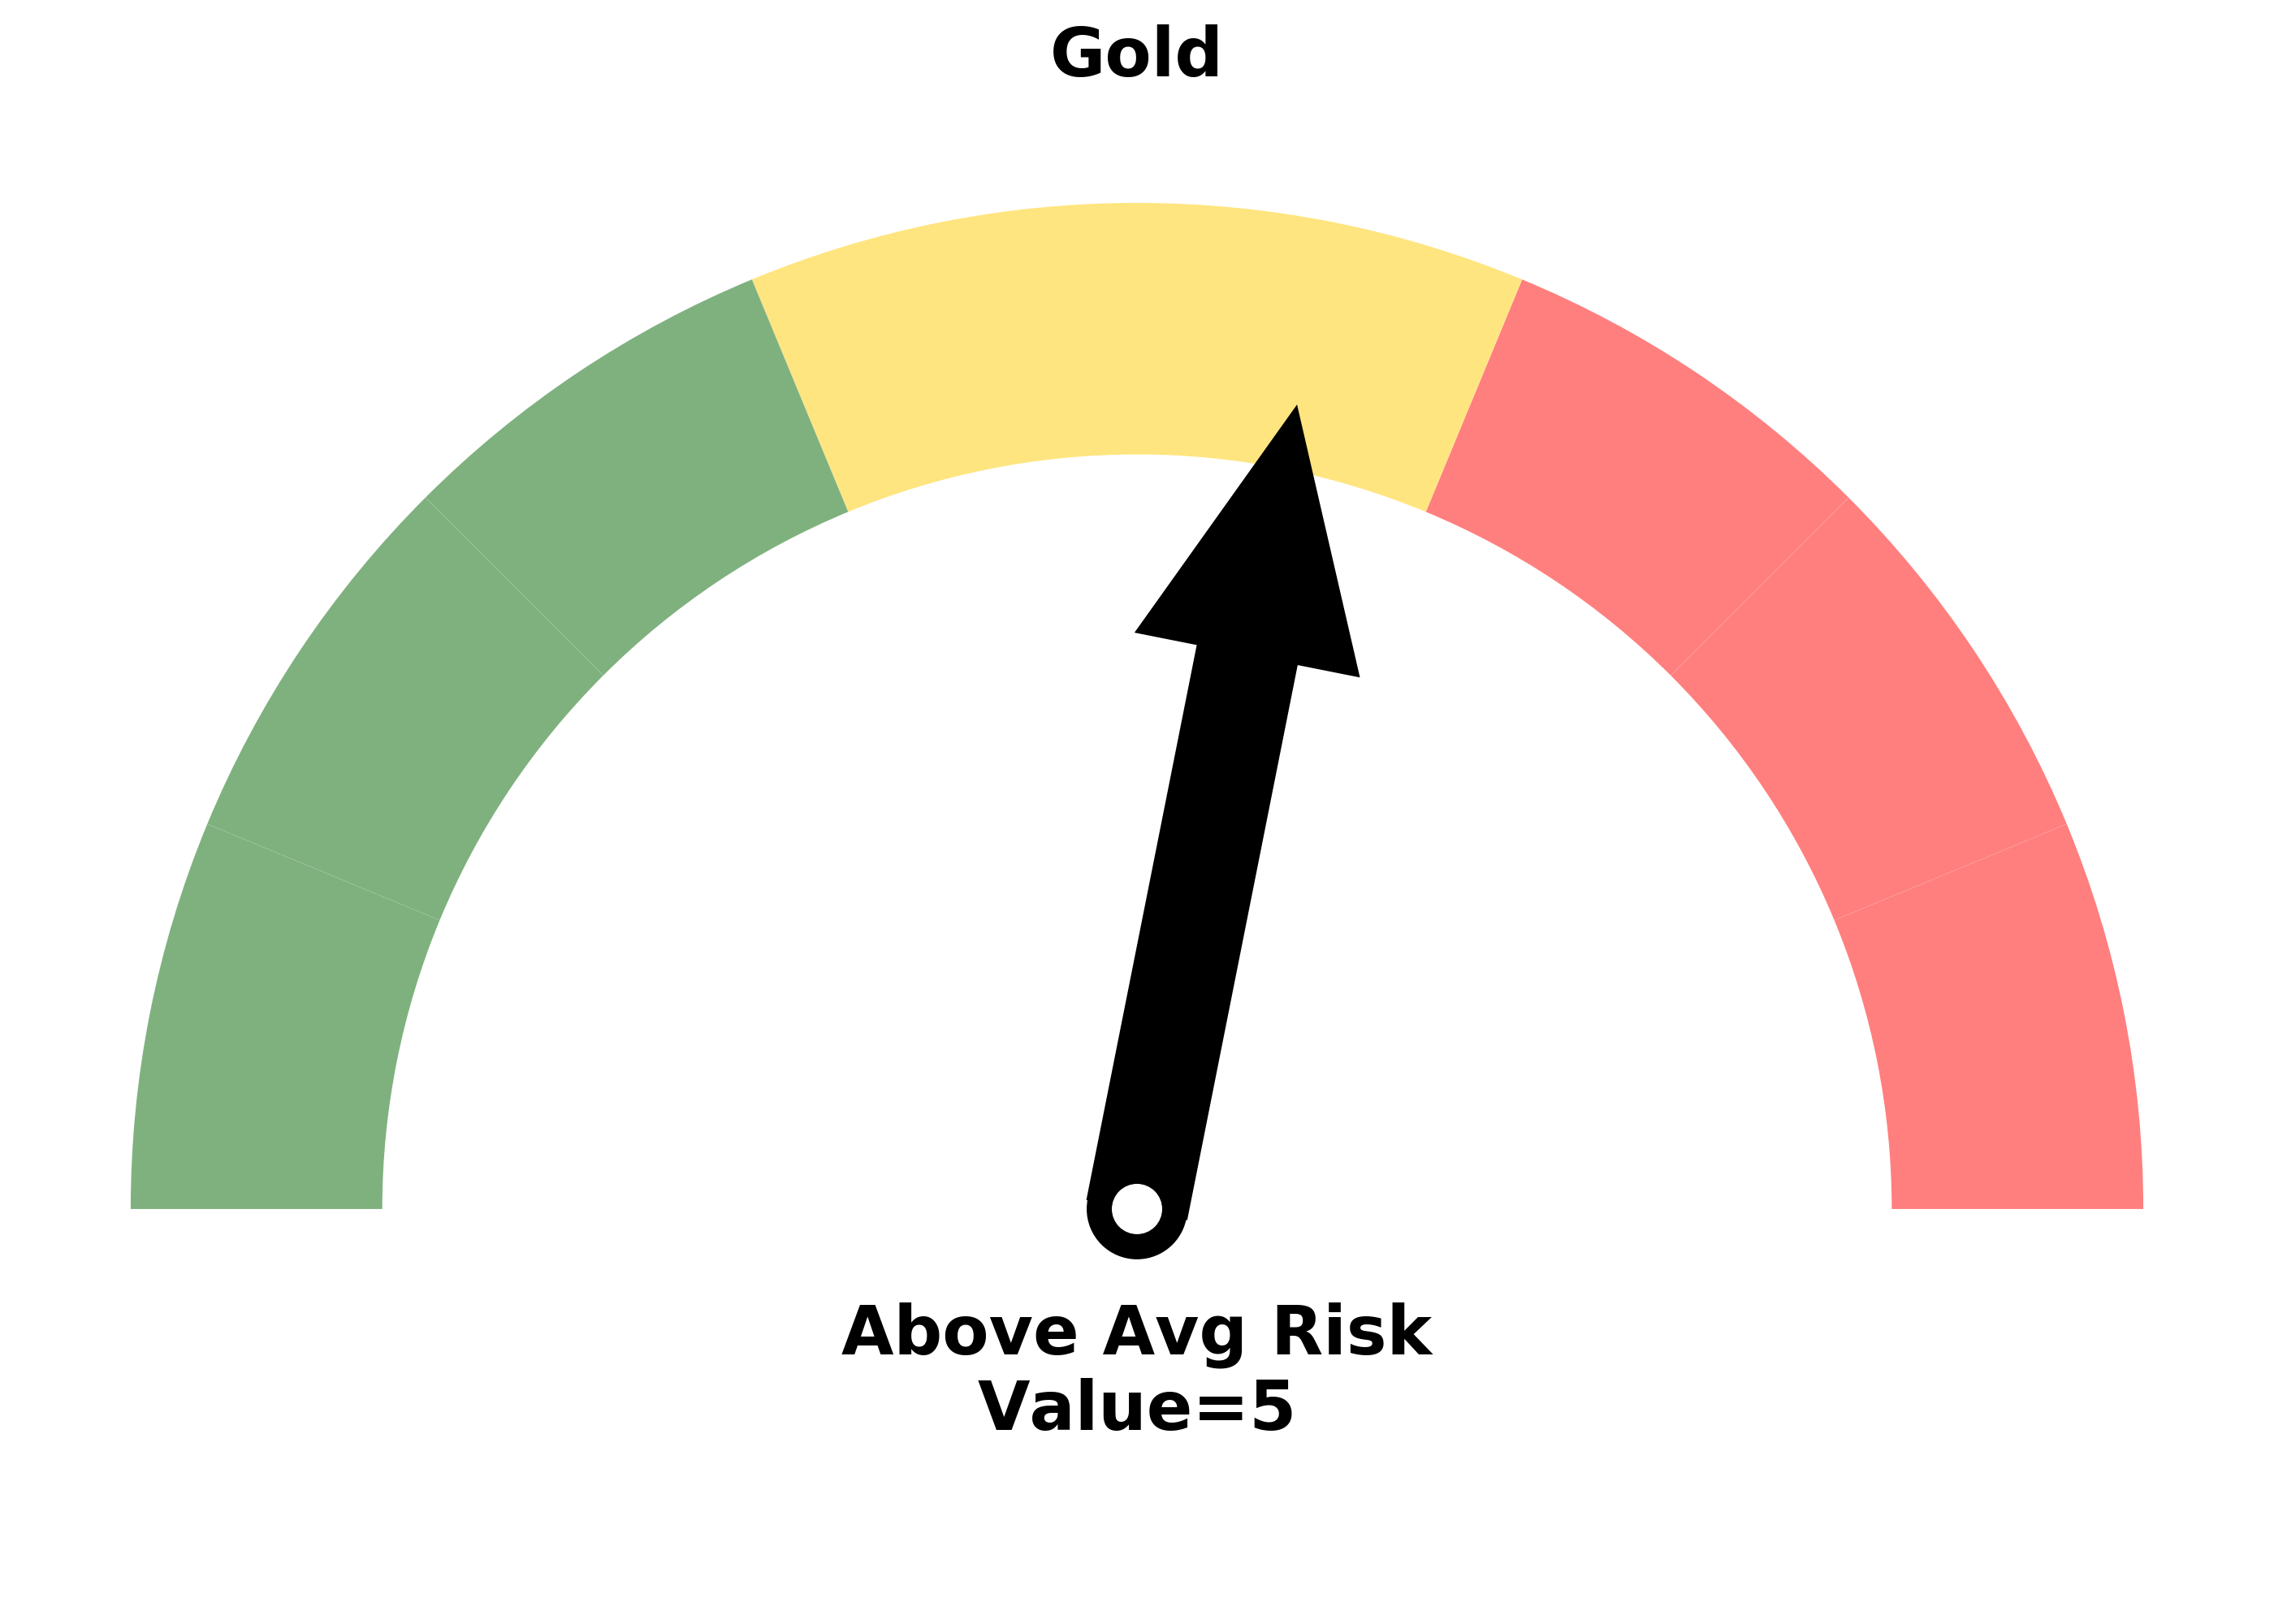
Risk Levels
Research
BOTTOM LINE
The S&P 500 enjoyed a large weekly reversal from a low, one of the largest in 20 years. There was also a near record number of selling climaxes among stocks in the index.
FORECAST / TIMEFRAME
SPY -- Up, Medium-Term
|
Even after a late selloff again on Friday, stocks enjoyed a large positive reversal for the week, bringing some relief after weeks of torment.
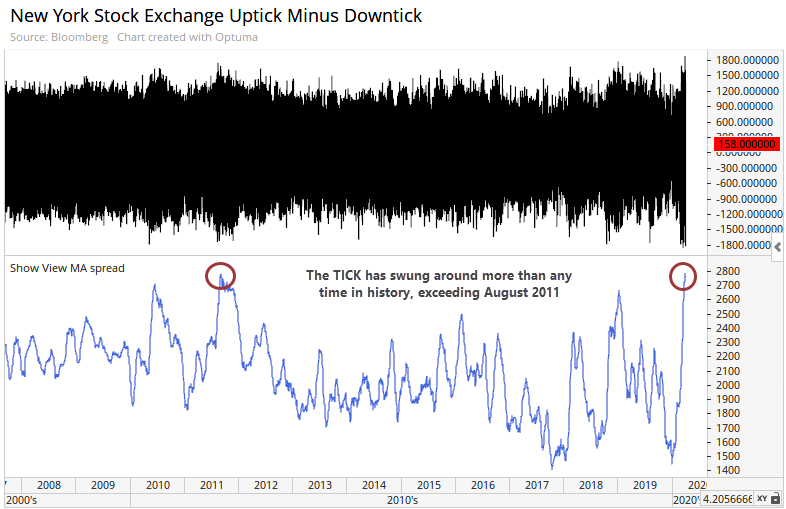
It's hard to read much into these super fast, giant moves that we've been seeing. It seems that the keywords "fed" and "reduce" triggered the computers to hit their sell buttons all at the same time before the close, especially since it's Friday. So much of the activity over the past few weeks appears to be driven by algorithms, with the spread between the intraday high and low of the TICK widening out to a record.
Even so, after hitting a 52-week low on Monday, and at least a 2.5% loss from the prior week, the S&P ended up closing with a large gain. This would qualify as a key reversal week according to some methodologies.
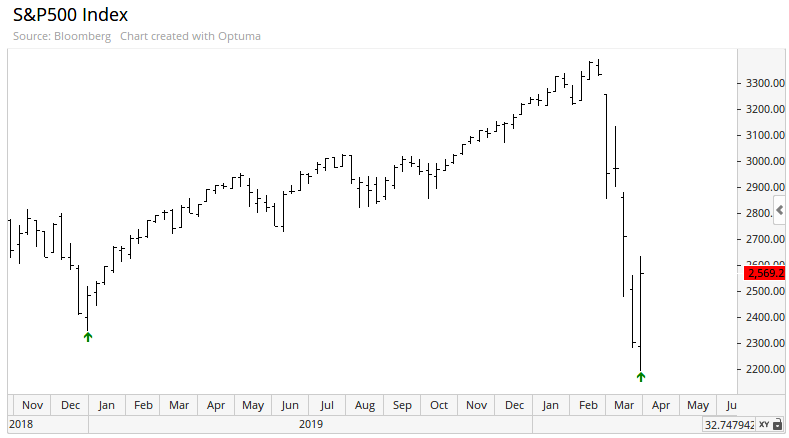
Similar weeks look good, at least on a chart.
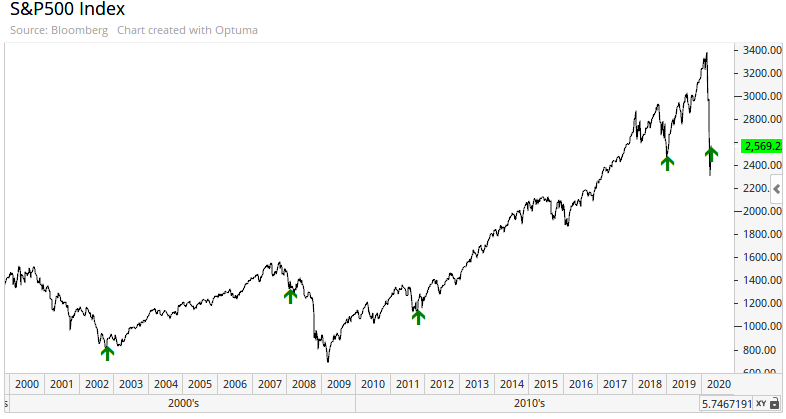
Below, we can see every week with the same parameters since 1928.
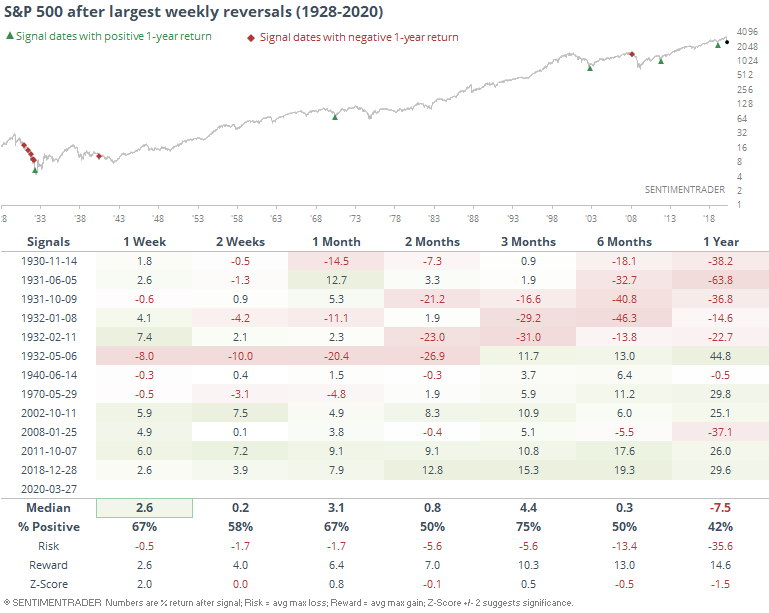
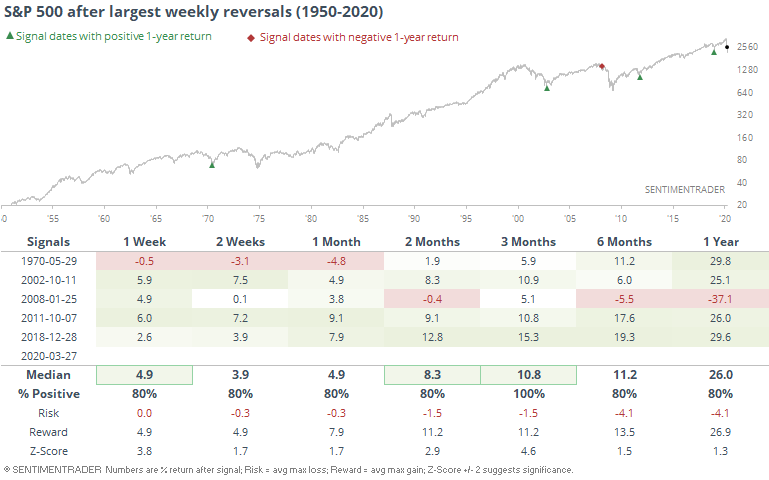
It happened quite a few times in the 1930s and if we want to assume we're in a similar environment, then those are entirely appropriate. For those making the assumption that modern markets are more of a comparison, then returns since 1950 are much better.
It's not just the index that has made a quick about-face during the week. Preliminary data shows that more than 230 stocks within the index will show a Selling Climax which would challenge the record from December 2018.
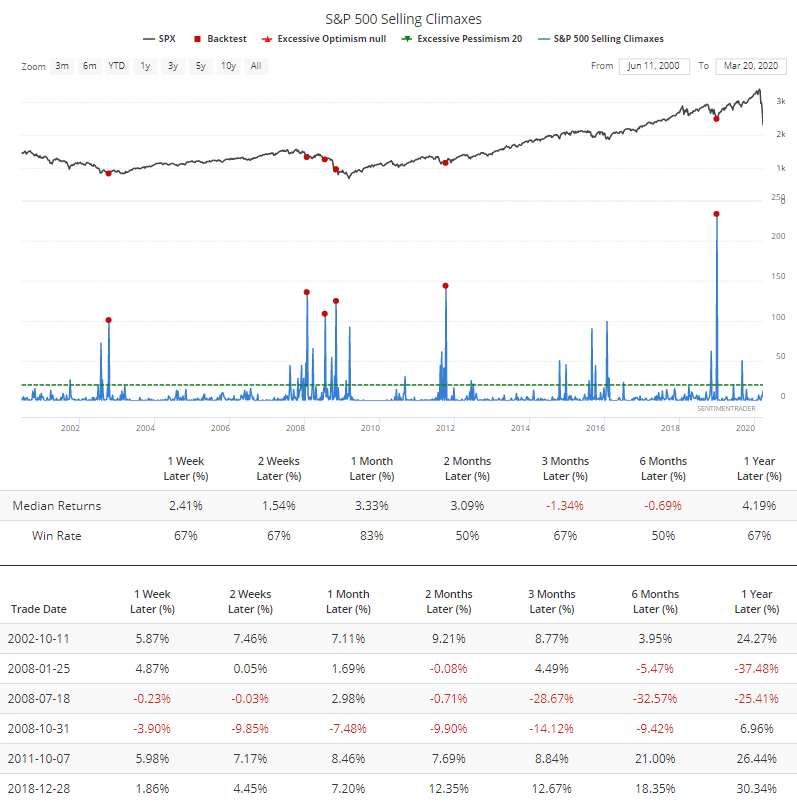
More than 100 selling climaxes in a week has been a good sign for the next month or so, with late October 2008 being the only exception. Combined with the breadth surges, this is a good sign.
BOTTOM LINE
In the fall of 2018, the Bear Market Probability Model suggested an 80% chance of a bear market ahead, one of the highest readings since 1950. Based on the latest estimates, that could now plunge to below 40%.
FORECAST / TIMEFRAME
|
Back in the fall of 2018, we highlighted the dangerous condition of the Bear Market Probability Model. At the time, it suggested an 80% chance of a bear market ahead, one of the highest readings since 1950.
The model, outlined originally by Goldman Sachs, uses five fundamental inputs:
- U.S. Unemployment Rate
- ISM Manufacturing Index
- Yield Curve
- Inflation Rate
- P/E Ratio
Each month's reading is ranked versus all other historical readings and assigned a score. The higher the score, the higher the probability of a bear market in the months ahead.
We didn't enter a bear market after that high reading, even though stocks took a tumble over the next few months. But now that we have crashed into a bear market, it's worth exploring what kinds of conditions the model will now reflect.
Based on the latest estimates, it could plunge to below 40%.
Below, we can see every month since 1950 when the model fell below 40% for the first time in at least a year.
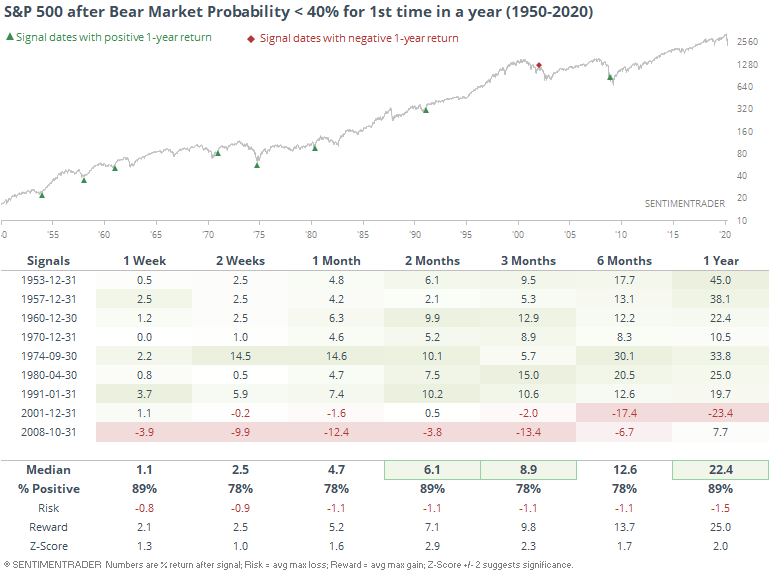
We don't know if this will happen, since many economic reports are in flux, and likely will be in the weeks ahead. And while it preceded excellent returns in prior decades, the last two signals were awfully early, so our confidence level in positive returns going forward is diminished.
One of the bigger drivers of the model is the unemployment rate, and if that climbs into the double-digits, which the St. Louis Fed thinks could be probable, then the model will almost certainly drop below 40%. Anything above 8% unemployment will push the model to an extreme. While it certainly means something in terms of human suffering, for the model's purposes, it doesn't matter much if that rate climbs to 10% or 30%. It just depends on how fast the numbers reflect current reality.
Should the rate jump, this model will plunge, and that has been a mostly positive sign for forward returns.
Active Studies
| Time Frame | Bullish | Bearish | | Short-Term | 0 | 2 | | Medium-Term | 16 | 14 | | Long-Term | 31 | 3 |
|
Indicators at Extremes
Portfolio
| Position | Weight % | Added / Reduced | Date | | Stocks | 73.2 | Added 31.3% | 2020-03-17 | | Bonds | 0.0 | Reduced 6.7% | 2020-02-28 | | Commodities | 5.5 | Added 2.4%
| 2020-02-28 | | Precious Metals | 0.0 | Reduced 3.6% | 2020-02-28 | | Special Situations | 0.0 | Reduced 31.9% | 2020-03-17 | | Cash | 21.3 | | |
|
Updates (Changes made today are underlined)
In the first months of the year, we saw manic trading activity. From big jumps in specific stocks to historic highs in retail trading activity to record highs in household confidence to almost unbelievable confidence among options traders. All of that has come amid a market where the average stock can’t keep up with their indexes. There were signs of waning momentum in stocks underlying the major averages, which started triggering technical warning signs in late January. The kinds of extremes we saw in December and January typically take months to wear away, but the type of selling we’ve seen over the past month has gone a long way toward getting there. When we place the kind of moves we’ve seen over the past two weeks into the context of coming off an all-time high, there has been a high probability of a multi-month rebound. The volatility we’ve seen lately is extremely compelling from a medium-term point of view. Virtually everything we’ve looked at suggests a strong probability of gains over the next several months, even within the context of a potential bear market, and even from what had been higher prices. With an increasing sense that government entities will finally do anything it takes, and signs of progress in isolating and testing for the virus, I added to my exposure. I’m still holding 20% cash and don’t see that changing much at this point. Energy stocks. That was atrocious. The worst move I’ve ever made in this account. I’ve taken some very large sectors bets in this account over the years, like oil & gas explorers in 2016 and gold miners in 2018, and there is always some shorter-term discomfort because the news flow is so horrid. I don’t mind that in the least. But I do mind when stocks don’t do what they should. It didn’t help going large on these stocks right before what could be considered a true Black Swan, but so it goes. I’m more concerned that there has been no reaction since then and they continue to underperform despite…well, everything. They very well could rebound in the months ahead, but at this point I feel I have zero edge and don’t know what’s going on there, so I rotated out of that sector and into a general broad-market fund.
RETURN YTD: -15.3% 2019: 12.6%, 2018: 0.6%, 2017: 3.8%, 2016: 17.1%, 2015: 9.2%, 2014: 14.5%, 2013: 2.2%, 2012: 10.8%, 2011: 16.5%, 2010: 15.3%, 2009: 23.9%, 2008: 16.2%, 2007: 7.8%
|
|
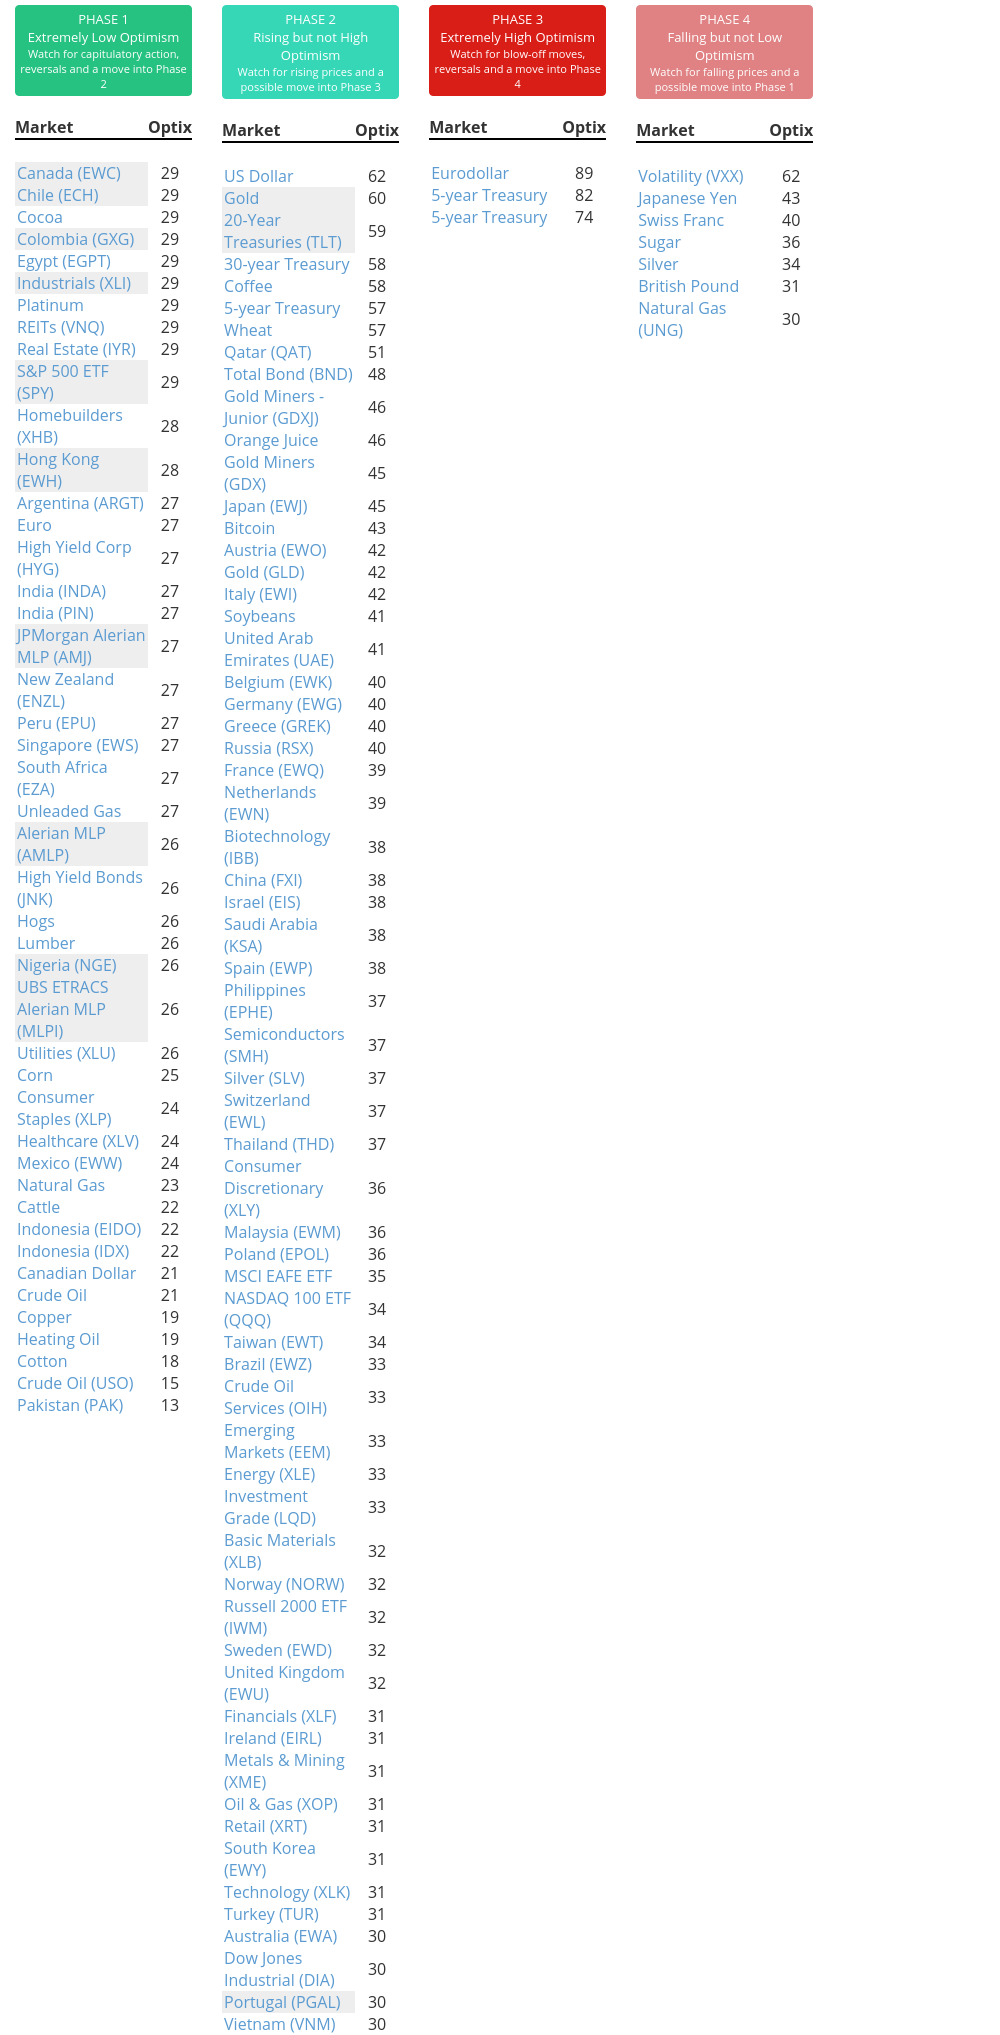
Phase Table
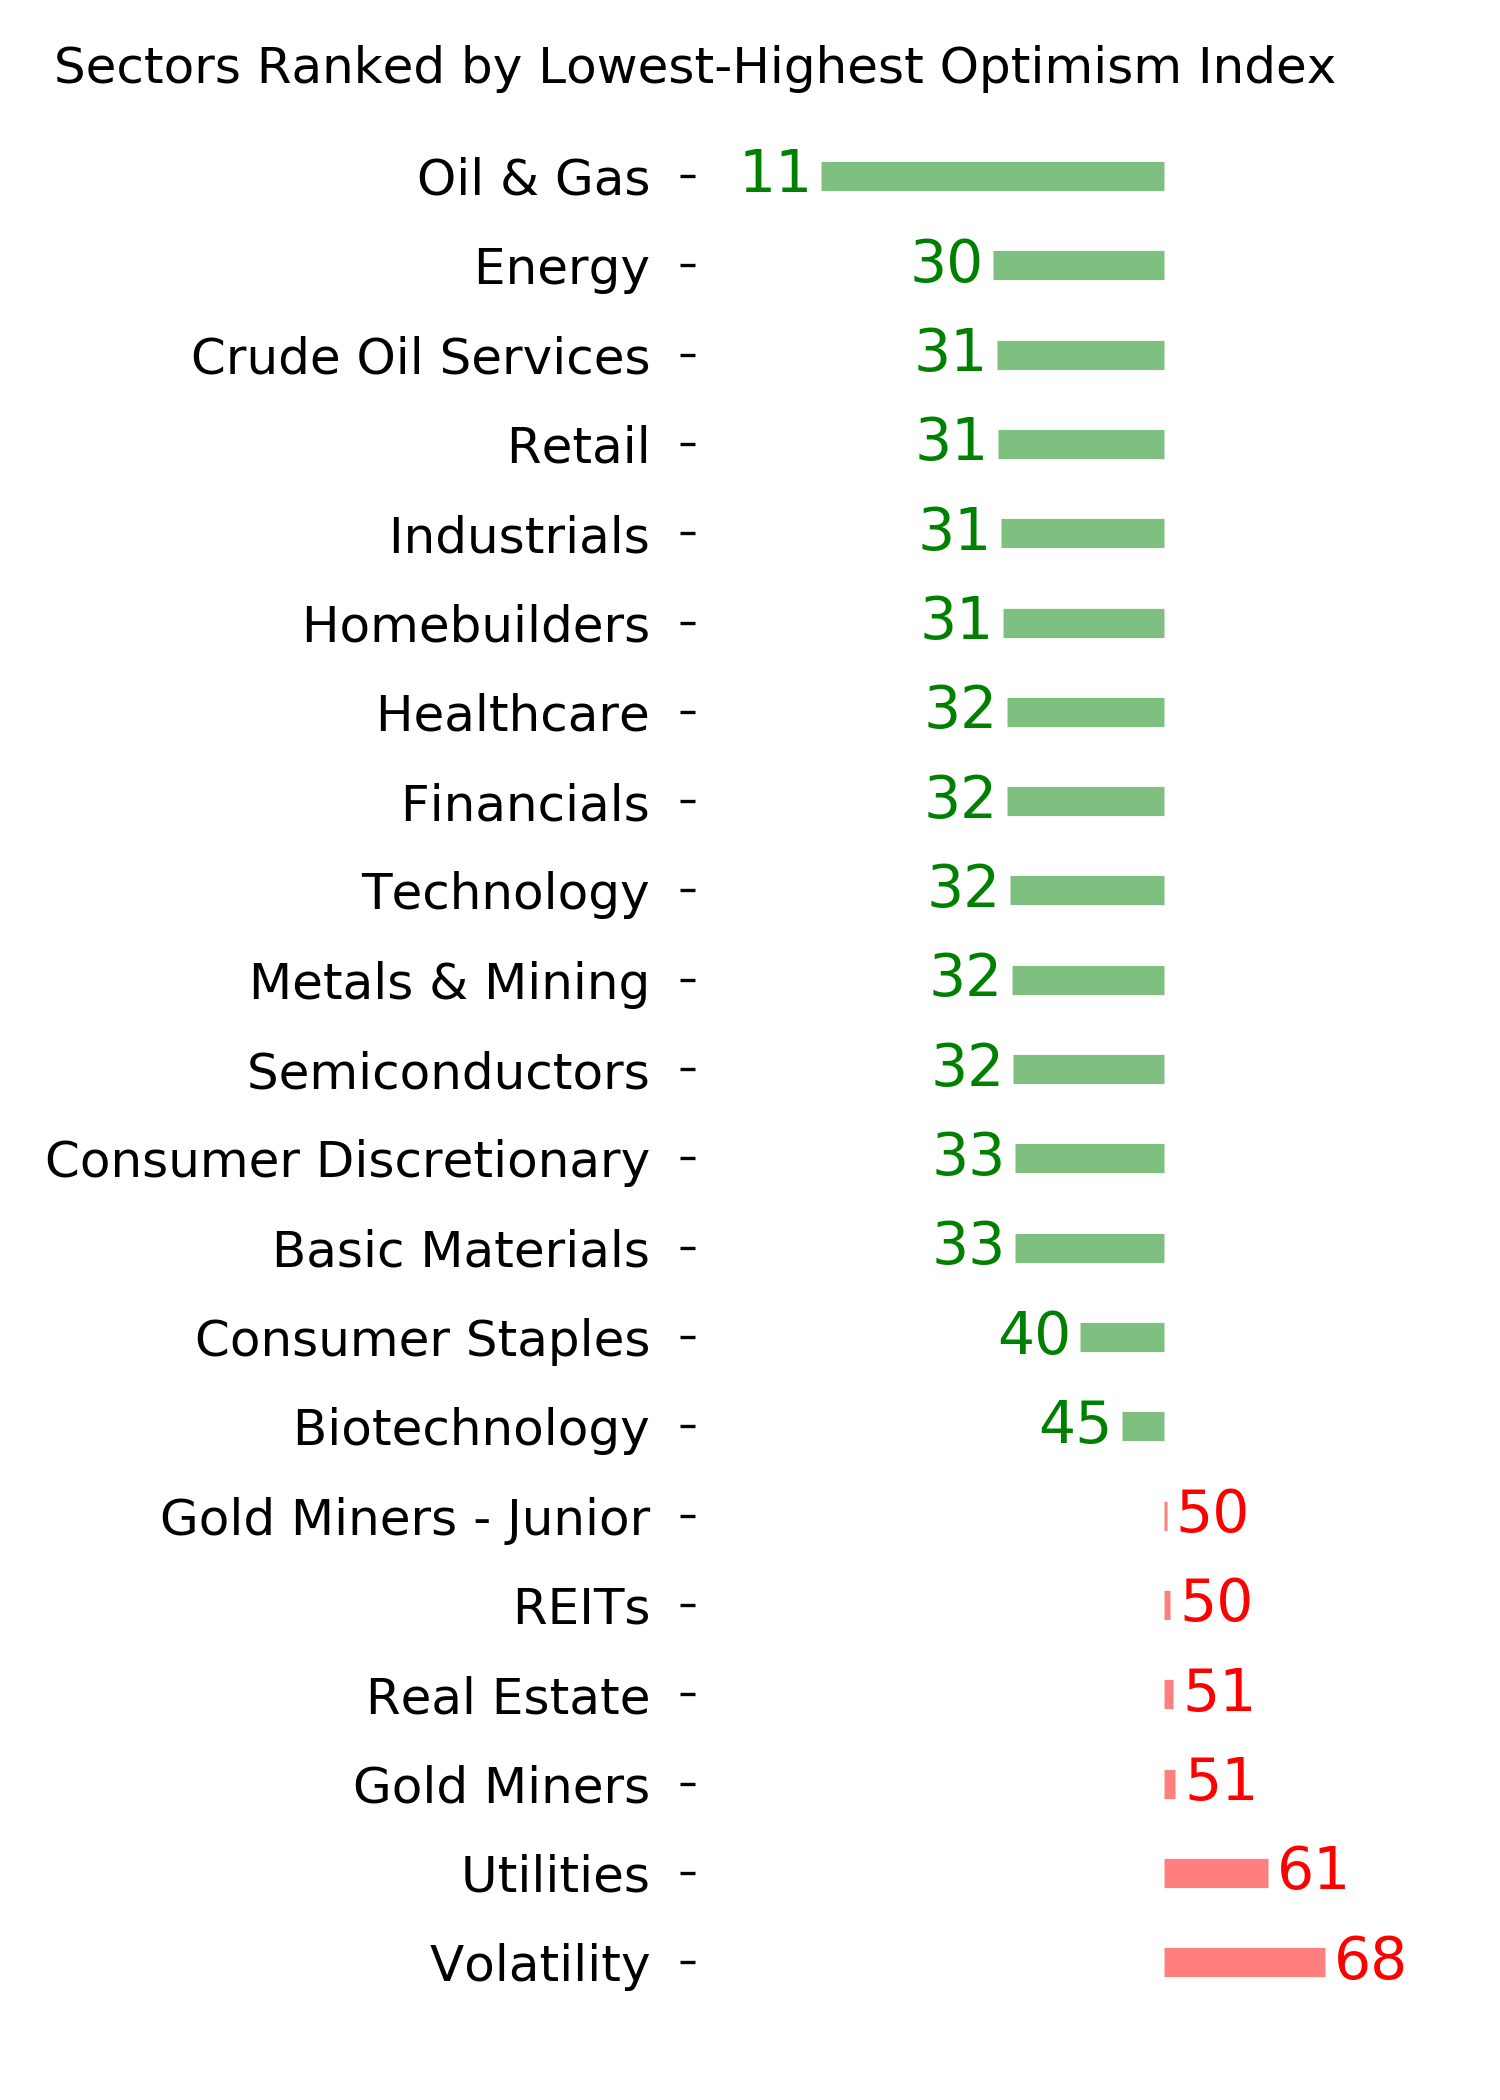
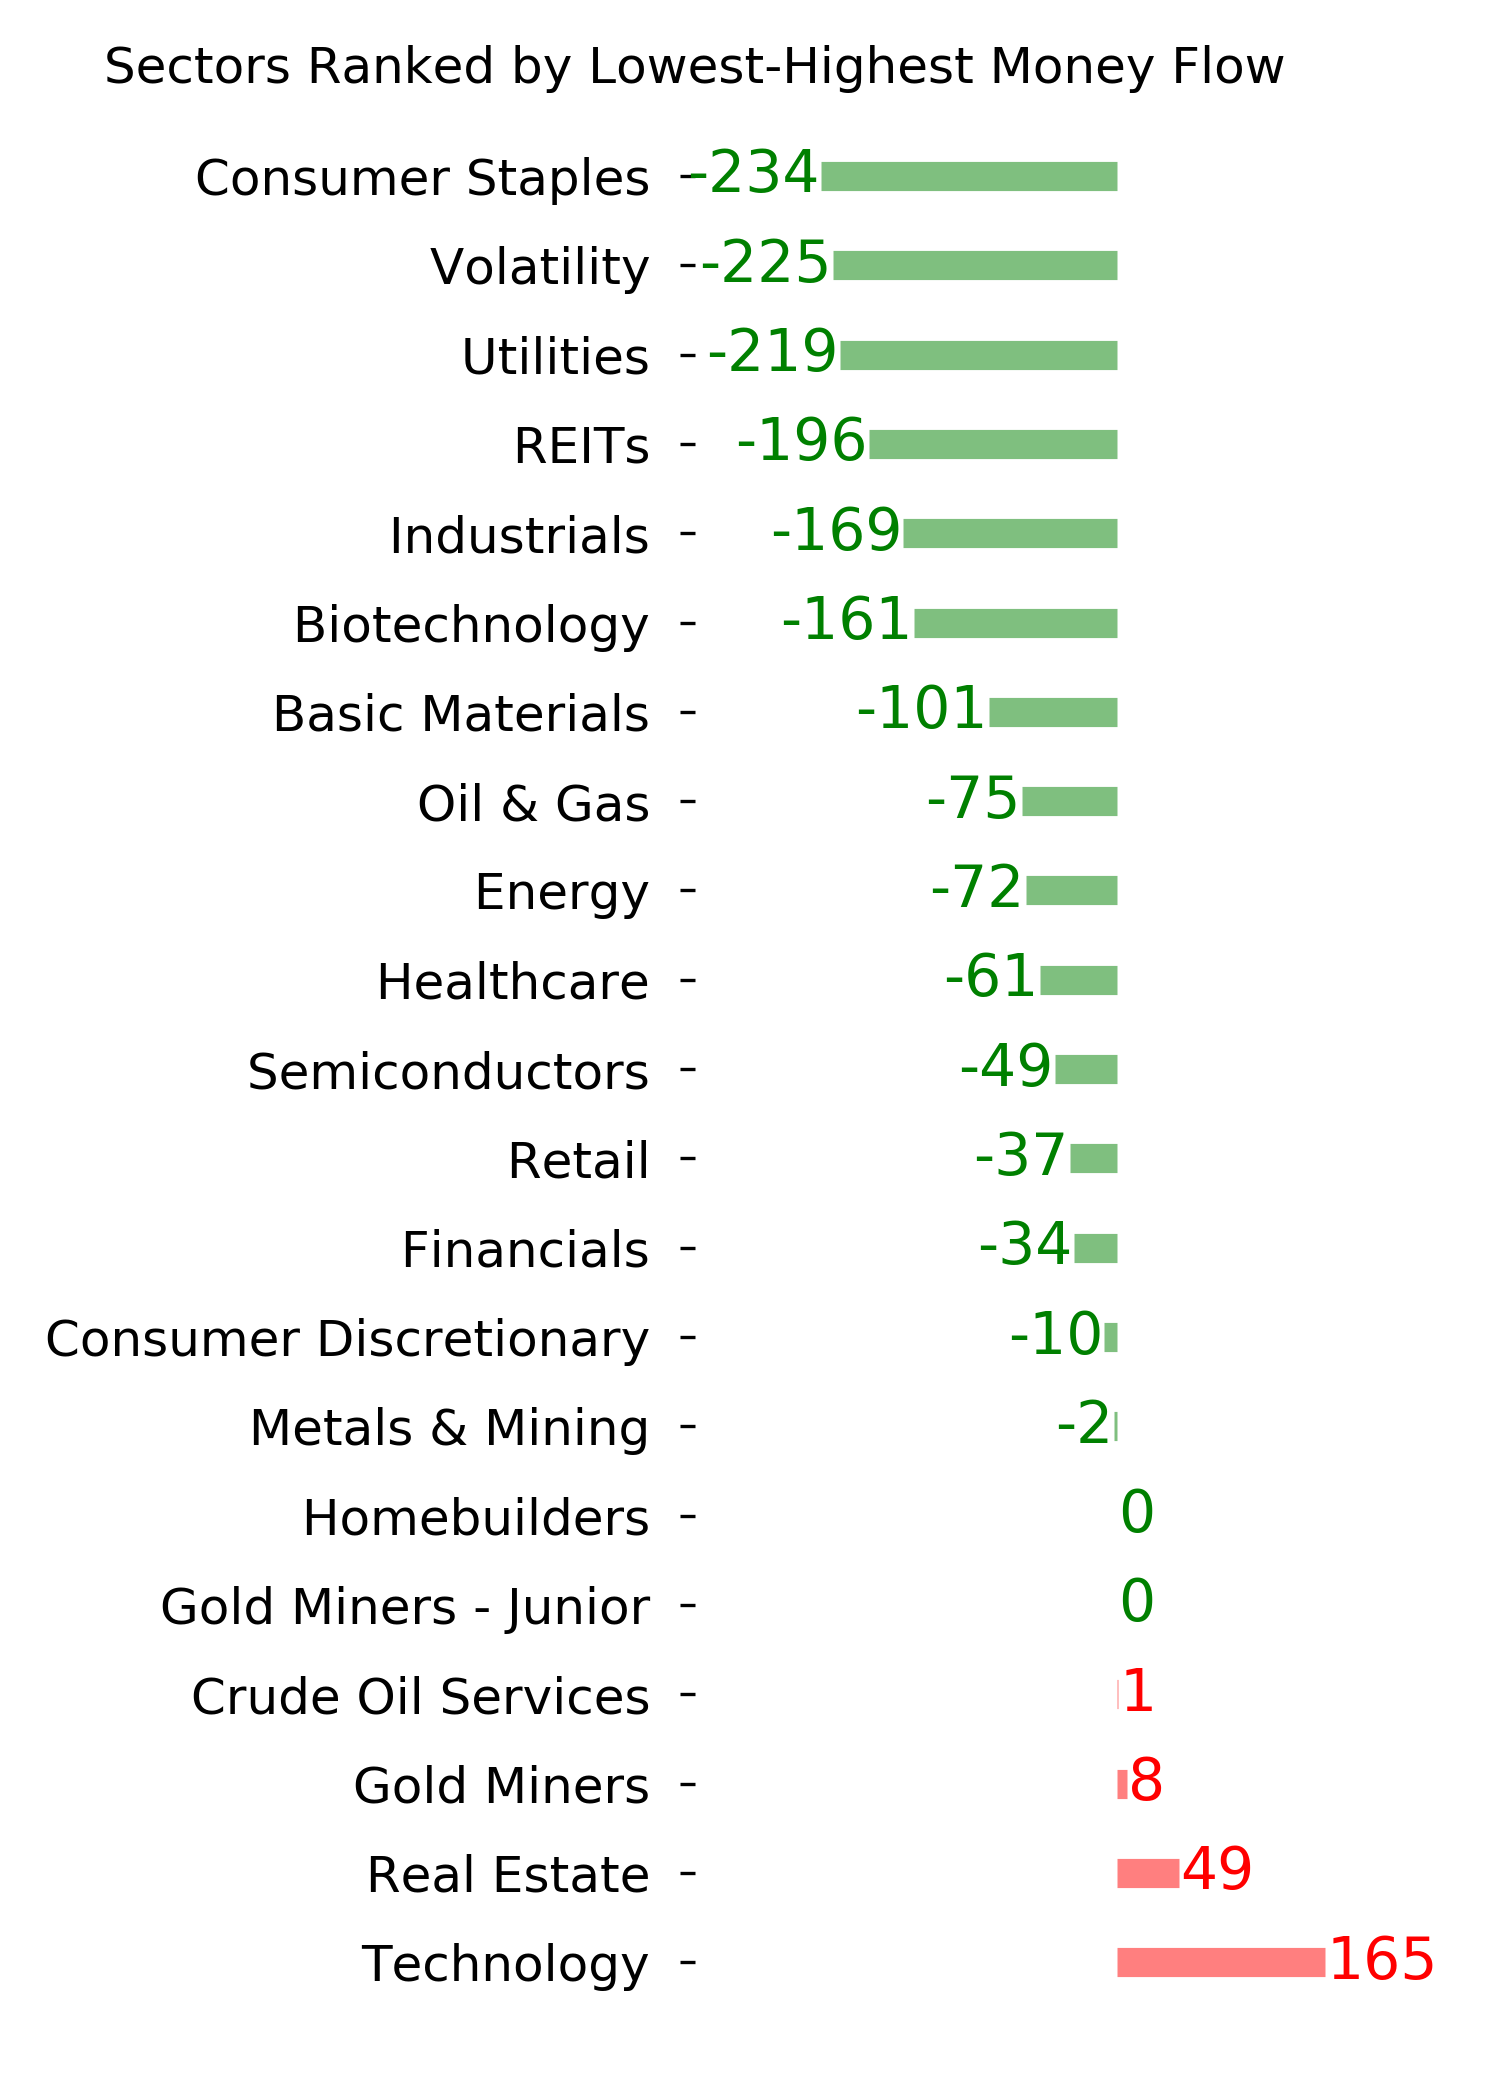
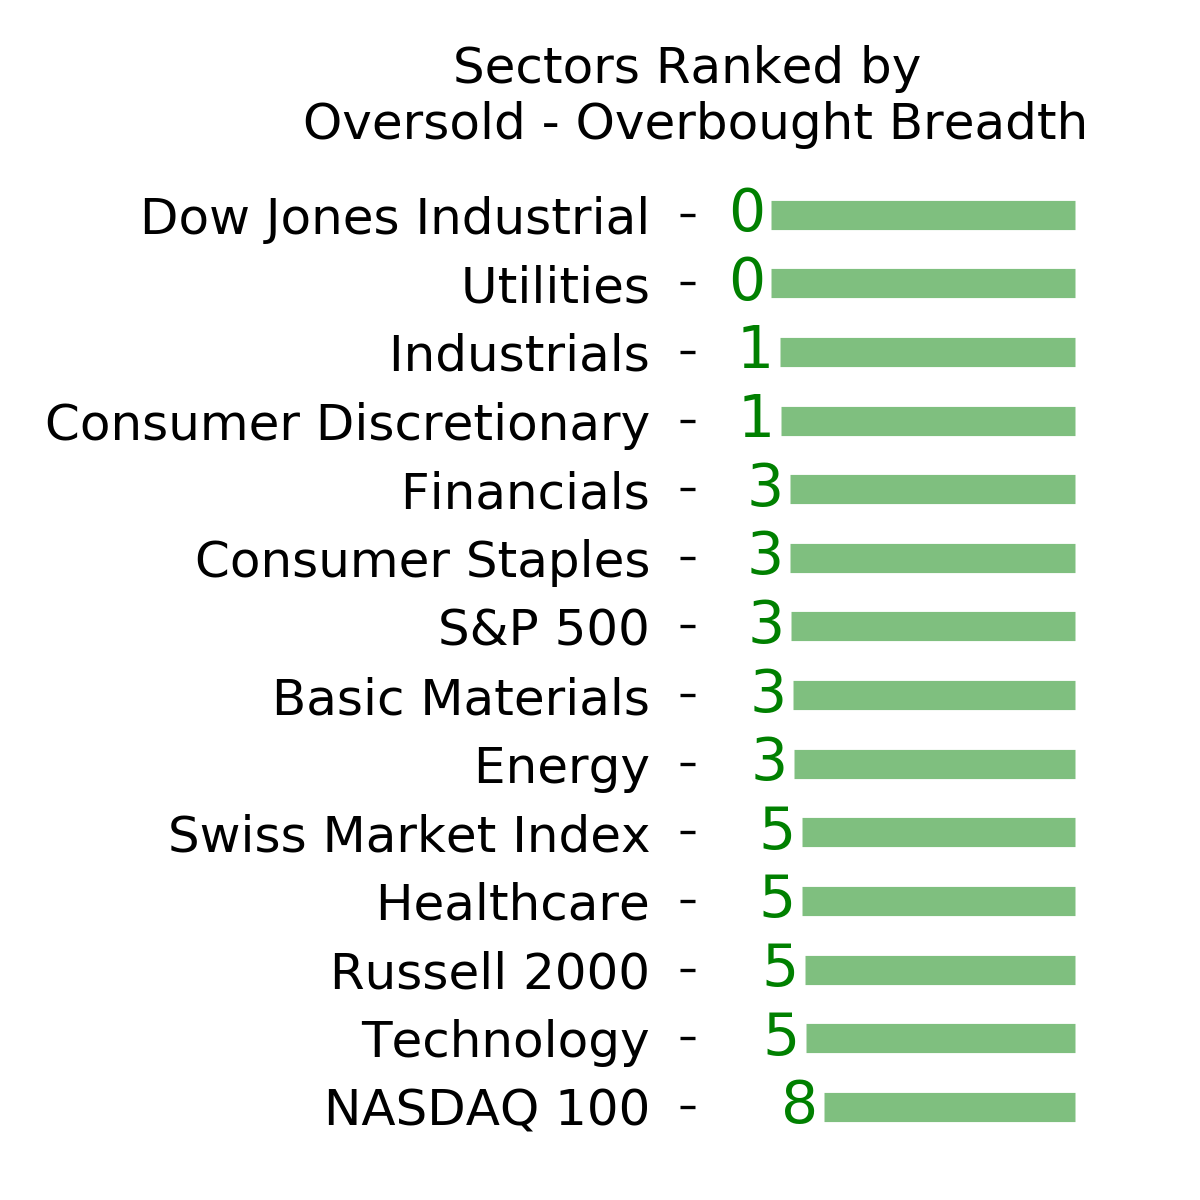
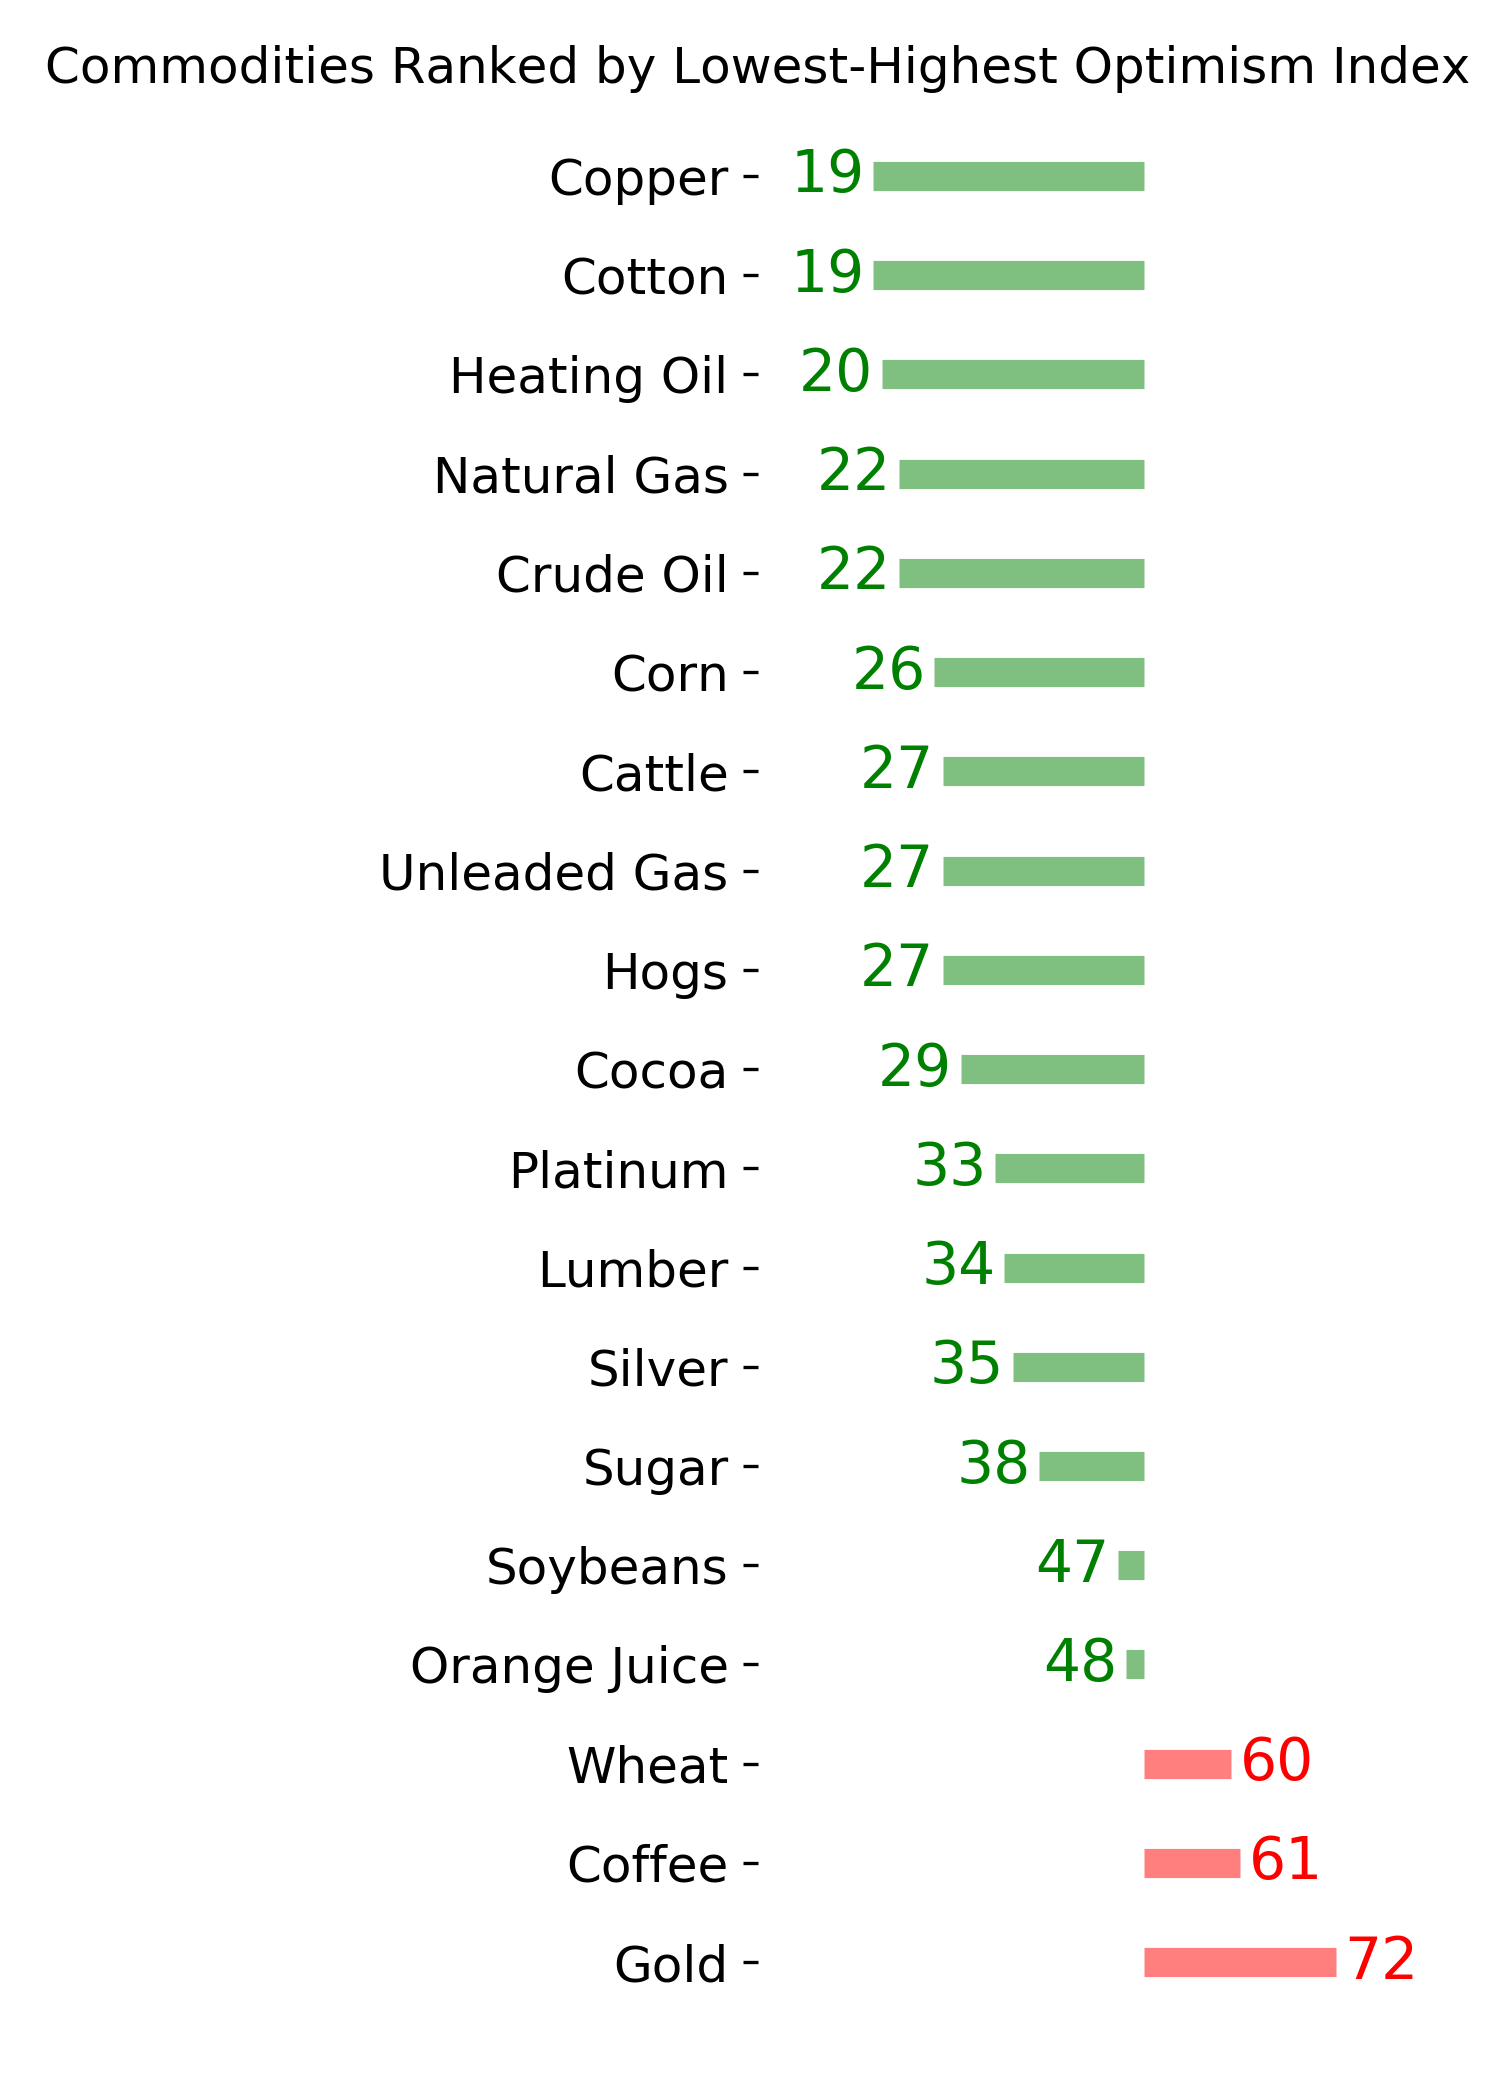
Ranks
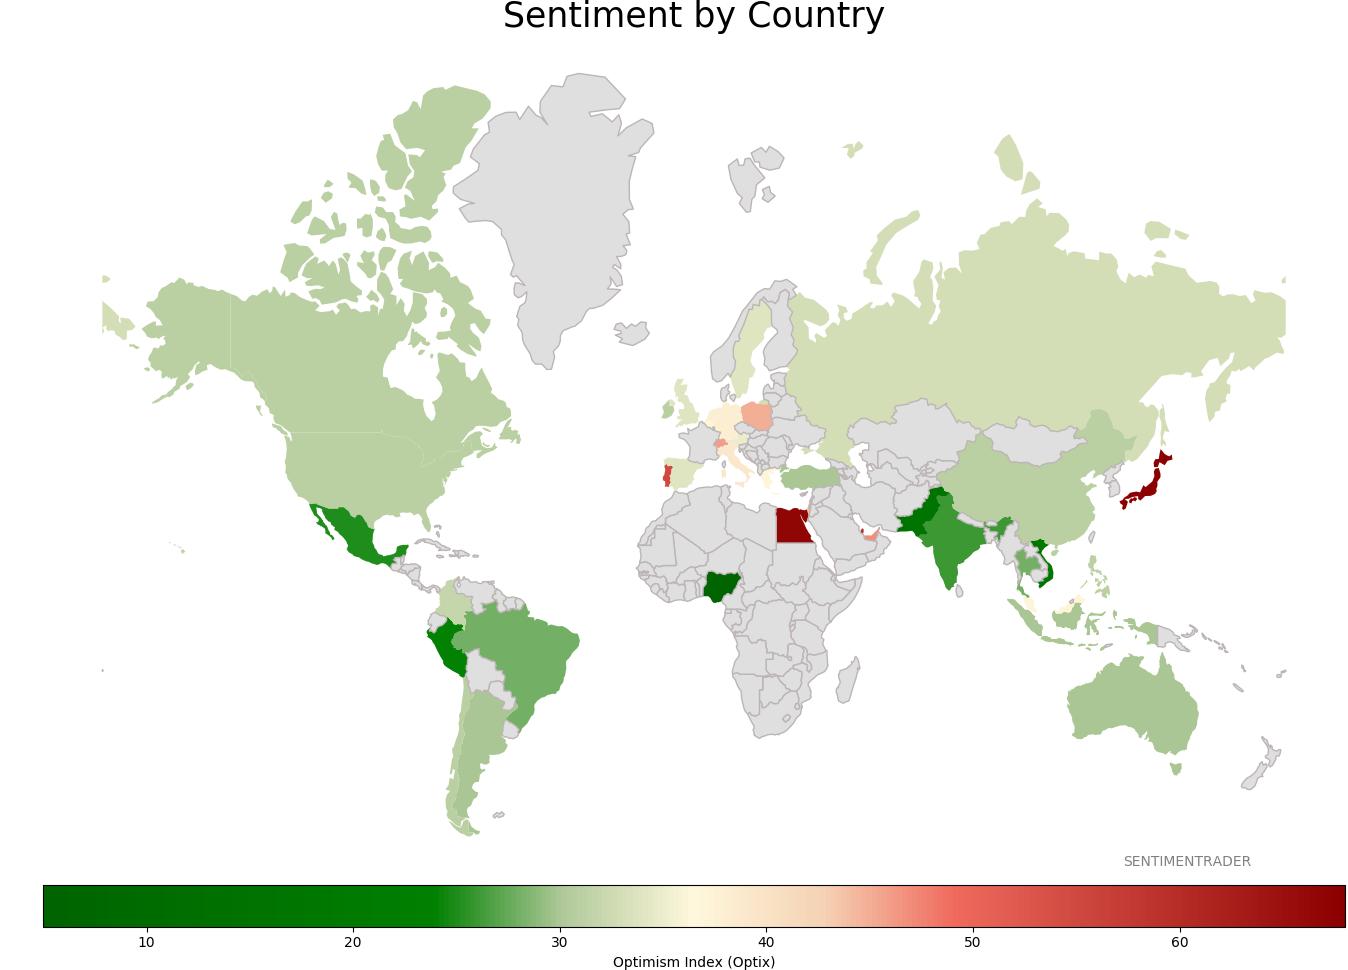
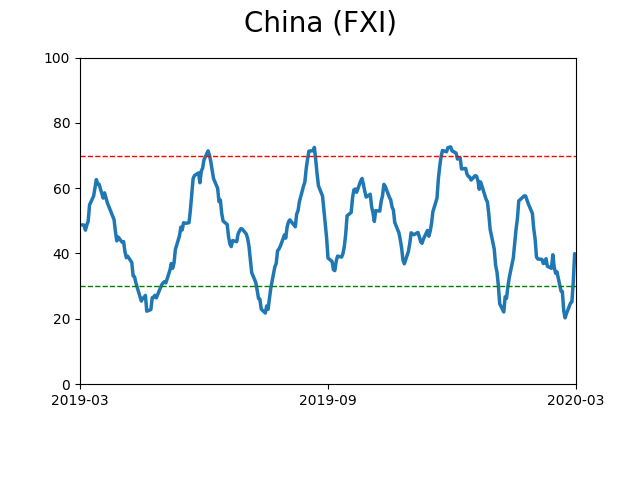
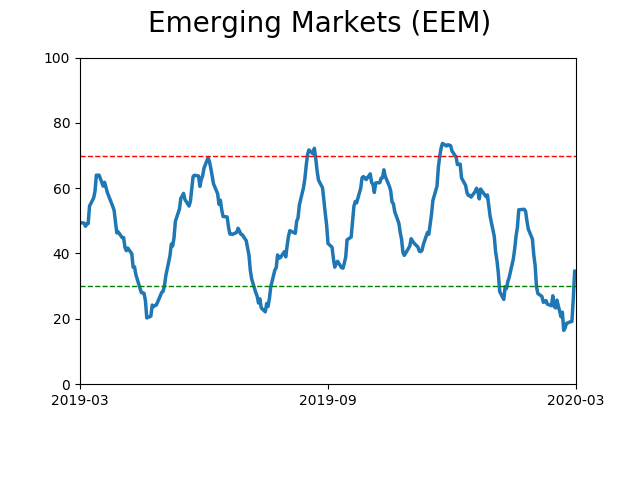
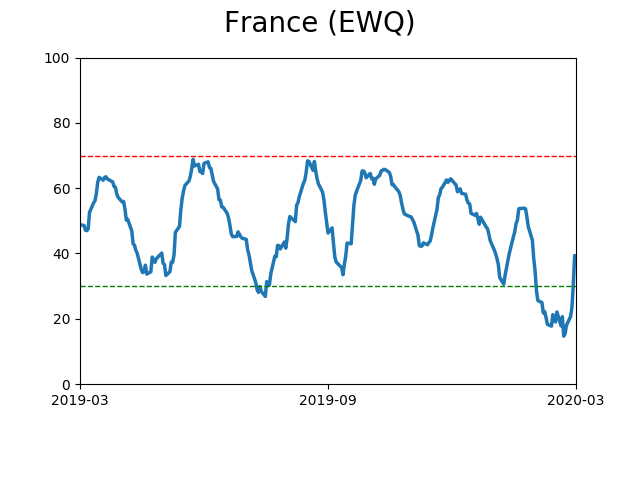
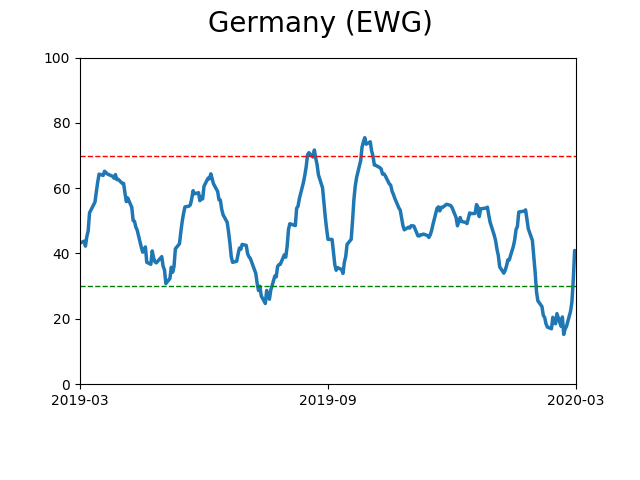
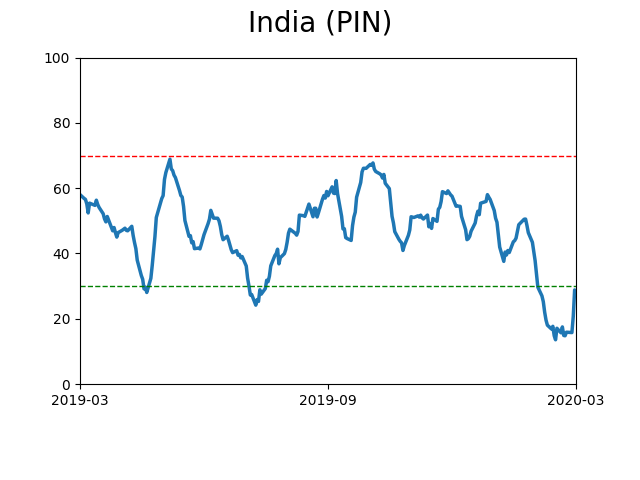
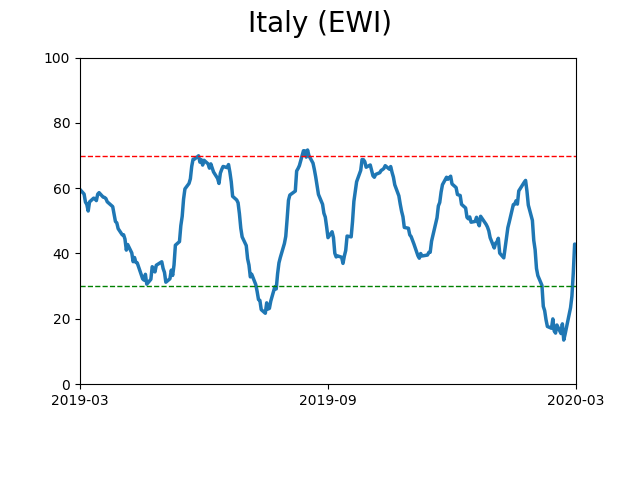
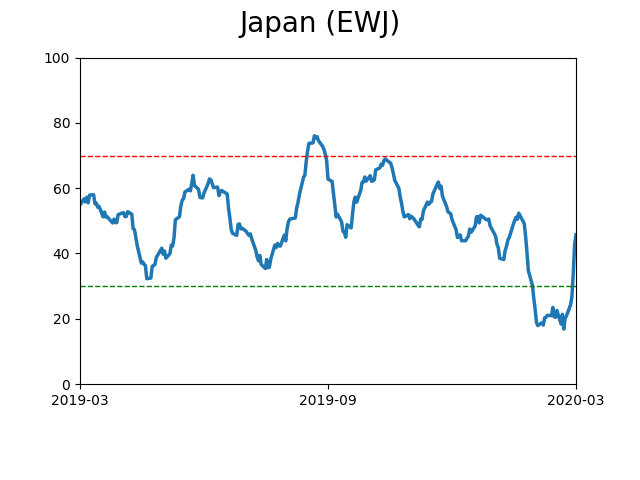
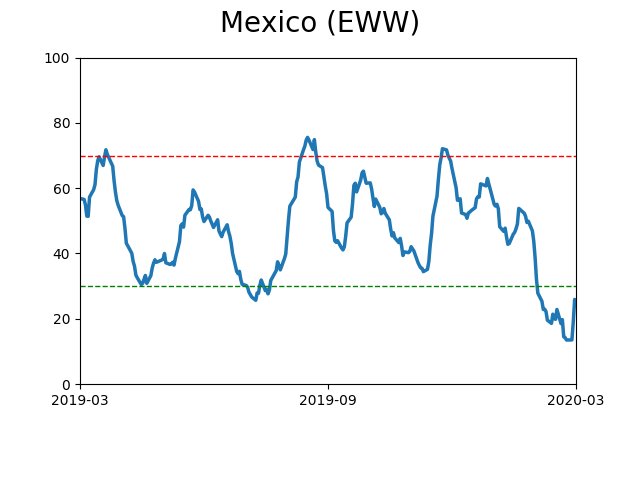
Sentiment Around The World
Optimism Index Thumbnails
|
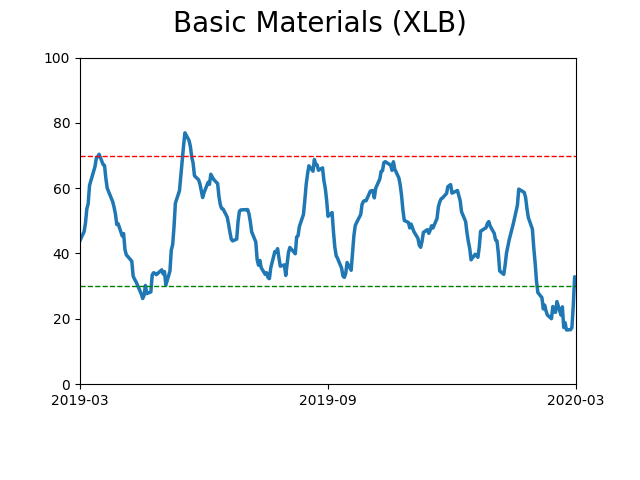
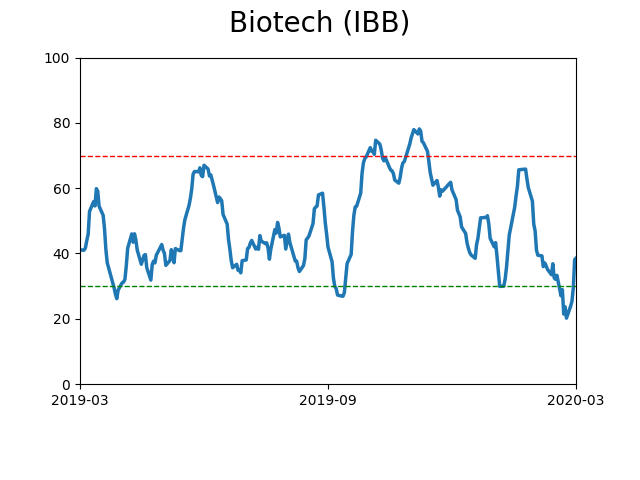
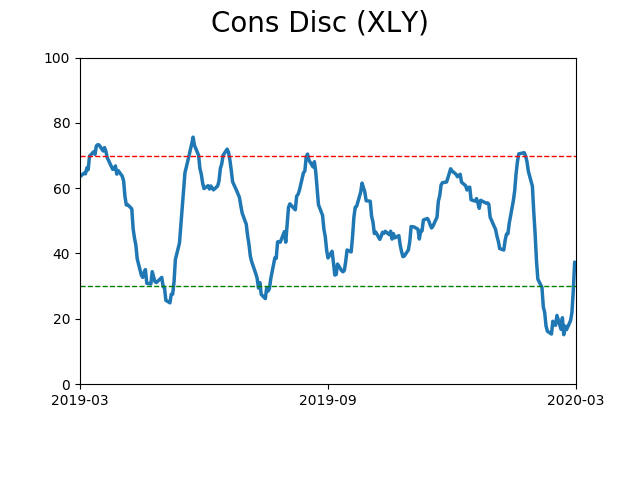
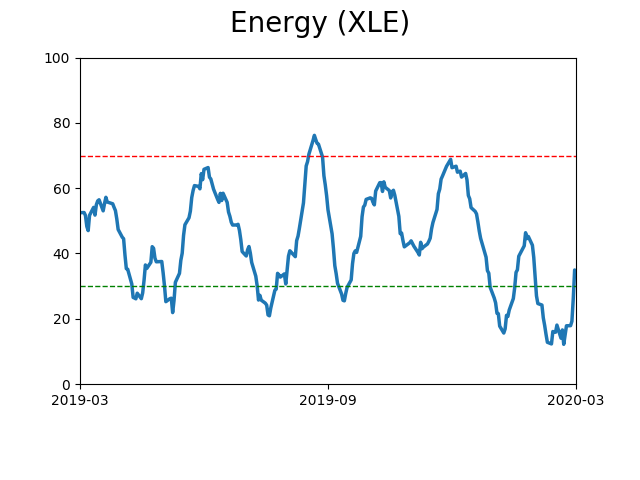
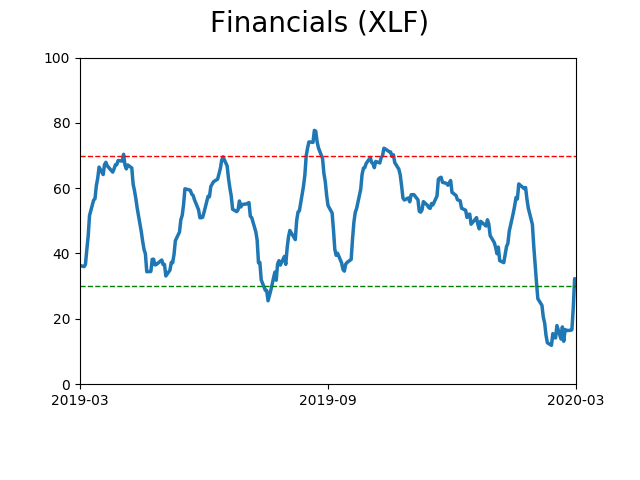
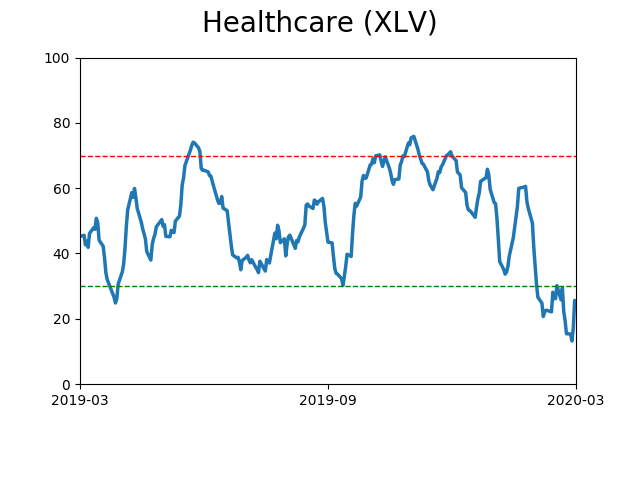
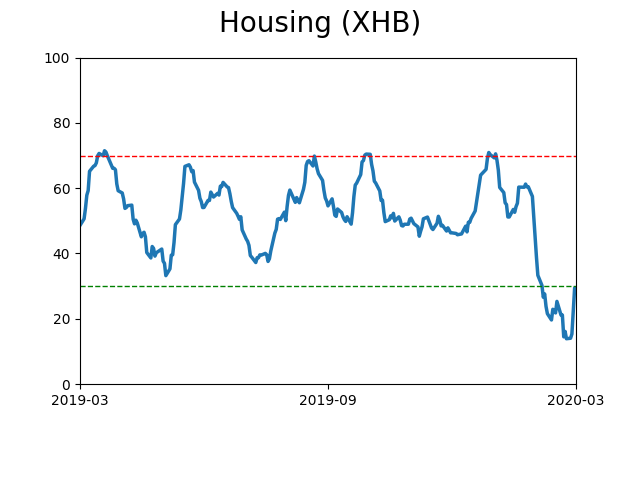
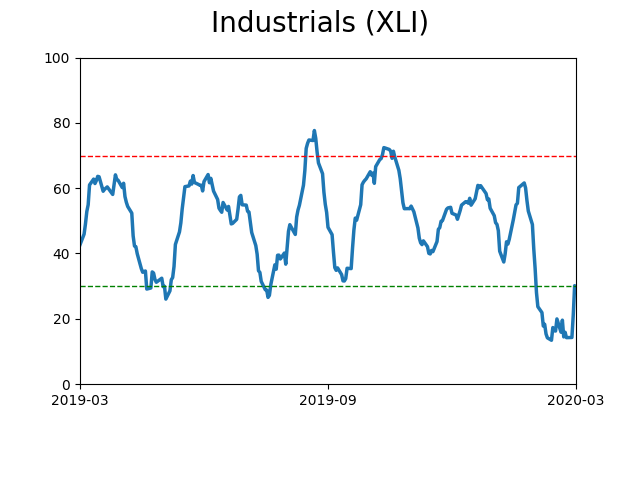
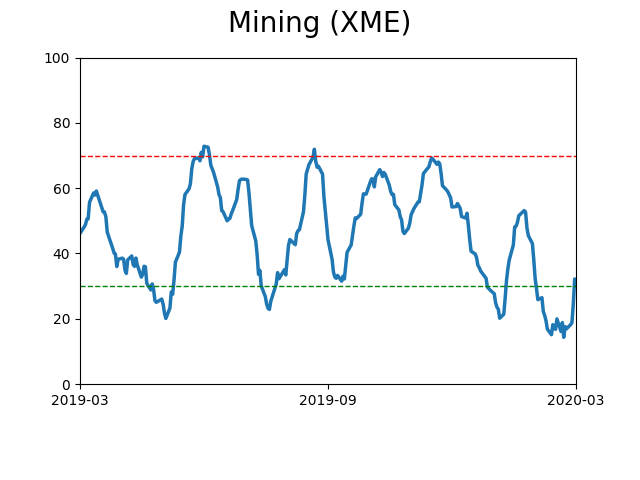
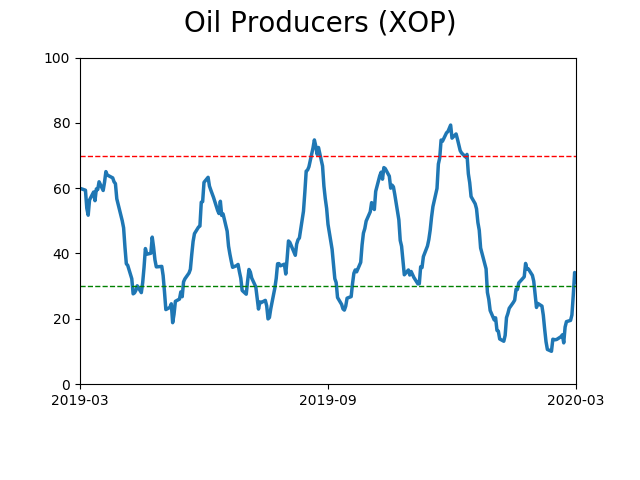
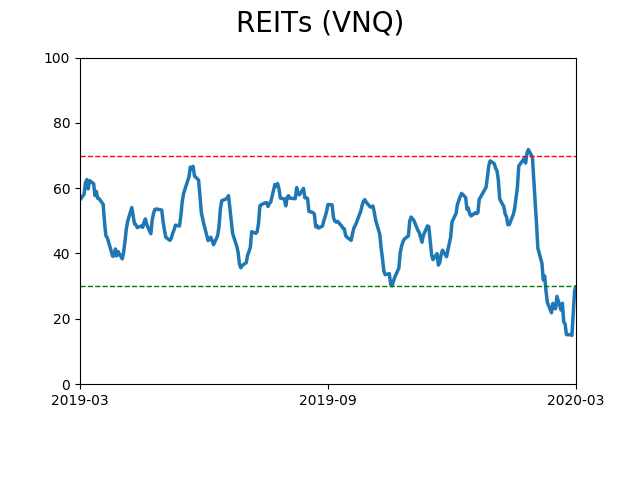
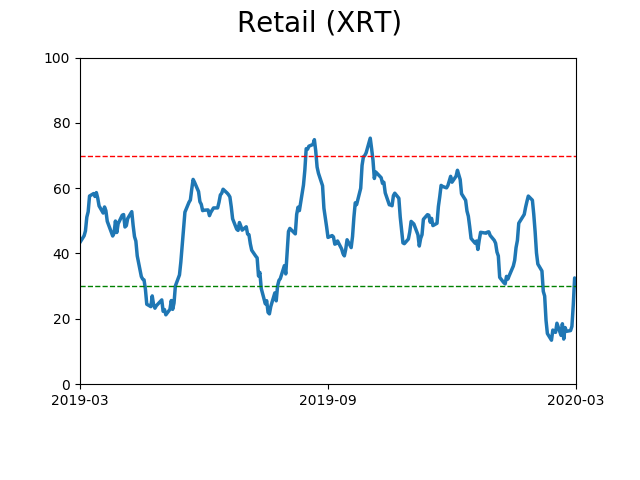
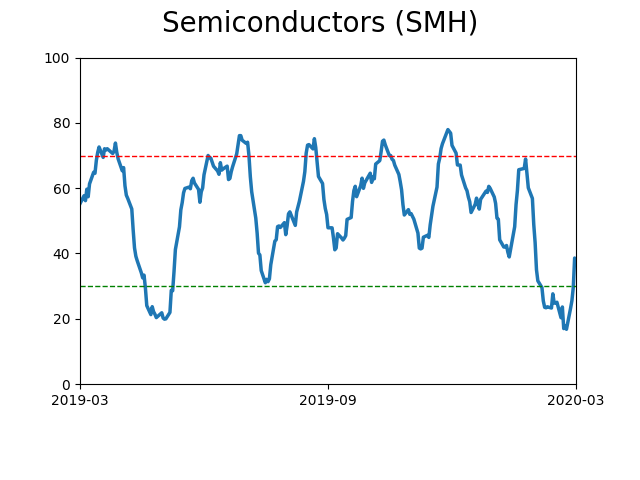
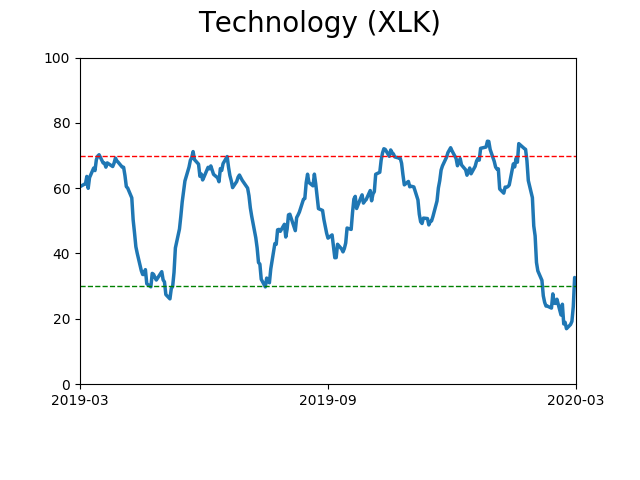
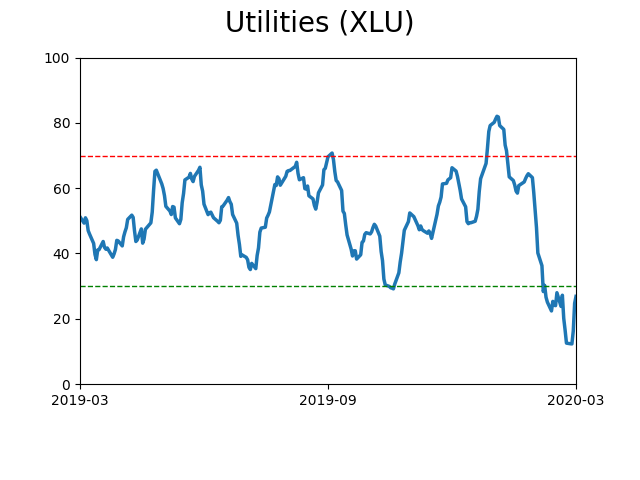
Sector ETF's - 10-Day Moving Average
|
|
|
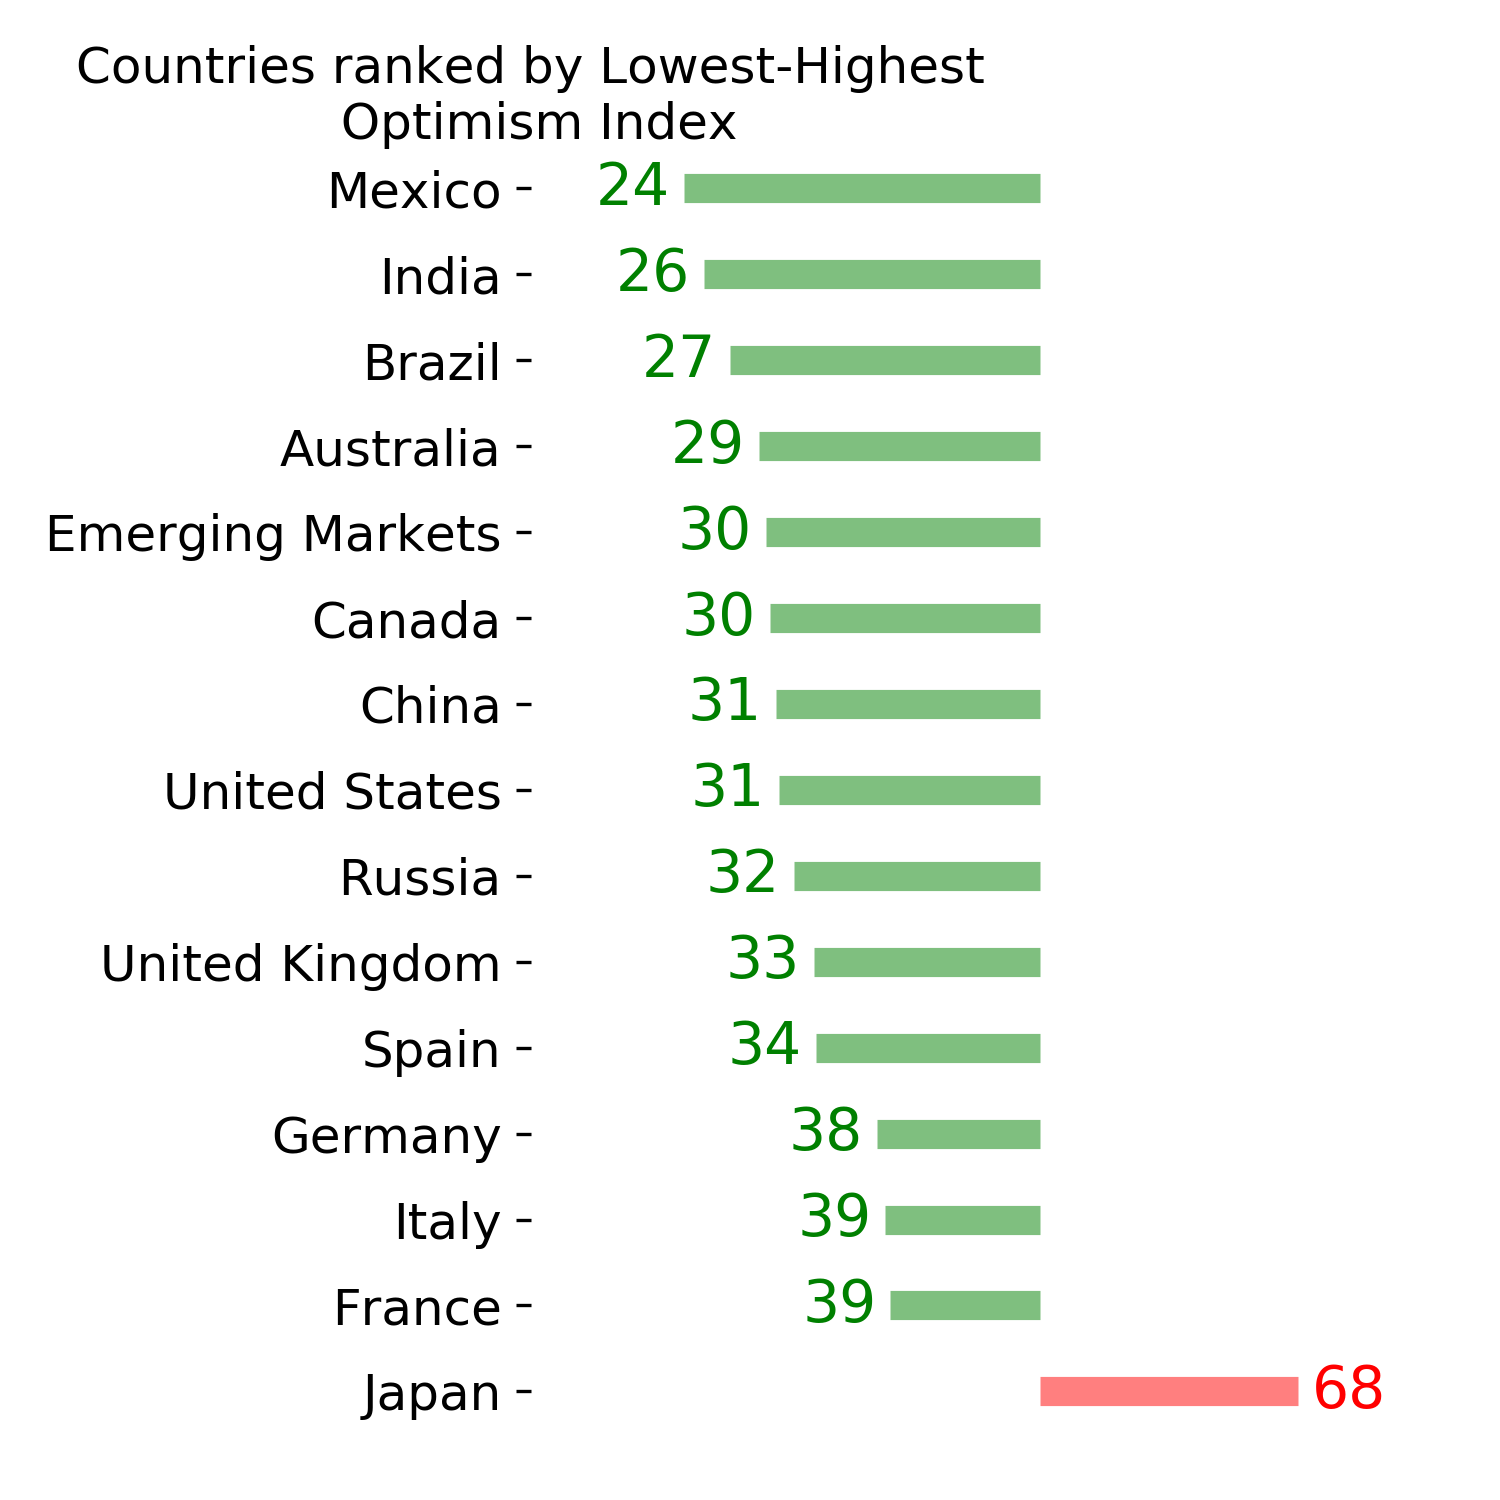
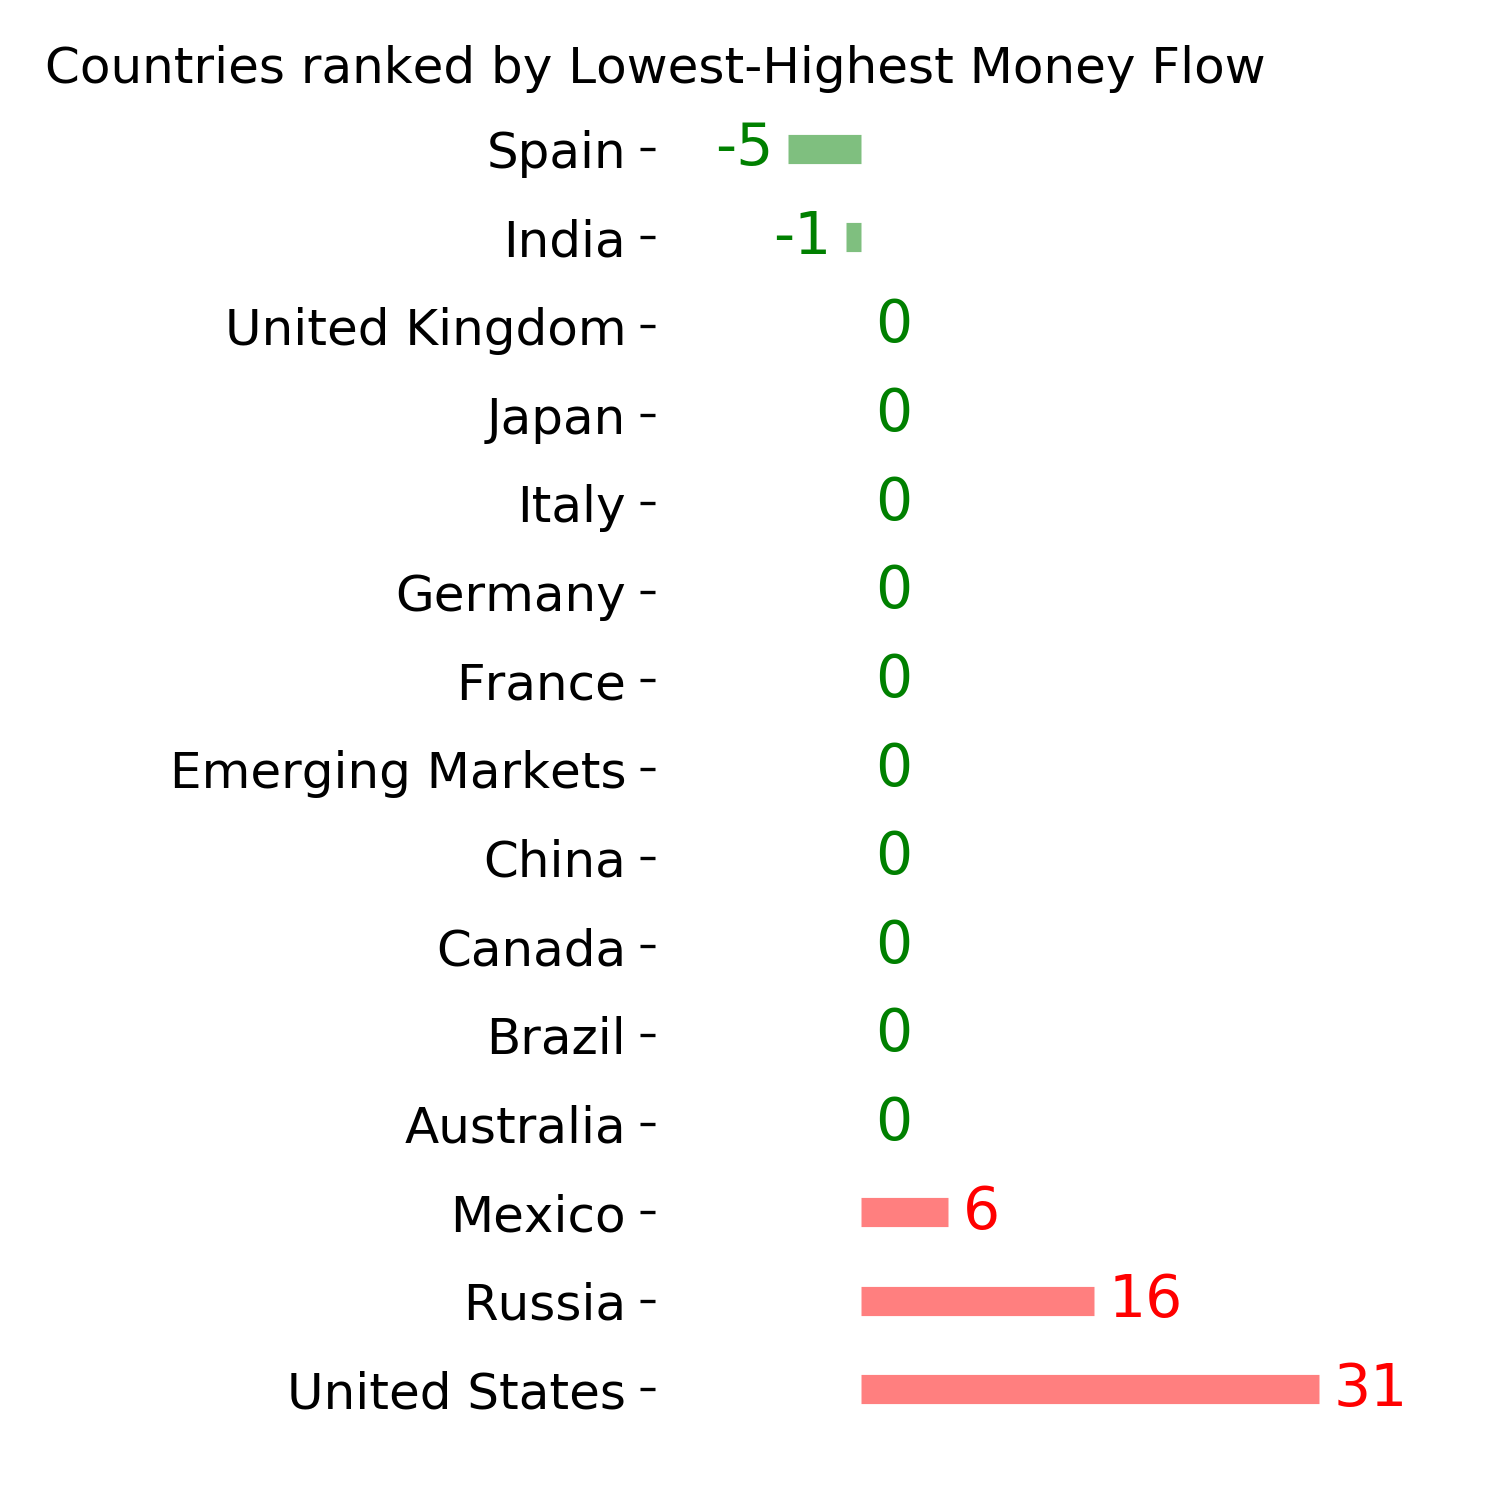
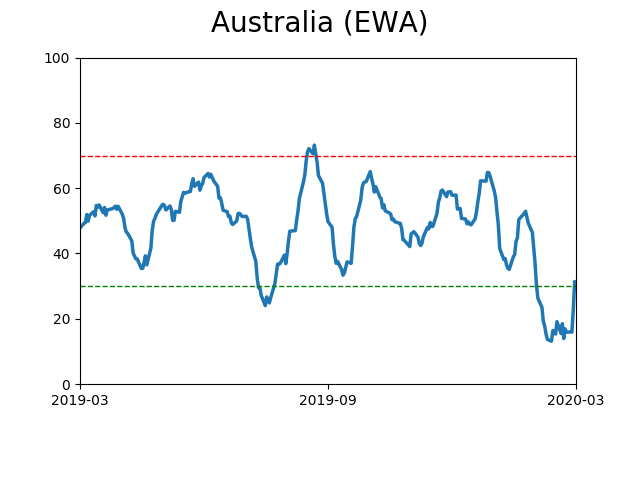
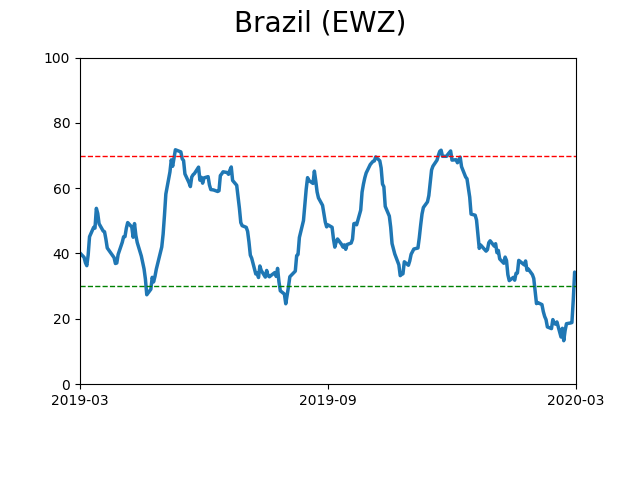
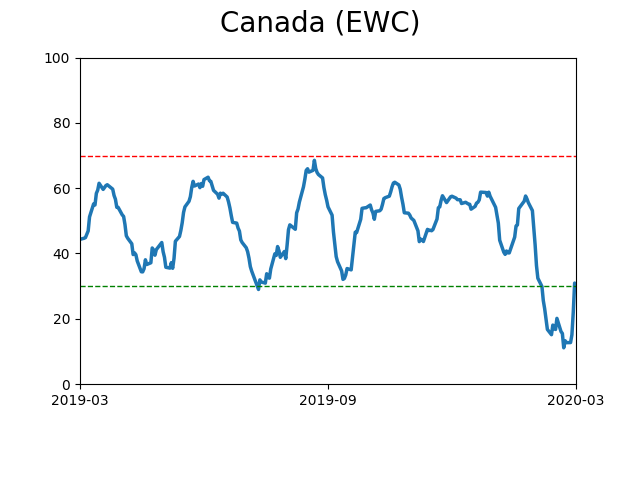
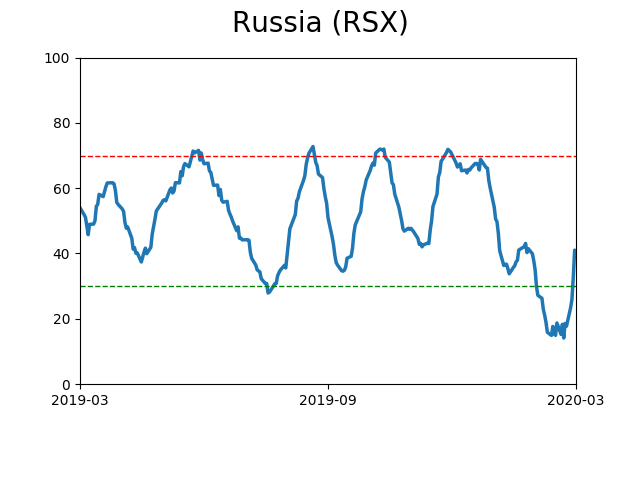
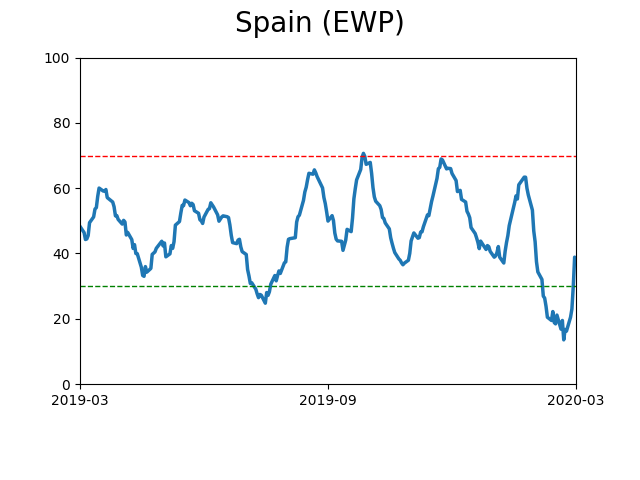
Country ETF's - 10-Day Moving Average
|
|
|
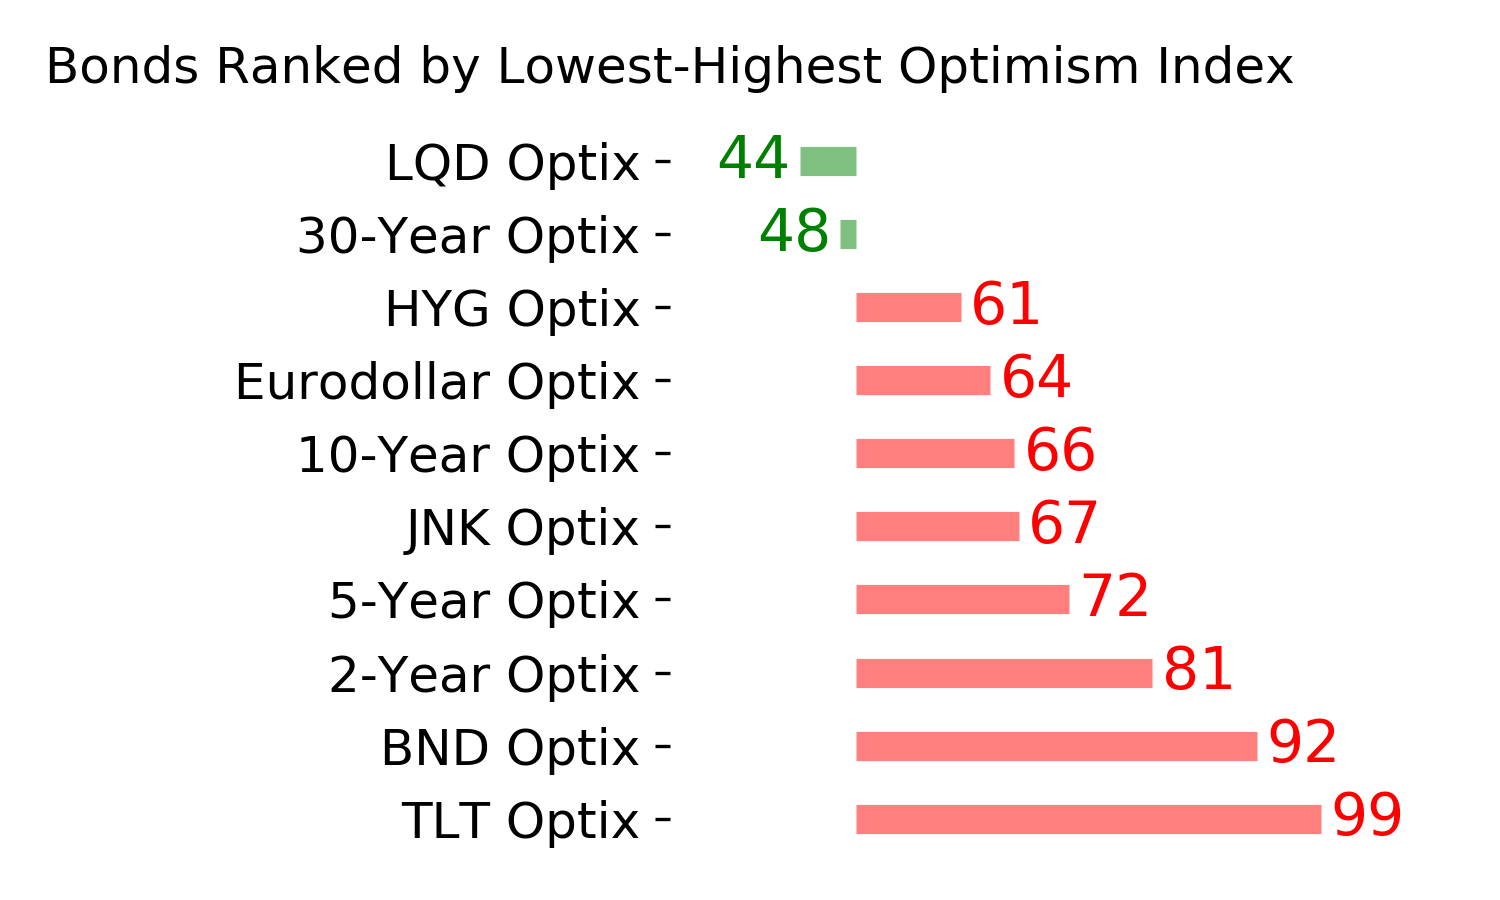
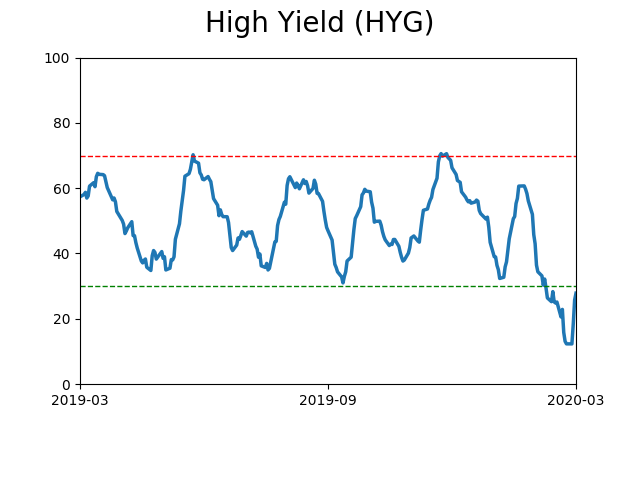
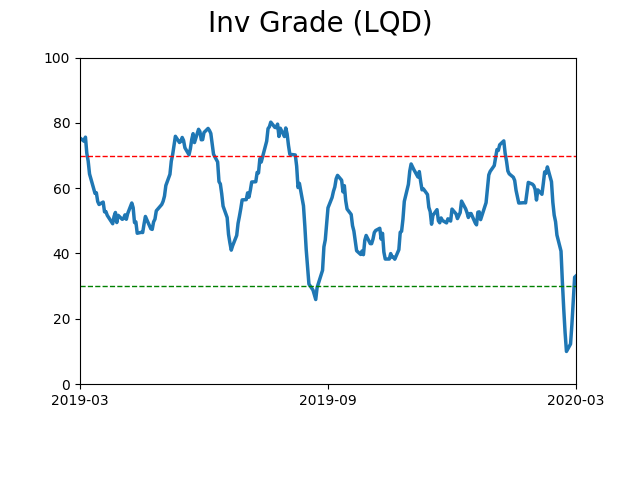
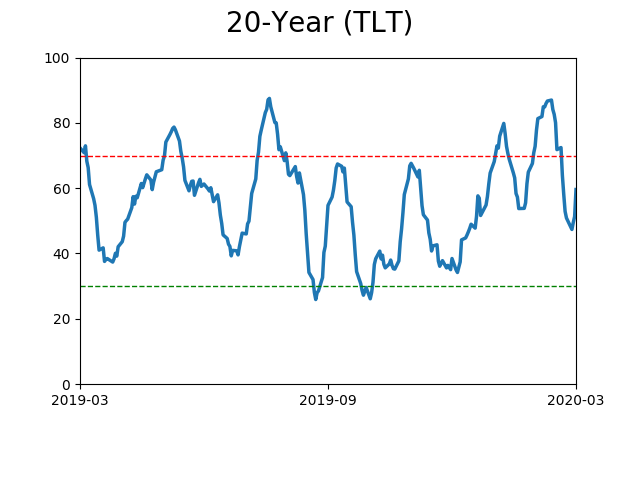
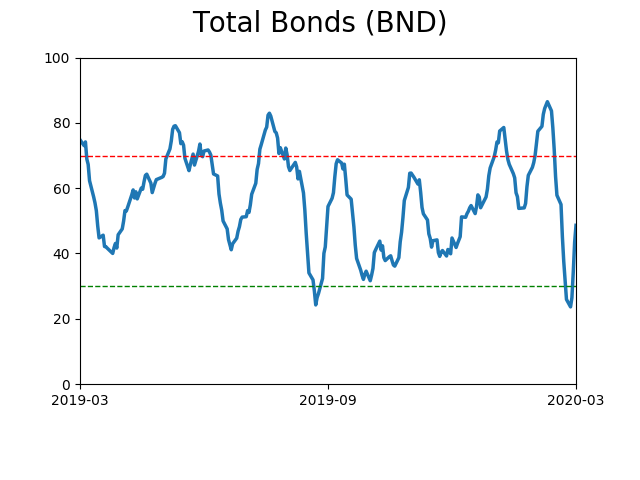
Bond ETF's - 10-Day Moving Average
|
|
|
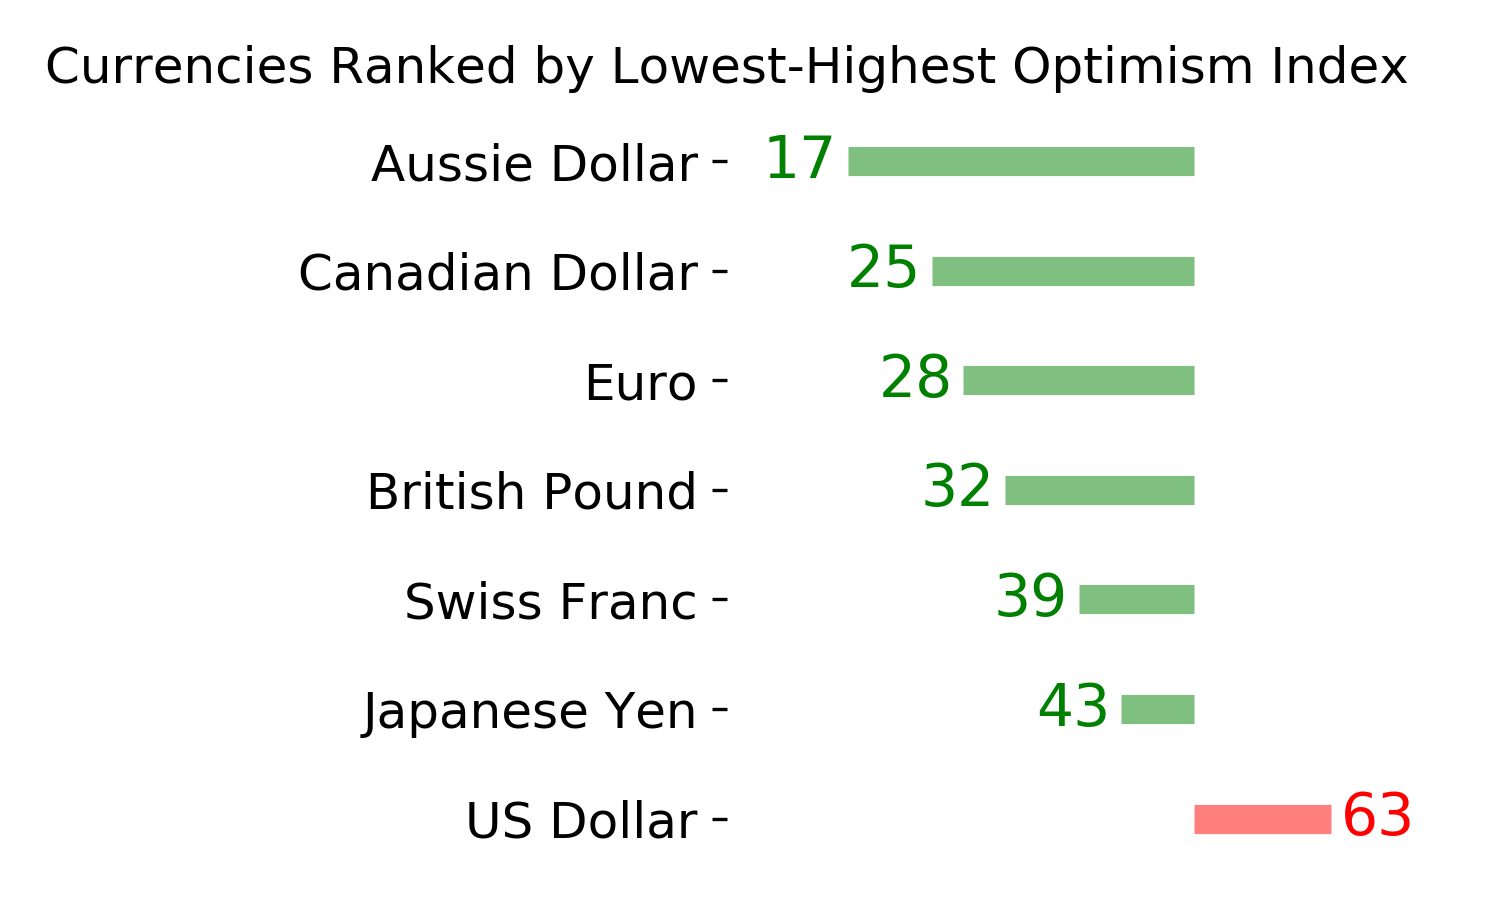
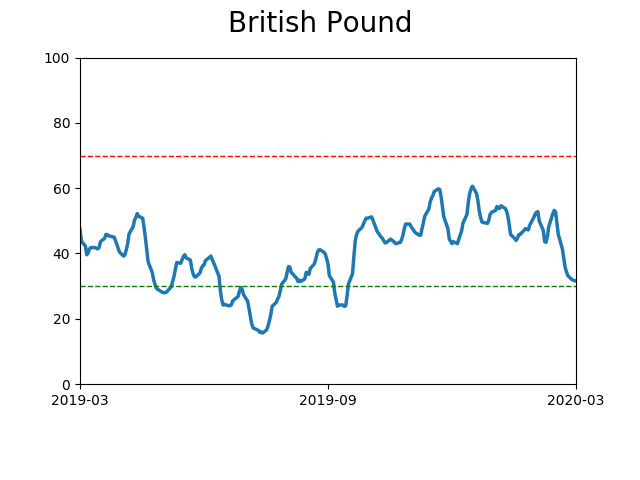
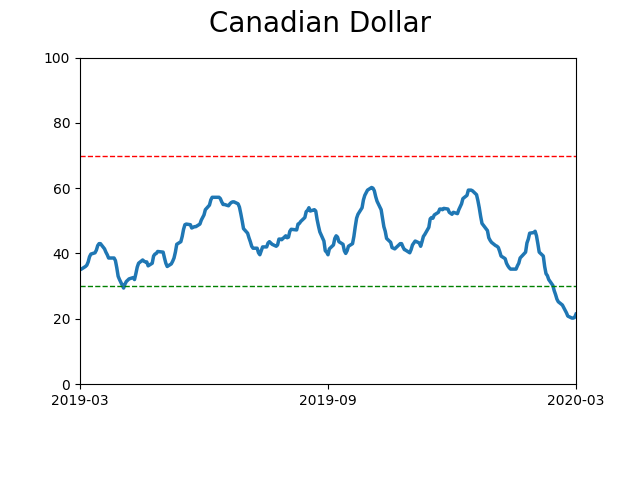
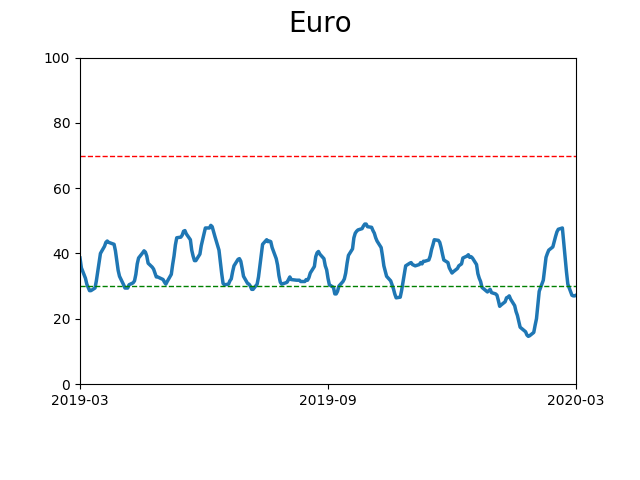
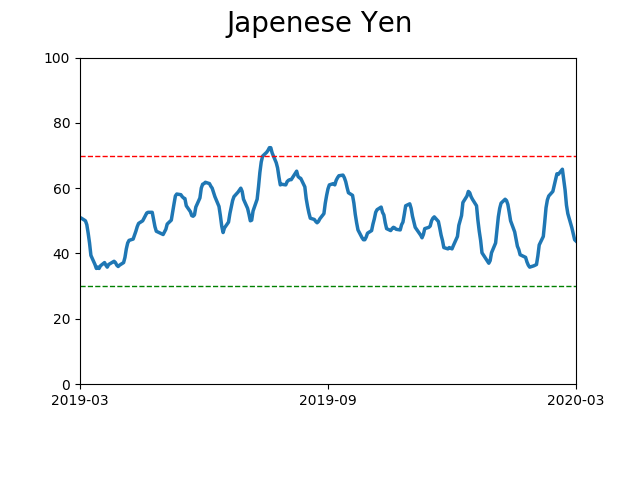
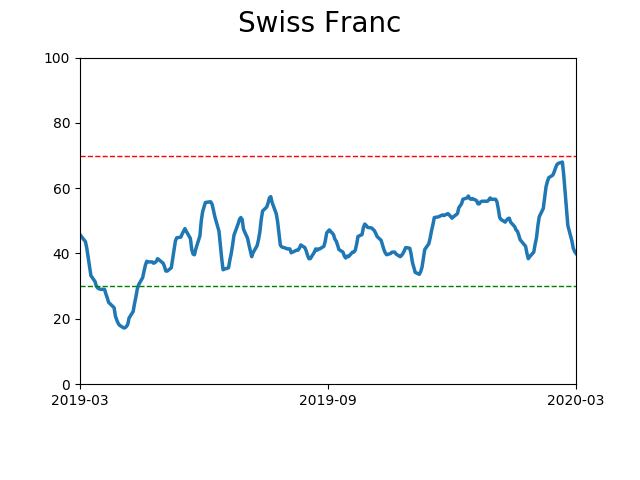
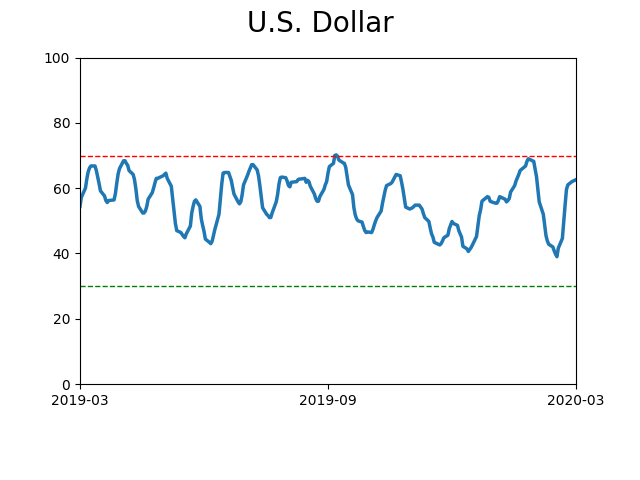
Currency ETF's - 5-Day Moving Average
|
|
|
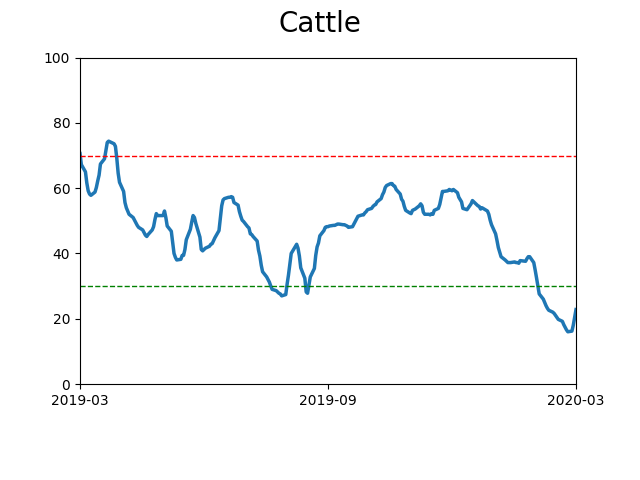
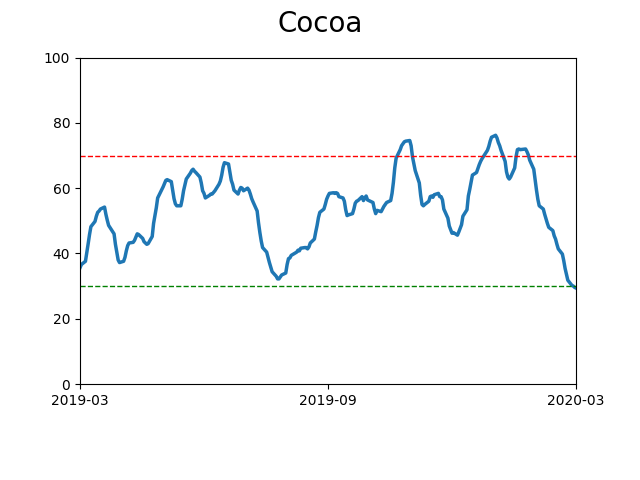
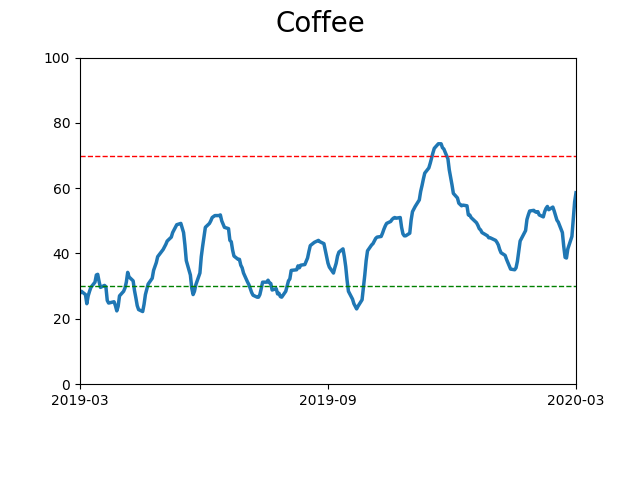
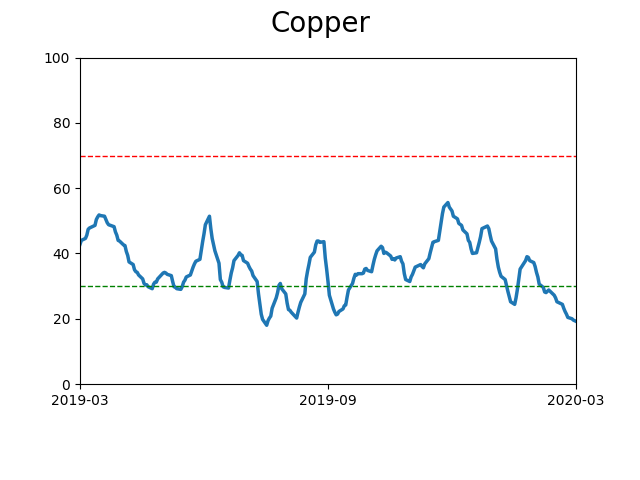
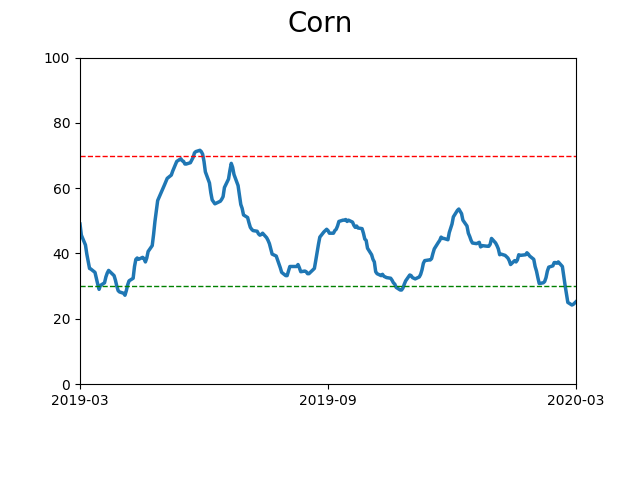
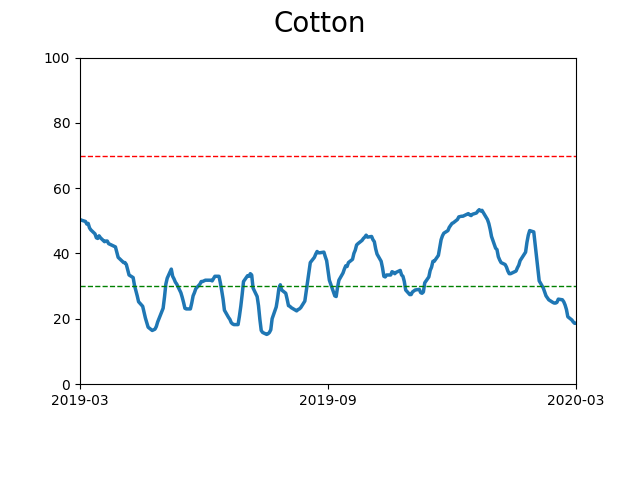
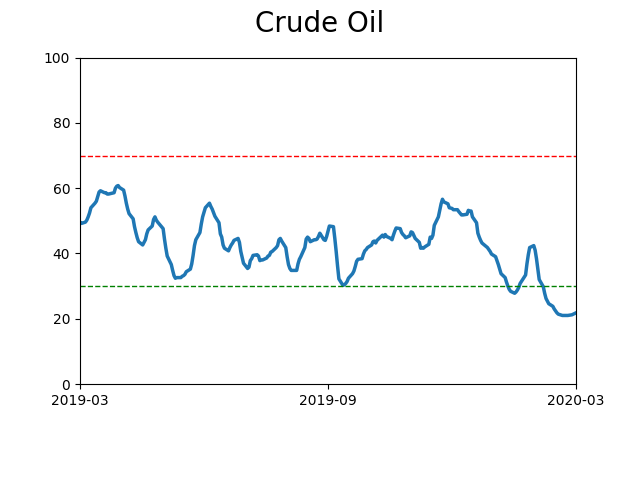
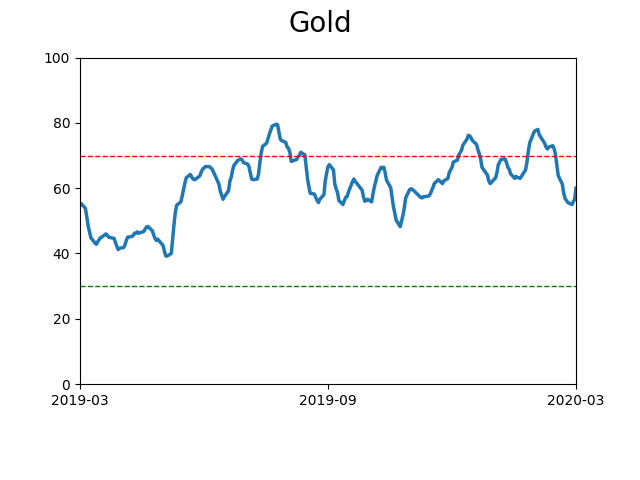
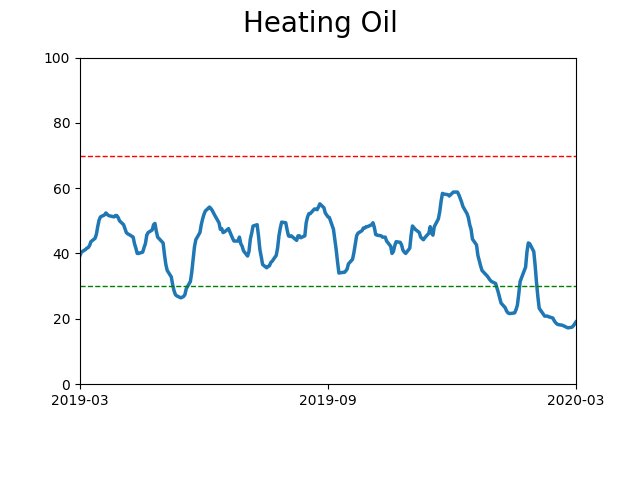
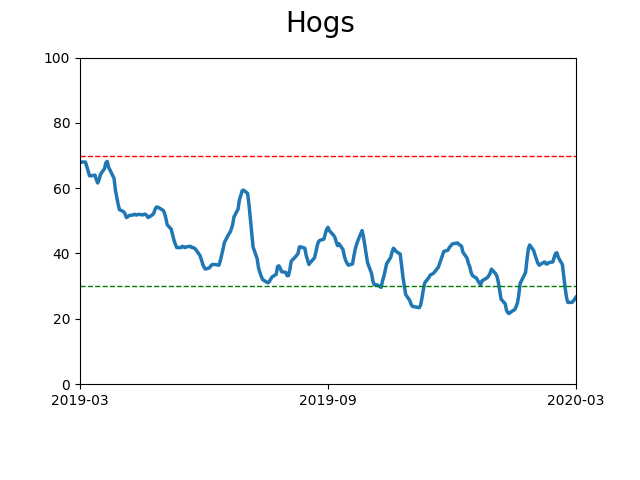
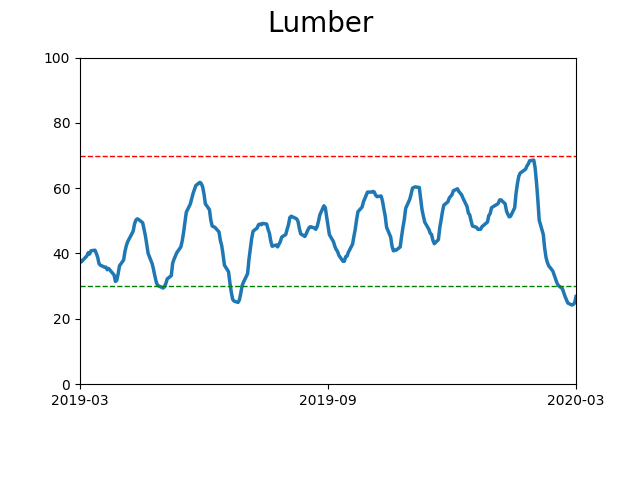
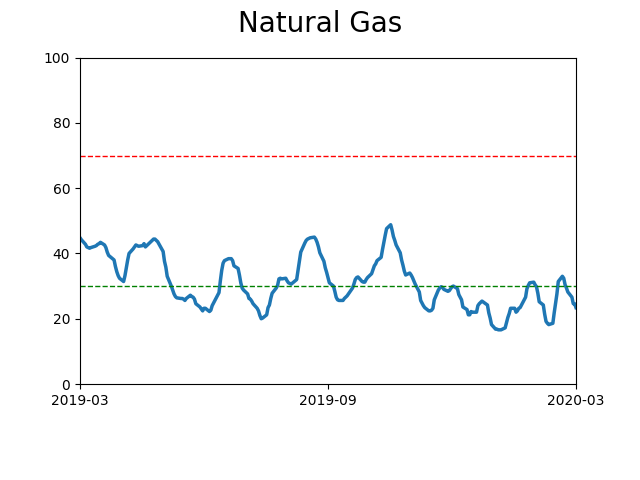
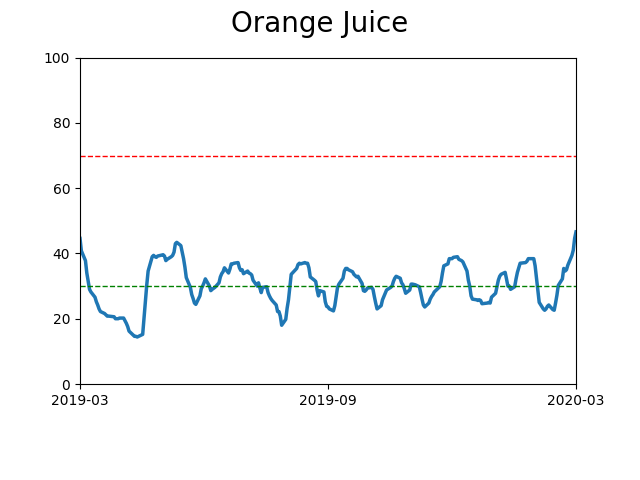
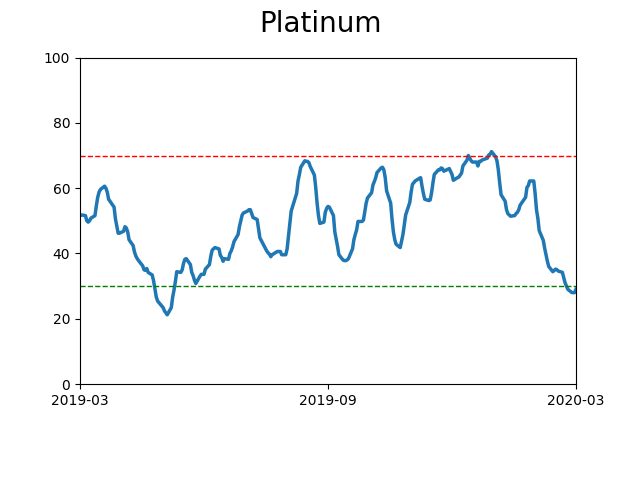
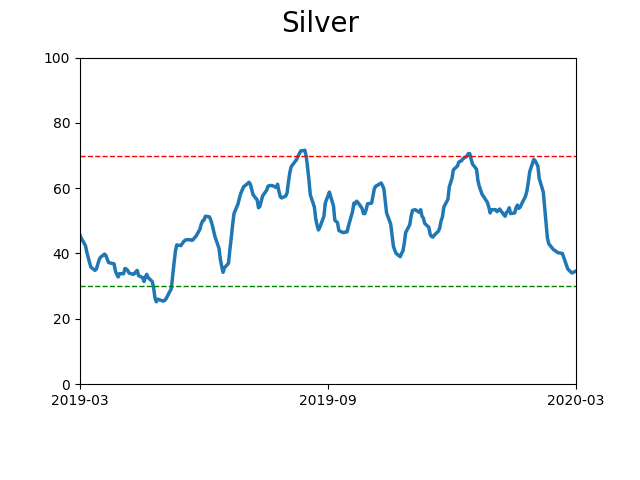
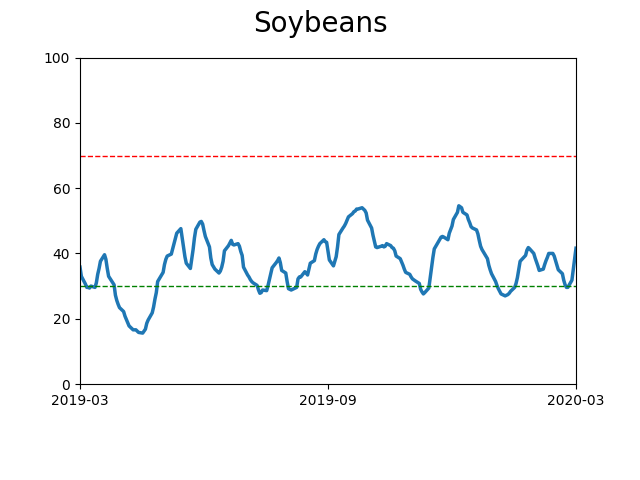
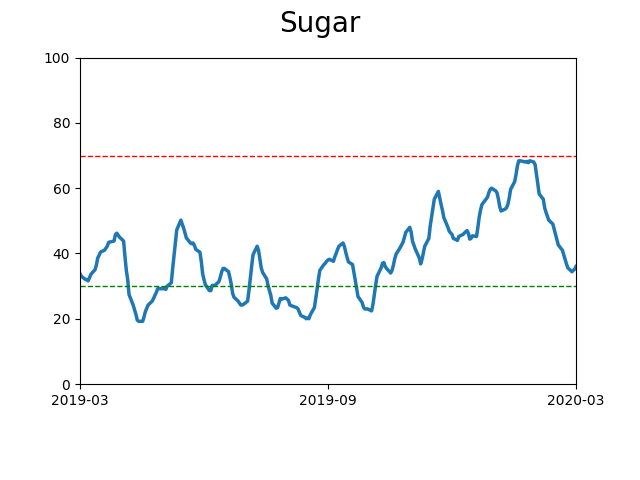
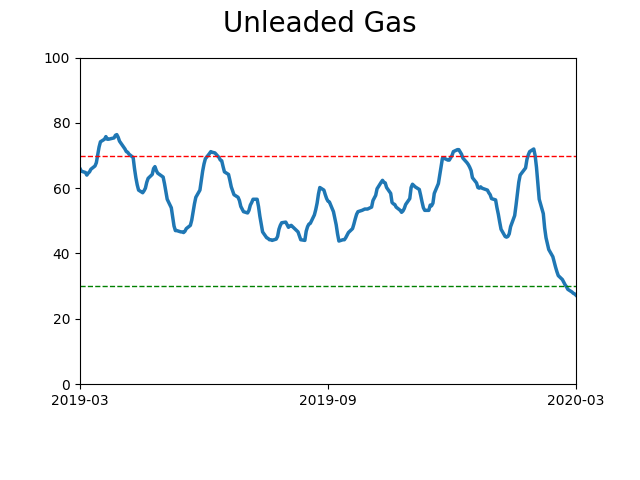
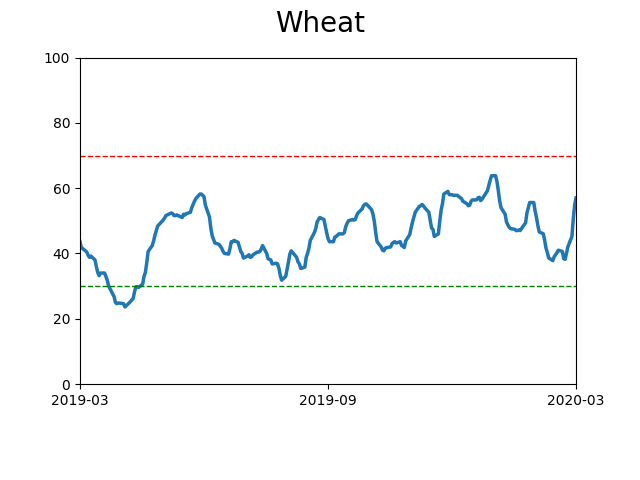
Commodity ETF's - 5-Day Moving Average
|
|