Headlines
|
|
Volatility is slowly easing:
A simulated model of the VIX that goes back 60 years shows that volatility expectations are slowly easing. This SimVIX model just fell to a 5-day low after a near-record spike, which has preceded some short-term weakness in stocks, but longer-term strength.
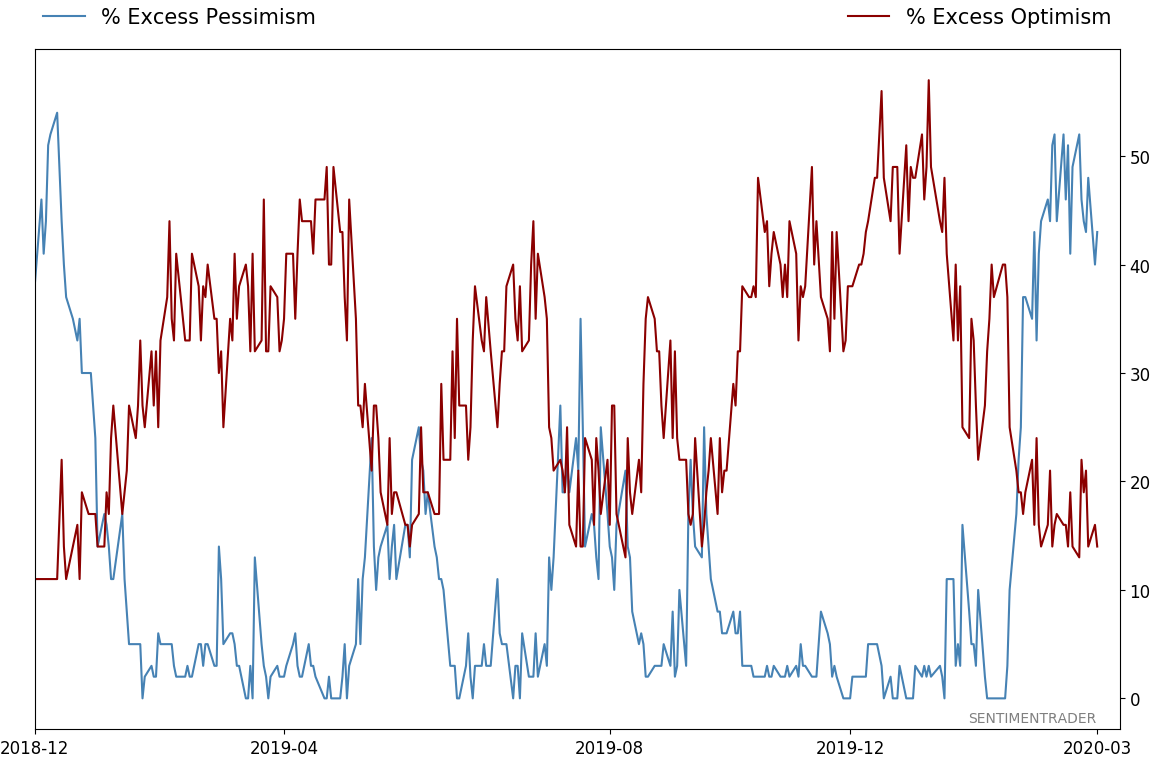
Some extremes are bouncing back:
Sentiment typically moves with price, and now that stocks are bouncing back from extreme oversold conditions, sentiment is also bouncing back from extremes.
|
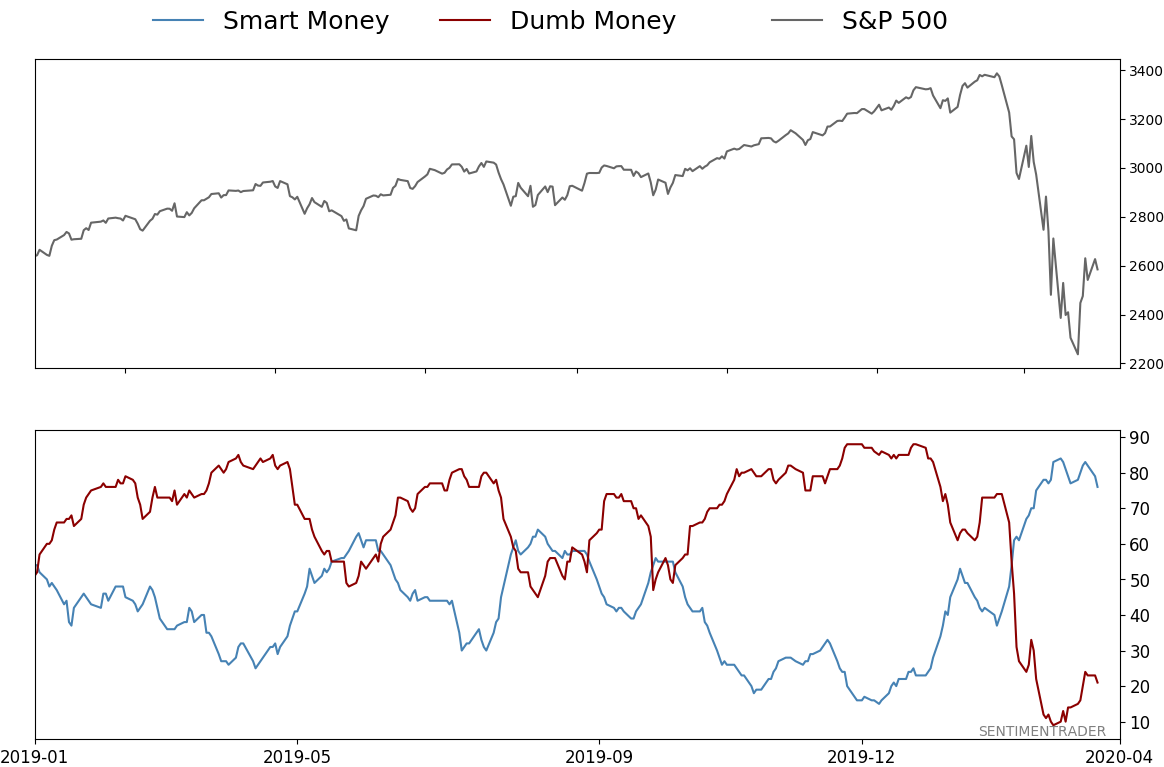
Smart / Dumb Money Confidence
|
Smart Money Confidence: 76%
Dumb Money Confidence: 21%
|
|
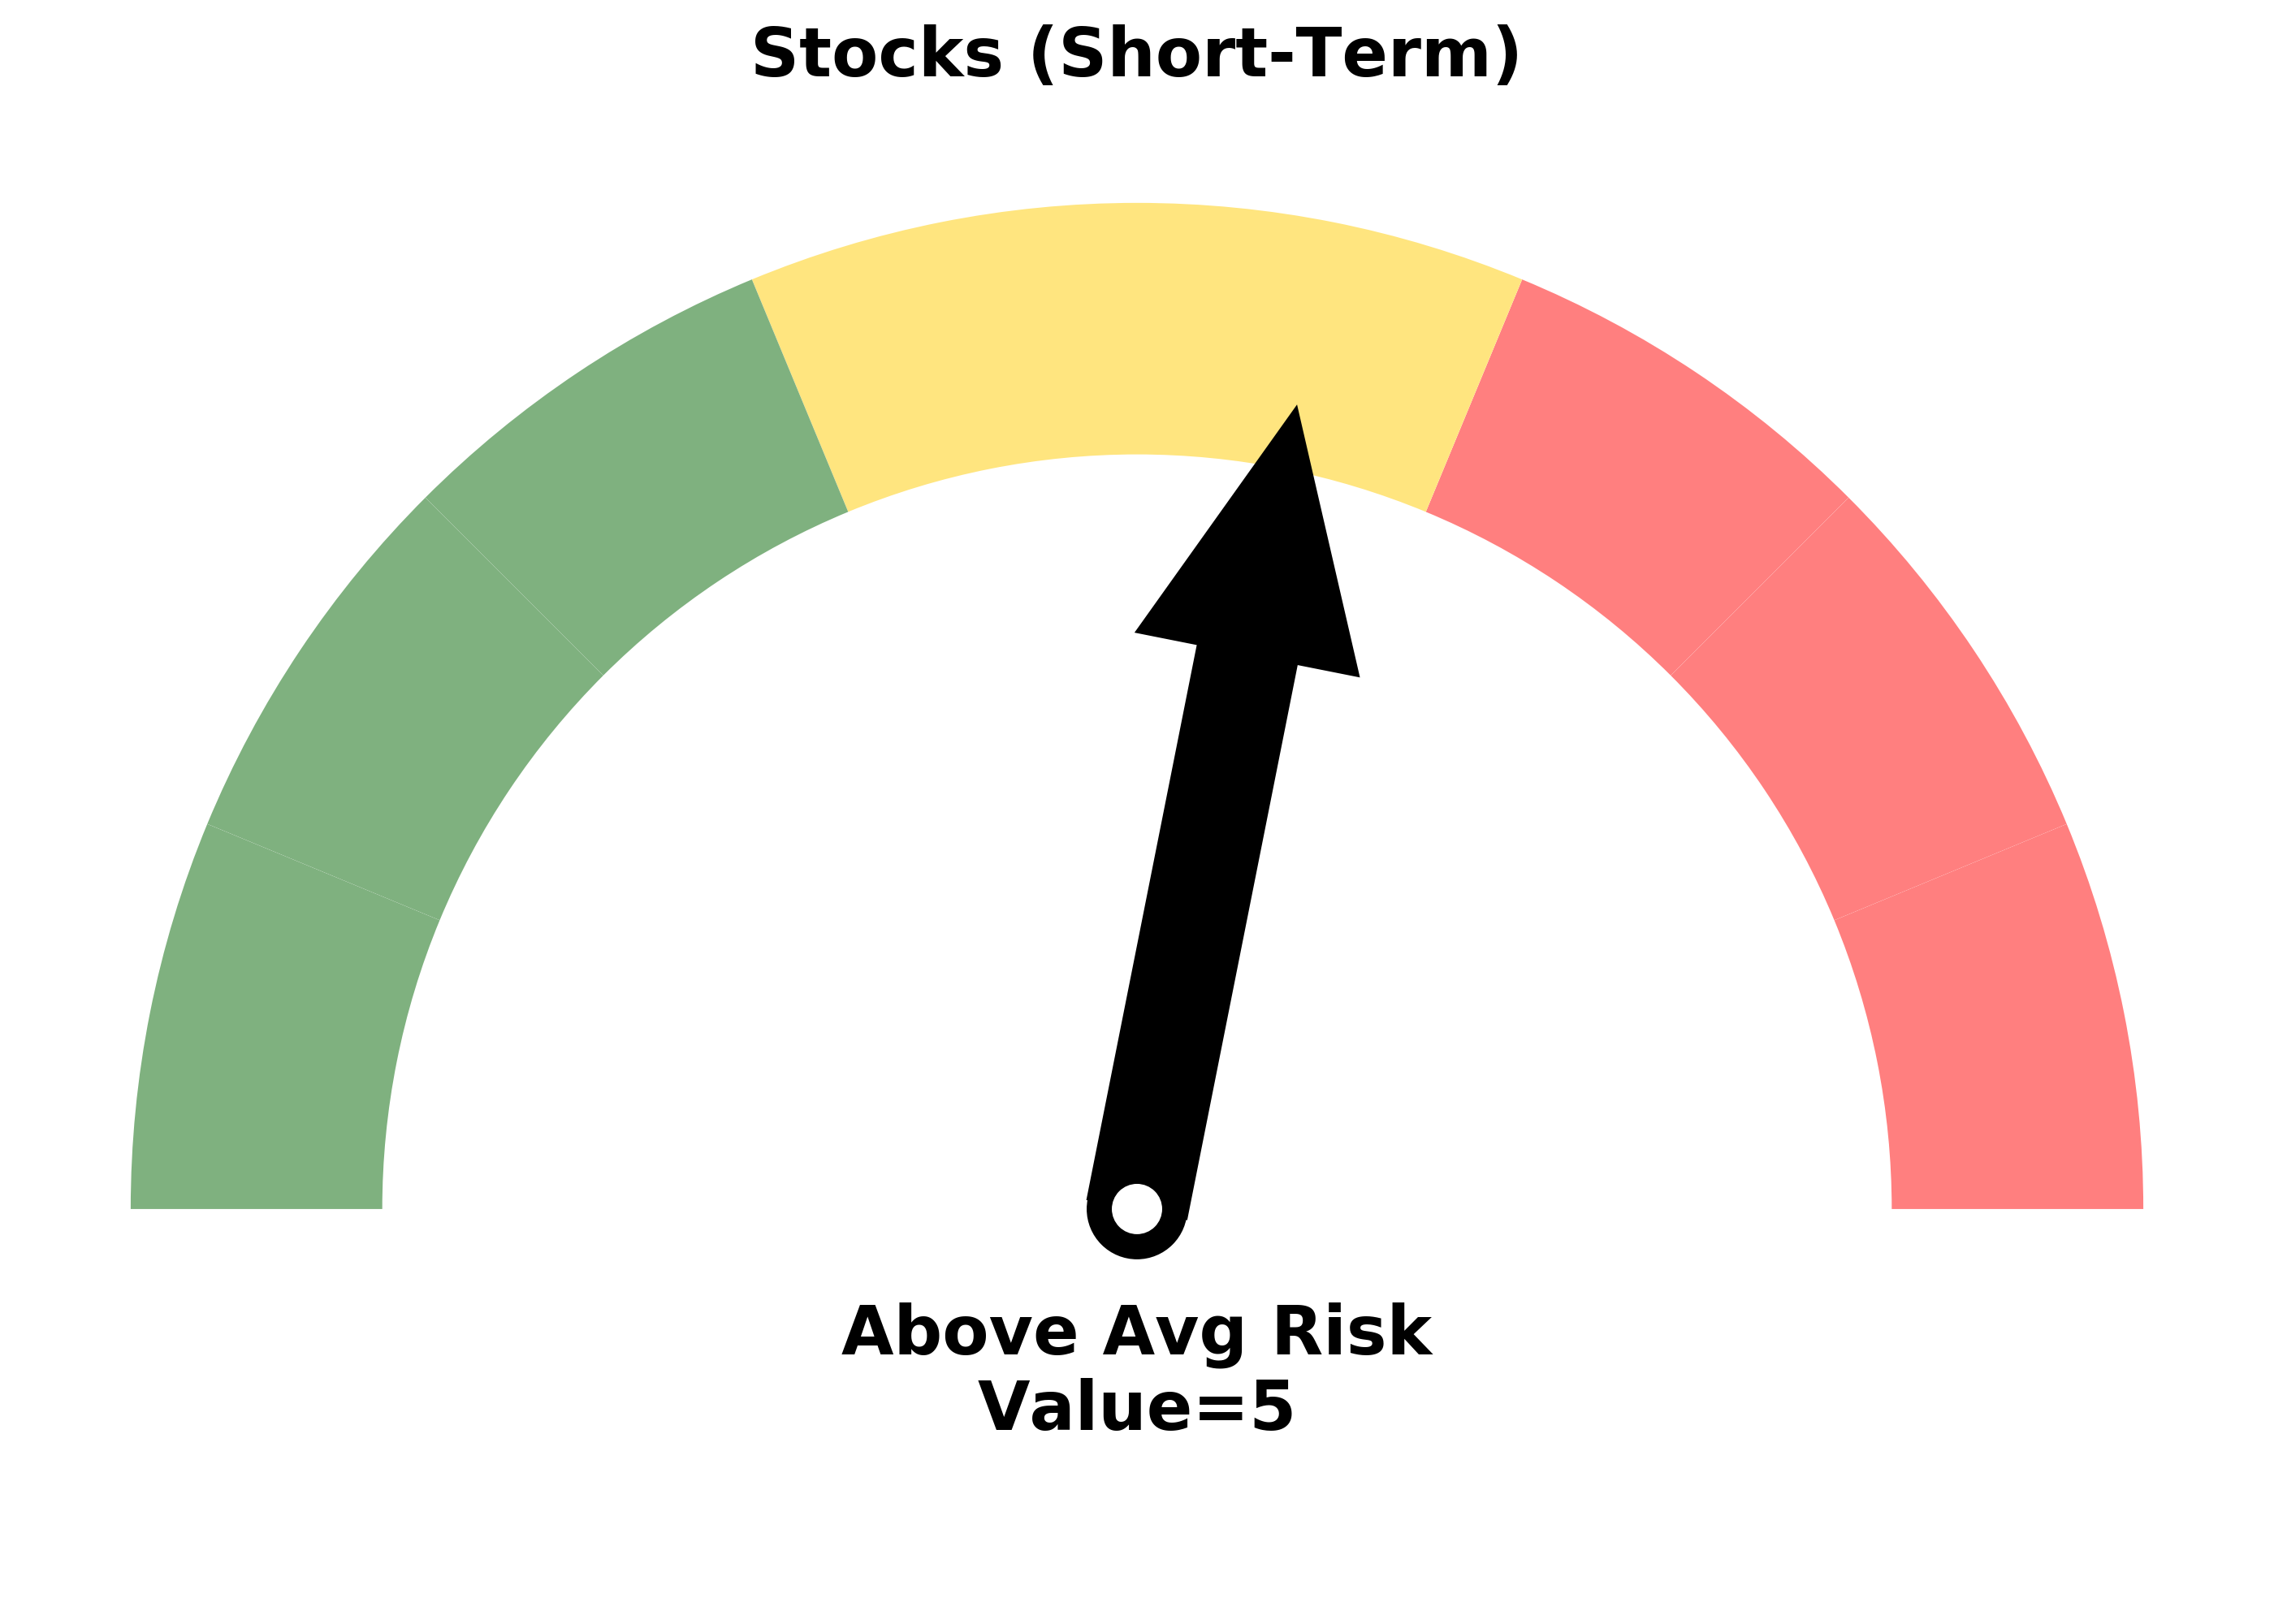
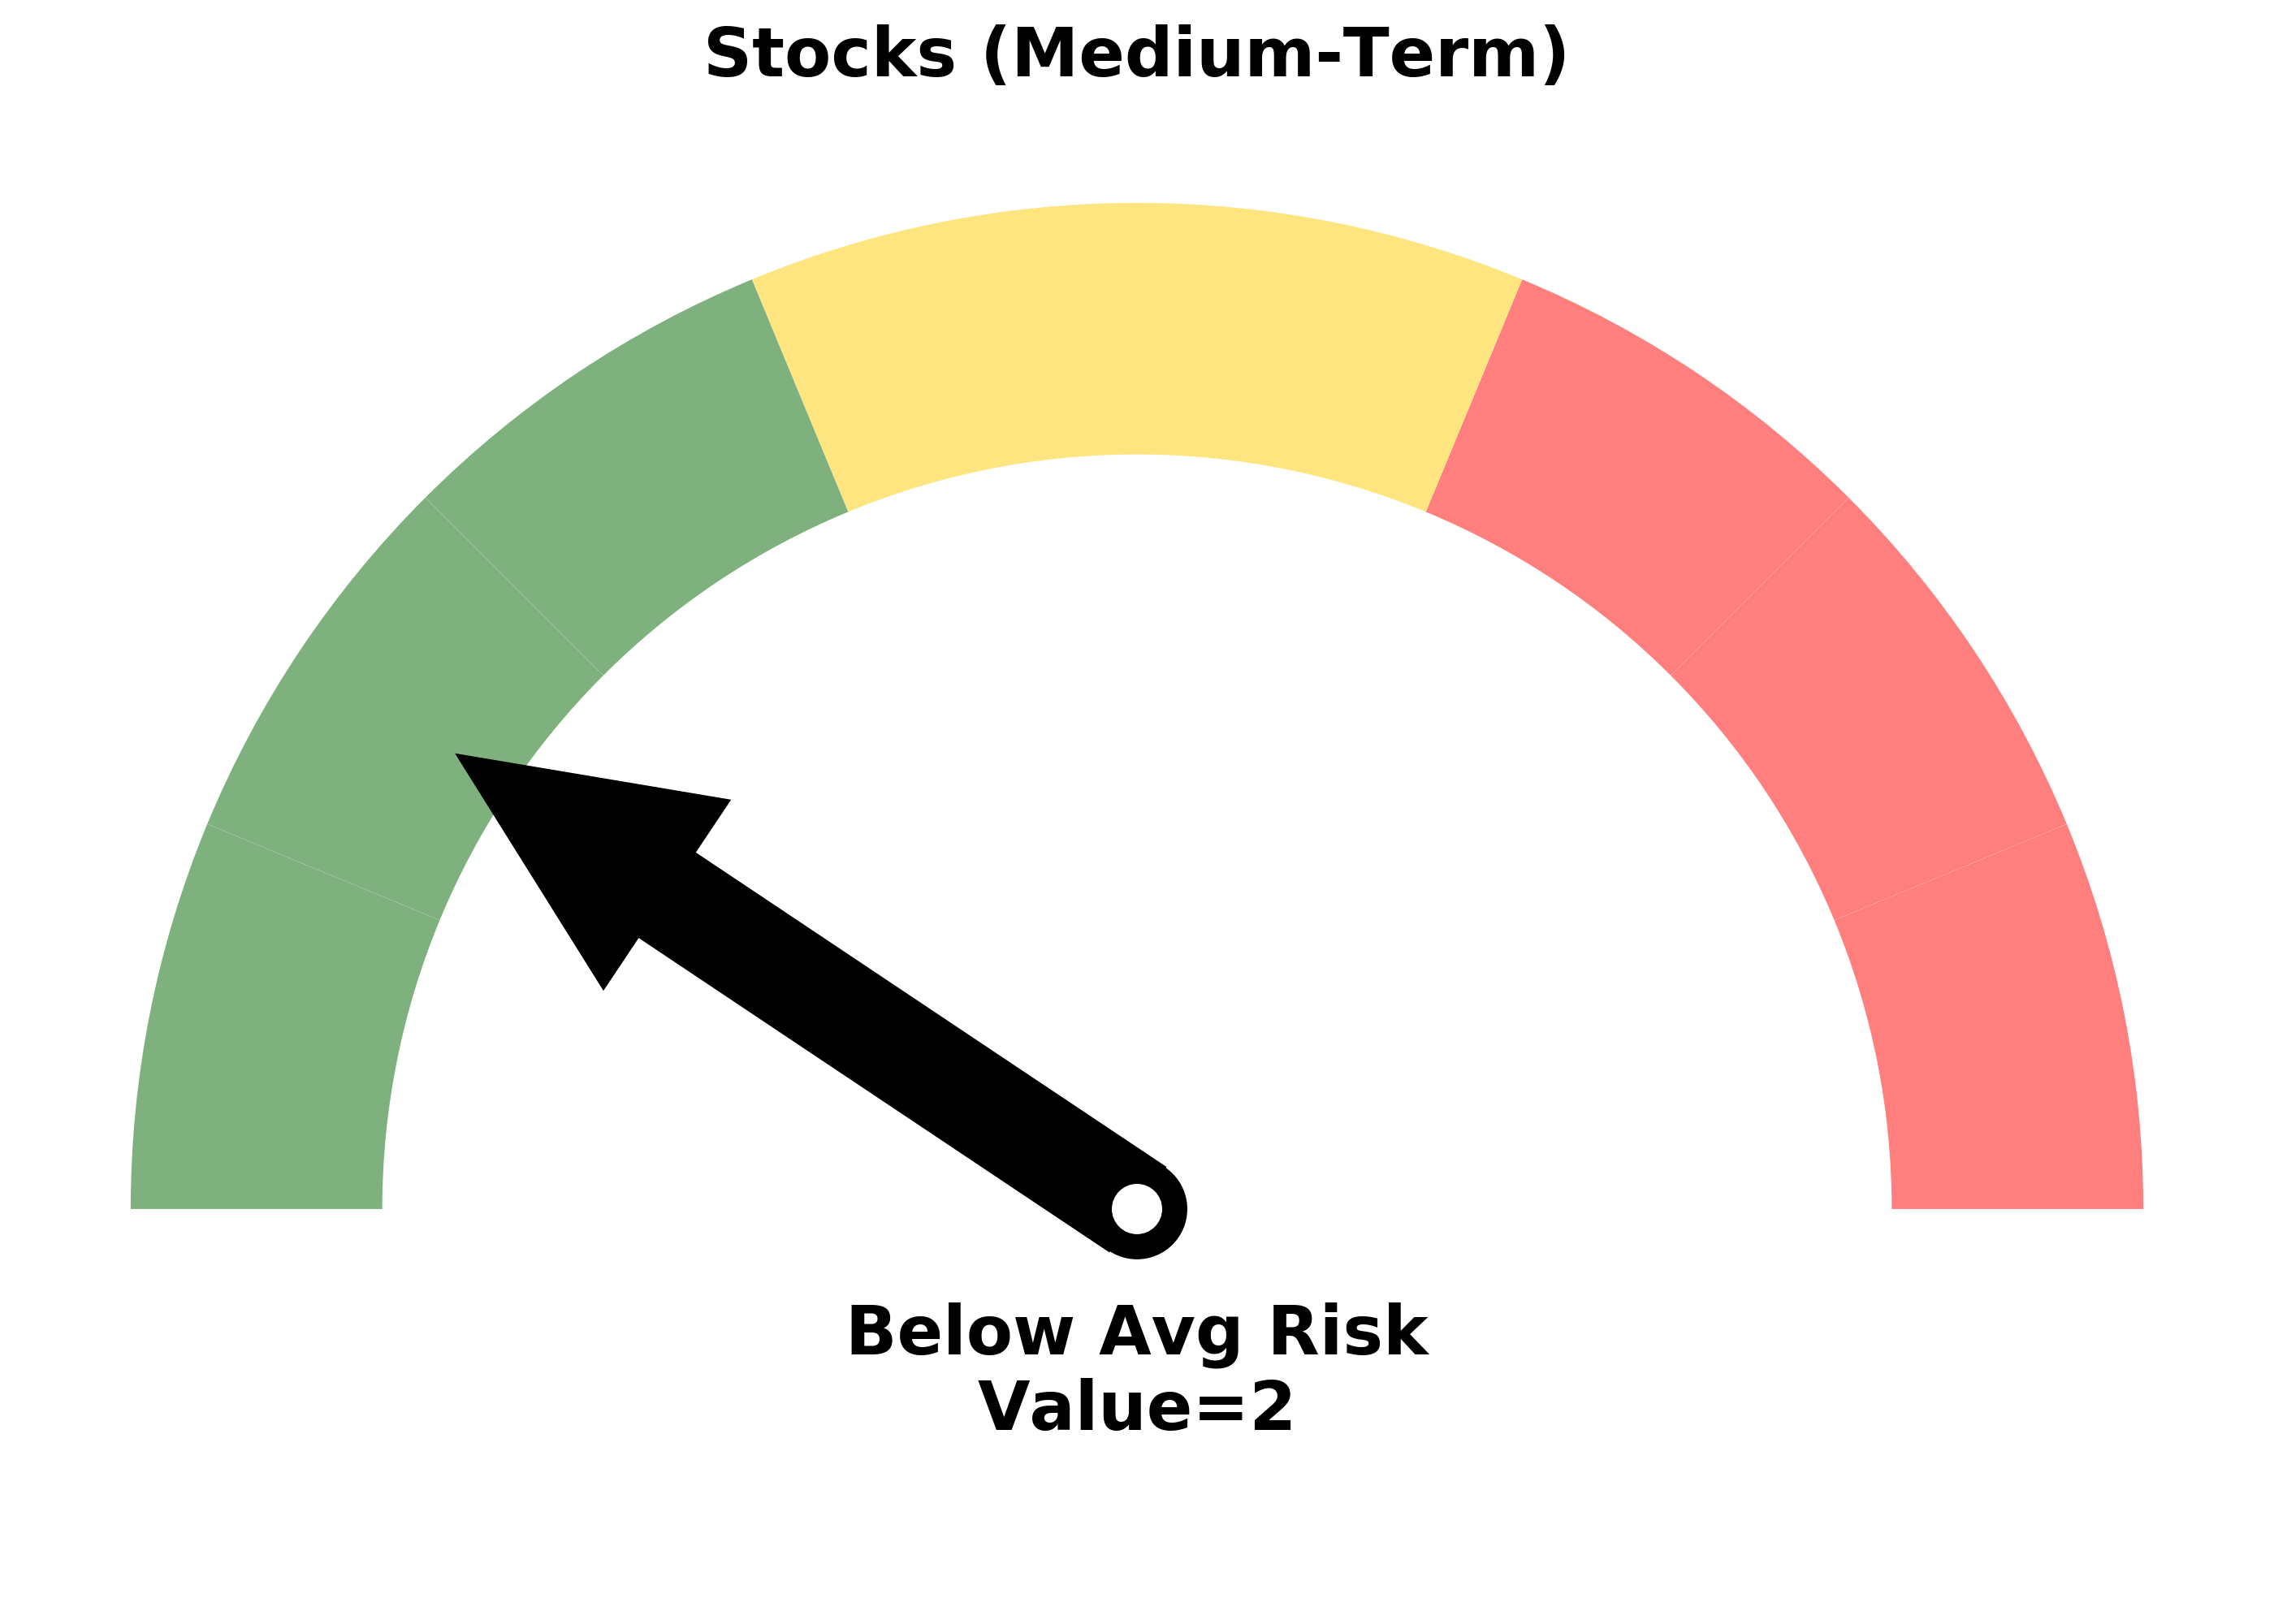
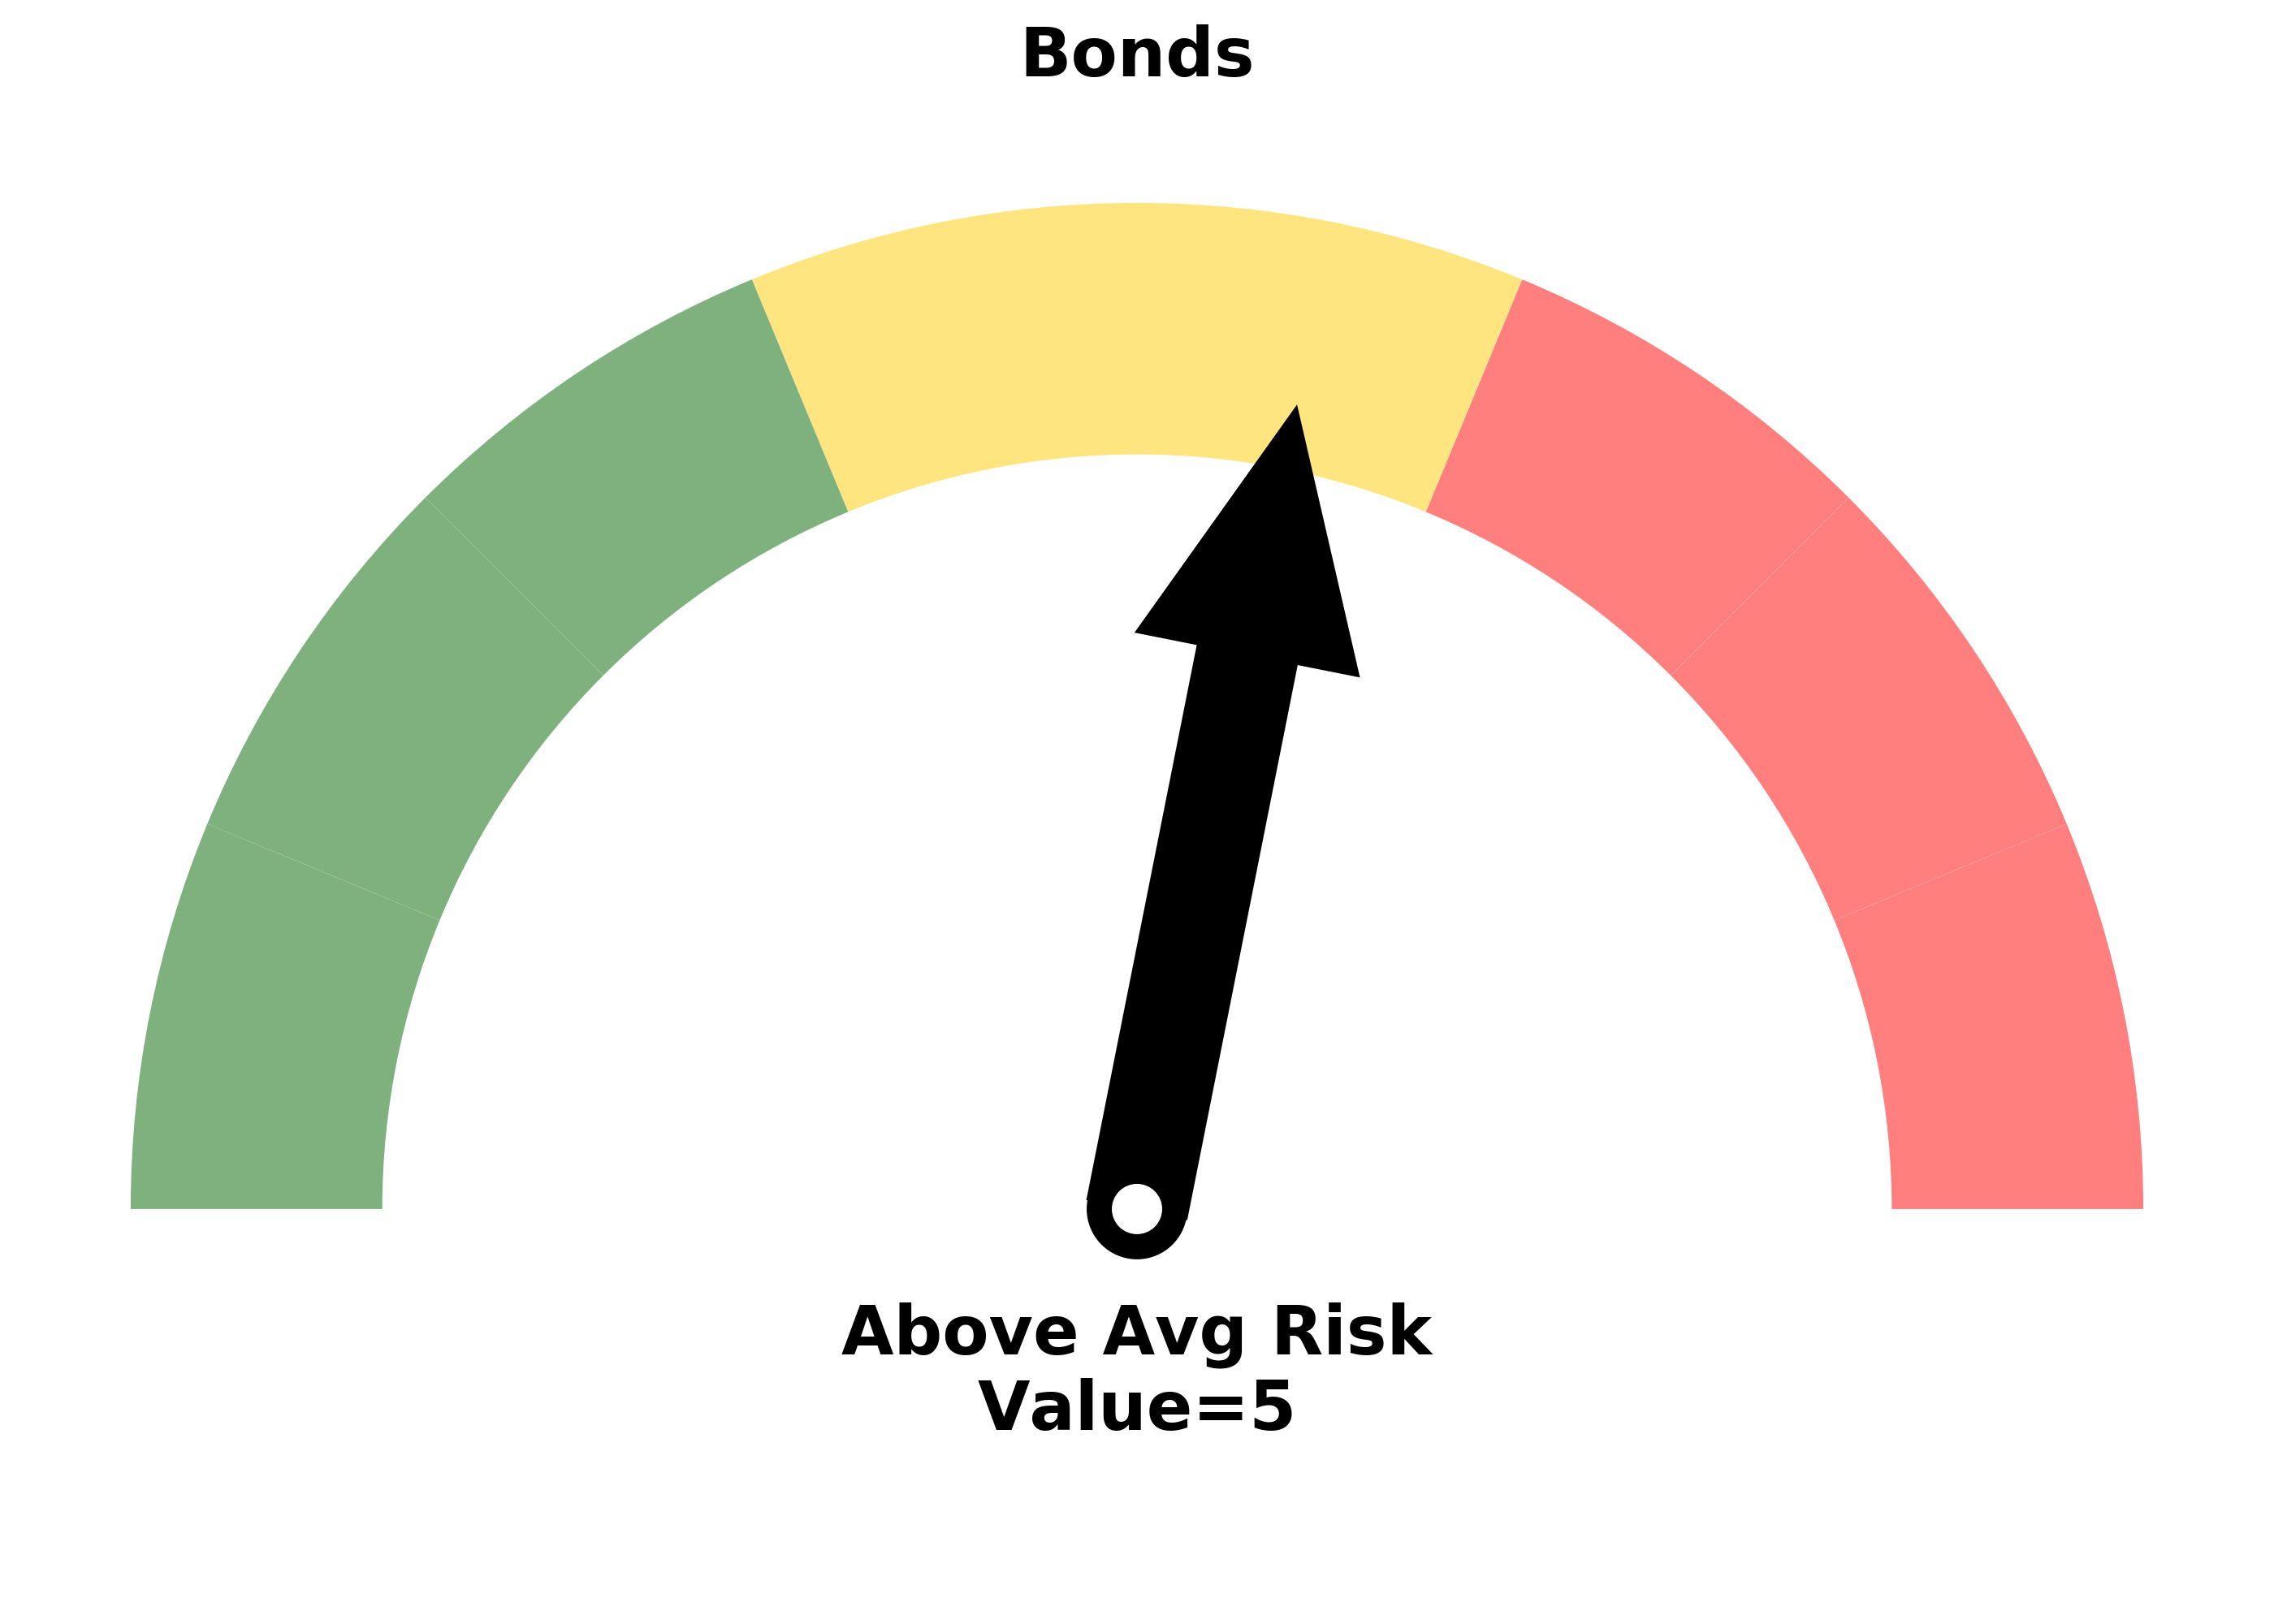
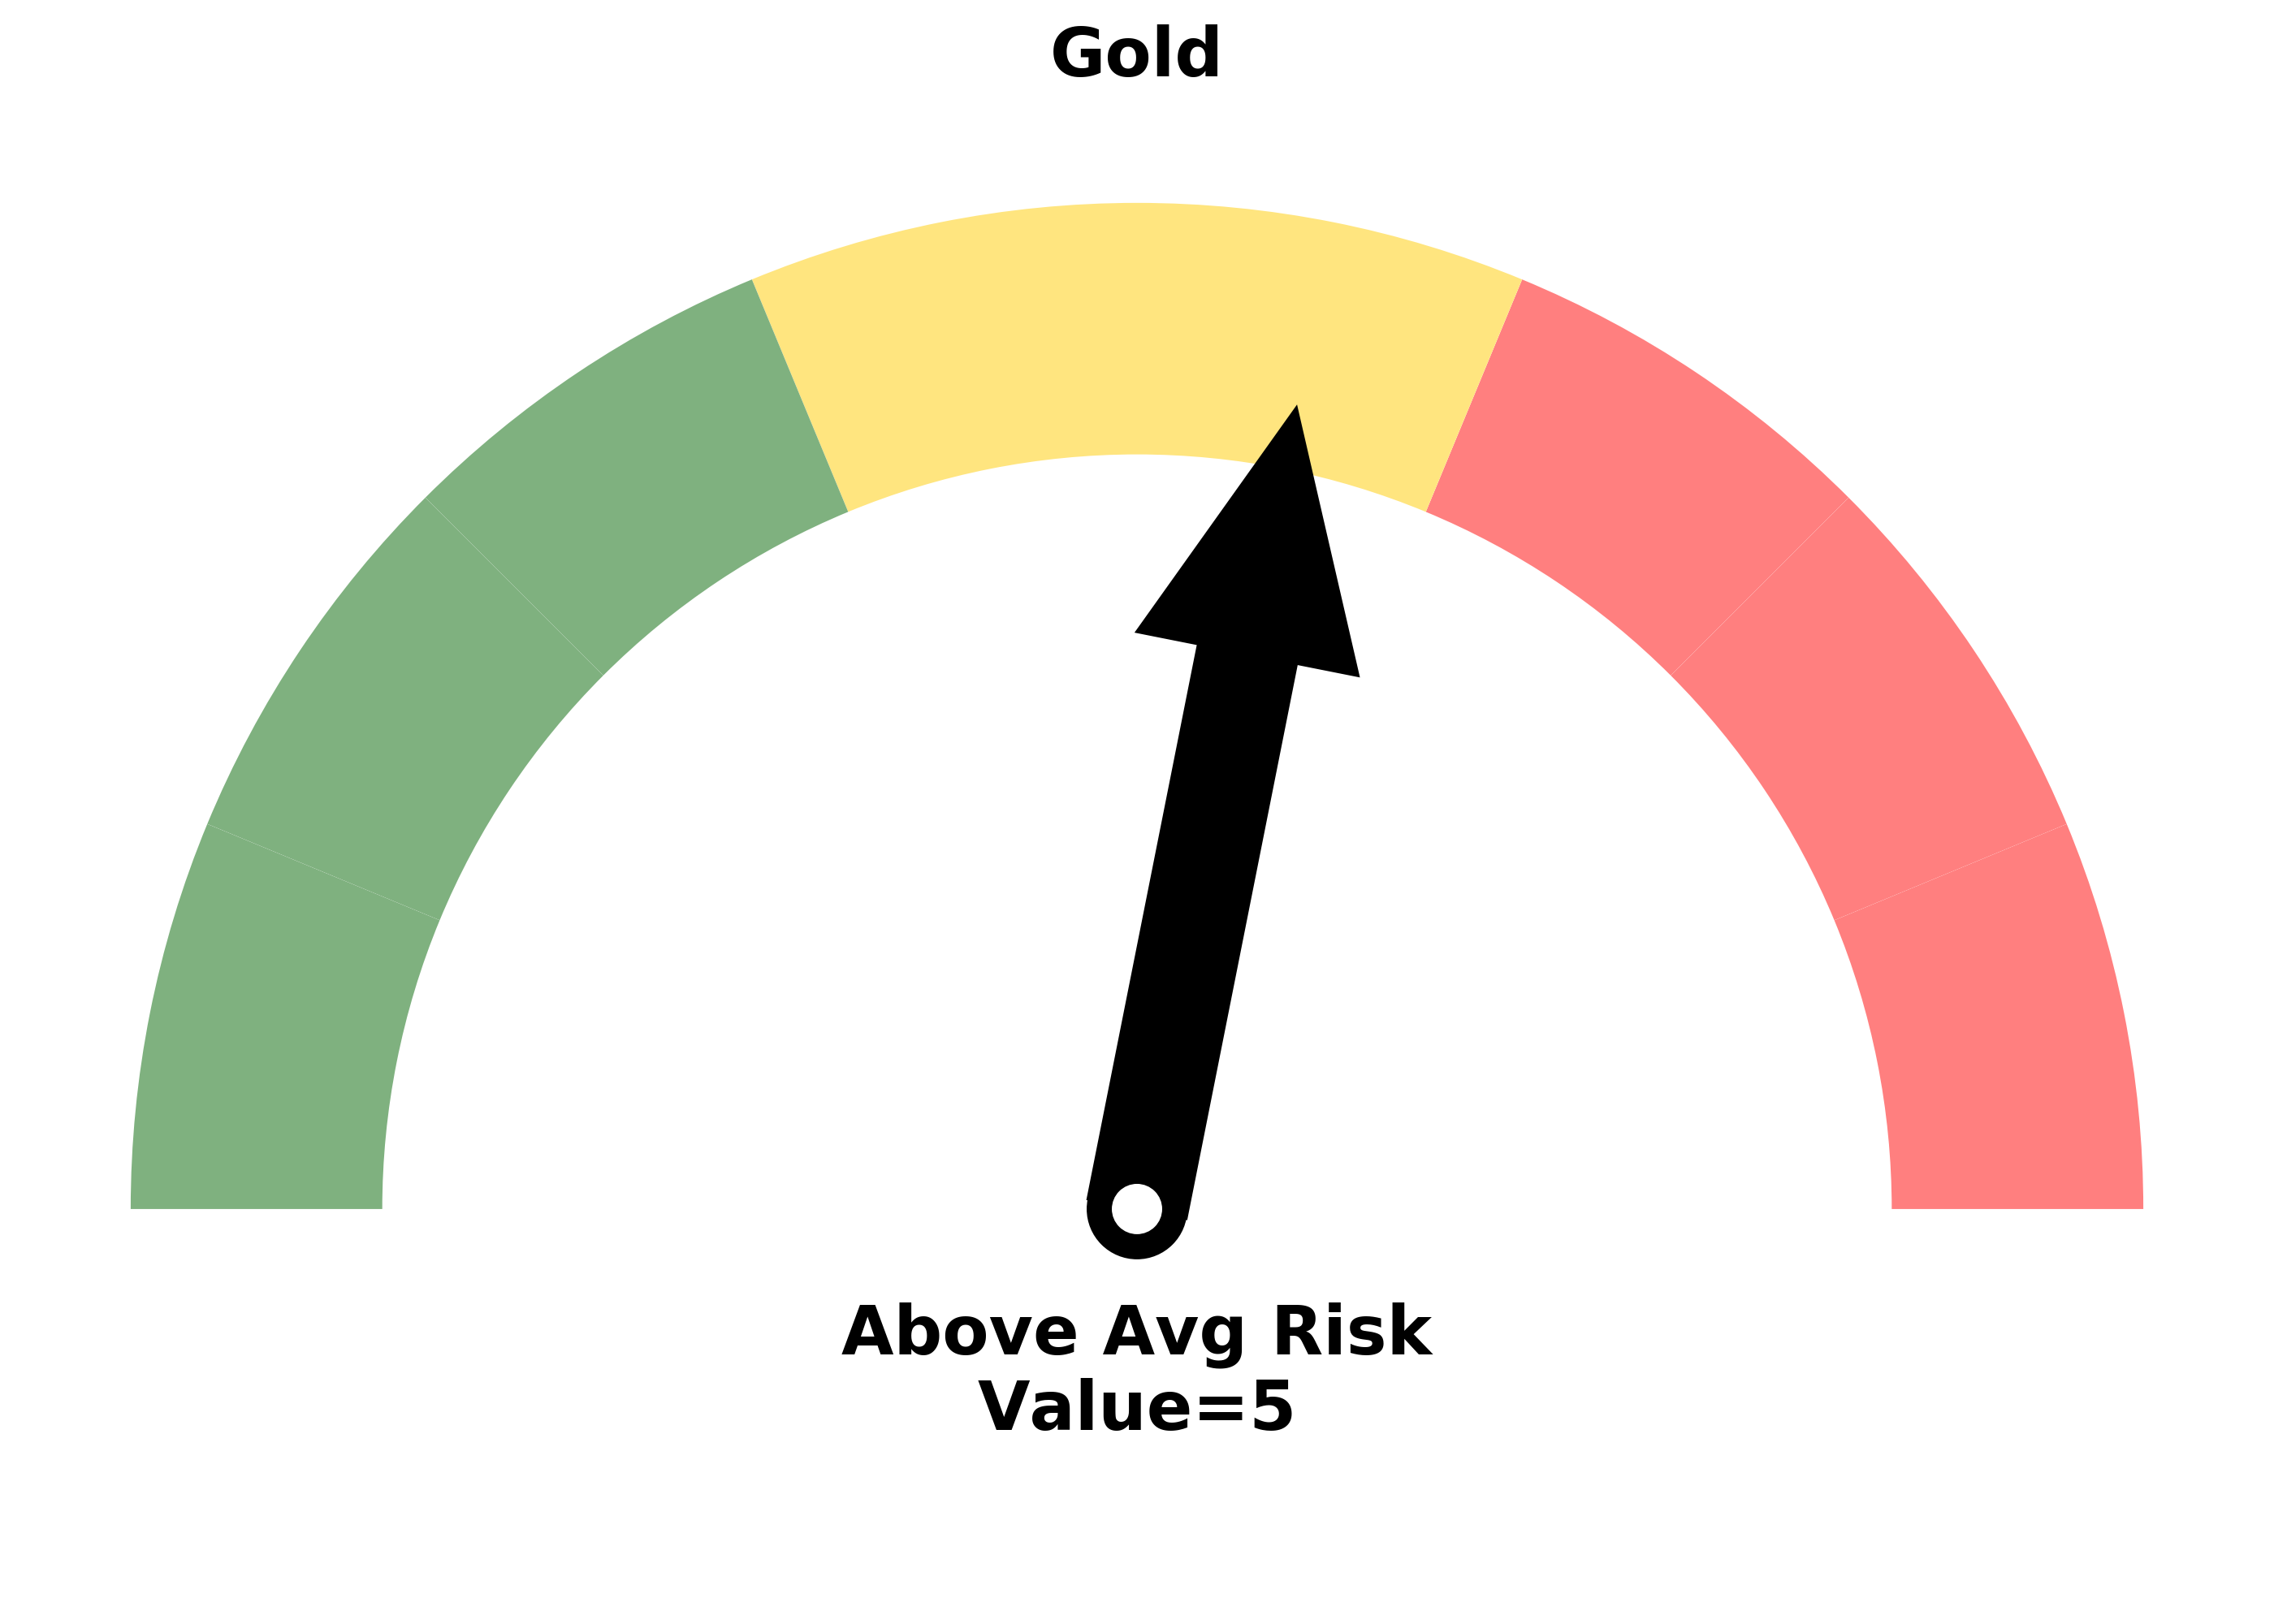
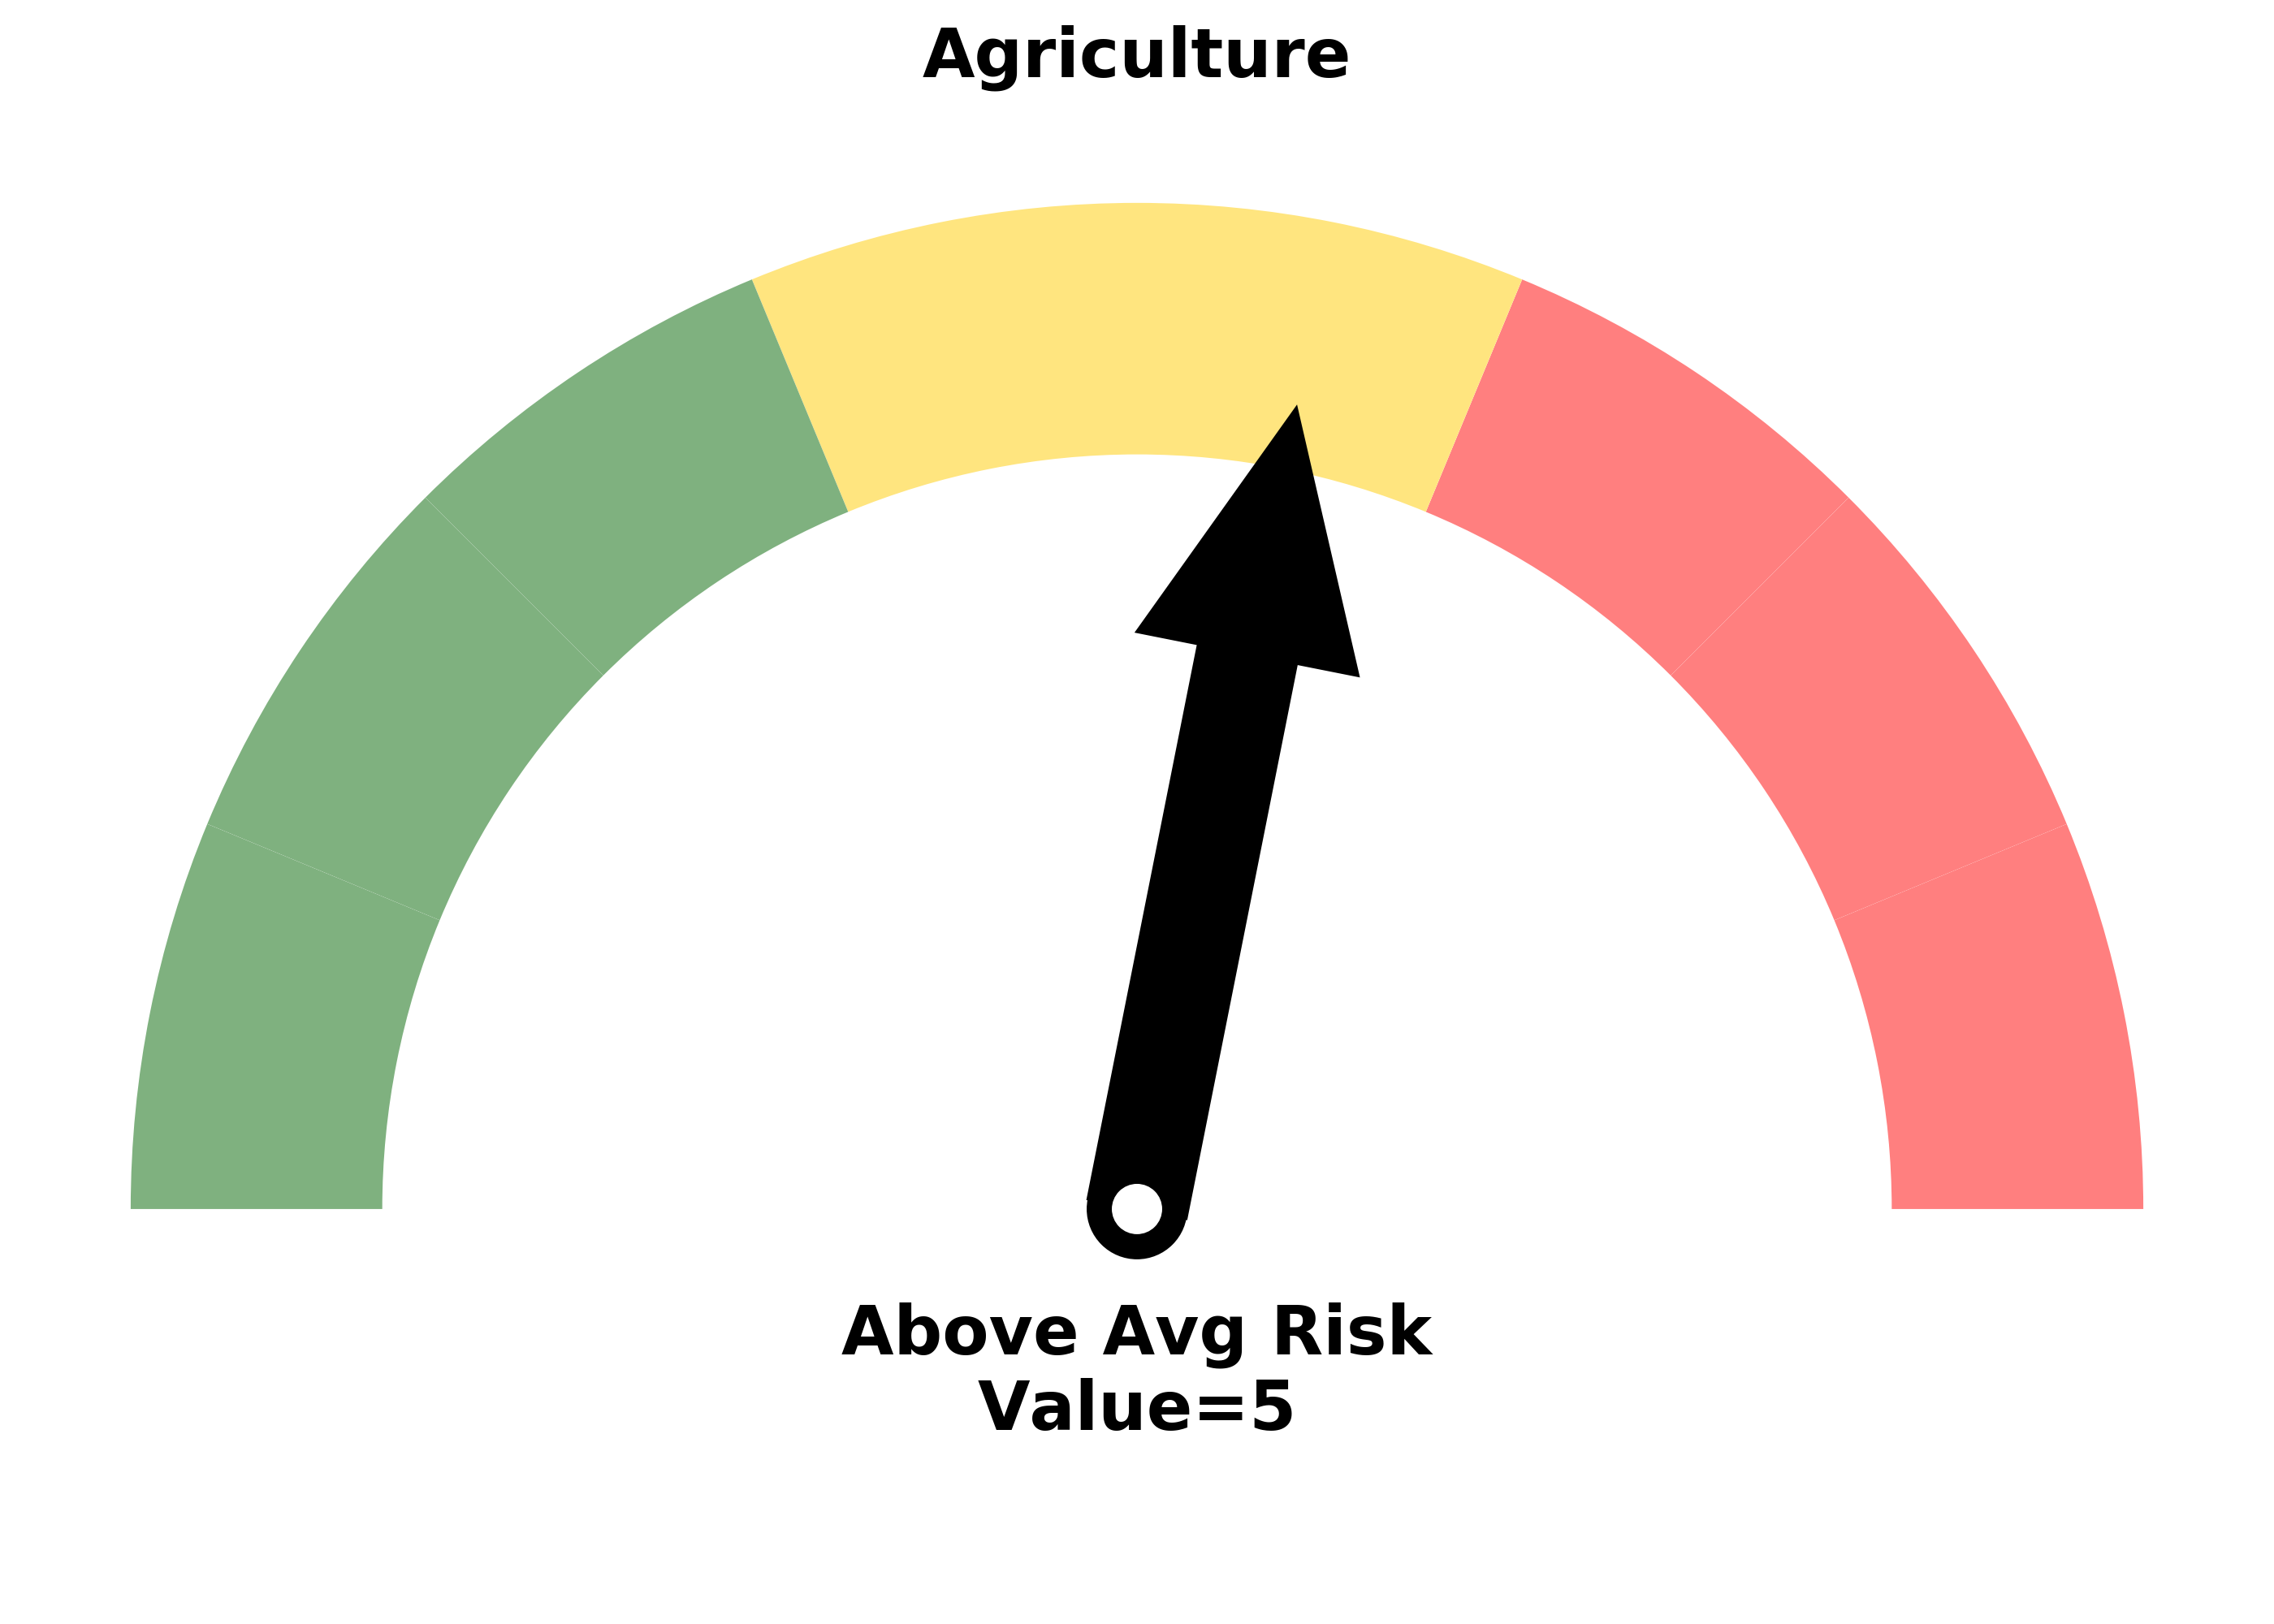
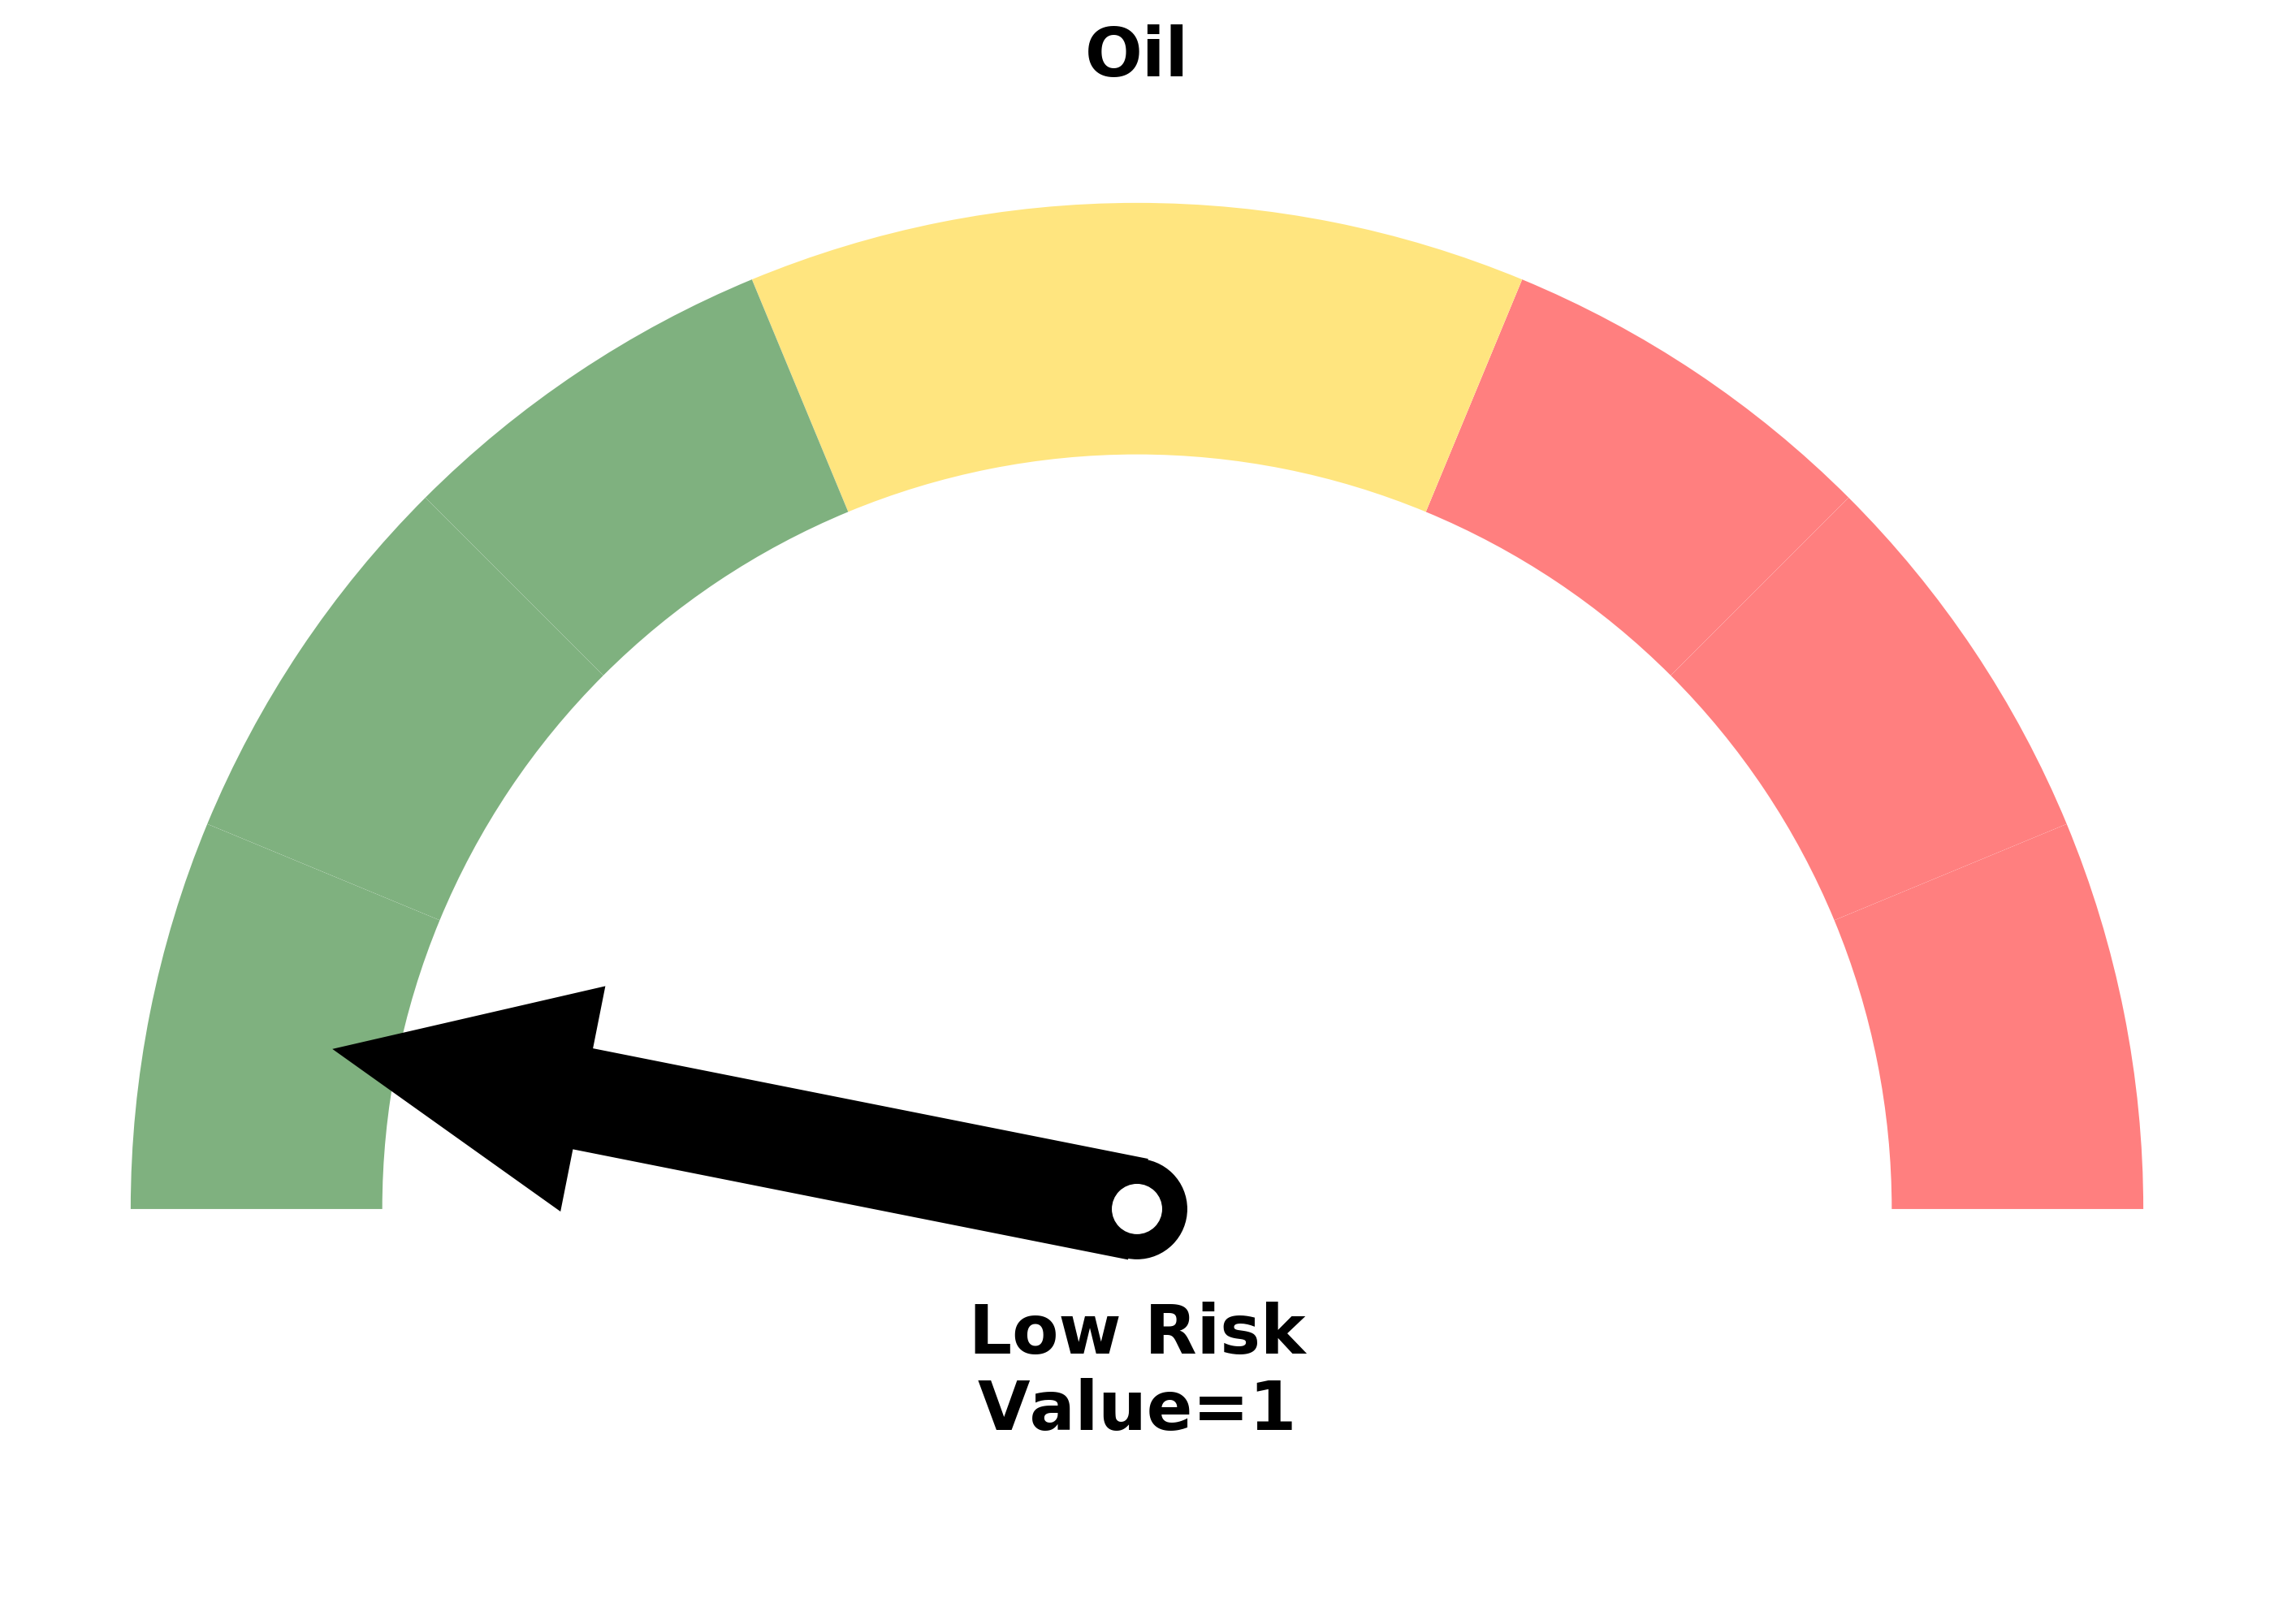
Risk Levels
Research
BOTTOM LINE
A simulated model of the VIX that goes back 60 years shows that volatility expectations are slowly easing. This SimVIX model just fell to a 5-day low after a near-record spike, which has preceded some short-term weakness in stocks, but longer-term strength.
FORECAST / TIMEFRAME
SPY -- Up, Long-Term
|
Volatility in March has been high, which is not news to anyone. In some of the studies we looked at, like the percentage gaps at the open of trading, volatility has never been higher.
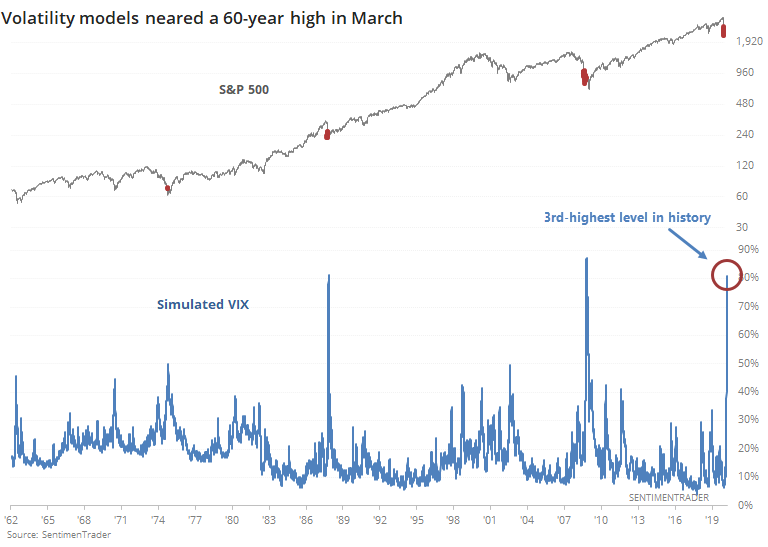
When thinking about volatility, most people gravitate toward the VIX "fear gauge." It's a handy measure for sure, but only goes back to 1990, or 1986 if we use the old calculation.
In the past, we've looked at a simulated VIX indicator that uses several different models to recreate what the VIX might have done if it existed at the time. Over the past couple of decades, the model has a 90% correlation to the VIX itself, so it's done a good job. Any model will have a hard time with outliers like the Black Monday crash in 1987 and this was no exception.
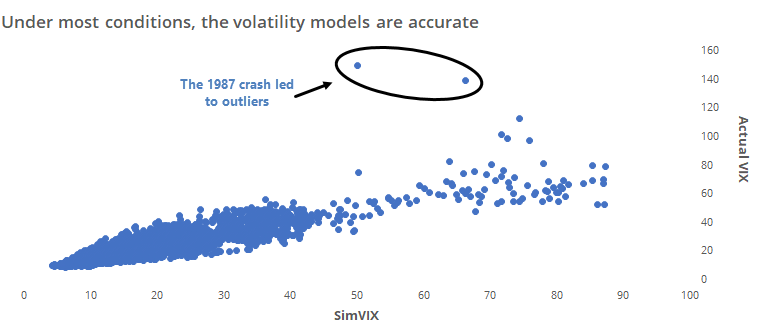
Any model is imperfect, but they at least give us some idea of what things might have looked like if the options-based creation had more history. For those who enjoy twisting their minds around arcane academic papers, here you go.
This simulated VIX (SimVIX) just peaked above 80%, which was barely eclipsed by a few days in 1987 and 2008.
The key term there might be "peaked." The SimVIX has gone from its highest level in years to a 5-day low as of Tuesday.
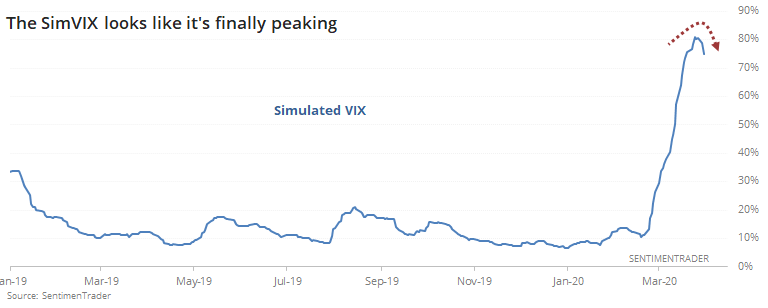
A 5-day low might seem insignificant, but when this indicator turns from an extreme, it has tended to keep going longer-term.
For stocks, this typically meant a lot of shorter-term swings, usually to the downside, while hammering out important low points.
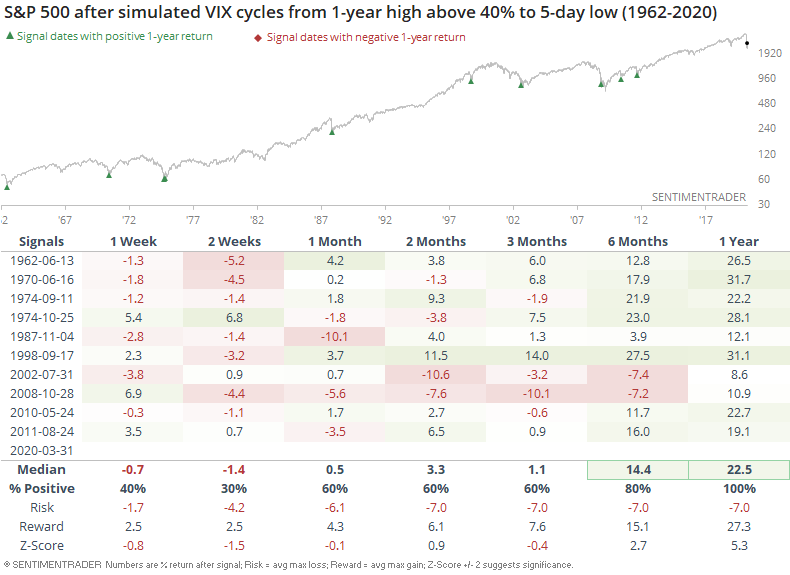
The next couple of weeks in the S&P were painful a few times, and in 2002 and 2008, it lasted even longer. But those lower lows didn't last long, and over the next 6-12 months, it was almost all upside.
For volatility itself, it's not a big surprise that these moves rarely led to even higher volatility going forward. Only once, in 1974, did it do an about-face and exceed its prior high.
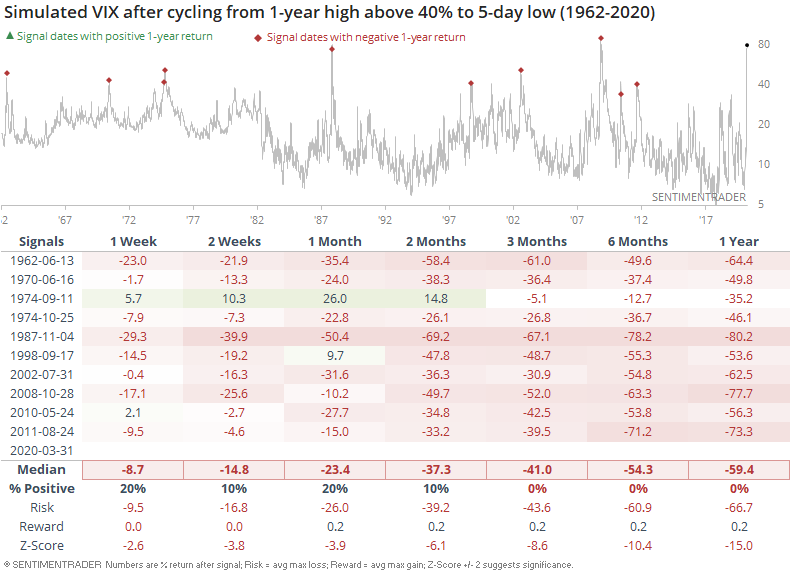
The past few weeks have seen all kinds of "never seen before" developments, but as far as we can rely on historical behavior, this easing of volatility after such a severe spike should be more good news.
BOTTOM LINE
Sentiment typically moves with price, and now that stocks are bouncing back from extreme oversold conditions, sentiment is also bouncing back from extremes.
FORECAST / TIMEFRAME
|
The stock market's once in a lifetime crash (-35% in just a few weeks from all-time highs) pushed many sentiment indicators to historic extremes. With stocks rallying right now, those sentiment indicators are also starting to bounce back from such extreme readings.
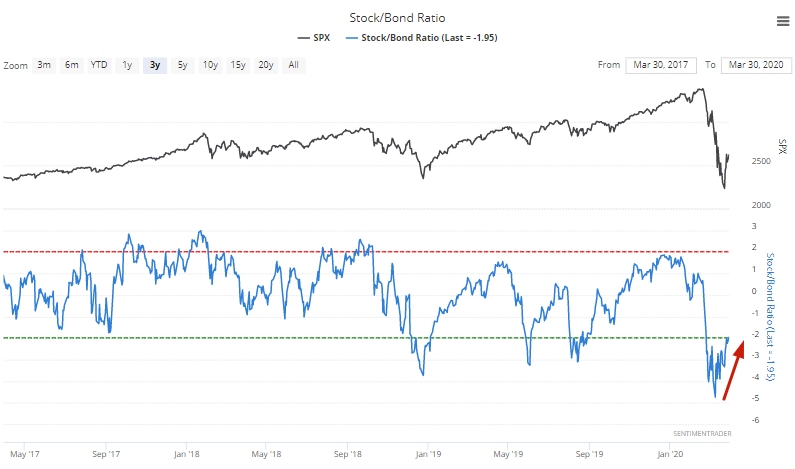
The Stock/Bond Ratio has risen above -2 for the first time in weeks: -2 is our threshold for excessive pessimism.
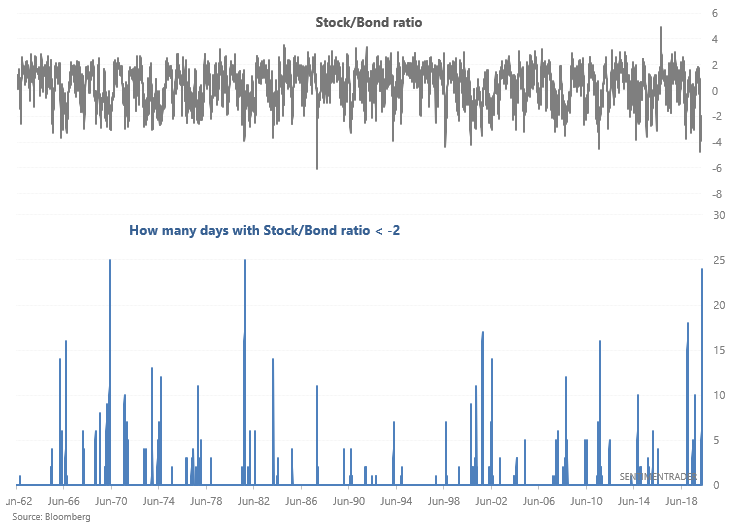
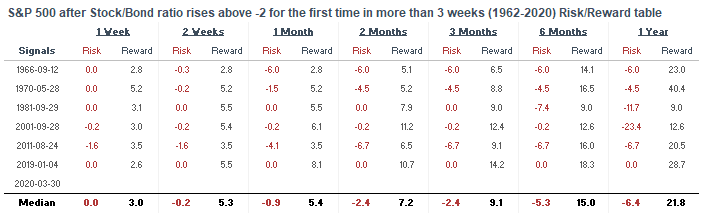
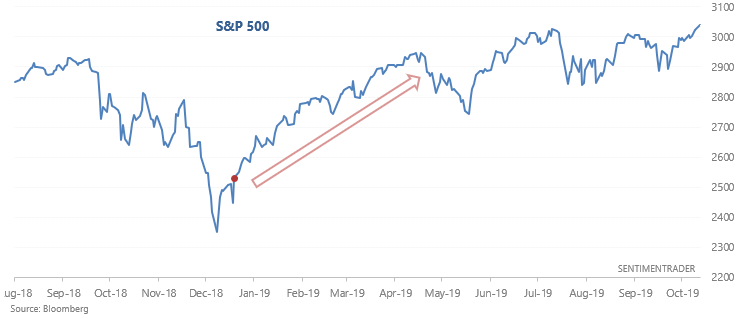
When the Stock/Bond ratio rose above -2 for the first time in more than 3 weeks (i.e. first time in a long time without excessive pessimism), the S&P always rallied significantly over the next 2-3 months:
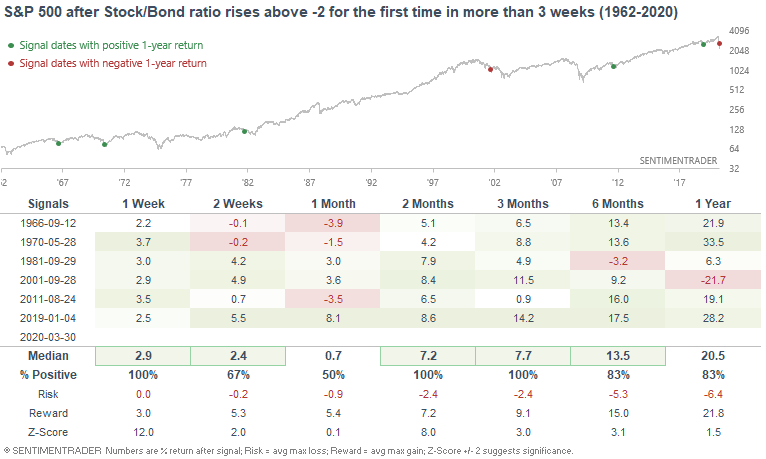
The most common pattern was for the stock market to rally more before retesting or making new lows. HOWEVER, it is not impossible for the market's bottom to be in already. This was clearly the case in January 2019, when the S&P went straight up.
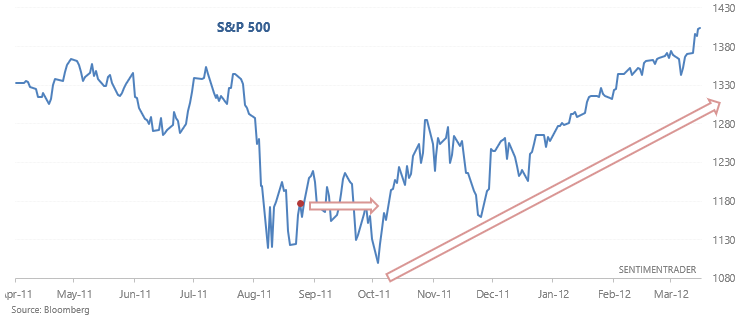
But this was not the case in 2011. The S&P rallied a little more before retesting the lows:
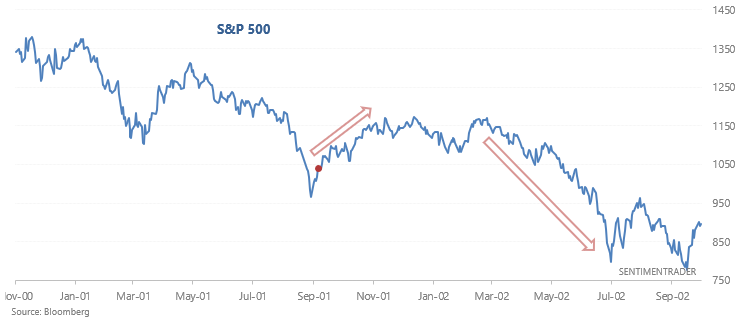
Since the September 2001 case was in a bear market, the S&P rallied more before falling to much lower lows.
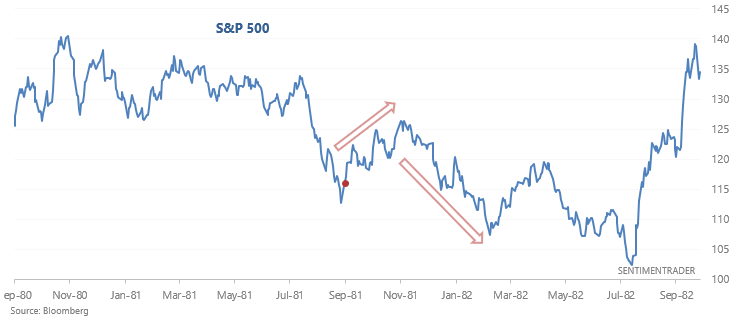
Same thing in September 1981: the S&P rallied further before making new lows.
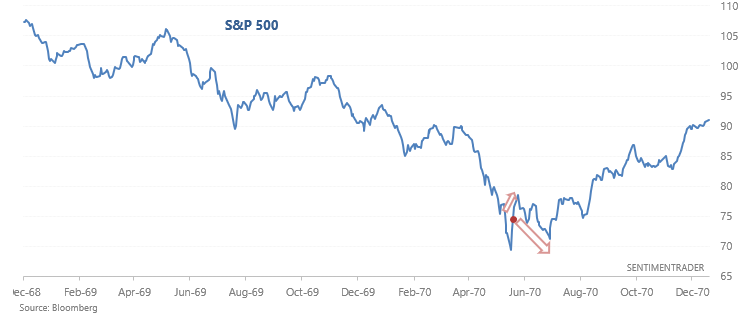
In May 1970 the S&P rallied a little more before almost retesting the lows:
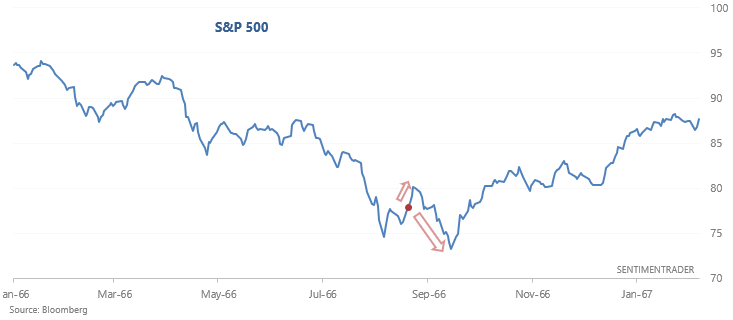
And in September 1966 the S&P rallied a little more before making marginal new lows.
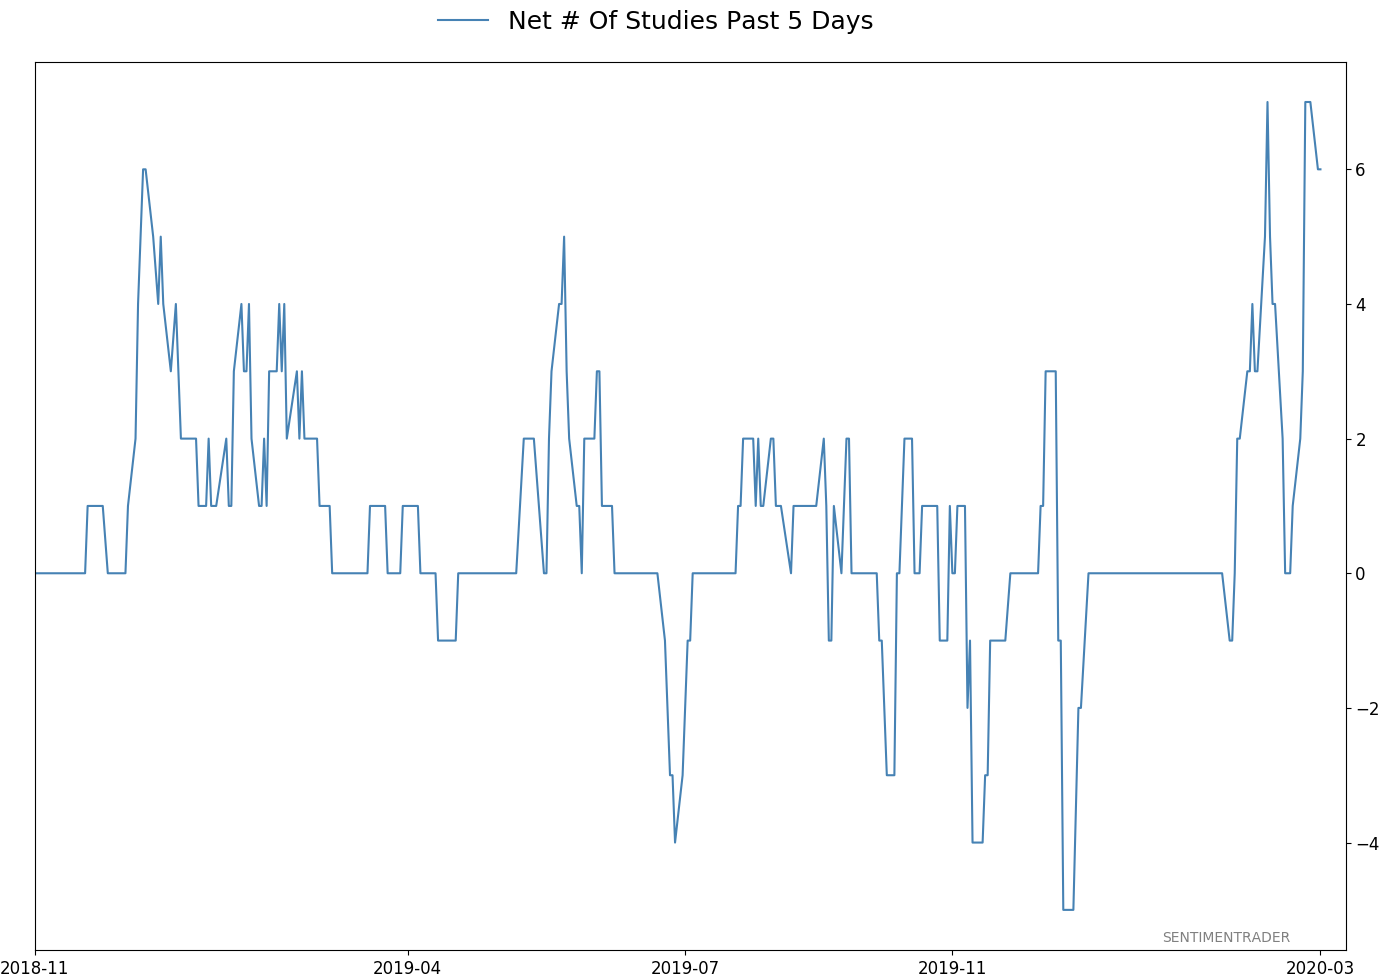
Active Studies
| Time Frame | Bullish | Bearish | | Short-Term | 0 | 2 | | Medium-Term | 16 | 14 | | Long-Term | 32 | 3 |
|
Indicators at Extremes
Portfolio
| Position | Weight % | Added / Reduced | Date | | Stocks | 73.2 | Added 31.3% | 2020-03-17 | | Bonds | 0.0 | Reduced 6.7% | 2020-02-28 | | Commodities | 5.5 | Added 2.4%
| 2020-02-28 | | Precious Metals | 0.0 | Reduced 3.6% | 2020-02-28 | | Special Situations | 0.0 | Reduced 31.9% | 2020-03-17 | | Cash | 21.3 | | |
|
Updates (Changes made today are underlined)
In the first months of the year, we saw manic trading activity. From big jumps in specific stocks to historic highs in retail trading activity to record highs in household confidence to almost unbelievable confidence among options traders. All of that has come amid a market where the average stock can’t keep up with their indexes. There were signs of waning momentum in stocks underlying the major averages, which started triggering technical warning signs in late January. The kinds of extremes we saw in December and January typically take months to wear away, but the type of selling we’ve seen over the past month has gone a long way toward getting there. When we place the kind of moves we saw into March 23 into the context of coming off an all-time high, there has been a high probability of a multi-month rebound. The volatility we’ve seen lately is extremely compelling from a medium-term point of view. Virtually everything we’ve looked at suggests a strong probability of gains over the next several months, even within the context of a potential bear market, and even from what had been higher prices. After stocks bottomed on the 23rd, they enjoyed a historic buying thrust. While other signs are mixed at best that panic is subsiding, that thrust is one of the most encouraging sign we've seen in years. There is often a test of a panic low in the weeks after an initial recovery, but that thrust we saw, combined with the larger-than-usual retracement, have me less convinced a test is necessary. For now, I see no overwhelming reason to add or reduce exposure.
RETURN YTD: -16.3% 2019: 12.6%, 2018: 0.6%, 2017: 3.8%, 2016: 17.1%, 2015: 9.2%, 2014: 14.5%, 2013: 2.2%, 2012: 10.8%, 2011: 16.5%, 2010: 15.3%, 2009: 23.9%, 2008: 16.2%, 2007: 7.8%
|
|
Phase Table
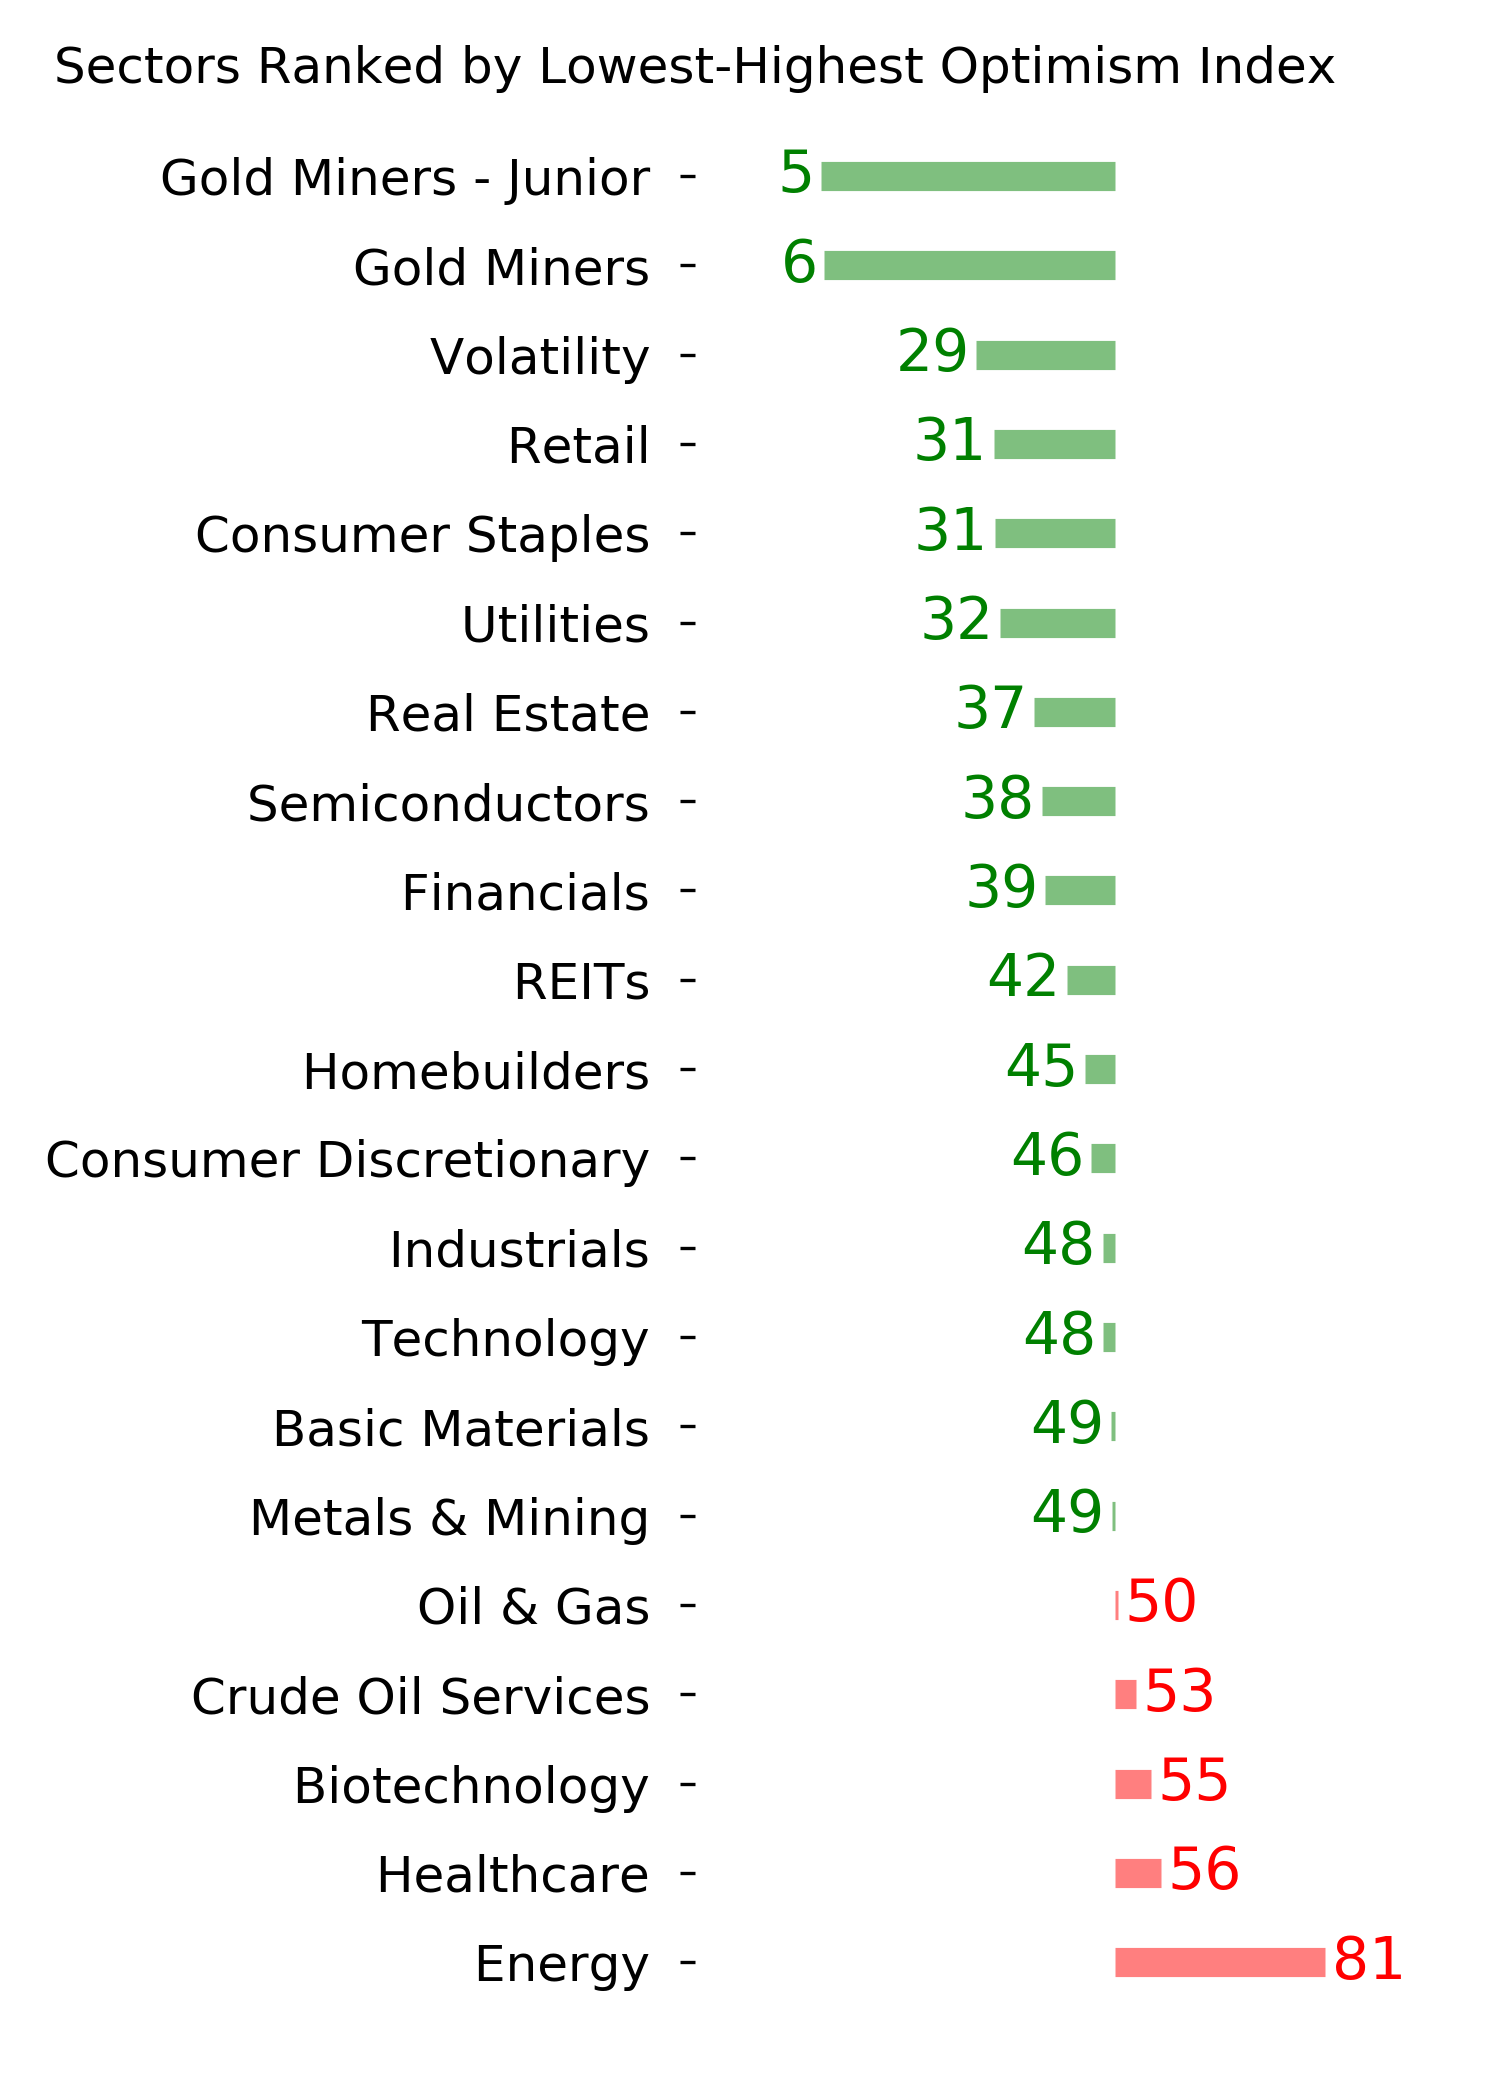
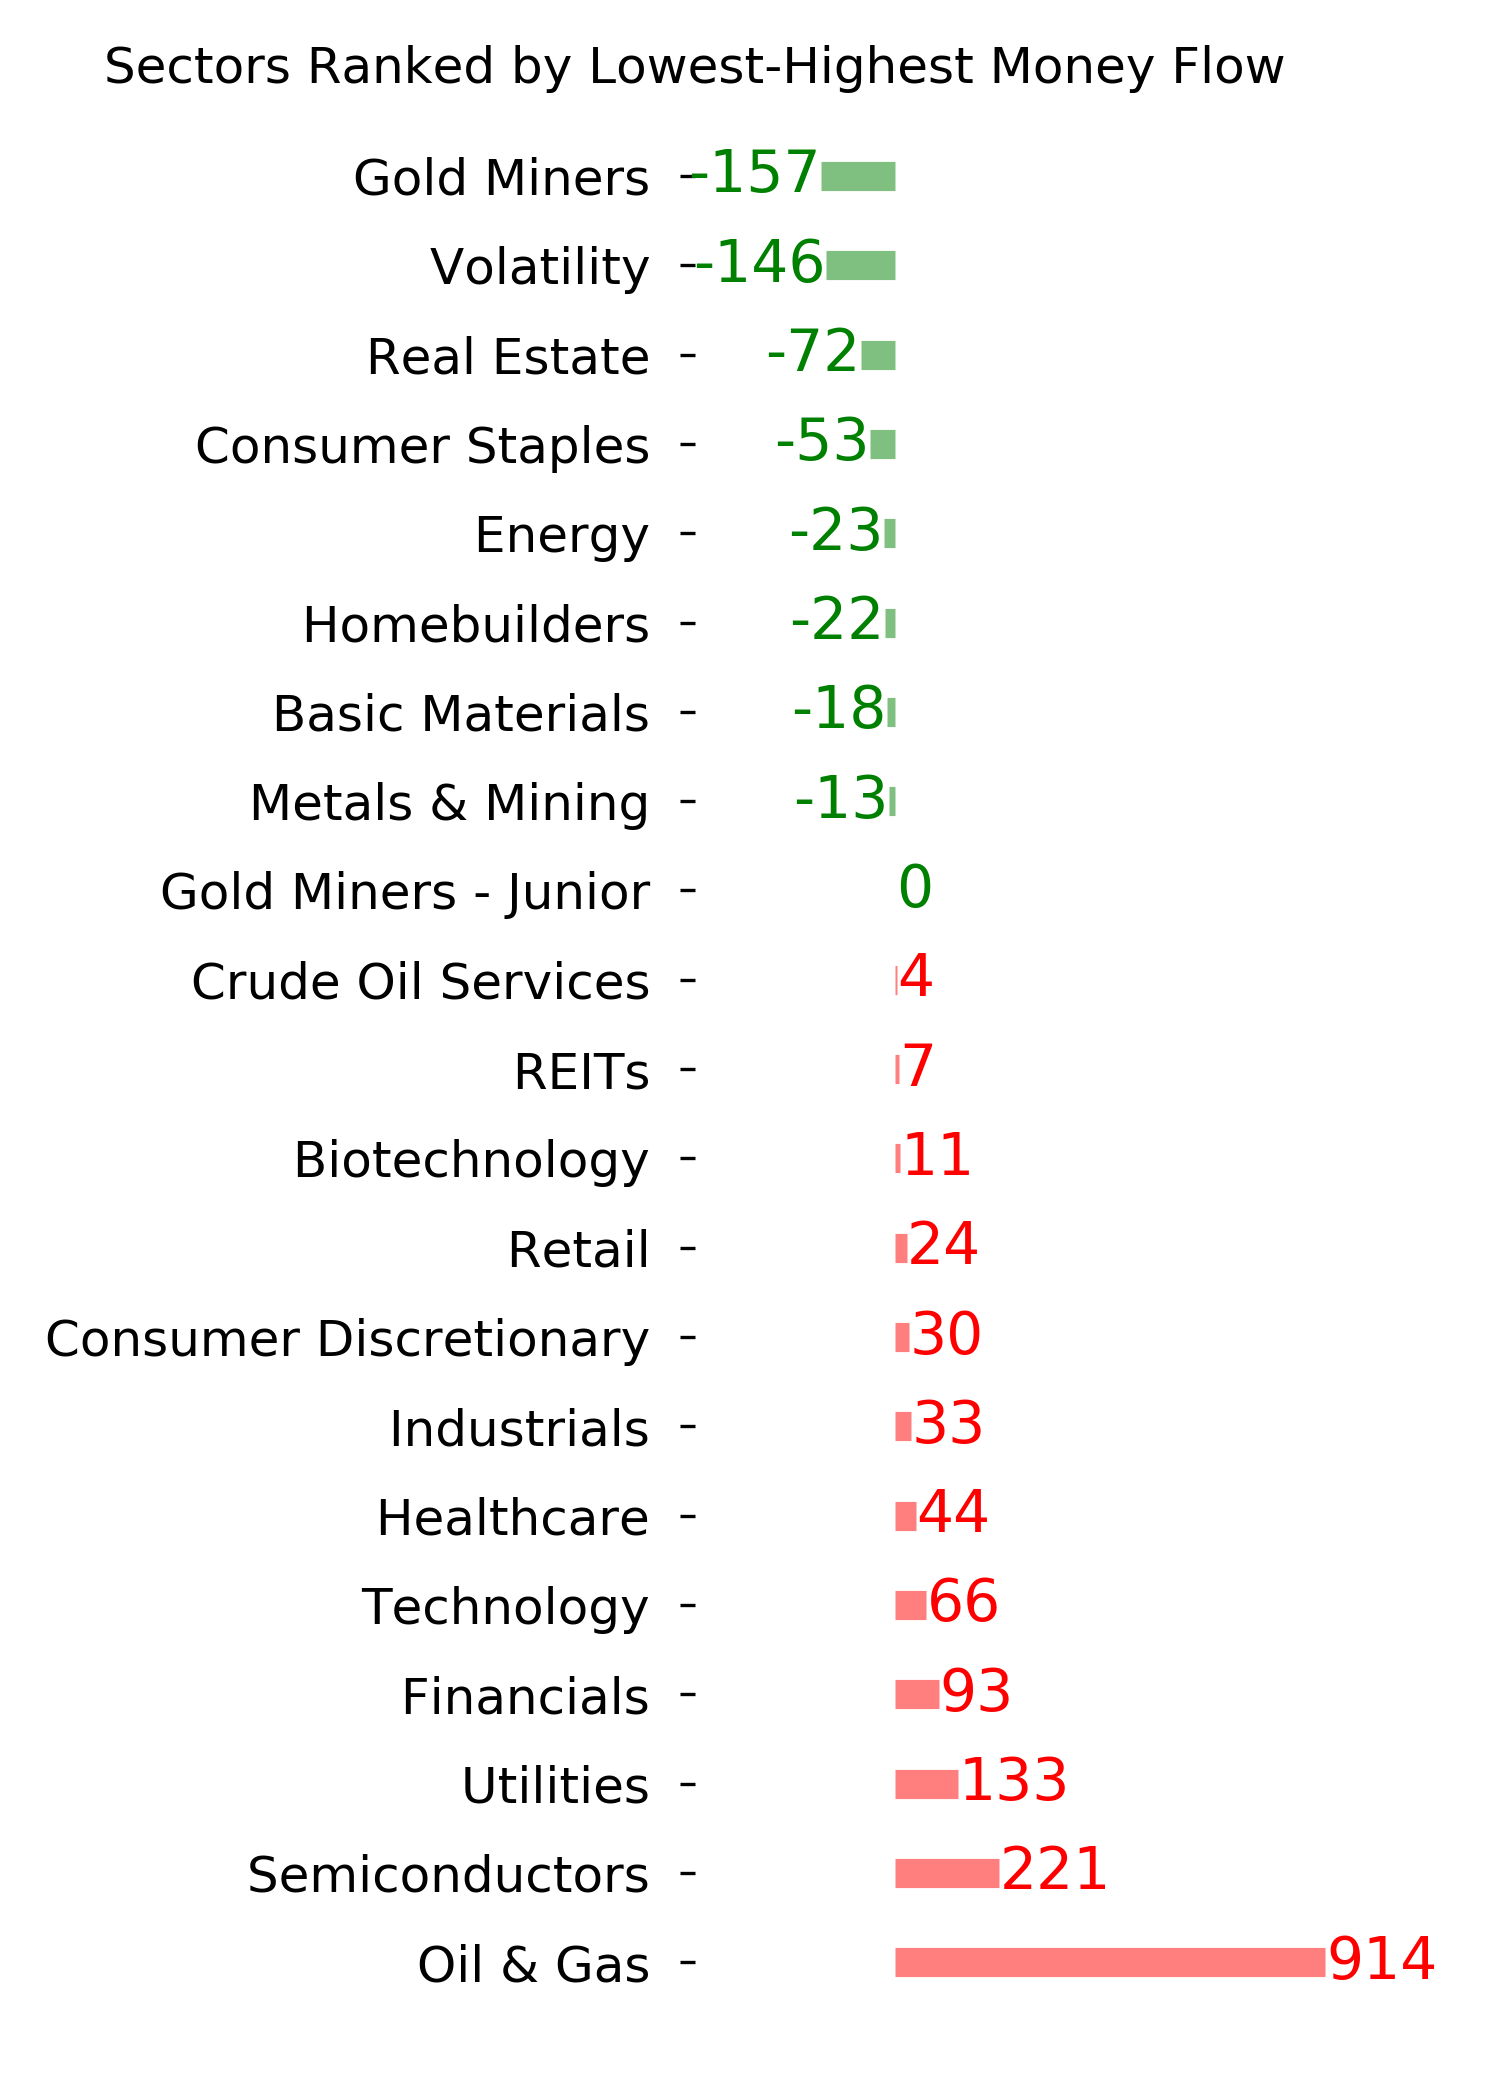
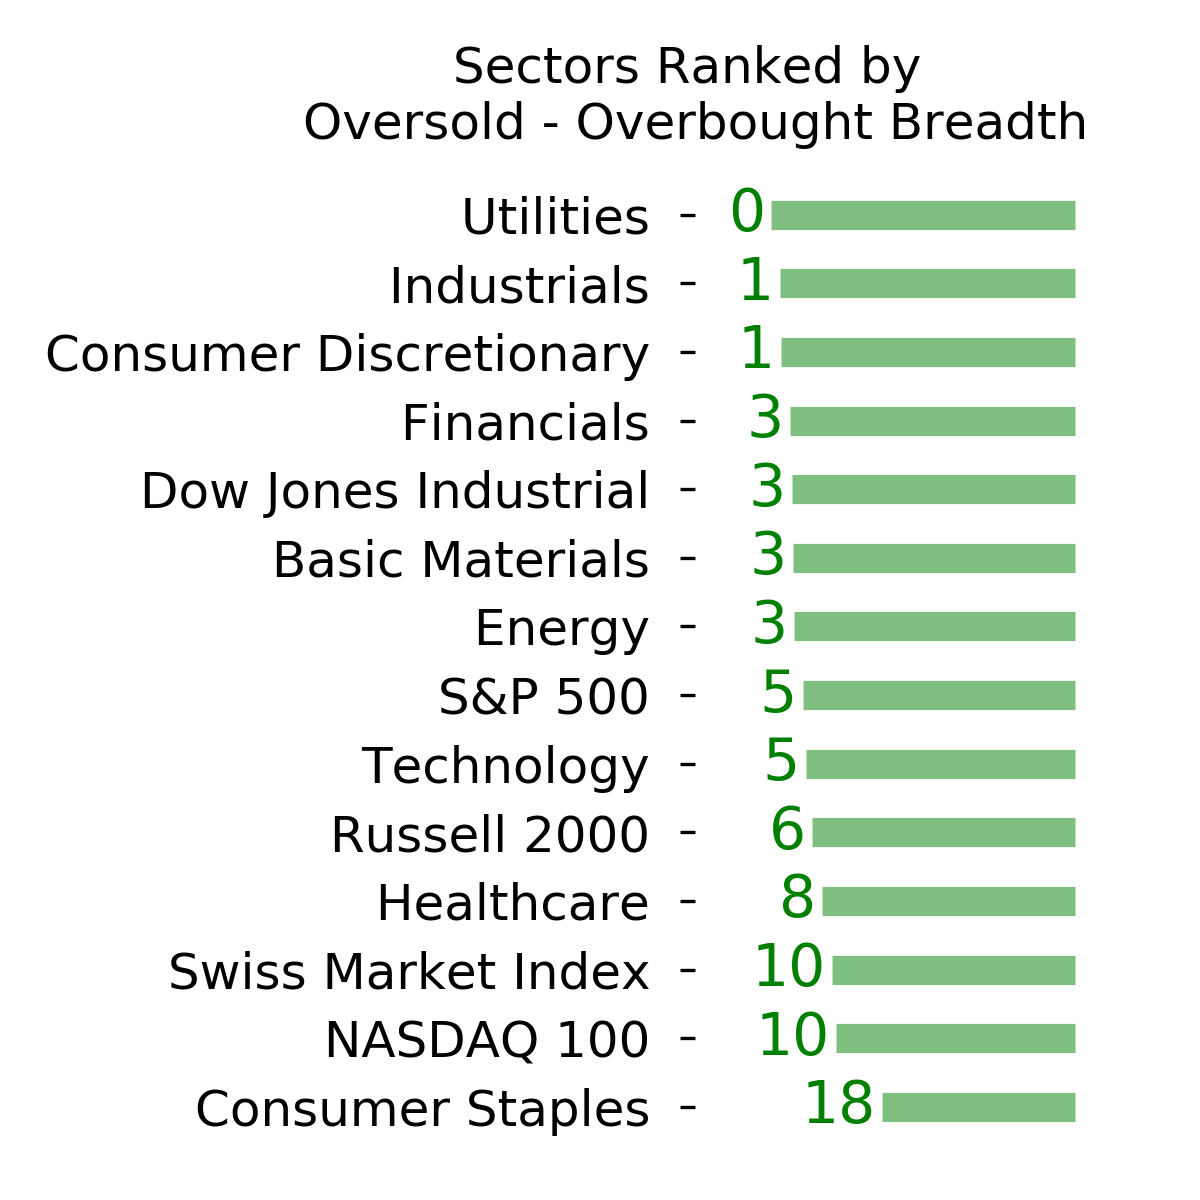
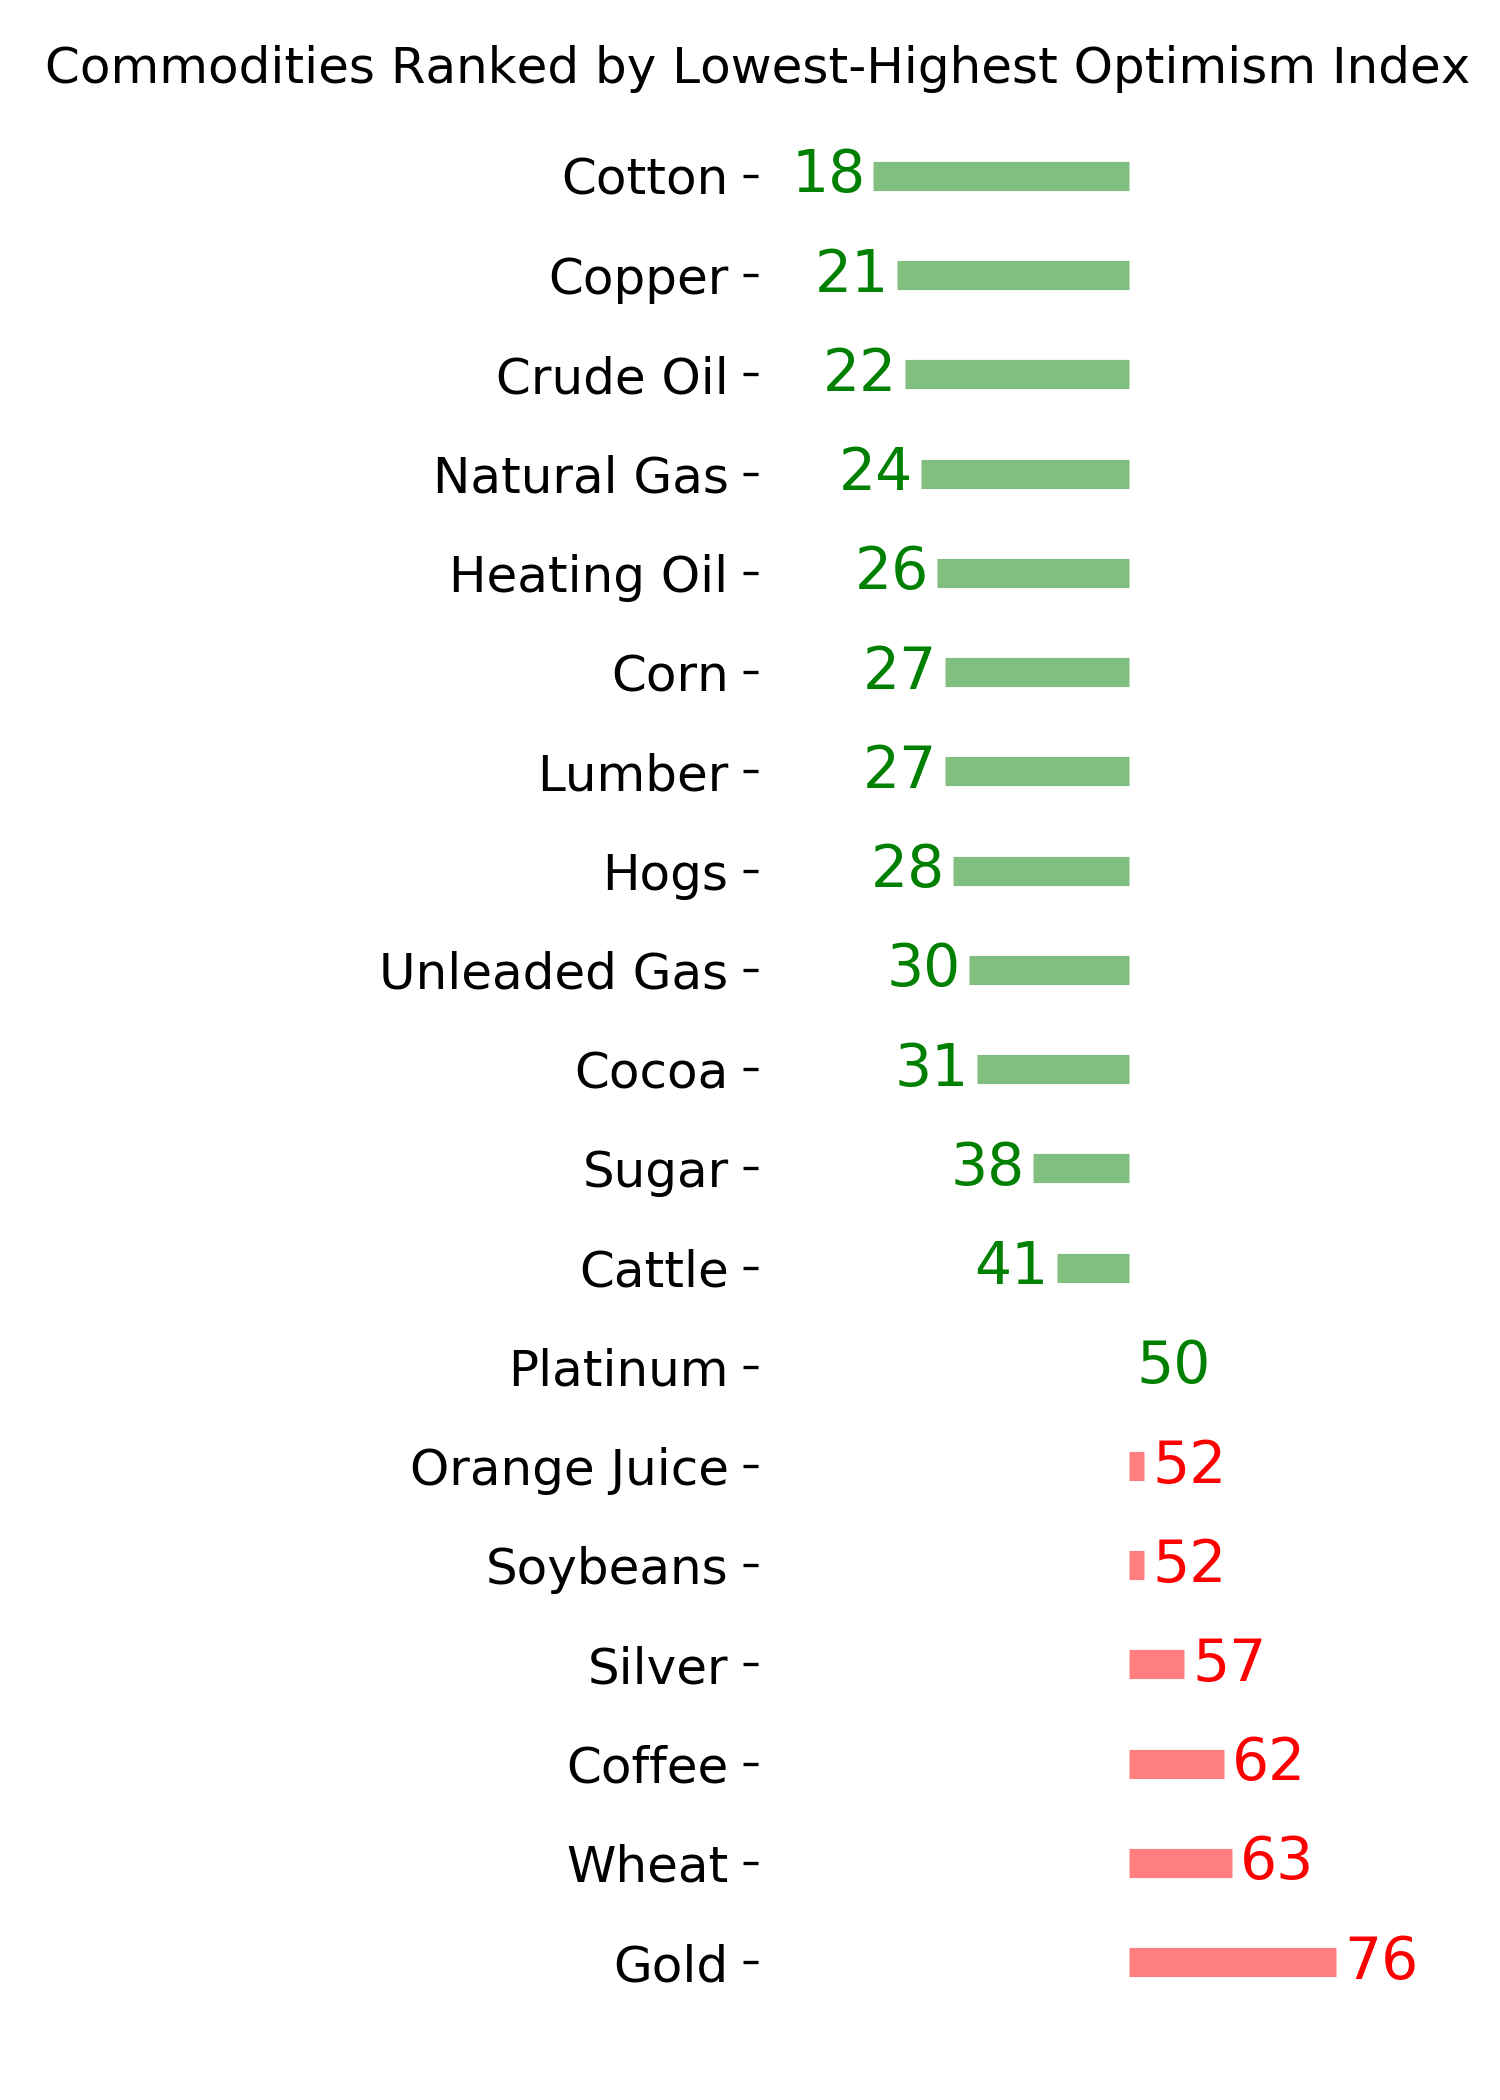
Ranks
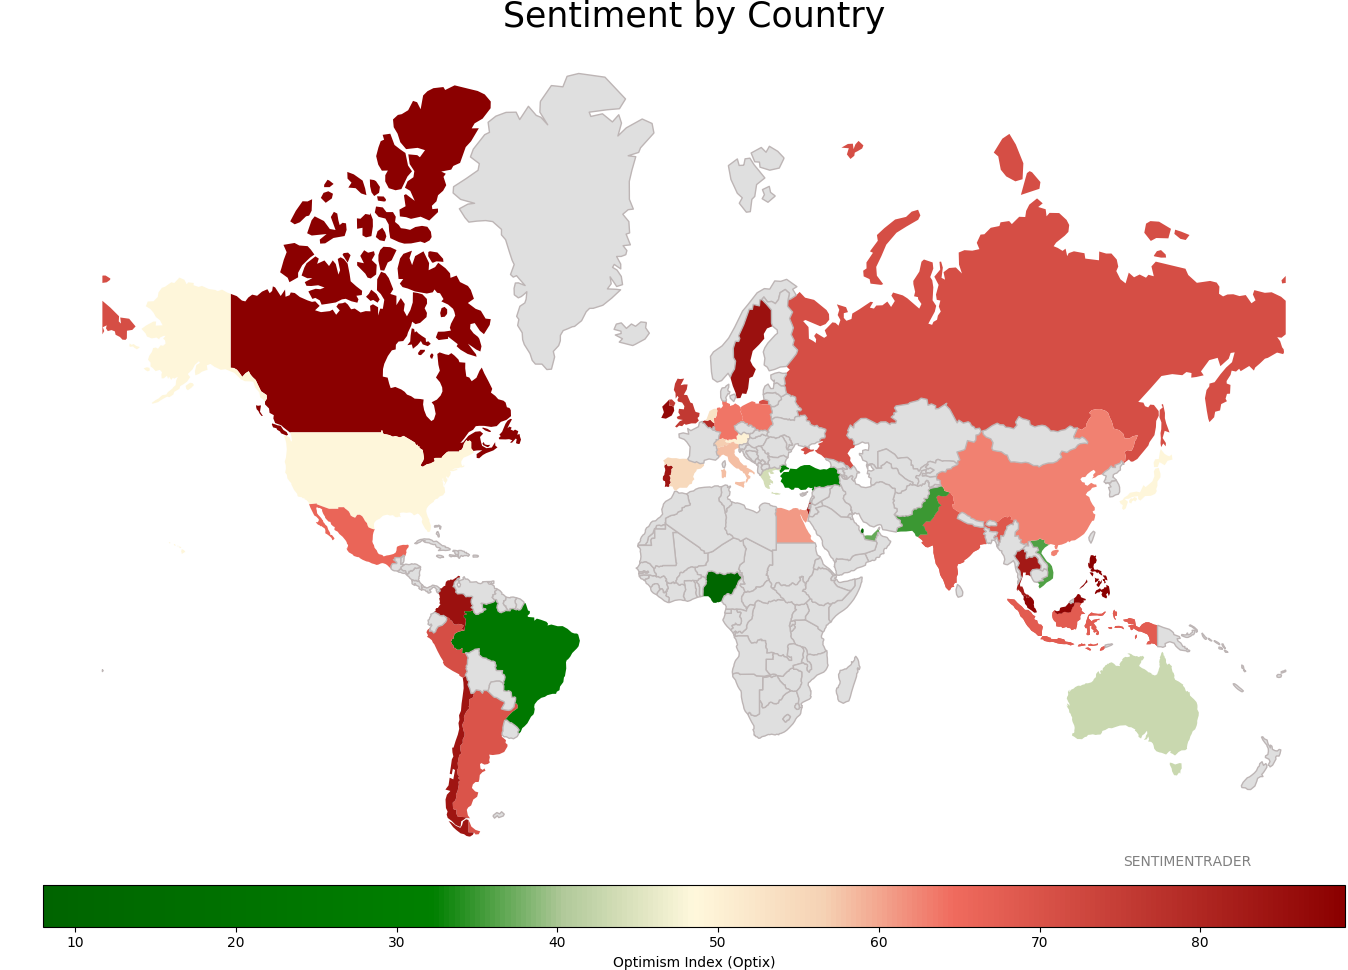
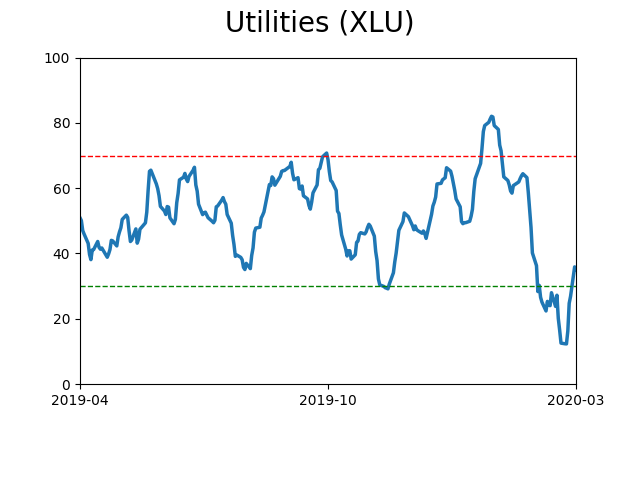
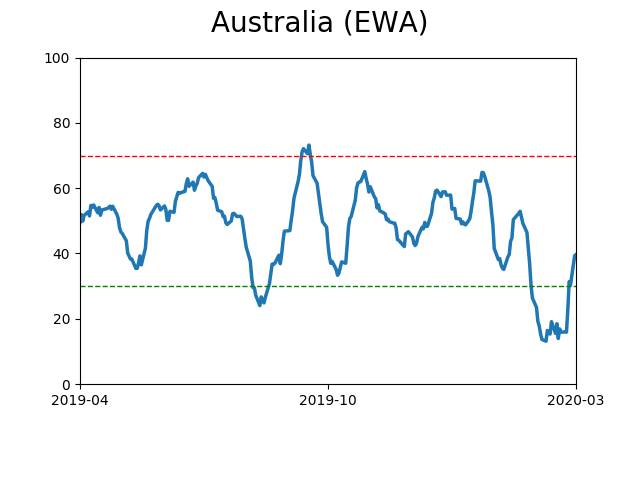
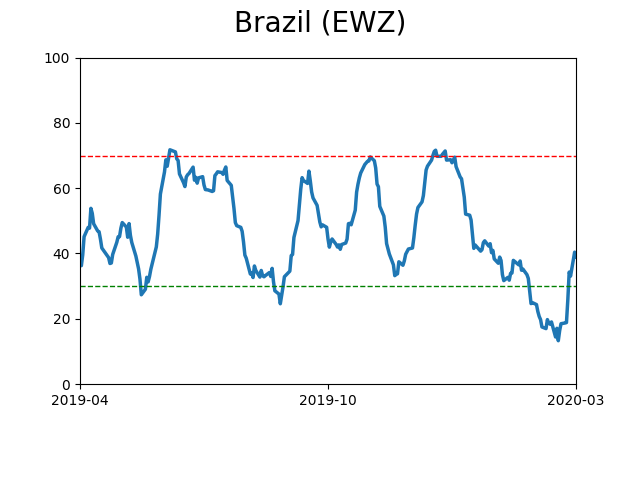
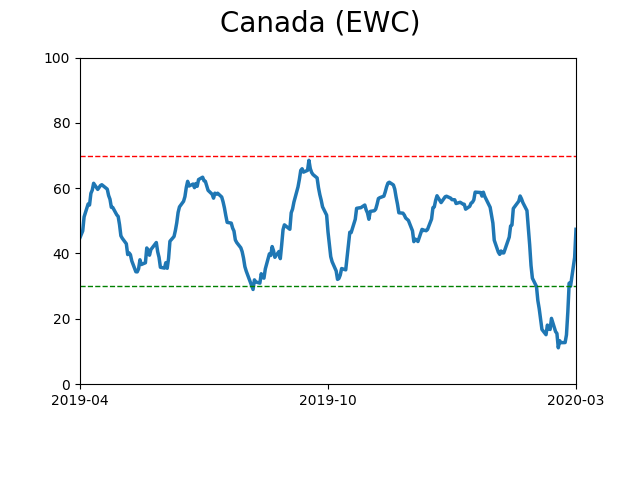
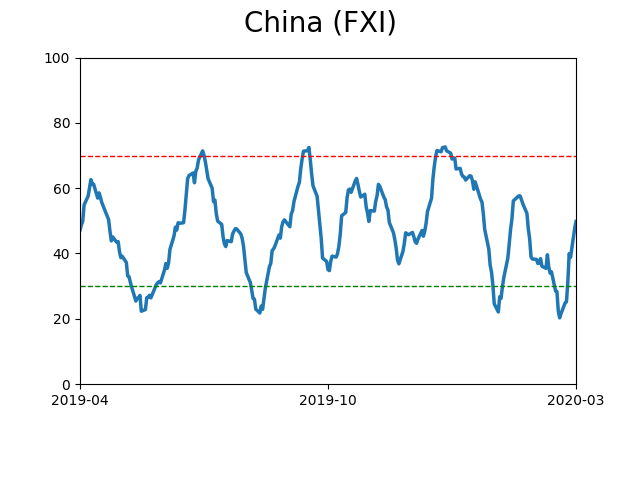
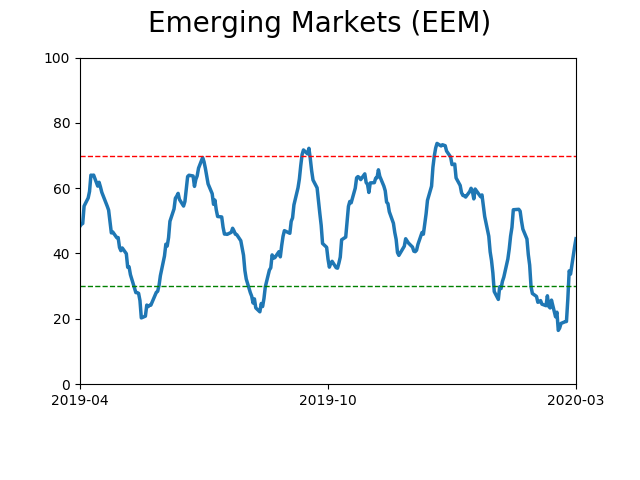
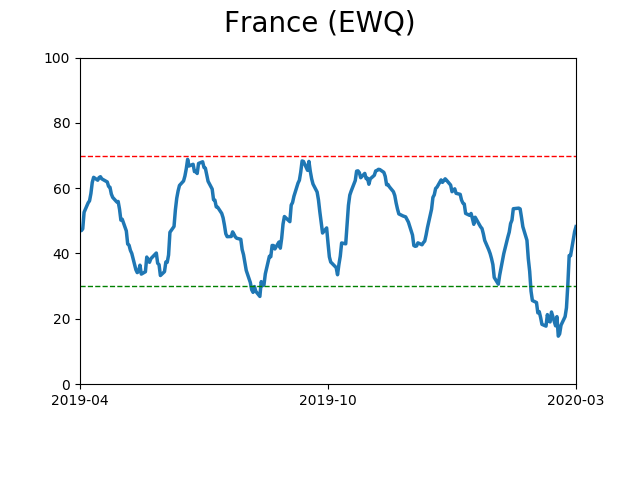
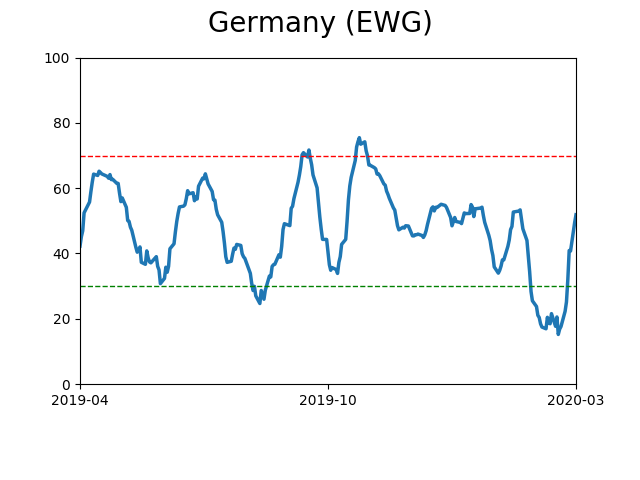
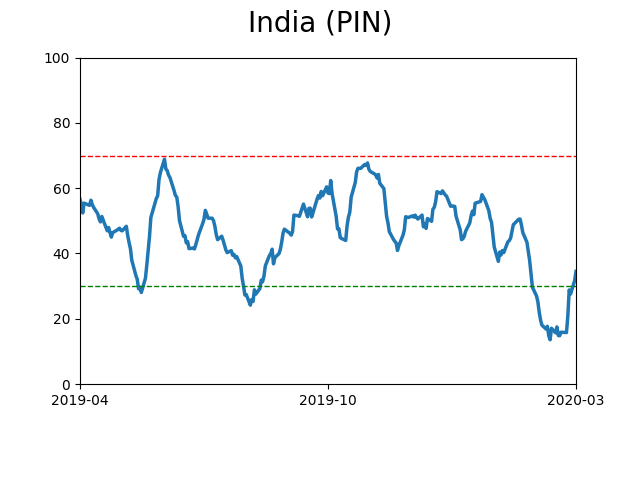
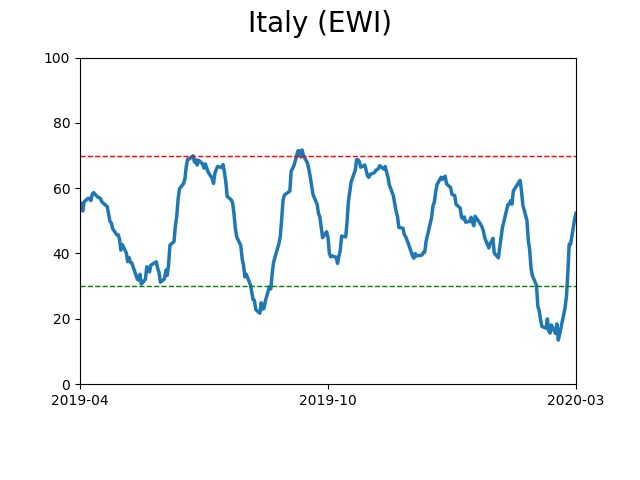
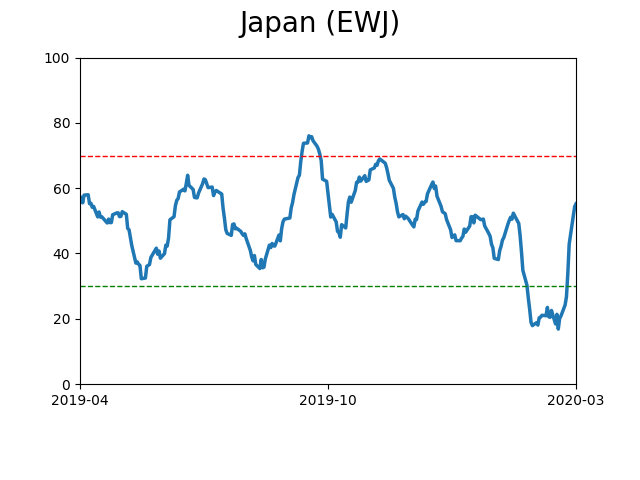
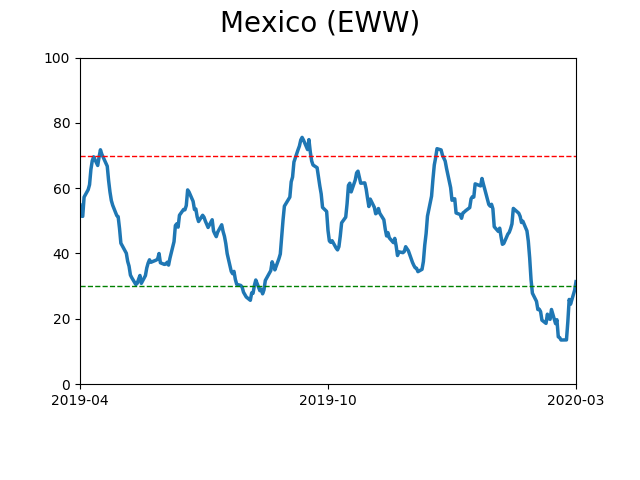
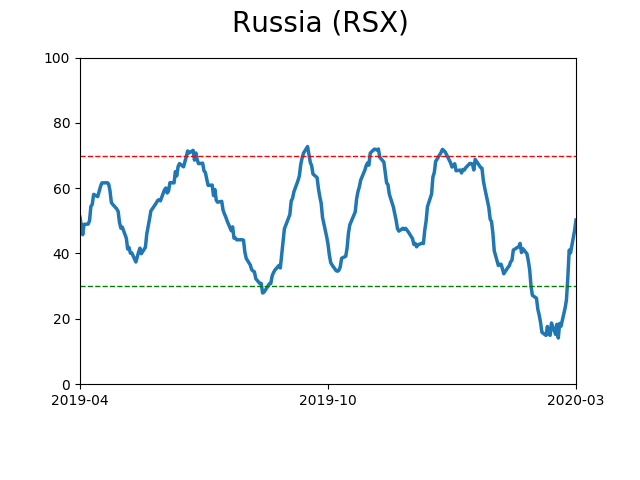
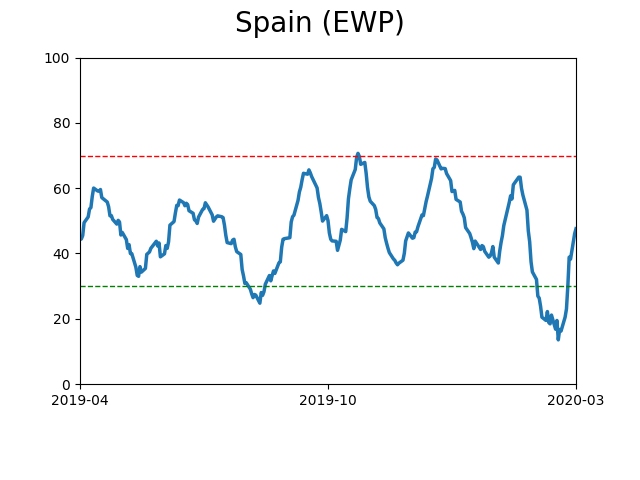
Sentiment Around The World
Optimism Index Thumbnails
|
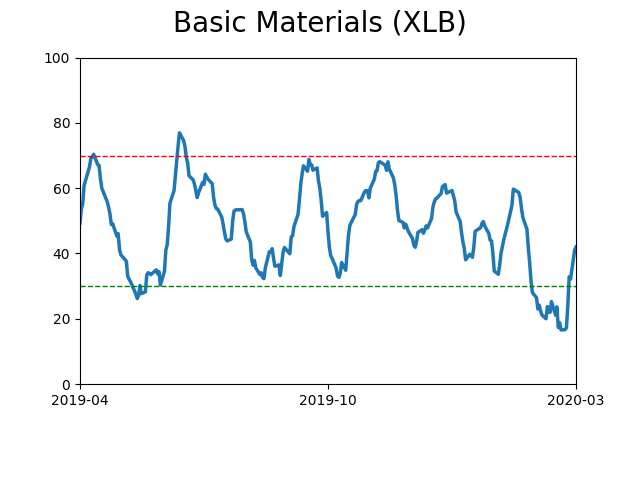
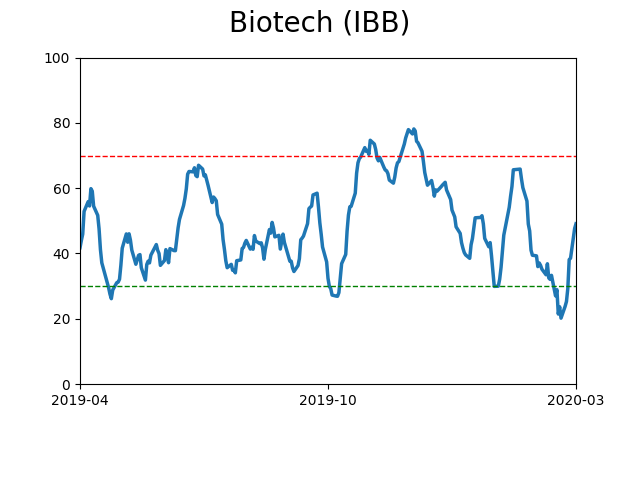
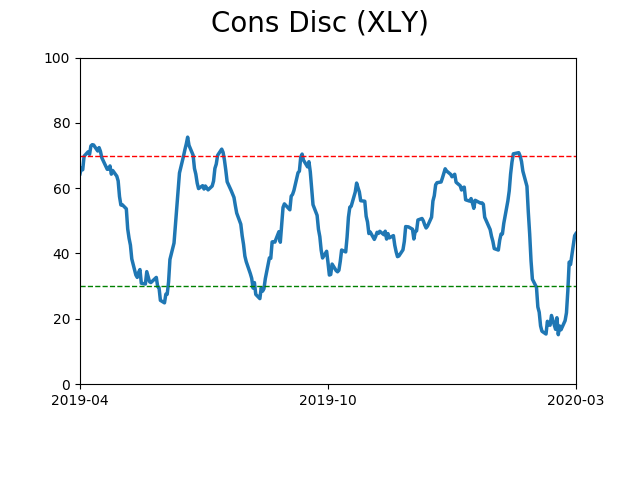
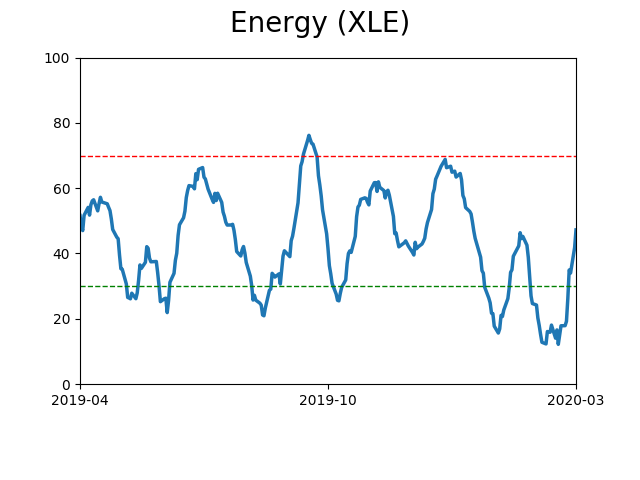
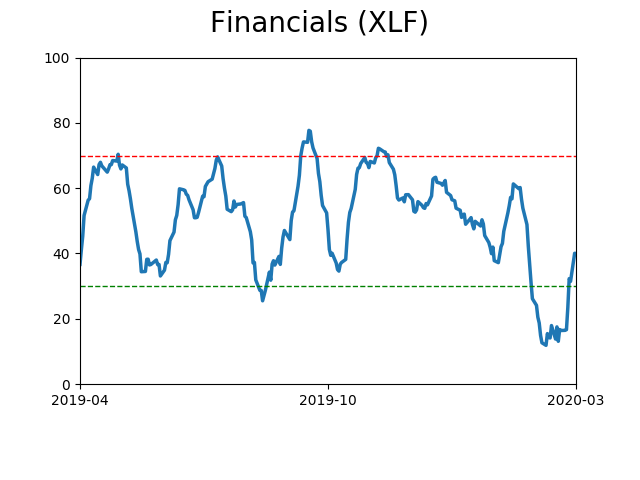
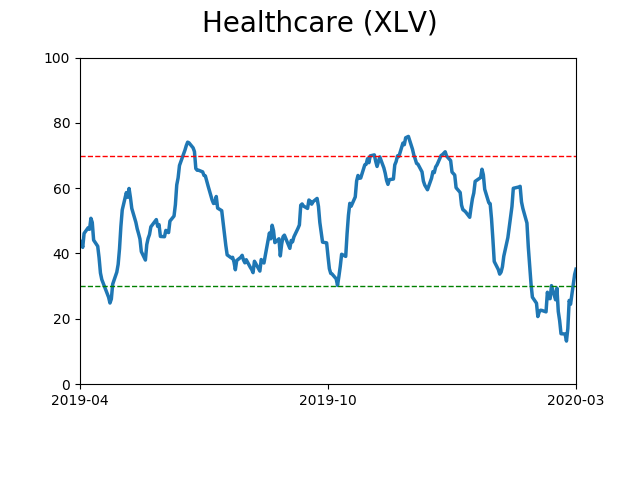
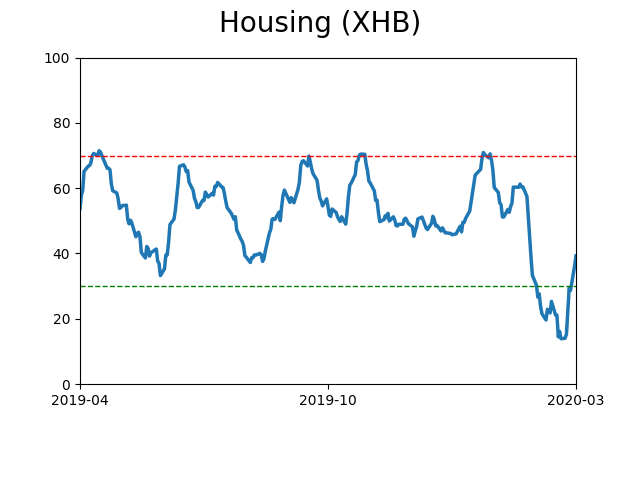
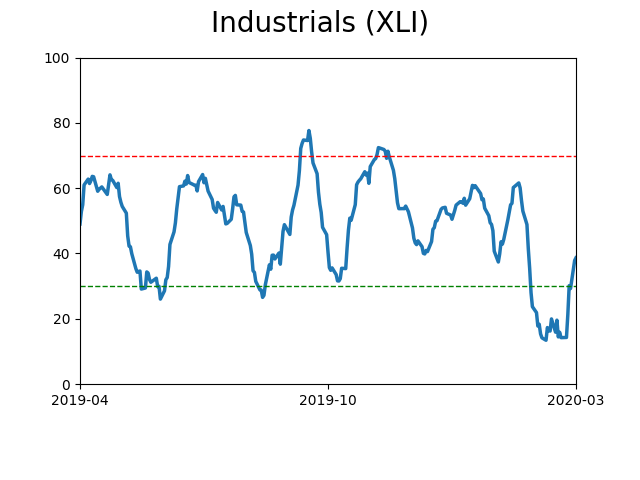
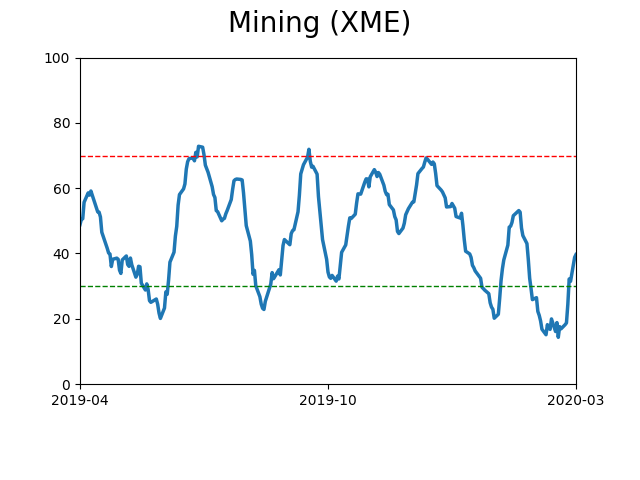
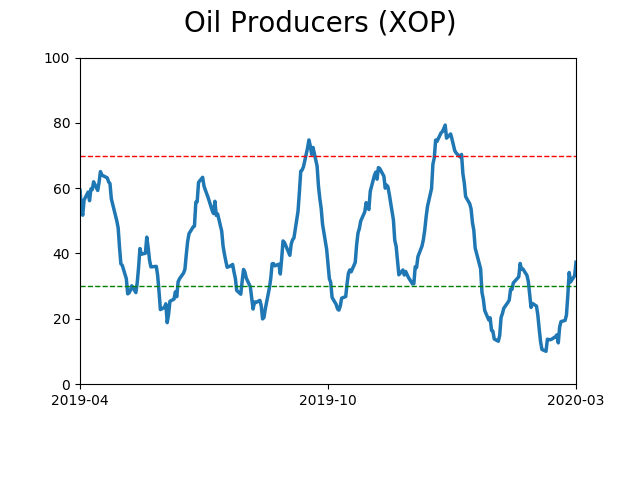
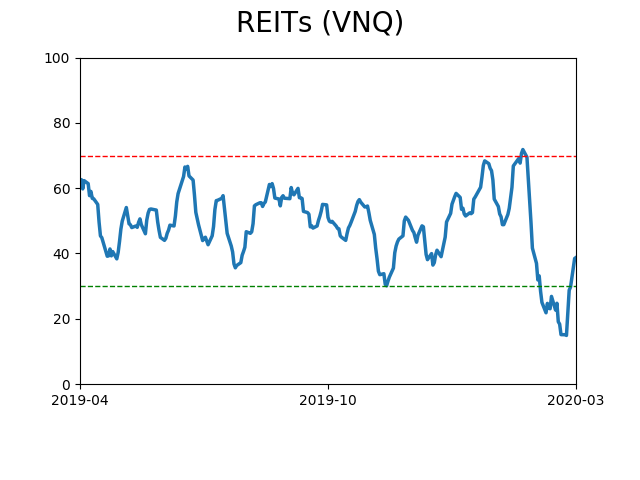
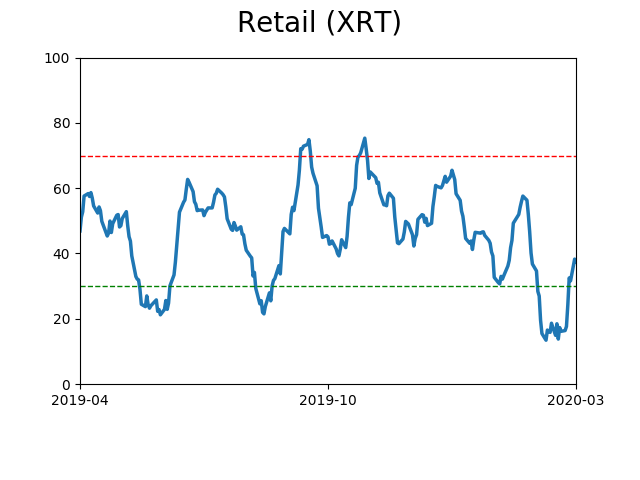
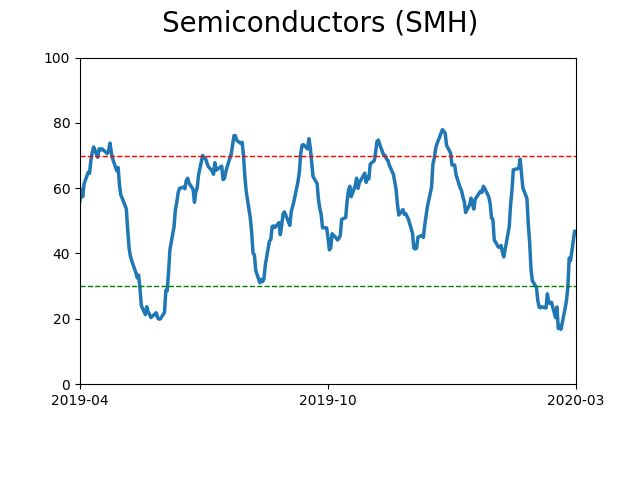
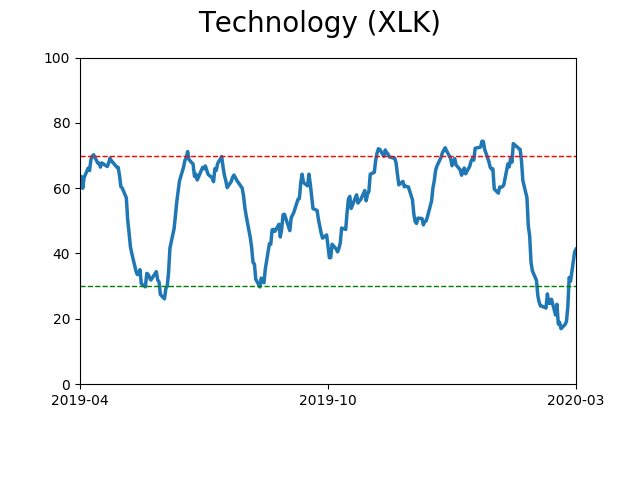
Sector ETF's - 10-Day Moving Average
|
|
|
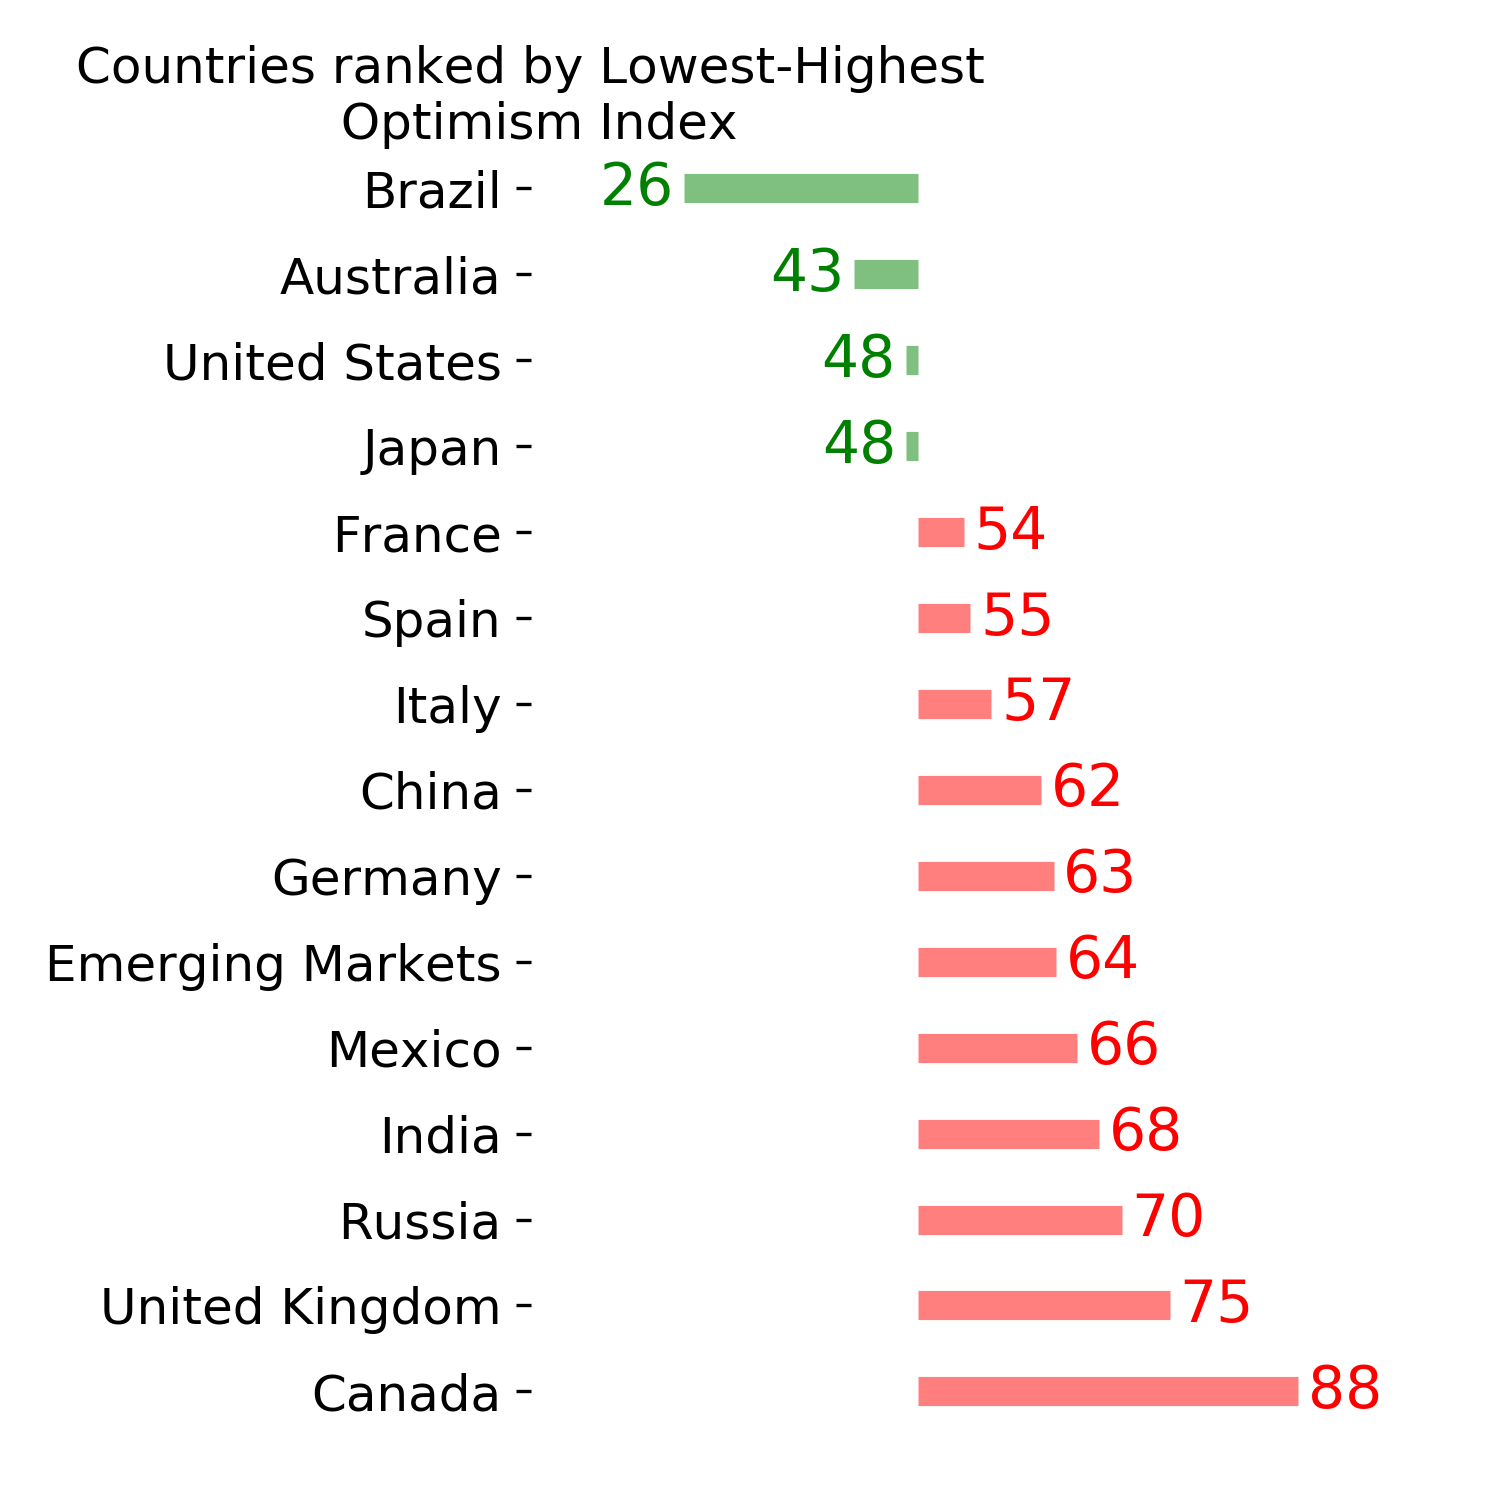
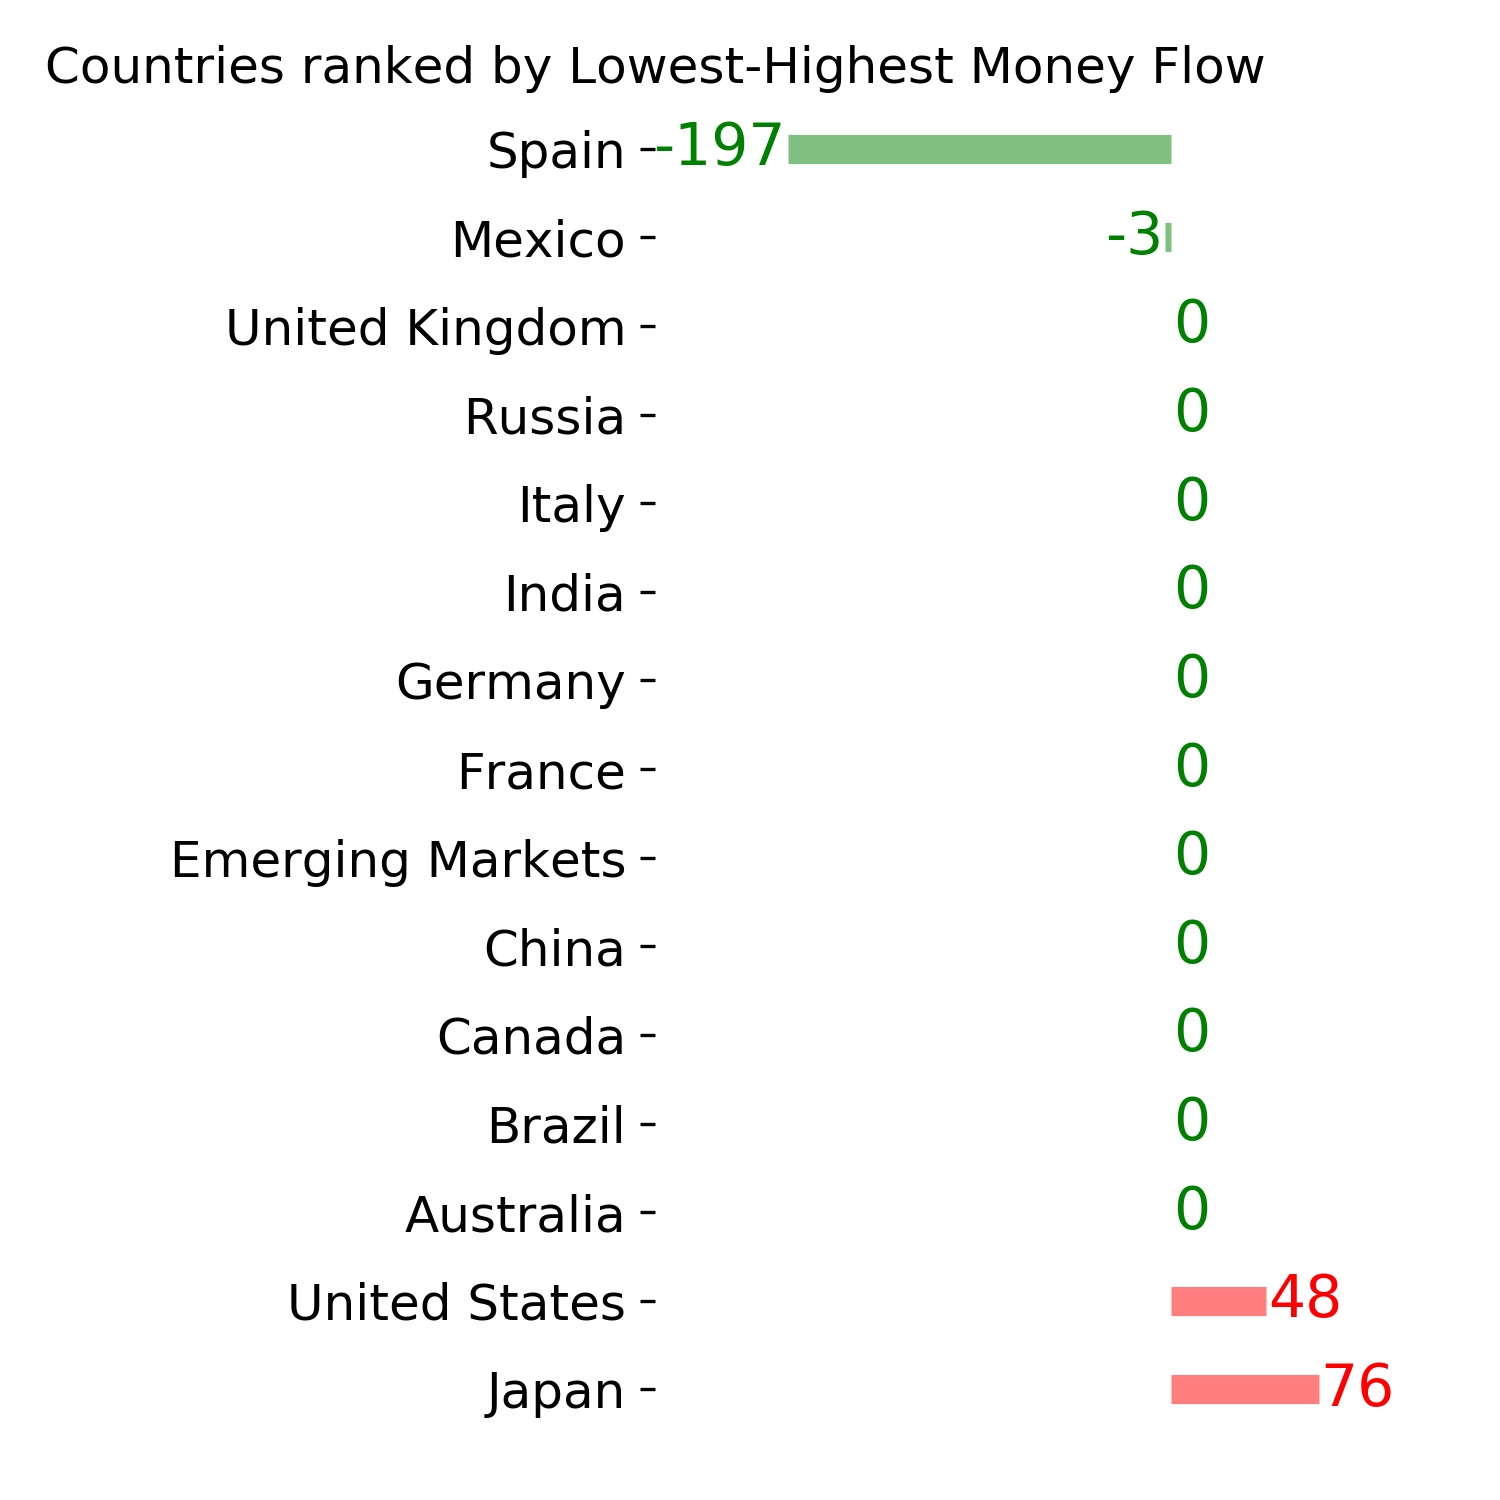
Country ETF's - 10-Day Moving Average
|
|
|
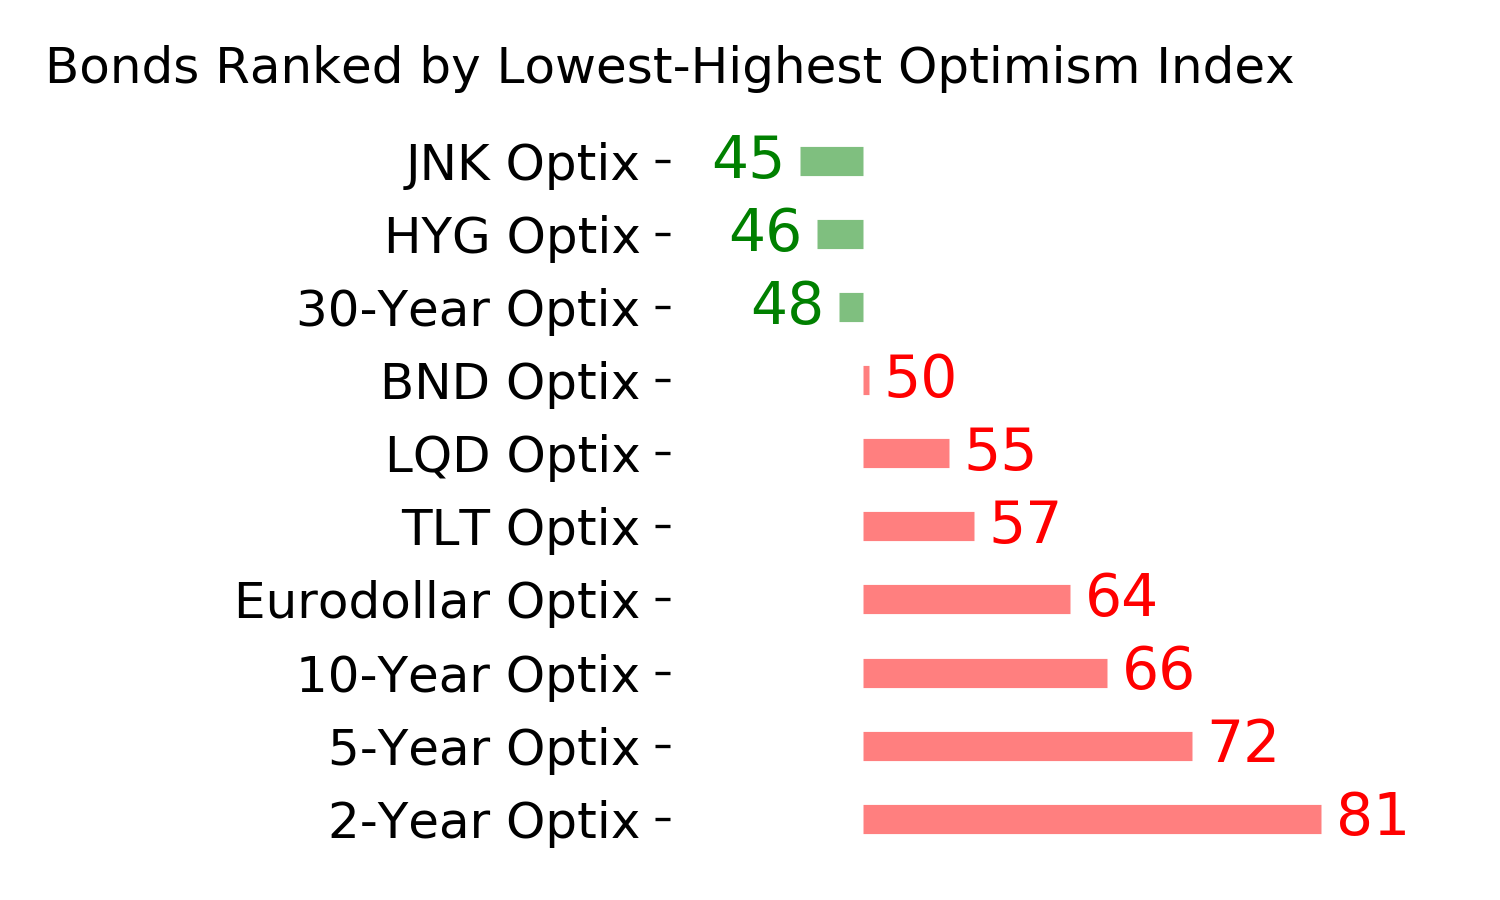
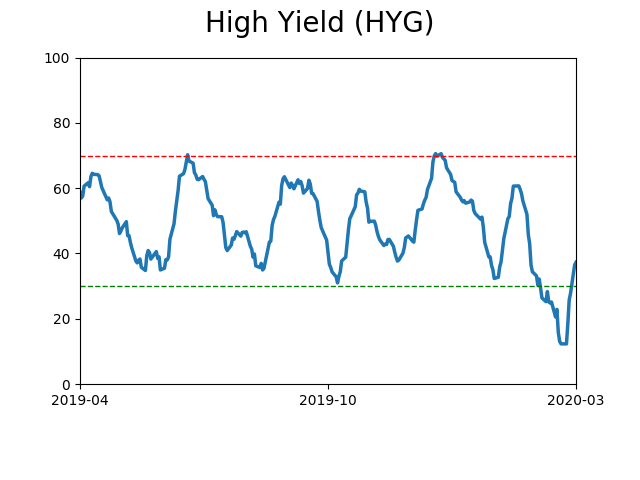
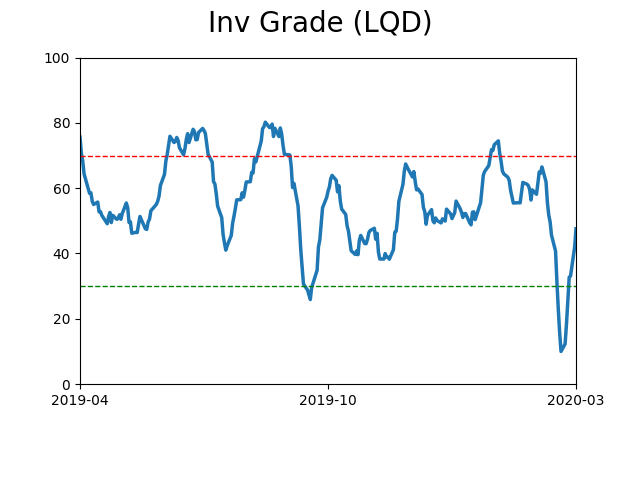
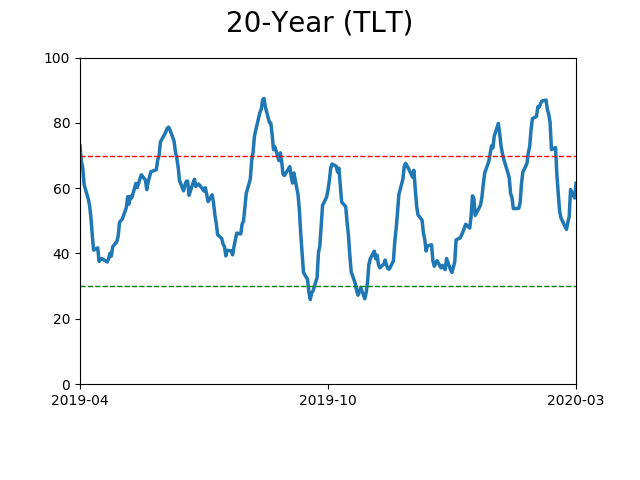
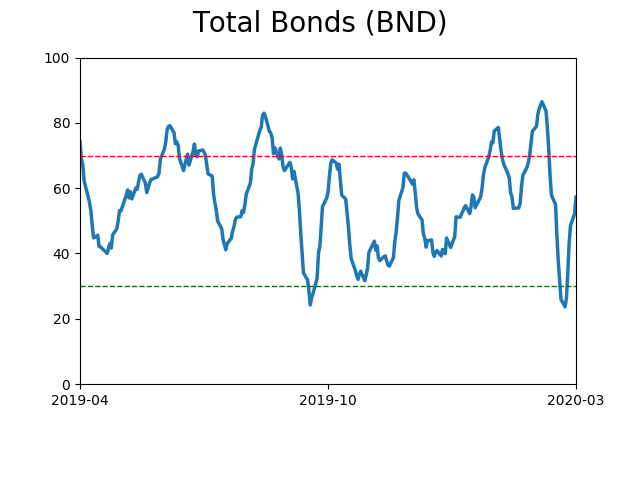
Bond ETF's - 10-Day Moving Average
|
|
|
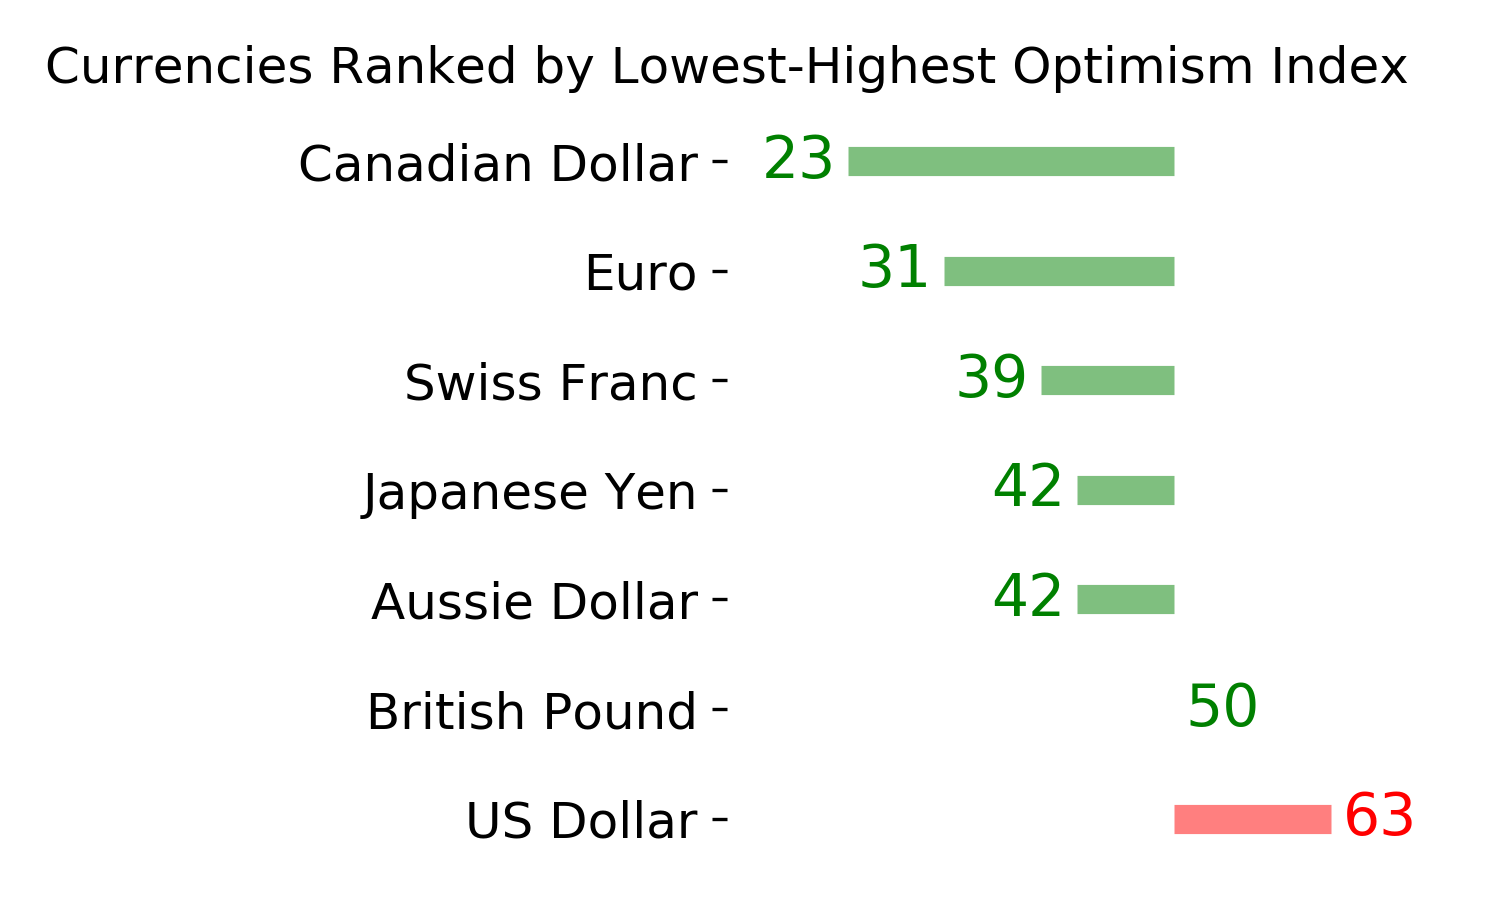
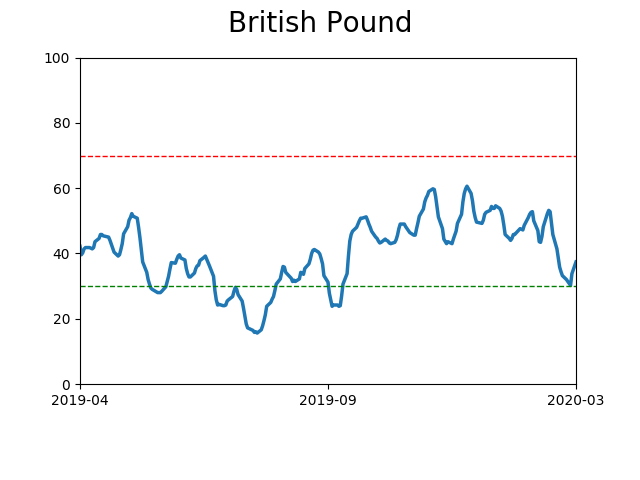
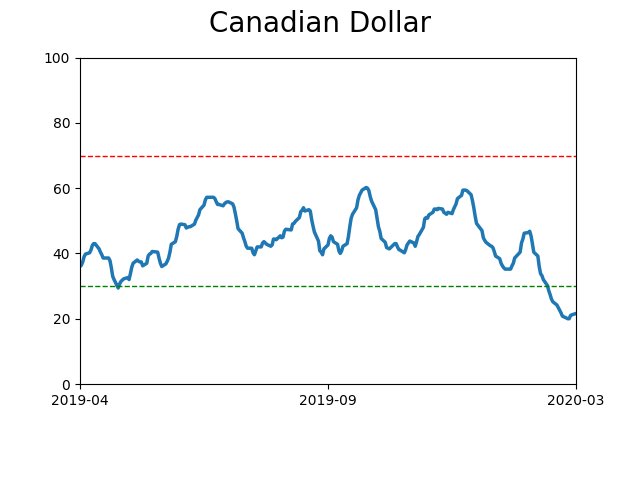
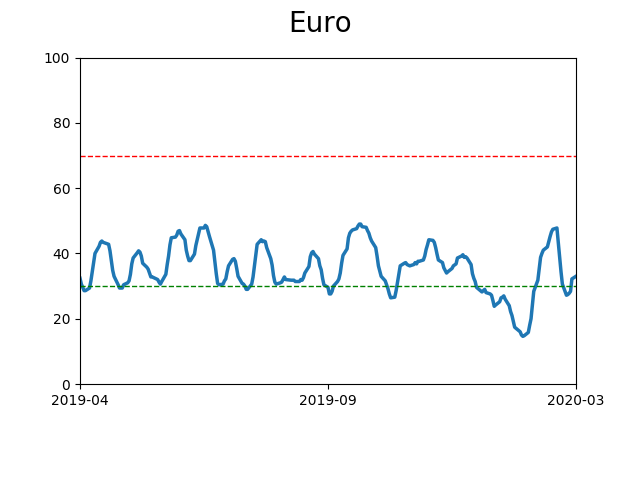
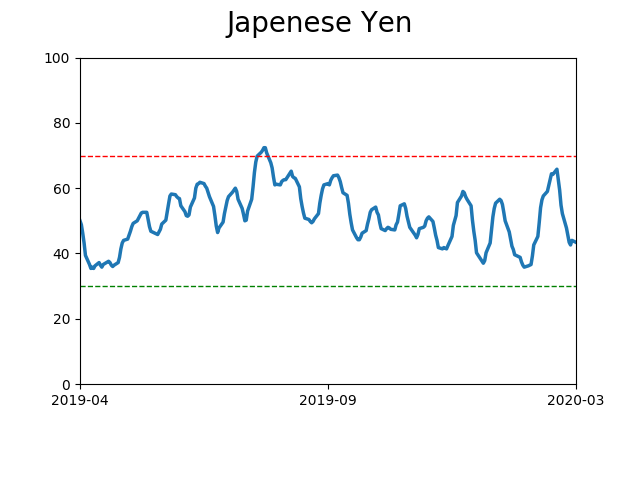
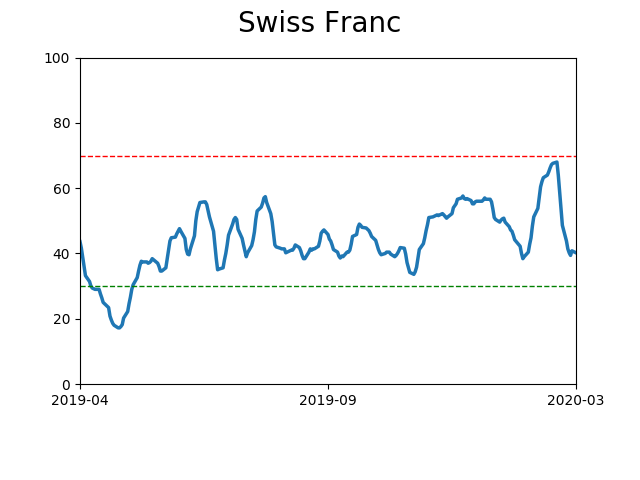
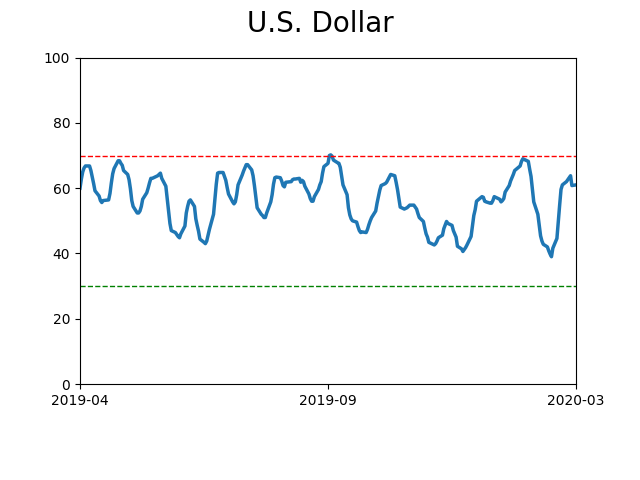
Currency ETF's - 5-Day Moving Average
|
|
|
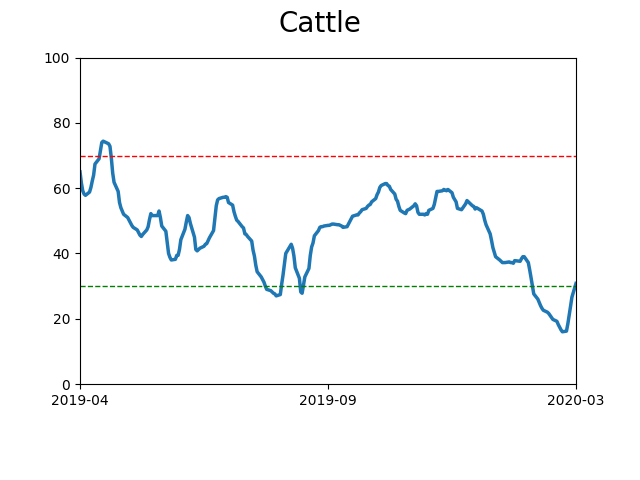
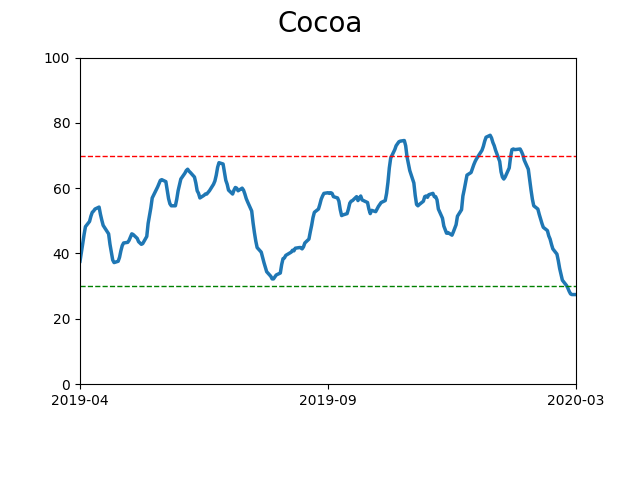
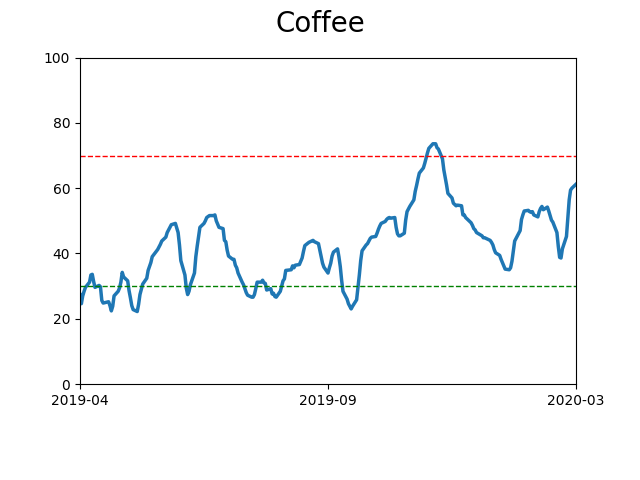
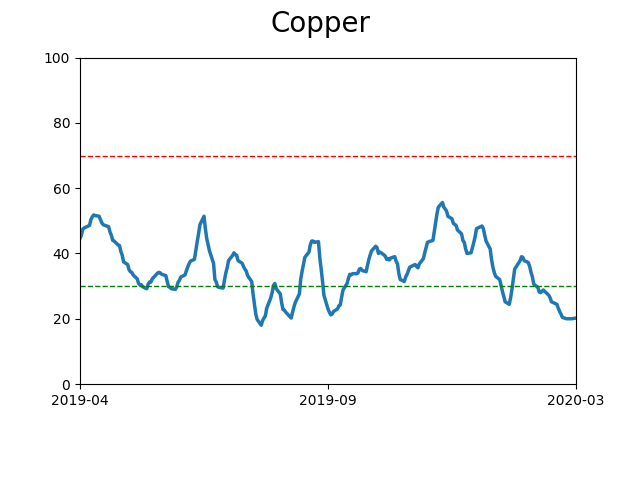
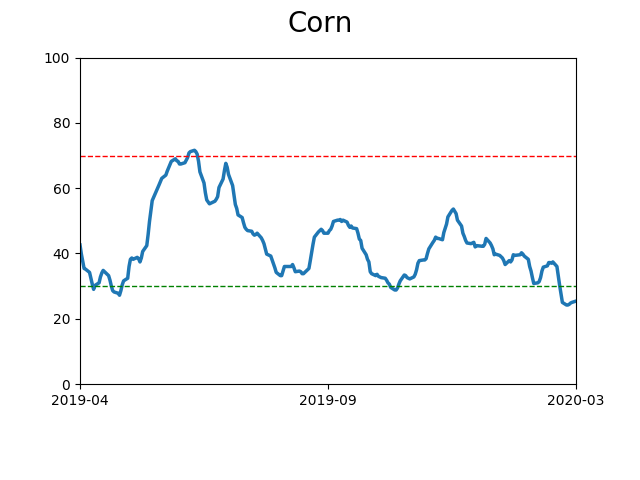
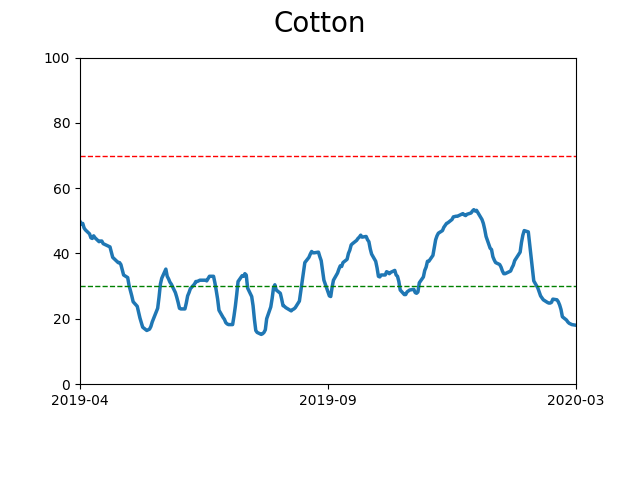
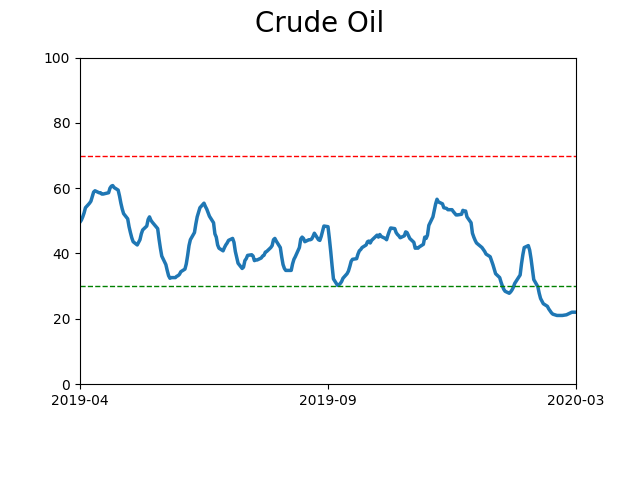
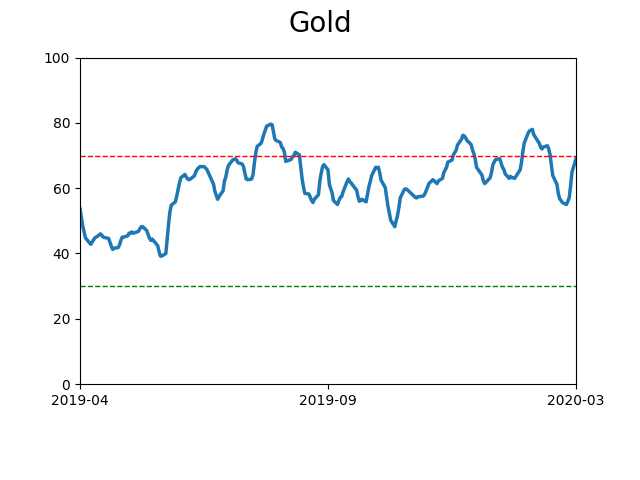
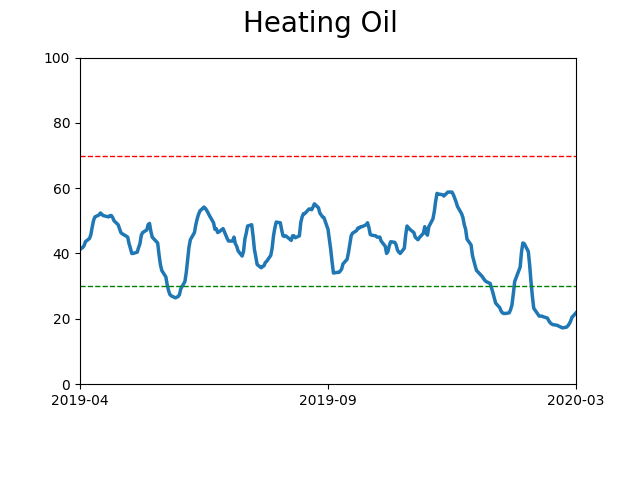
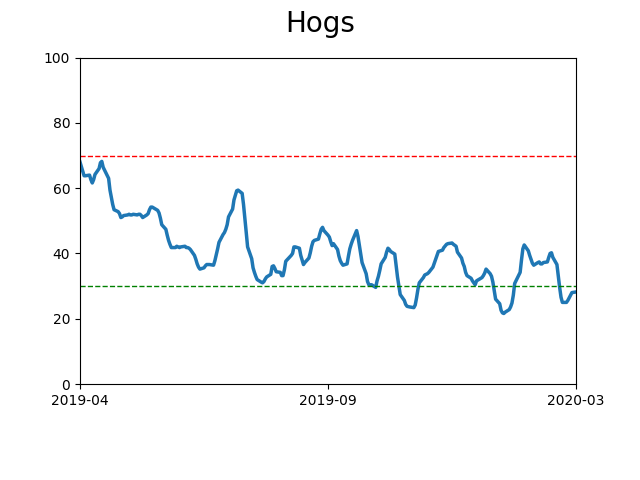
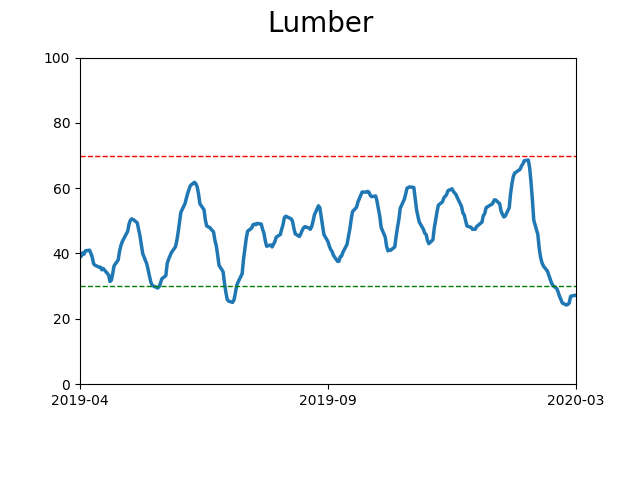
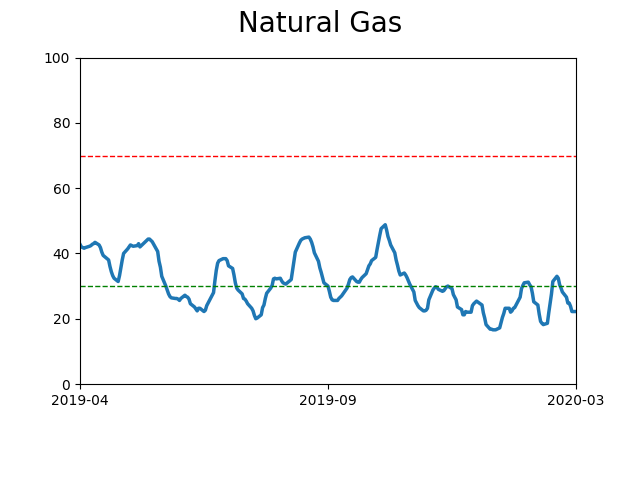
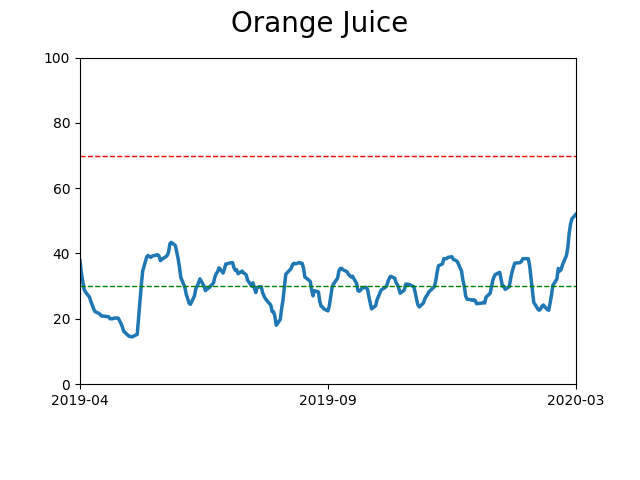
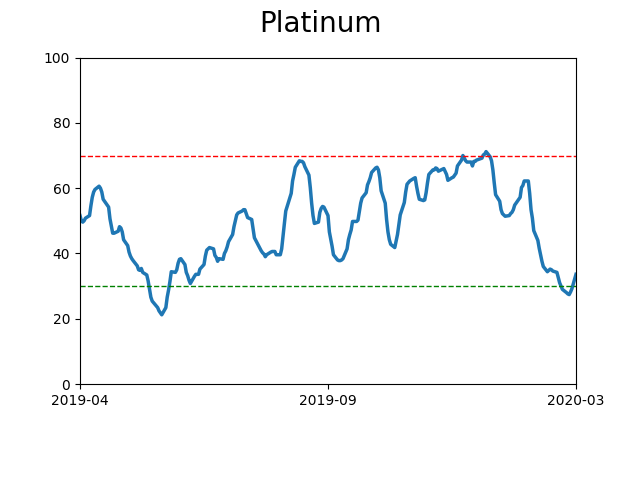
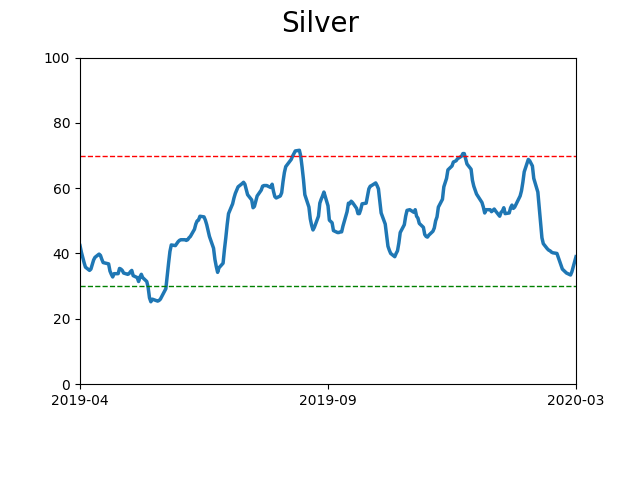
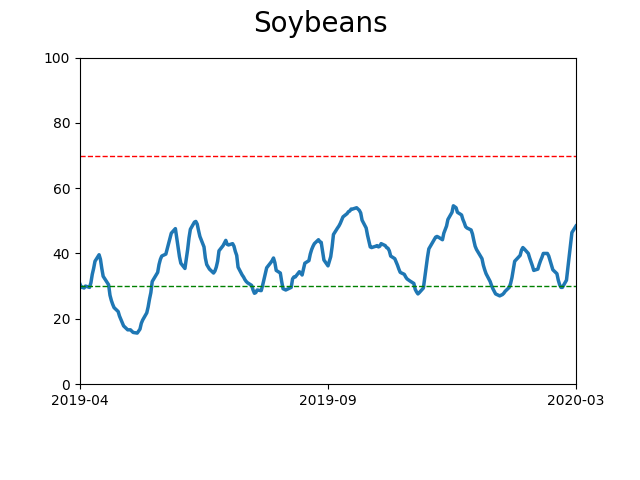
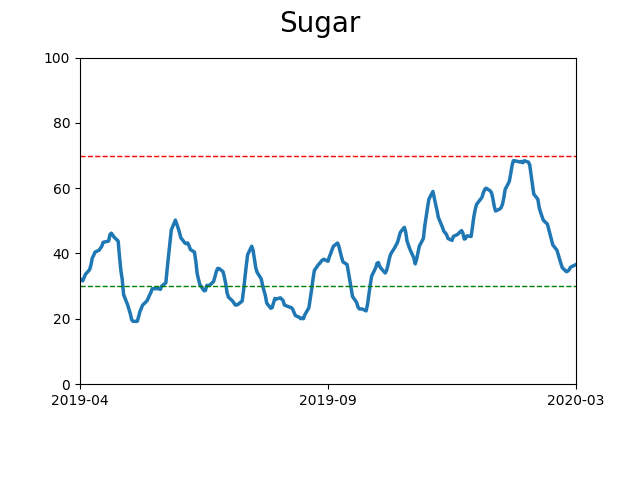
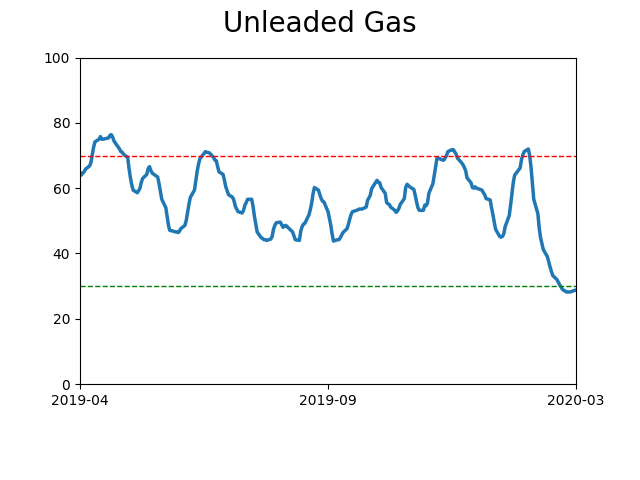
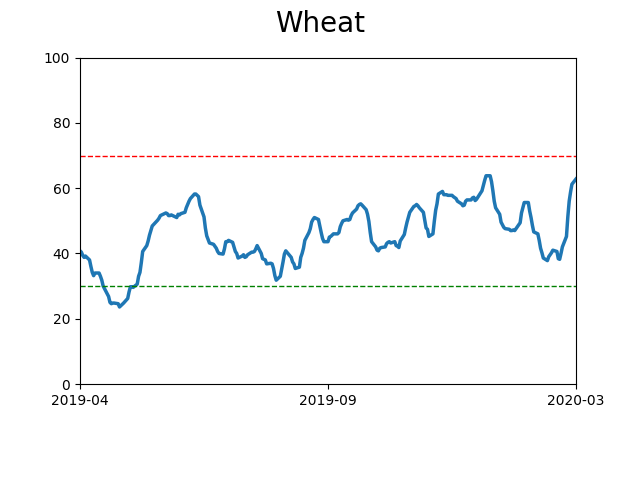
Commodity ETF's - 5-Day Moving Average
|
|