Headlines
|
|
In an optimistic market, the yen stands out:
Optimism on the yen has hit extremely low levels, just as it's entering its most consistently positive seasonal window. The performance of the yen has a big influence on gold, and the metal has tended to do well when the yen rallies.
Bottom Line:
See the Outlook & Allocations page for more details on these summaries STOCKS: Weak sell
The extreme speculation registered in January and February is starting to get wrung out. Internal dynamics have mostly held up, so a return to neutral sentiment conditions would improve the forward risk/reward profile substantially. We're still a ways off from that. BONDS: Weak buy
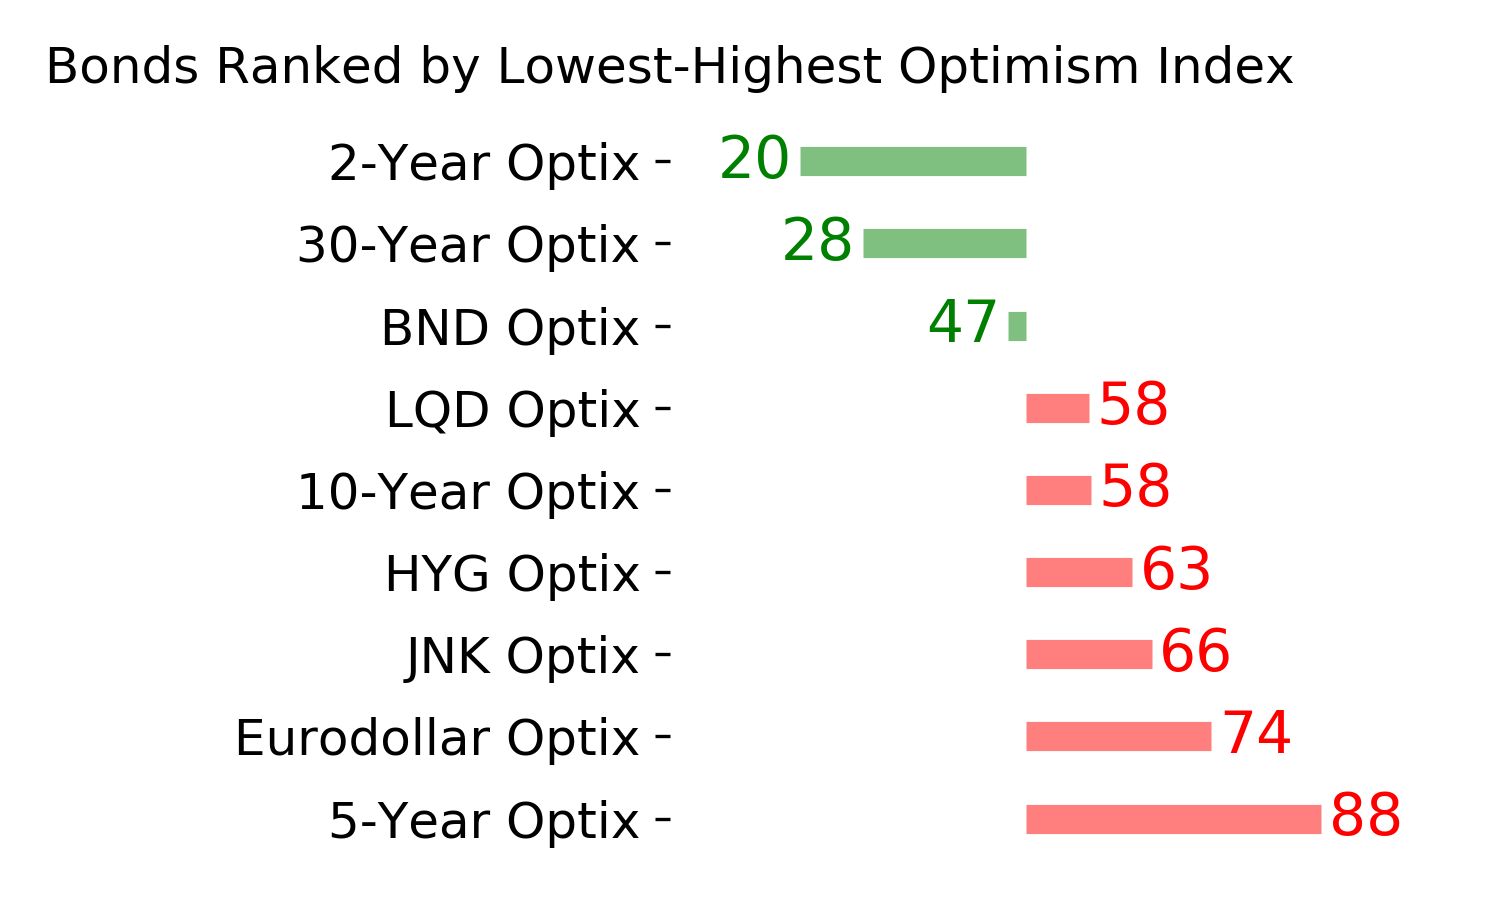
Various parts of the market have been hit in recent weeks, with mild oversold conditions. The Bond Optimism Index is now about as low as it gets during healthy bond market environments. Fixed income isn't responding well, so that needs to be monitored in case it's transitioning to a longer-term negative market environment. GOLD: Weak buy
A dollar trying to rebound from a severe short position has weighed on gold and miners. The types of signals they've given in recent weeks, within the context of their recent surge, have usually resulted in higher prices over a medium- to long-term time frame. Like bonds, gold and miners aren't responding very well, and this needs to be monitored.
|
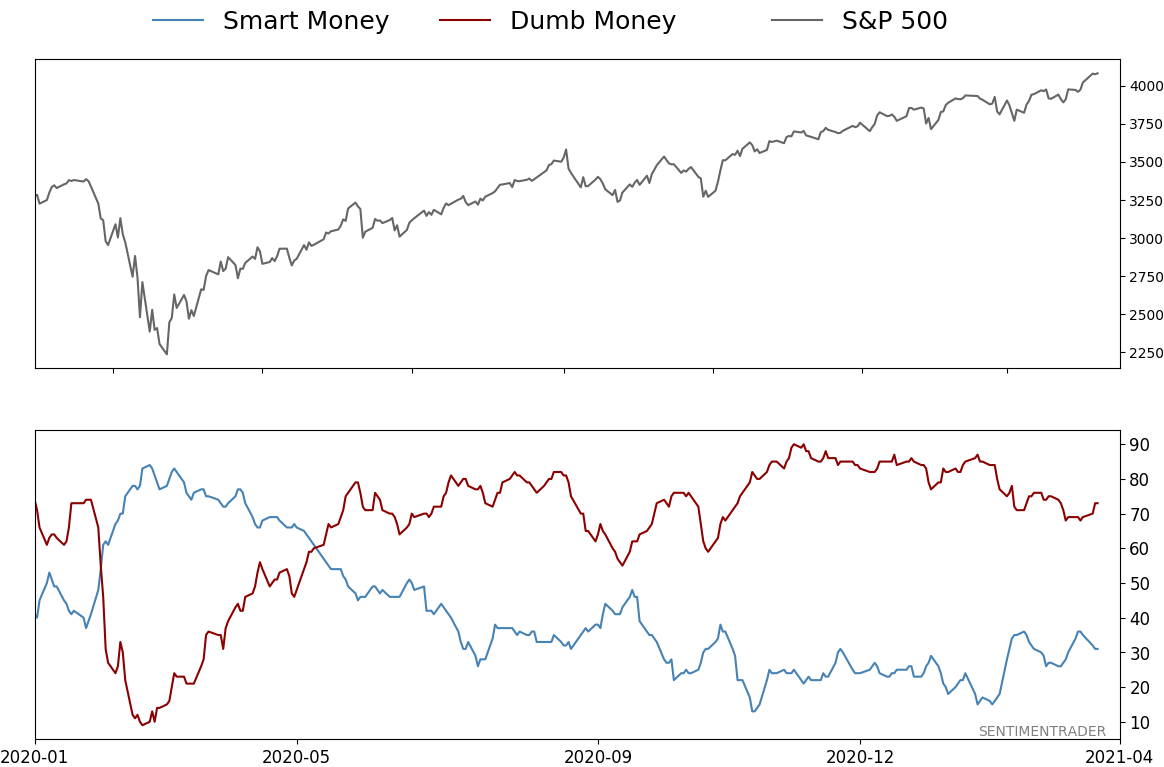
Smart / Dumb Money Confidence
|
Smart Money Confidence: 31%
Dumb Money Confidence: 73%
|
|
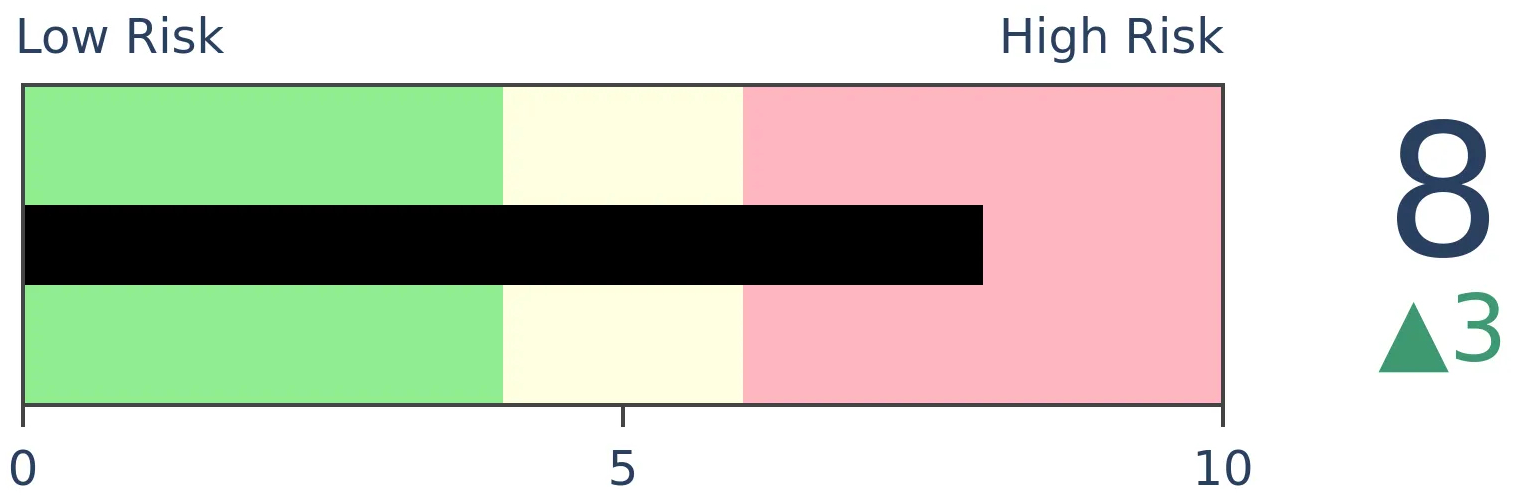
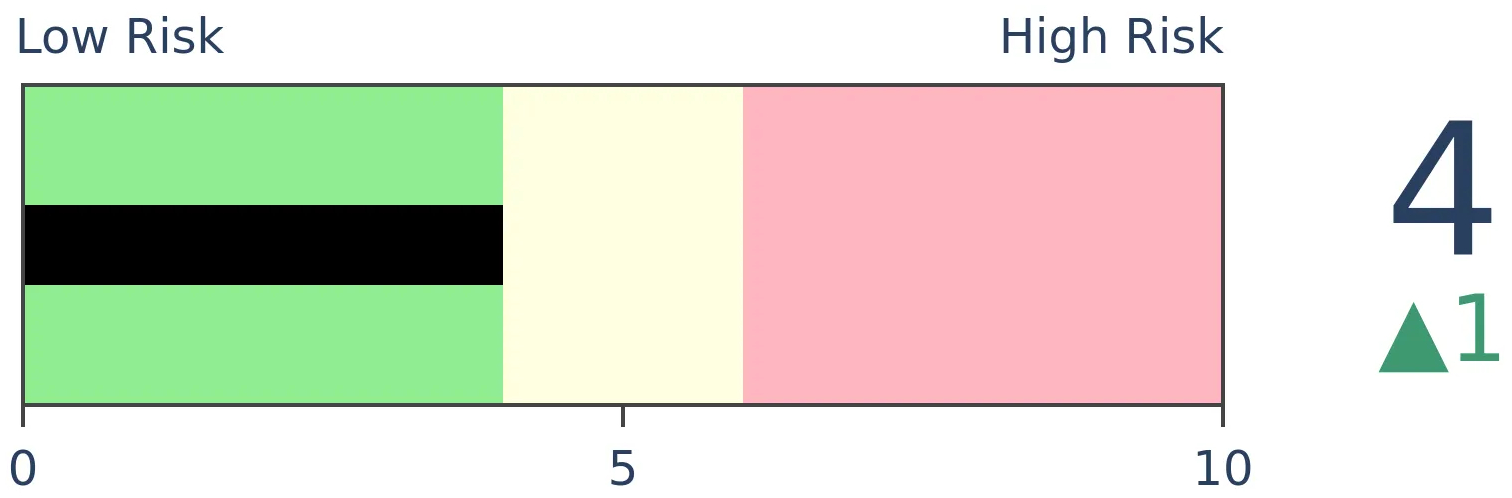
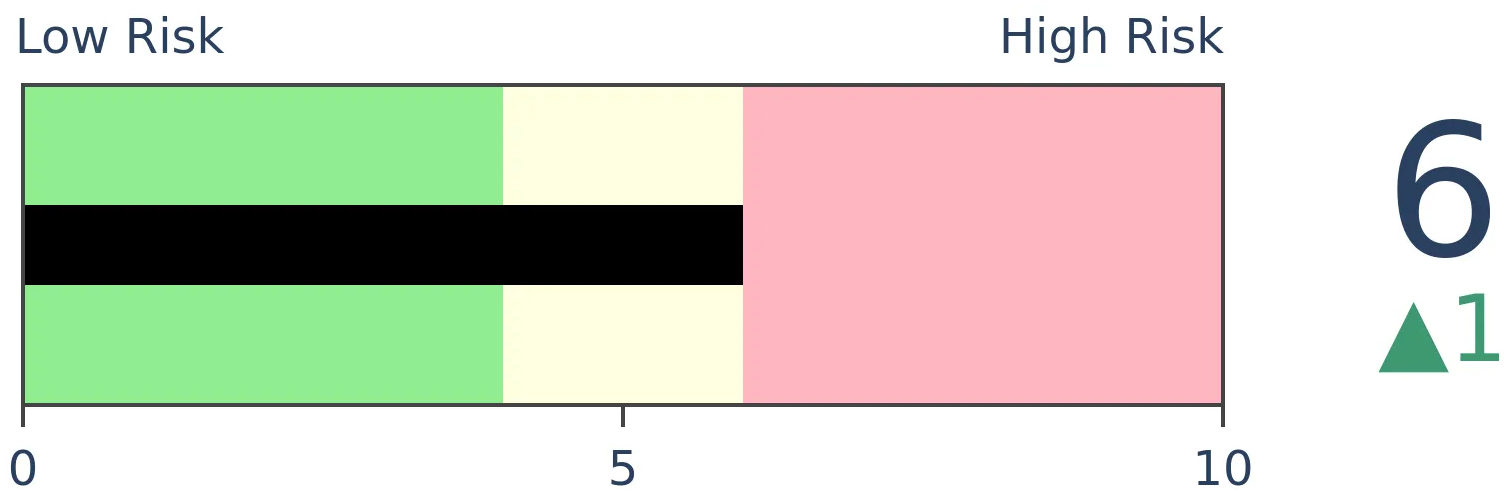
Risk Levels
Stocks Short-Term

|
Stocks Medium-Term
|
|
Bonds
|
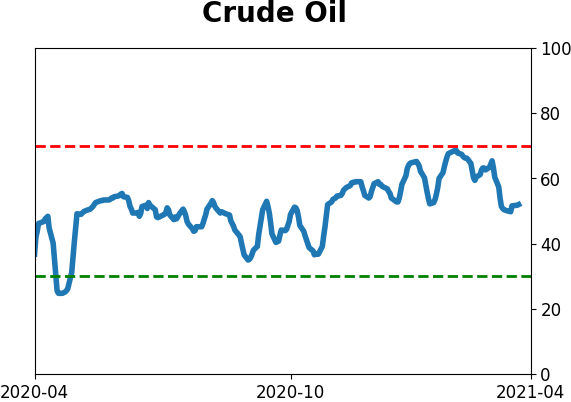
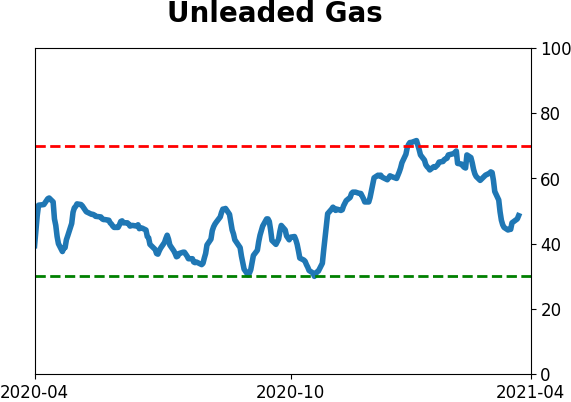
Crude Oil
|
|
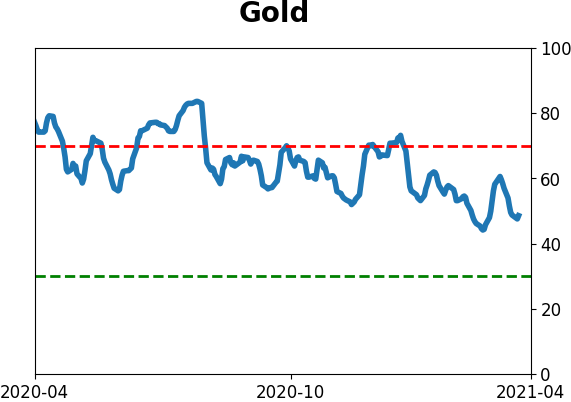
Gold
|
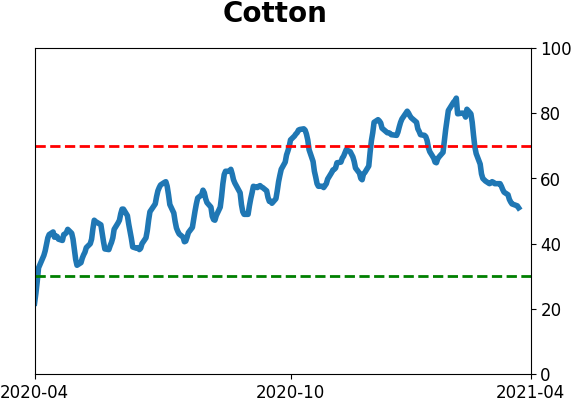
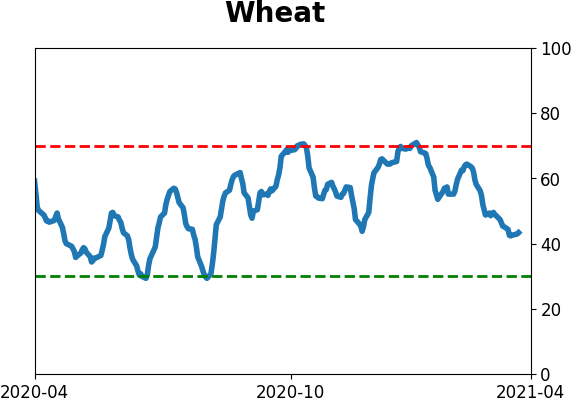
Agriculture
|
|
Research
BOTTOM LINE
Optimism on the yen has hit extremely low levels, just as it's entering its most consistently positive seasonal window. The performance of the yen has a big influence on gold, and the metal has tended to do well when the yen rallies.
FORECAST / TIMEFRAME
FXY -- Up, Medium-Term
|
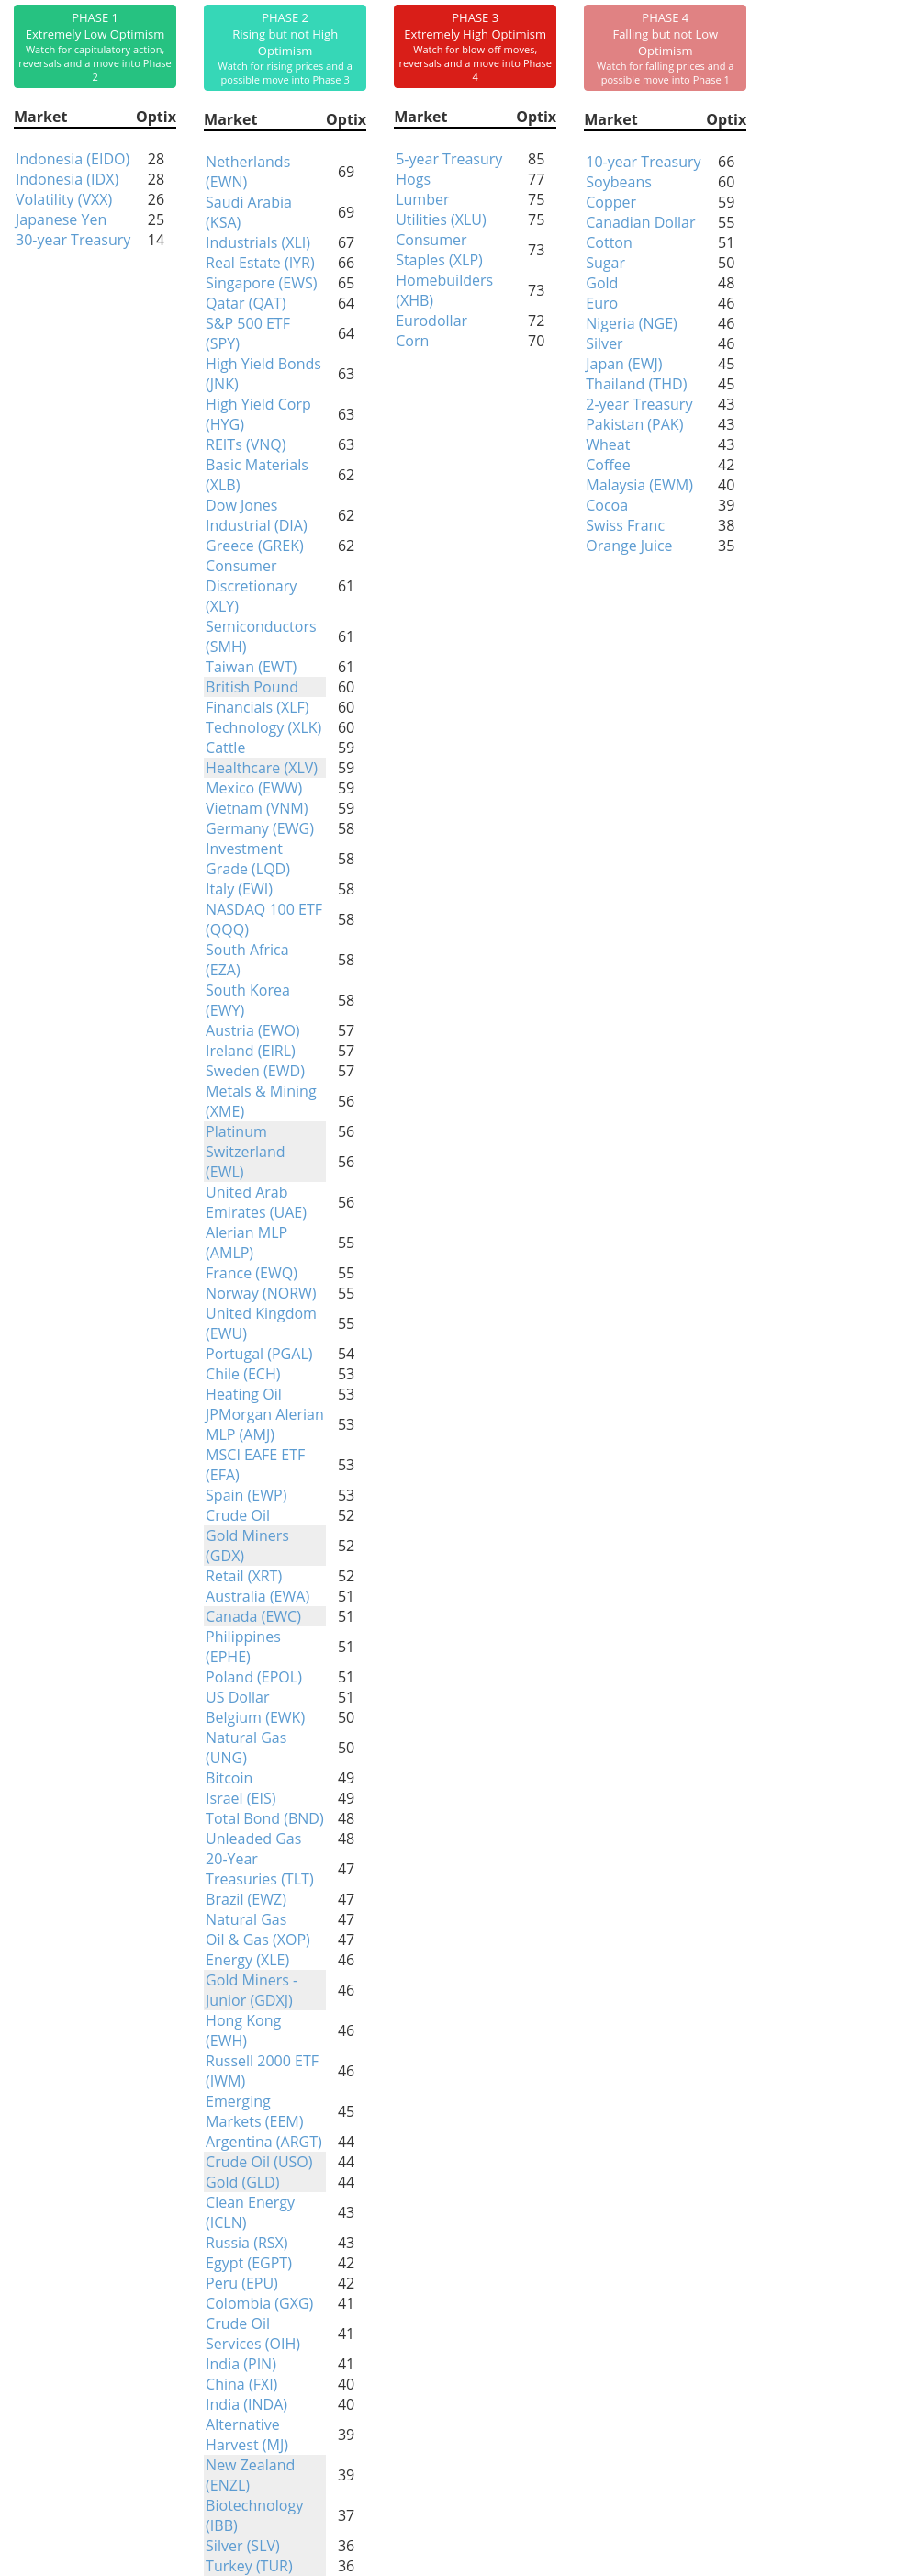
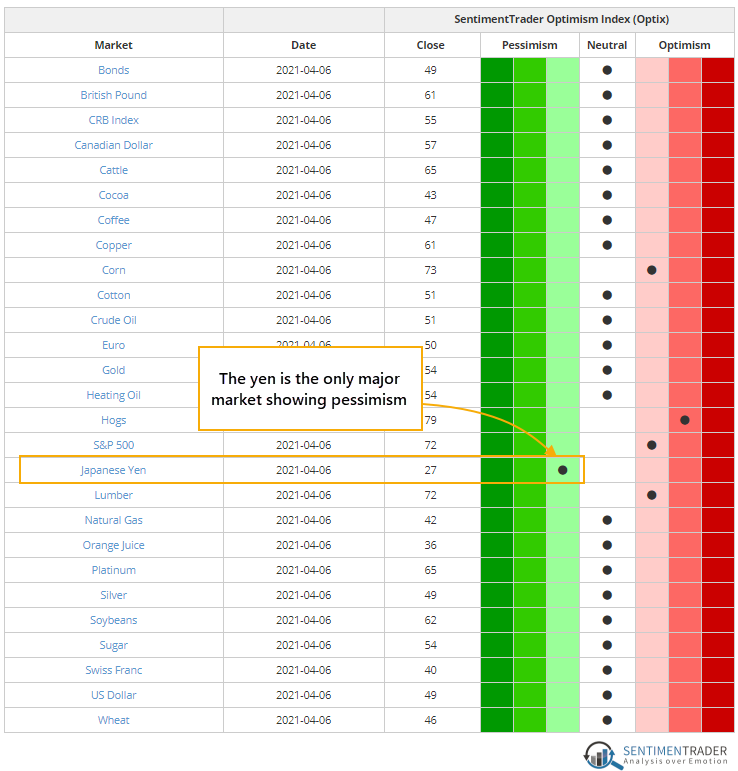
In a market that's sloshing with money and financial assets are soaring, it's hard to find anything that's hated.
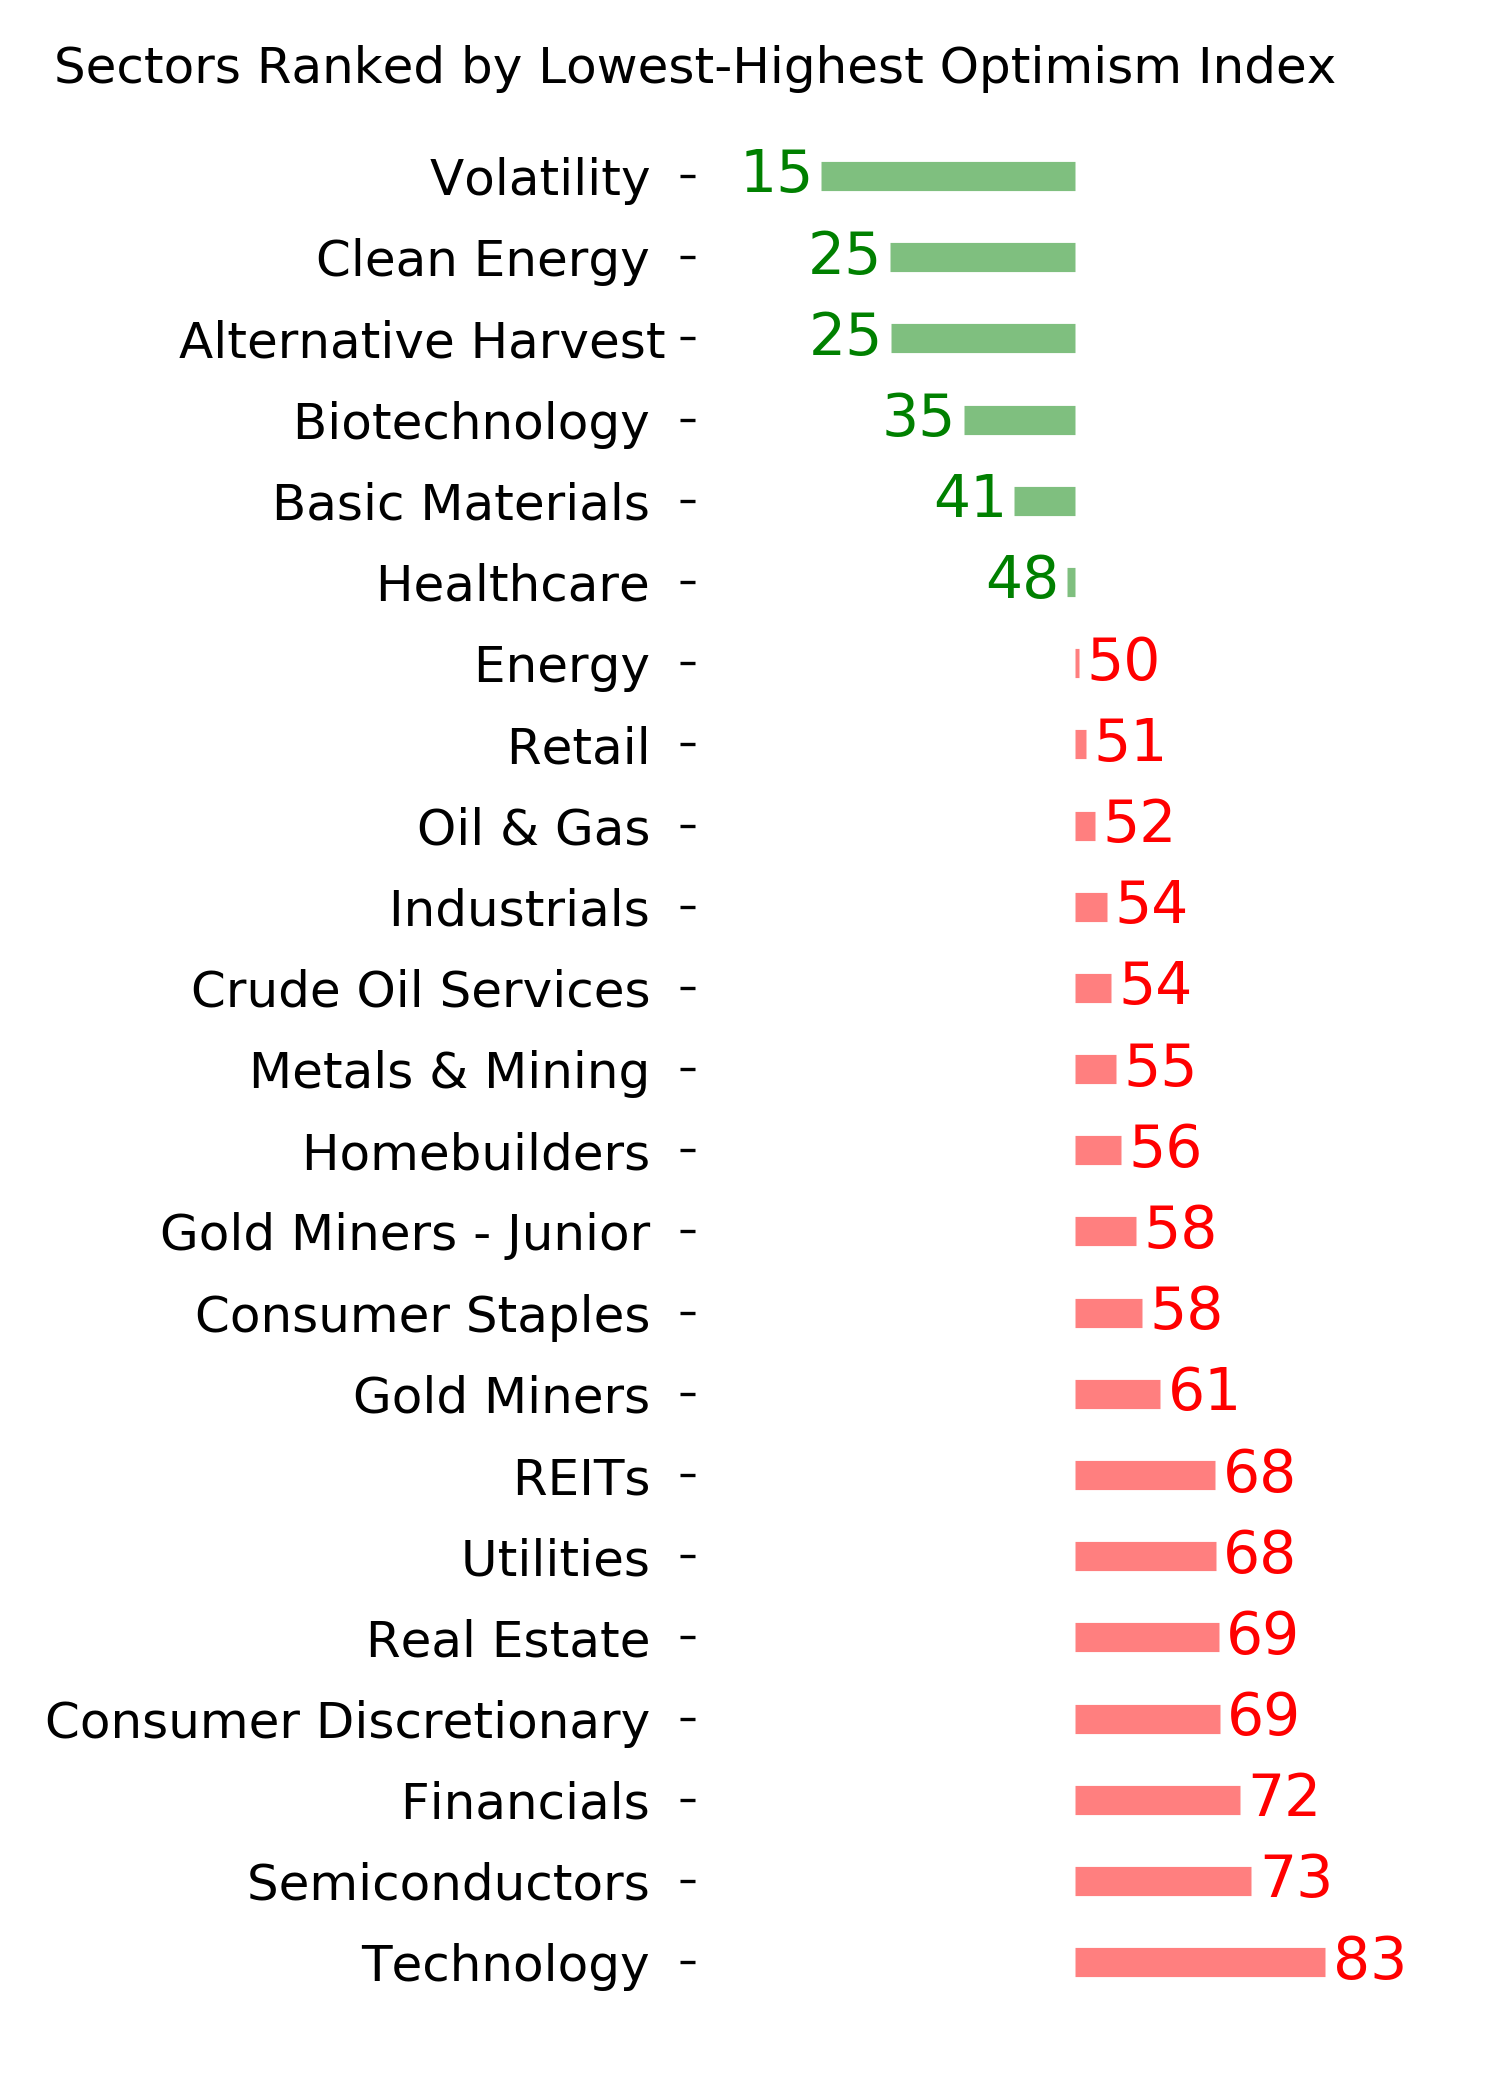
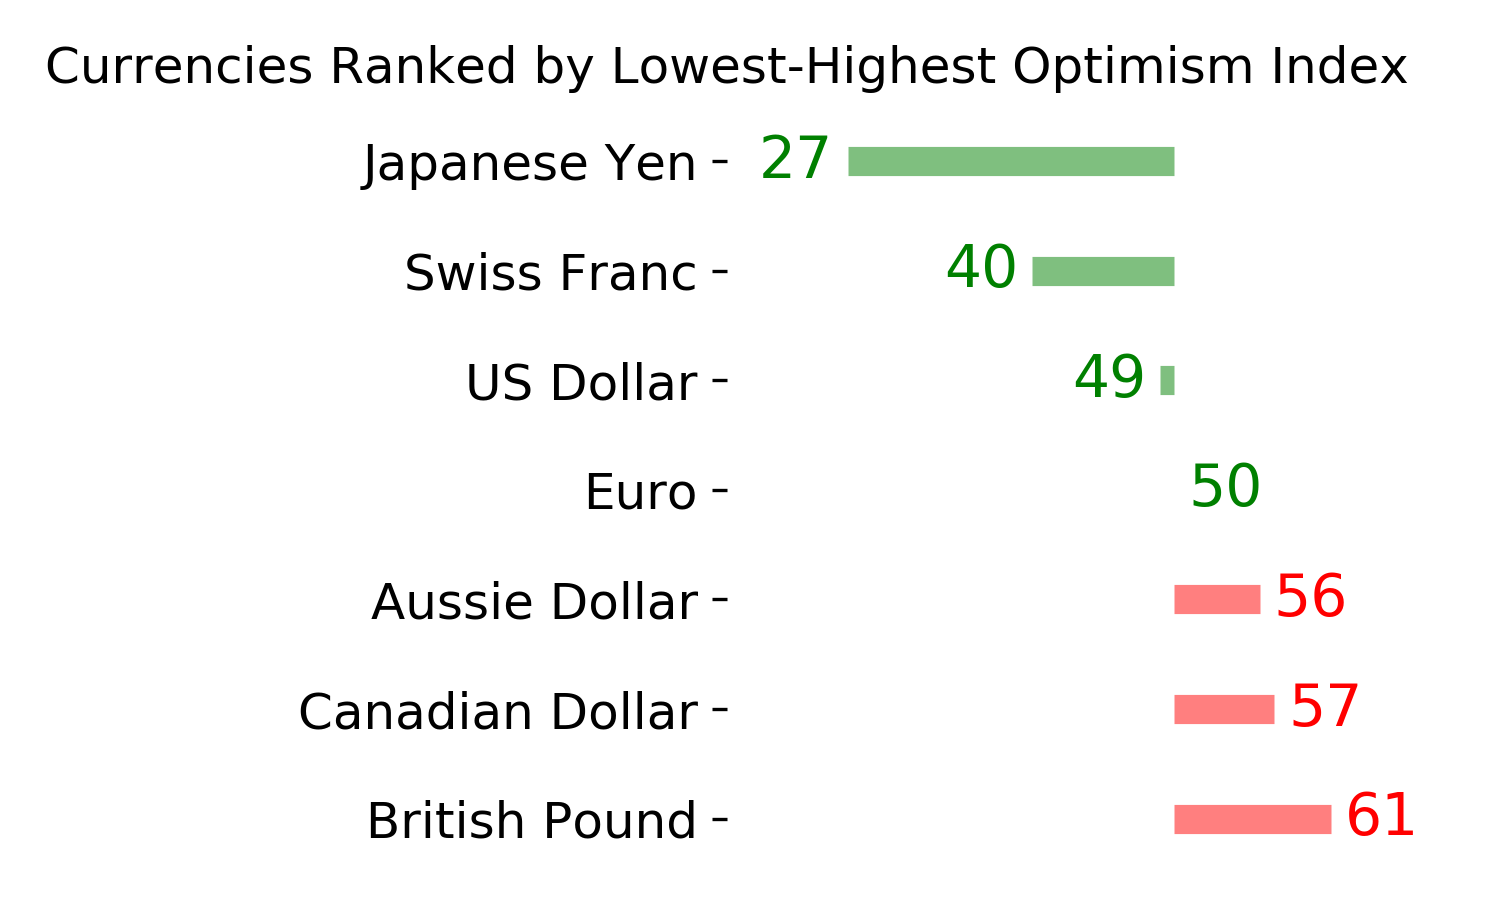
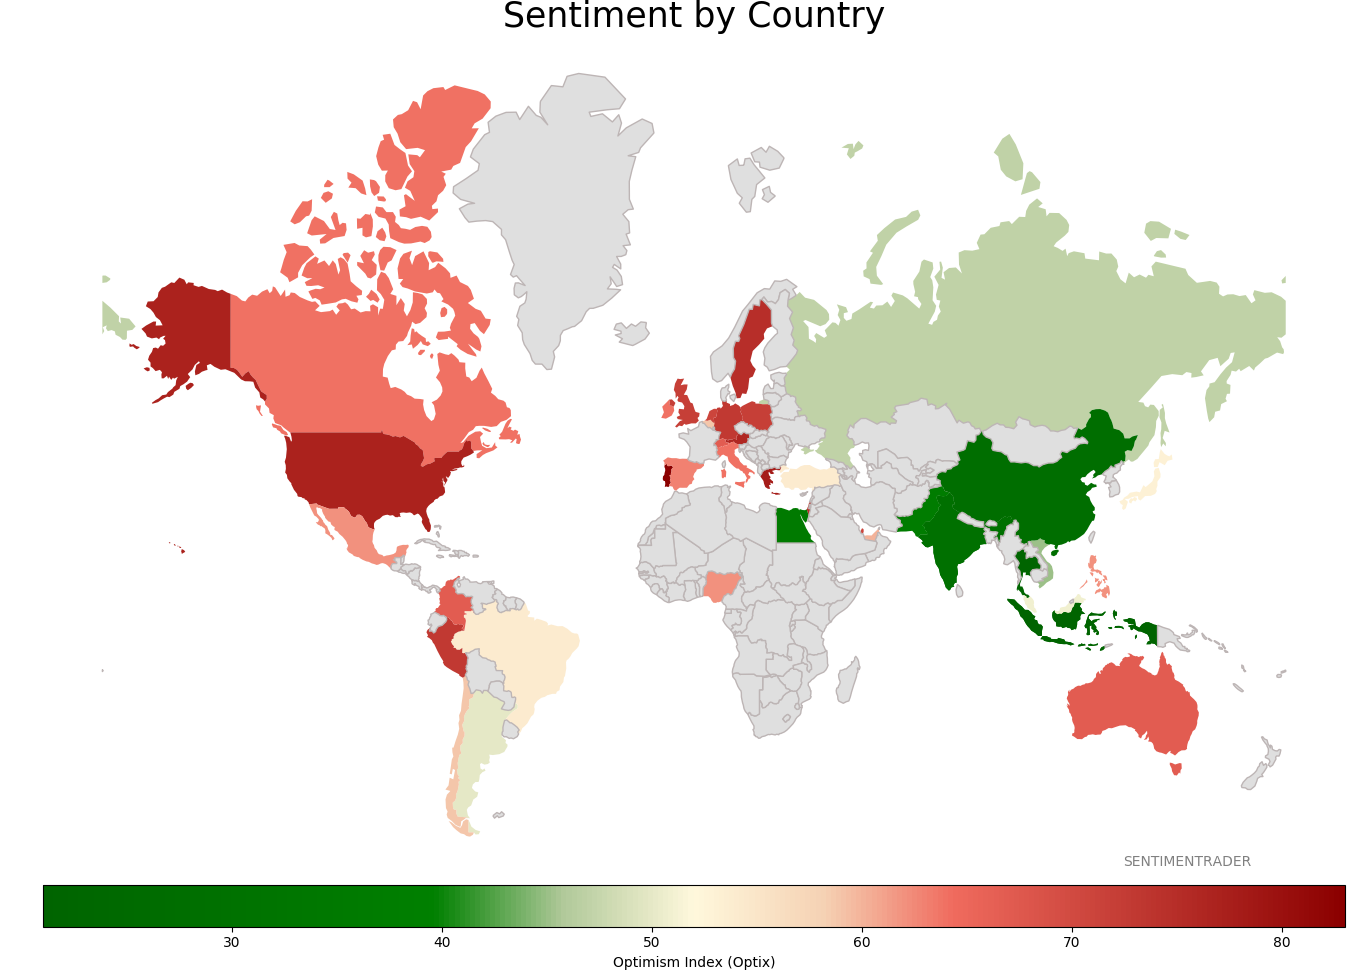
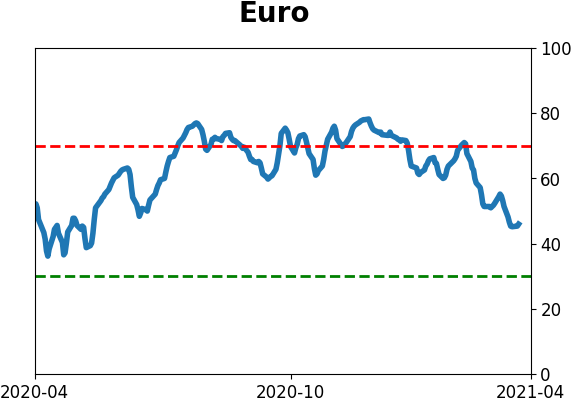
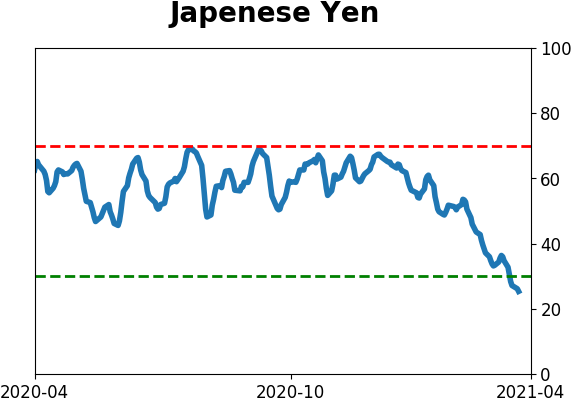
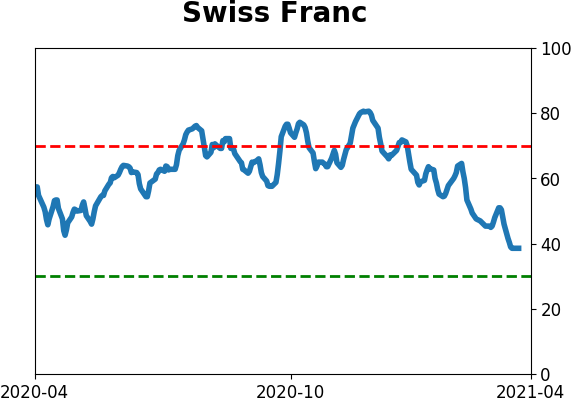
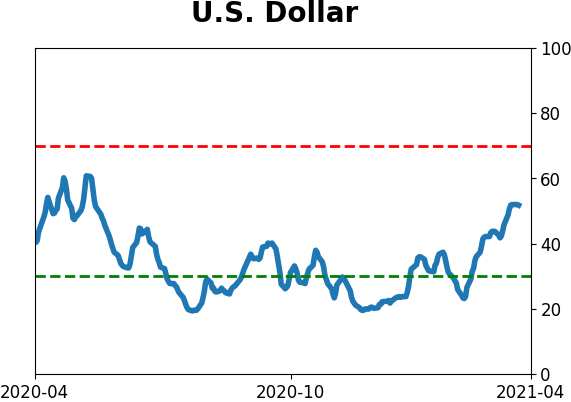
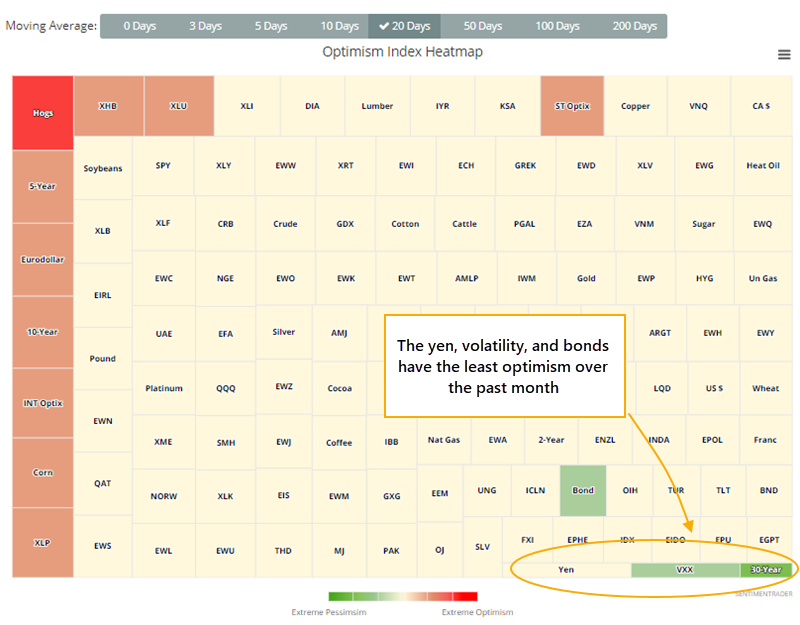
Looking at the Market Sentiment Overview, the Japanese yen is currently the only major market with a low Optimism Index, and even that isn't too terribly extreme.
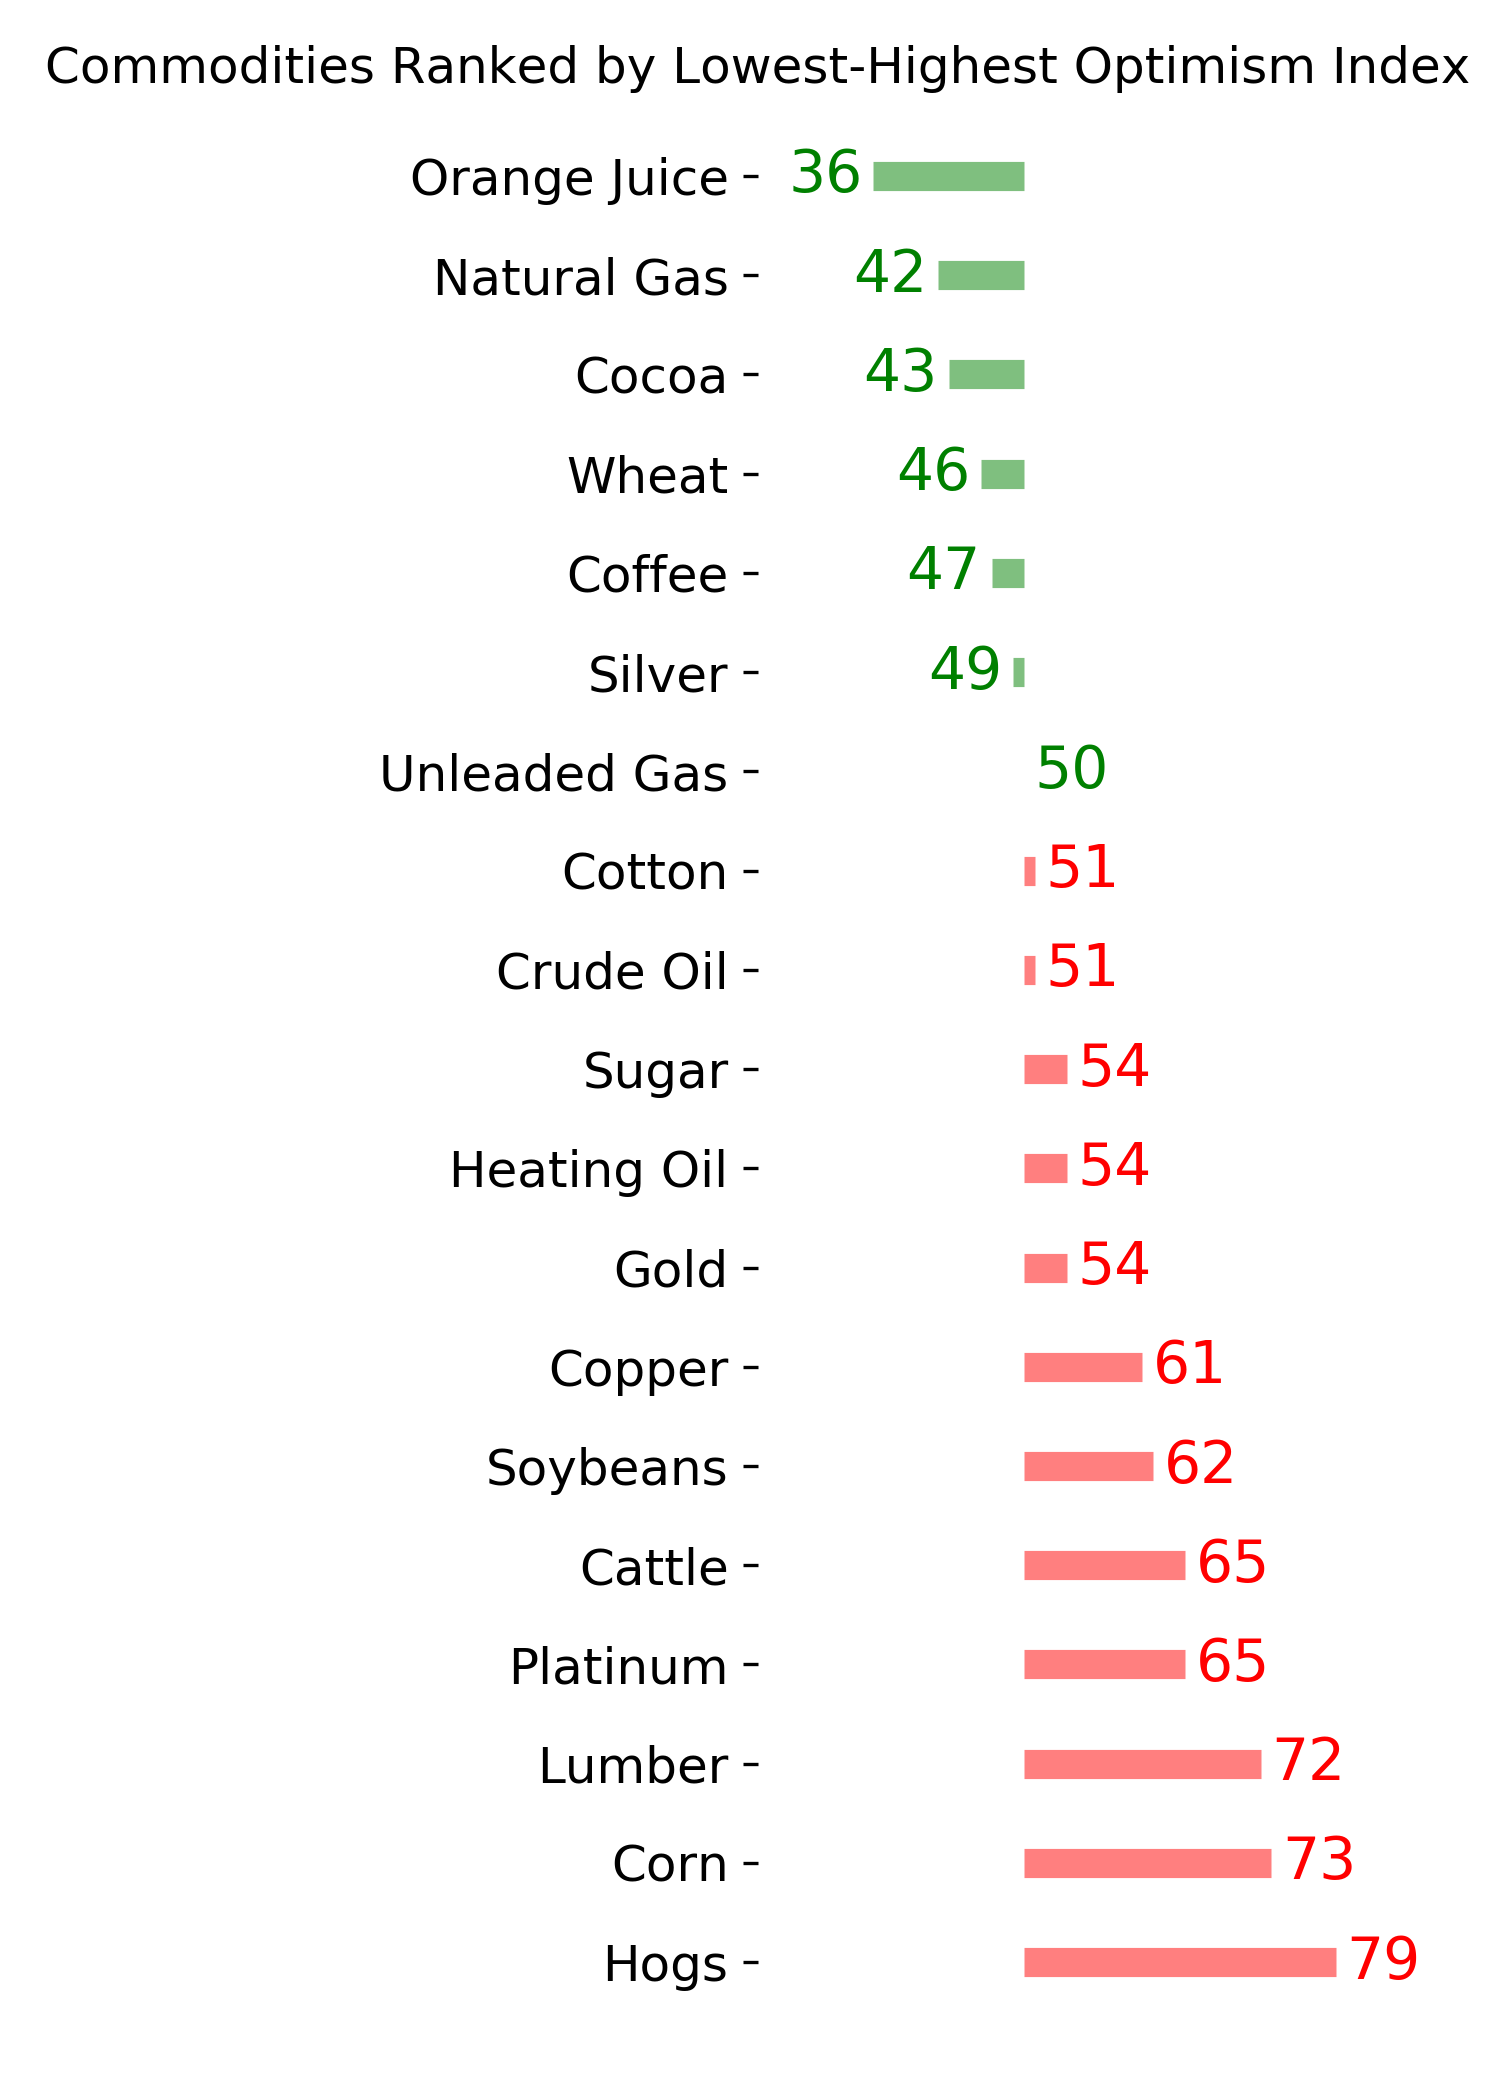
The Optimism Index Heatmap shows that the 20-day average Optix among markets and ETFs has only a few markets in the lower-right corner, where we see pessimism. That's the yen, volatility, and bonds.
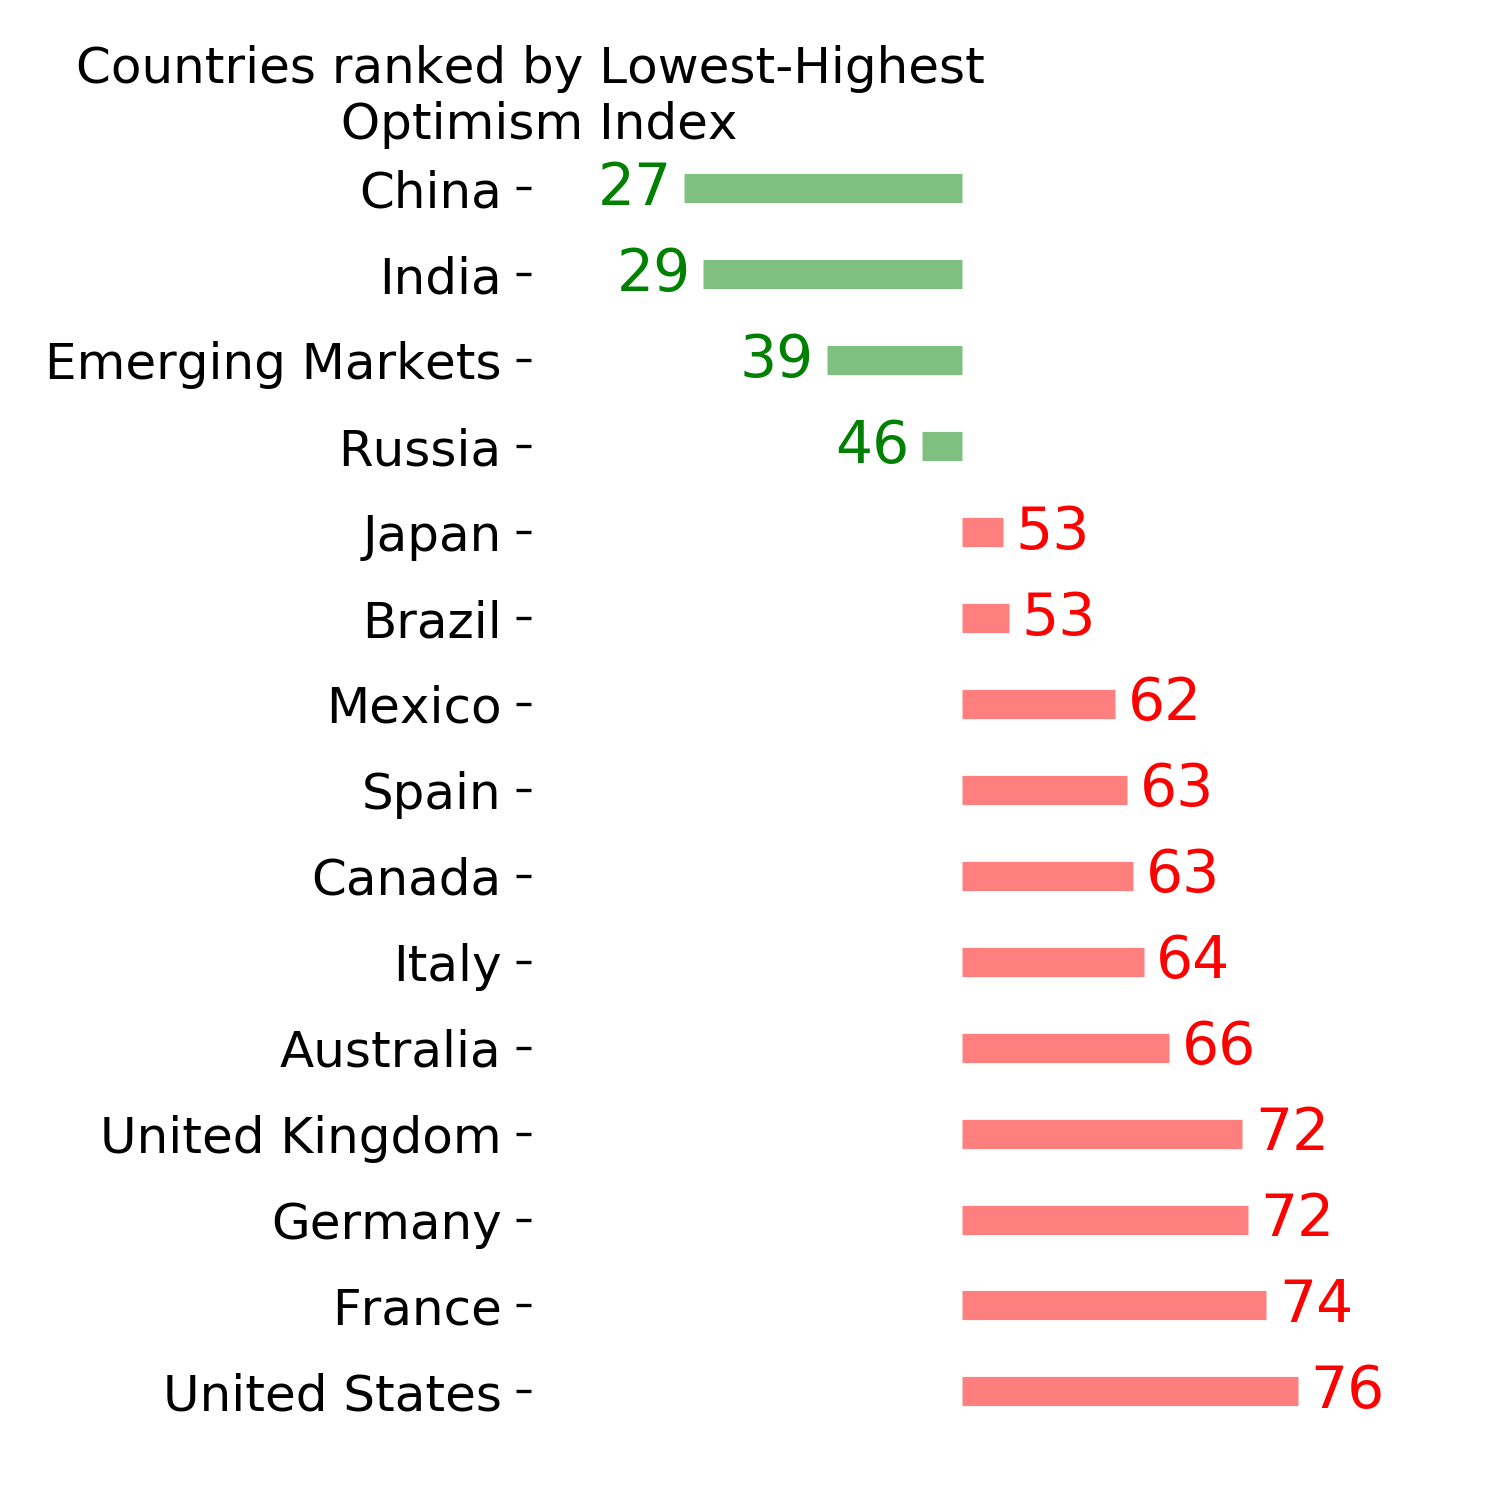
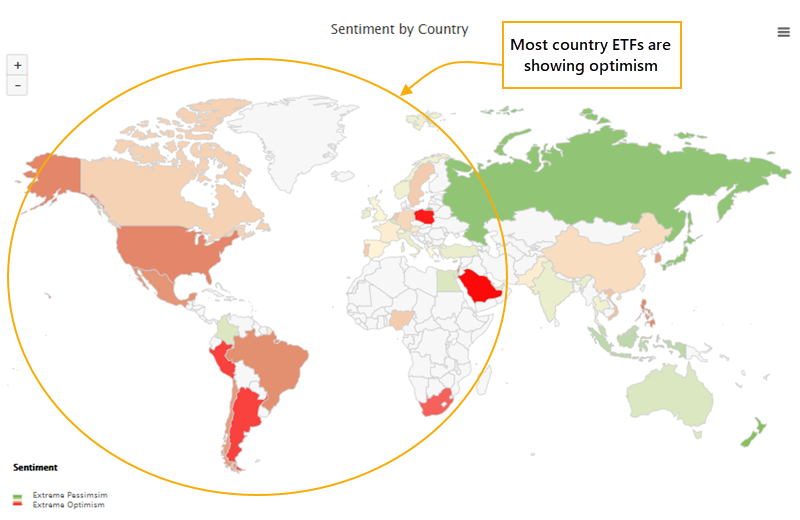
And the Geo-Map shows that around the world, there are few pockets of even minor pessimism (green countries).
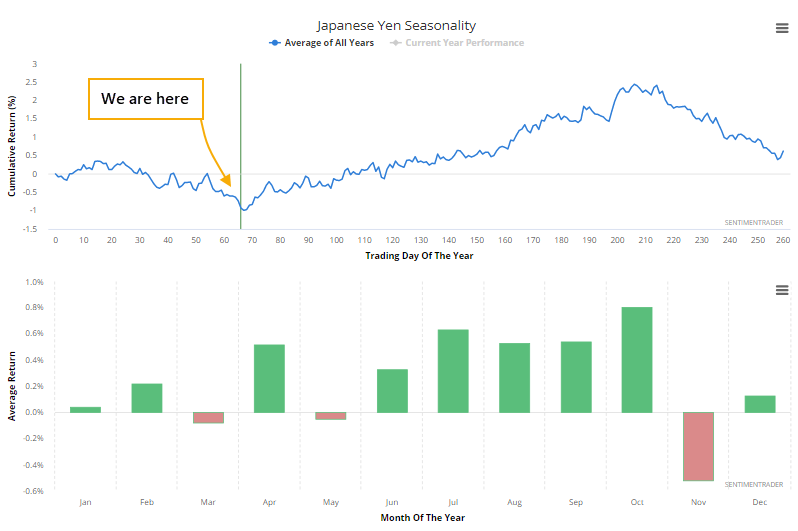
We'll get to sentiment on the yen in a moment, because the yen is about to bottom, if the calendar is any indication. Today marks the start of the best seasonal window in that market.
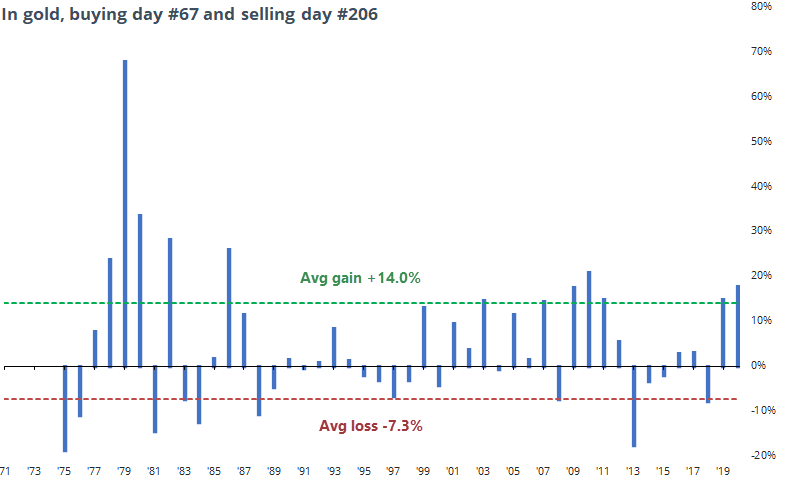
We would never suggest taking seasonal biases that literally. This is an average yearly price path over decades, and any individual year can deviate wildly from the average. It simply shows us whether there are times when trends tend to have a certain bias, and for the yen, that bias has been positive from early April through mid-October.
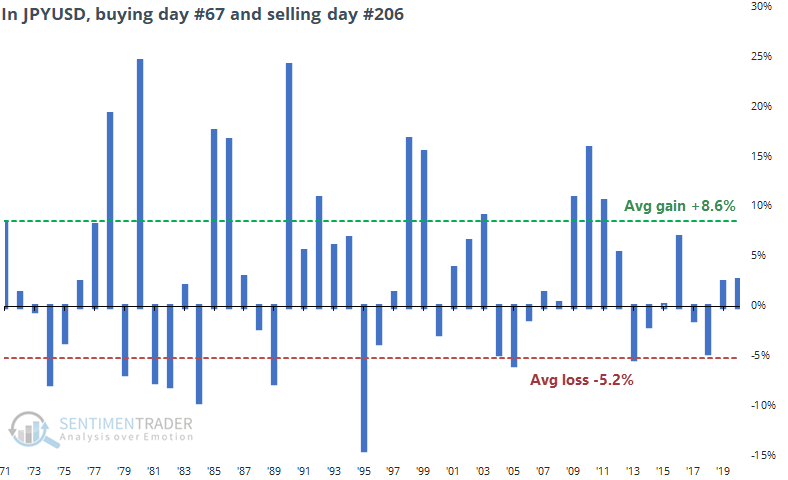
Over the past 50 years in the JPYUSD cross, buying day #67 (early April) and selling day #26 (mid-October) has been a decent trade. The win rate was 62%, but the average win was quite a bit higher than the average loss.
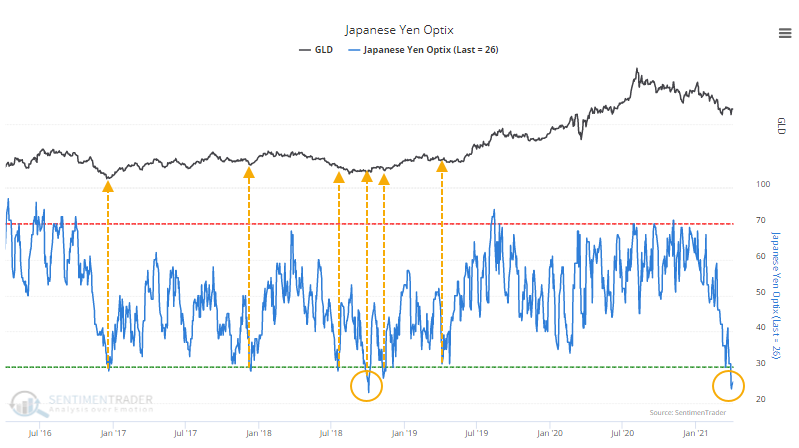
The seasonality chart for gold looks similar to that of the yen, and it's not by mistake. The dollar, and its performance against the yen, has a high correlation to gold returns.
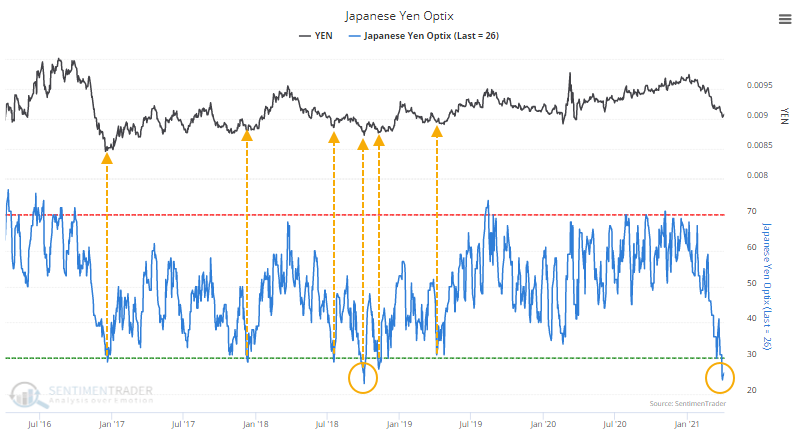
This is particularly interesting now because sentiment on the yen is about as depressed as it has been at any point in over 5 years. The Optimism Index recently dropped below 25 for only the 2nd time since 2015. The other was early October 2018, marking a major low for the currency.
And, again, if we use gold as a substitute, the pessimism in the yen tended to coincide roughly with troughs in the precious metal. After that pessimism in the yen, gold took off to the upside.
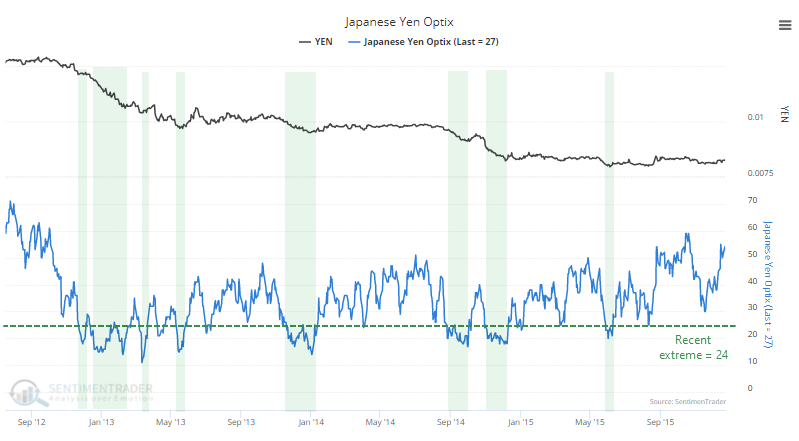
Here's the biggest caveat - optimism in the yen is low only by bull market or trading range standards. In a structural bear market, optimism this low has not been a reason to buy. If anything, it's been a better signal to sell.
The bear market from 2013 - 2015 is a prime example. When the Optimism Index dropped to its recent extreme of 24%, then yen showed an inconsistent, and temporary, tendency to rebound.
If the currency is going to recover from its recent bout of pessimism, then now is as good a time as any.
As always, when a market doesn't do what it should, then it tells us a lot about the market environment. And if the yen can't stem its losses soon, then we'd have a very good clue that the longer-term environment is poor, and rallies should be used for selling. For buyers, an Optimism Index below 20 would be a more reliable buy signal, and even that would be shorter-term and speculative.
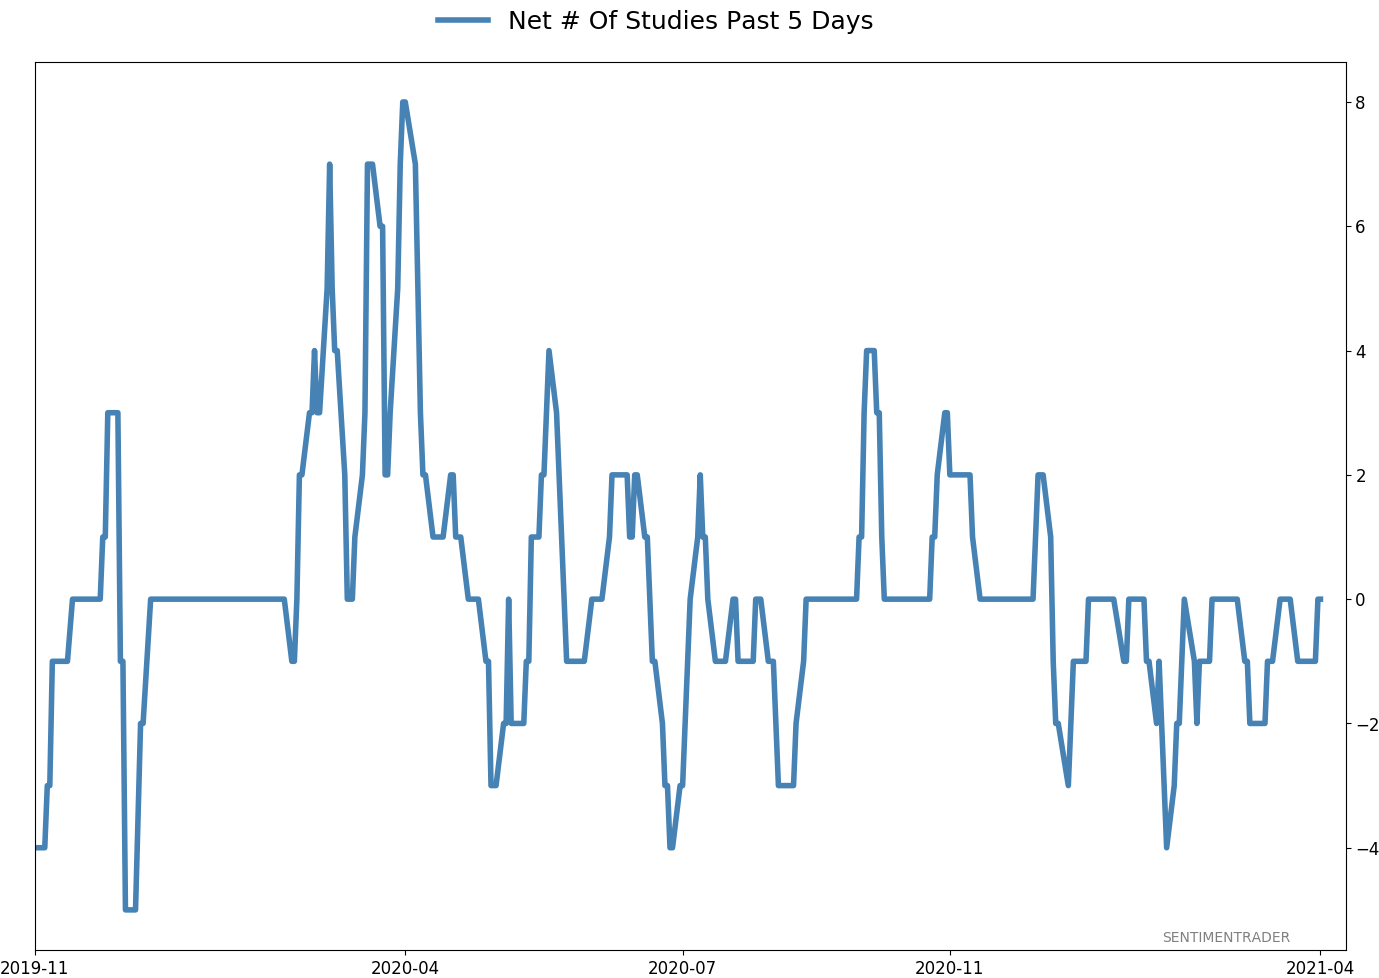
Active Studies
| Time Frame | Bullish | Bearish | | Short-Term | 0 | 0 | | Medium-Term | 0 | 10 | | Long-Term | 11 | 4 |
|
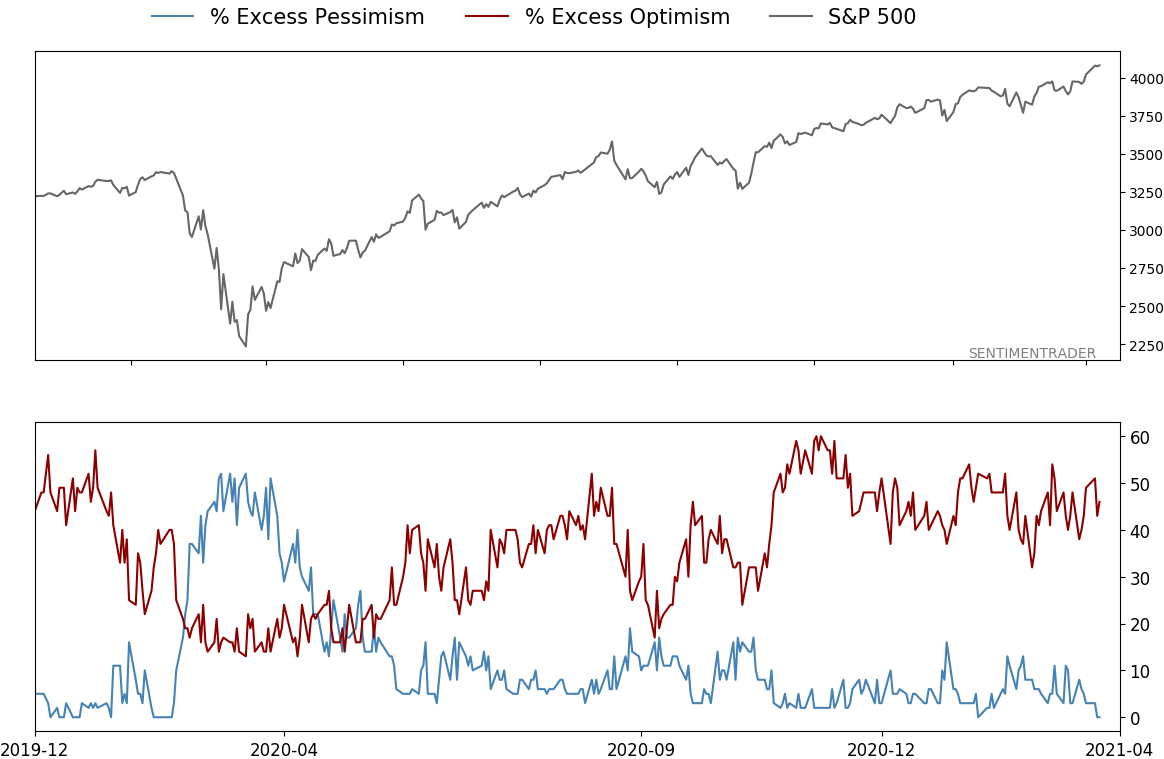
Indicators at Extremes
|
% Showing Pessimism: 0%
Bullish for Stocks
|
|
Portfolio
| Position | Description | Weight % | Added / Reduced | Date | | Stocks | RSP | 4.9 | Reduced 4% | 2021-02-09 | | Bonds | 30.0% BND, 8.8% SCHP | 38.8 | Added 15.1% | 2021-02-18 | | Commodities | GCC | 2.3 | Reduced 2.1%
| 2020-09-04 | | Precious Metals | GDX | 9.0 | Added 0.1% | 2021-02-18 | | Special Situations | 7.3% XLE, 4.8% PSCE | 12.1 | Reduced 5.6% | 2021-02-18 | | Cash | | 32.8 | | |
|
Updates (Changes made today are underlined)
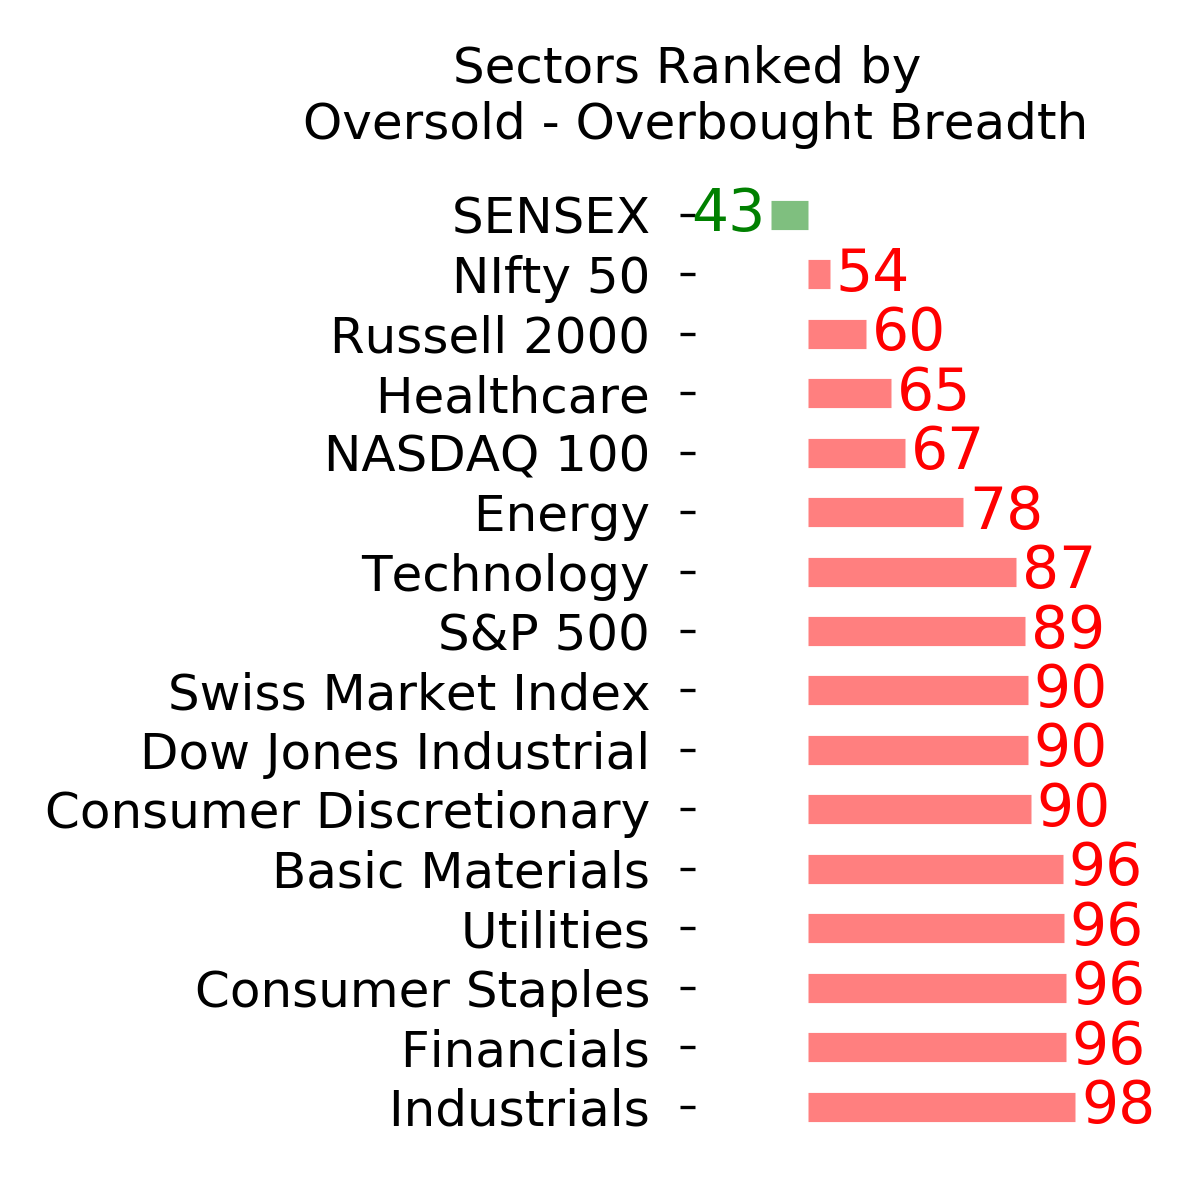
With a market that has seen the kinds of broad participation and big breath thrusts like we did in the fall, it's hard to become too negative. Those kinds of conditions have consistently preceded higher returns over the next 6-12 months. It's the interim that's more of an issue. Even conditions like that haven't prevented some shorter-term pullbacks. And when we combine an environment where speculation is rampant and recent days have seen an increase in cracks under the surface of the indexes, it's enough to become more defensive over a short- to medium-term time frame. We still don't have much confirmation from the price action in the indexes, so those who are more conservative would likely wait before increasing cash levels. I've decreased risk exposure a bit more, mainly in terms of energy stocks and the ANGL fund, while adding more to the broader bond market. RETURN YTD: 6.6% 2020: 8.1%, 2019: 12.6%, 2018: 0.6%, 2017: 3.8%, 2016: 17.1%, 2015: 9.2%, 2014: 14.5%, 2013: 2.2%, 2012: 10.8%, 2011: 16.5%, 2010: 15.3%, 2009: 23.9%, 2008: 16.2%, 2007: 7.8%
|
|
Phase Table
Ranks
Sentiment Around The World
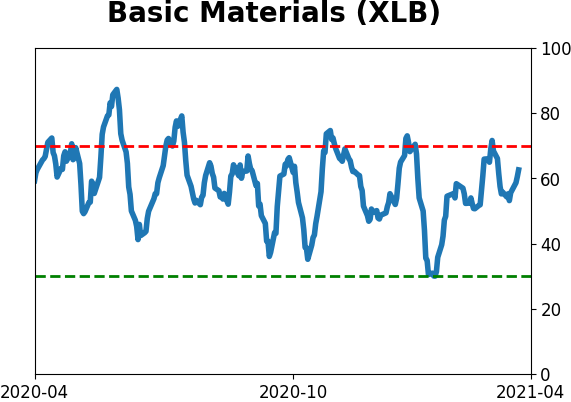
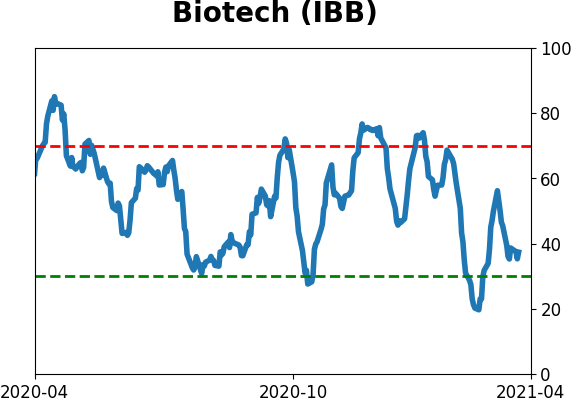
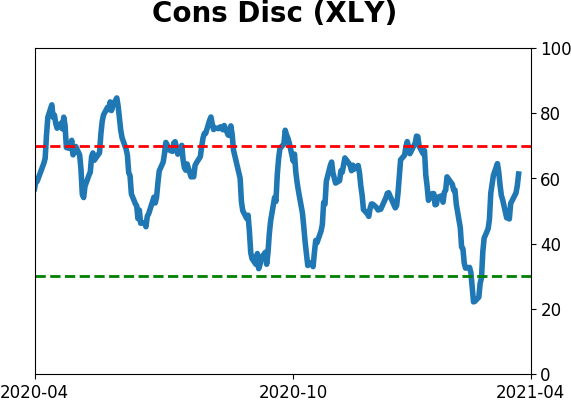
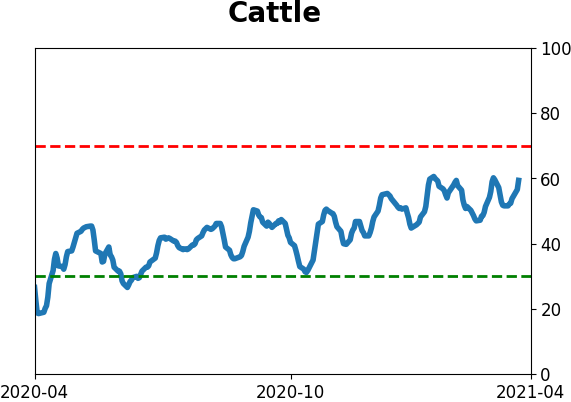
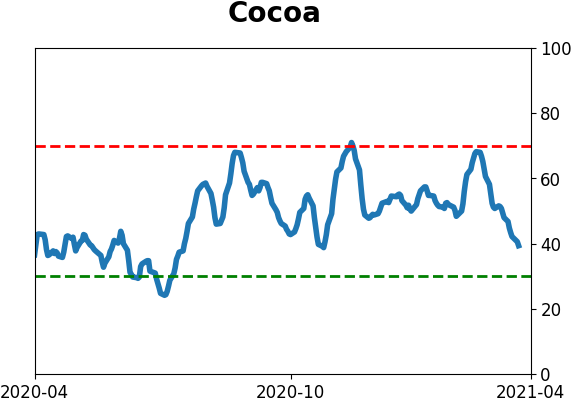
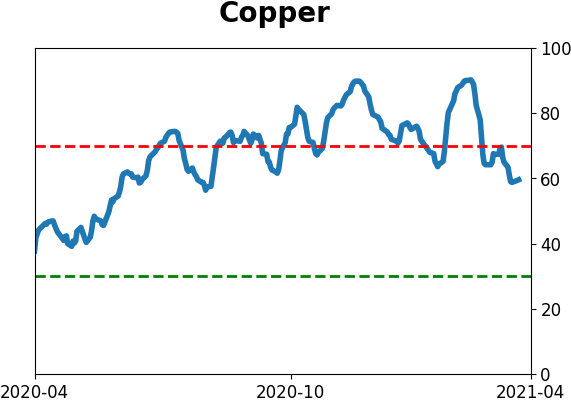
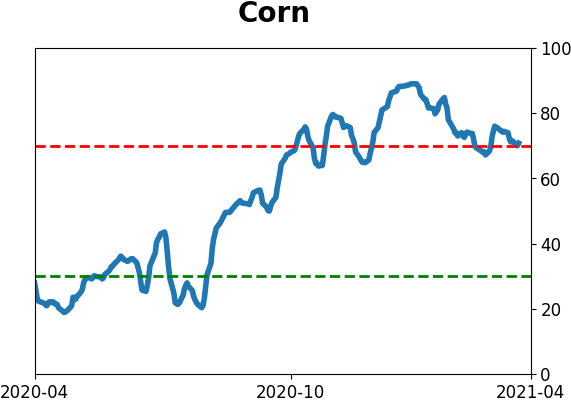
Optimism Index Thumbnails
|
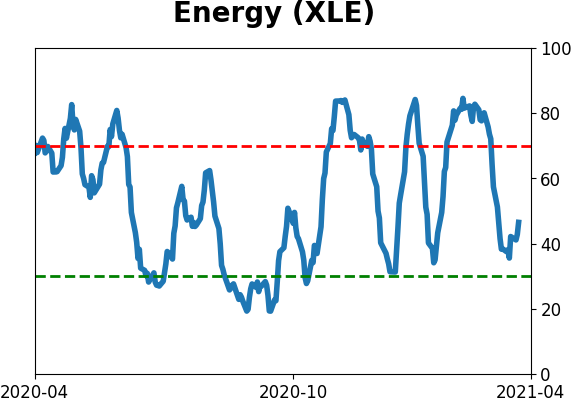
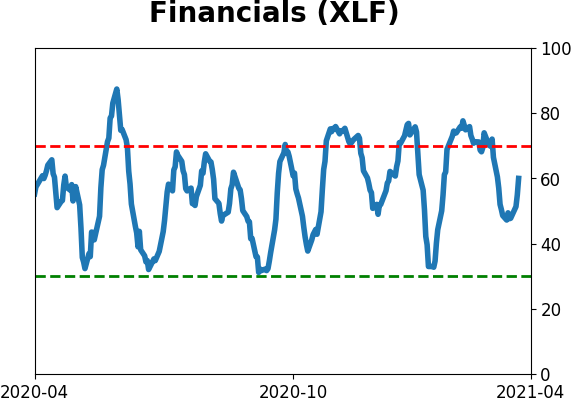
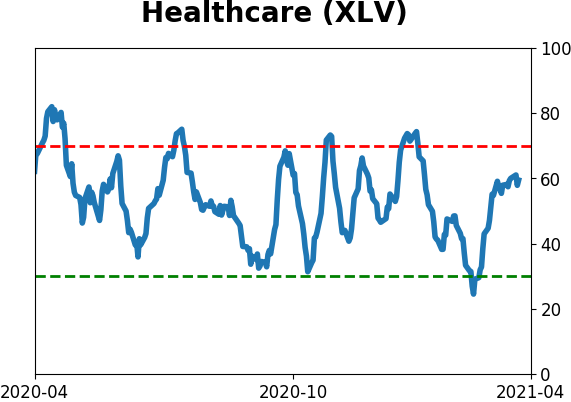
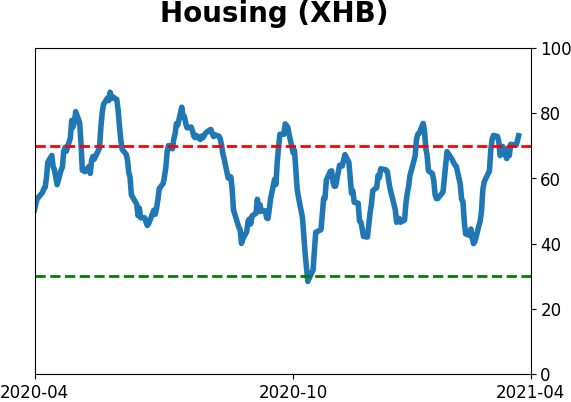
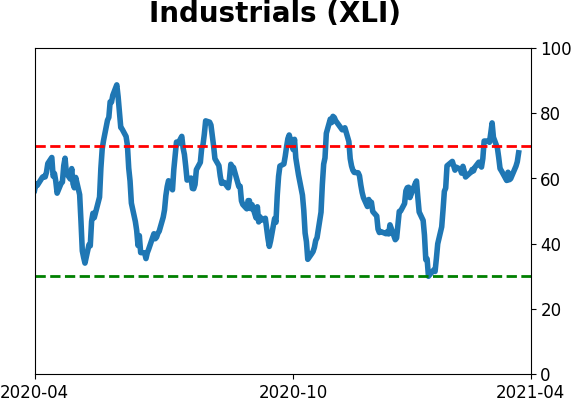
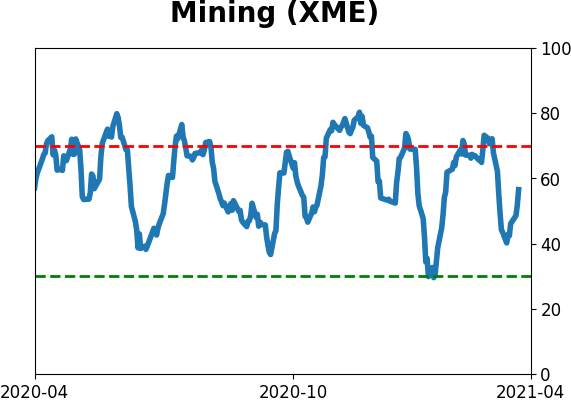
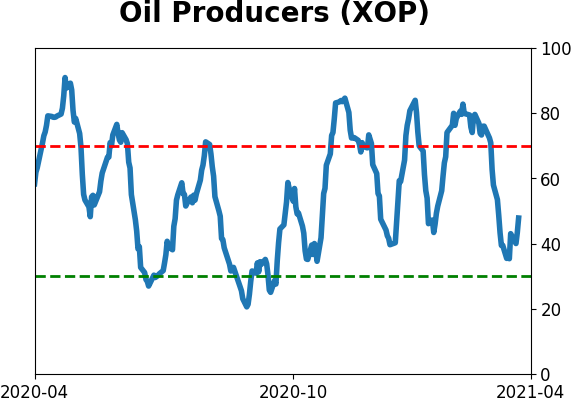
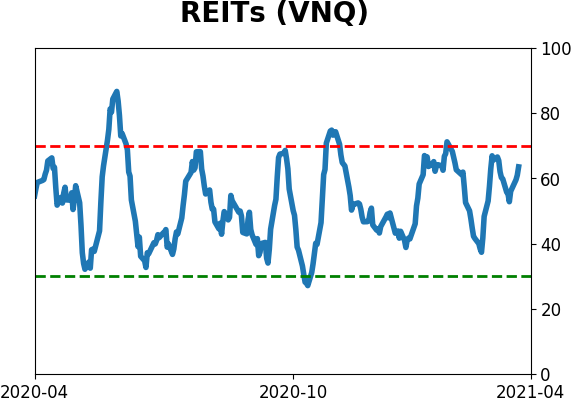
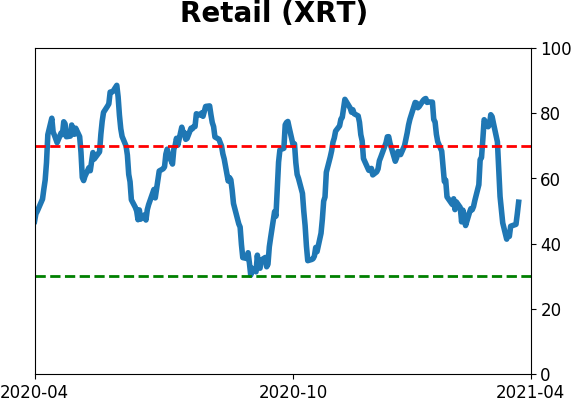
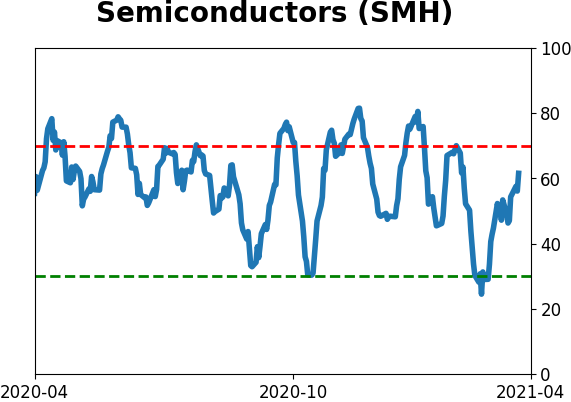
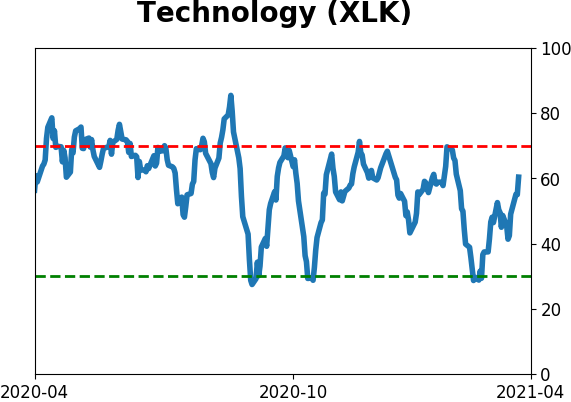
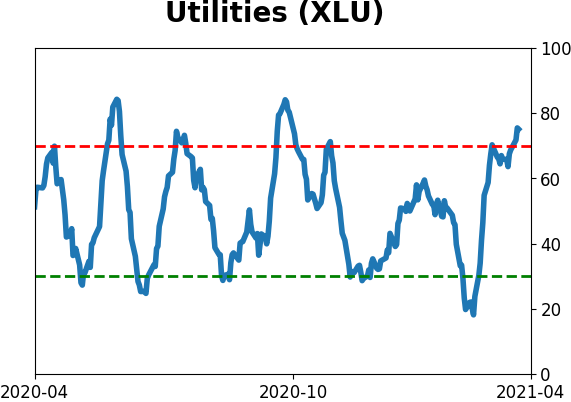
Sector ETF's - 10-Day Moving Average
|
|
|
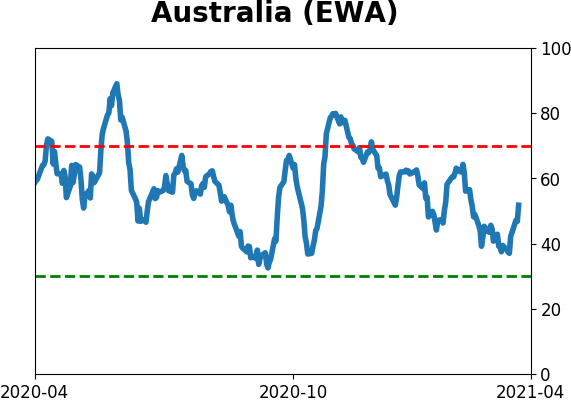
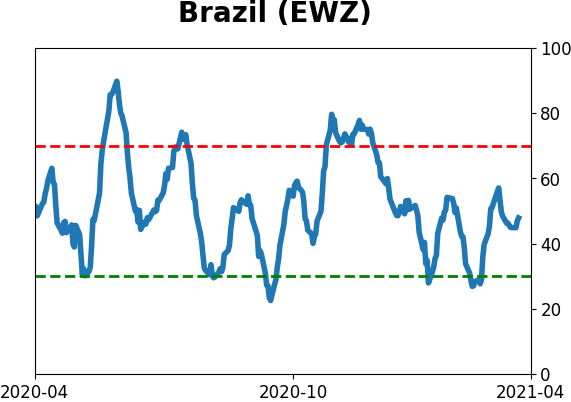
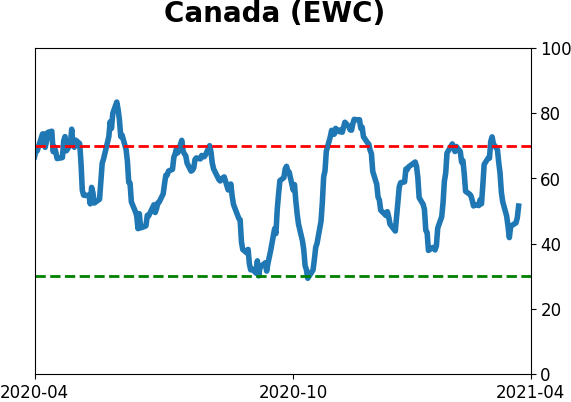
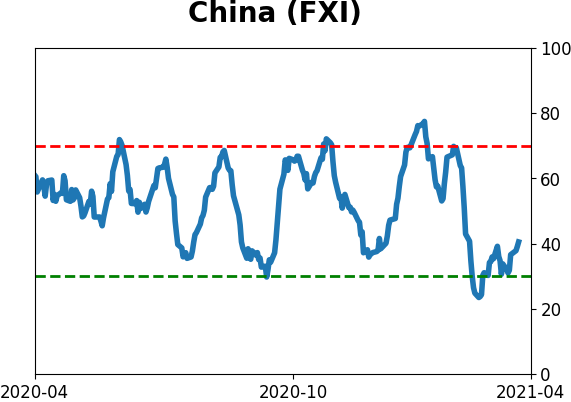
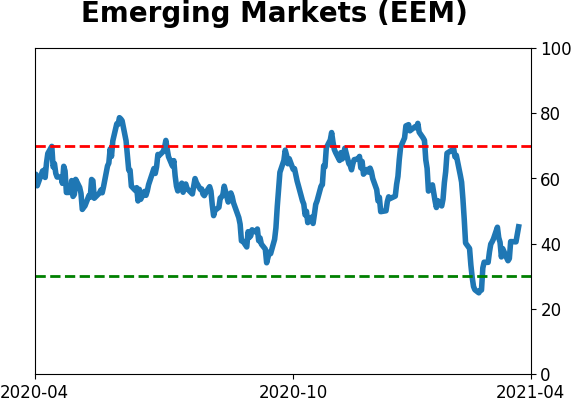
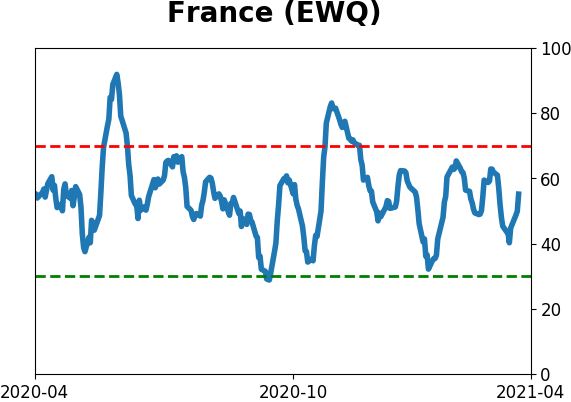
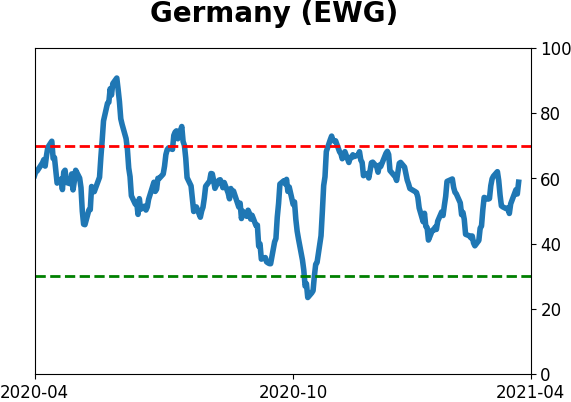
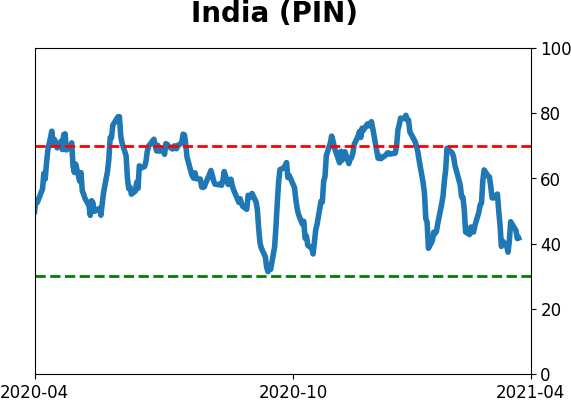
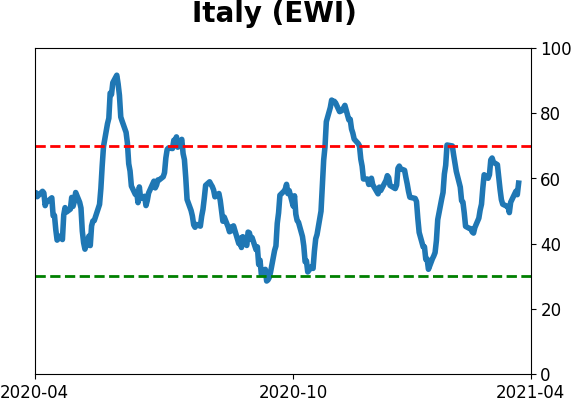
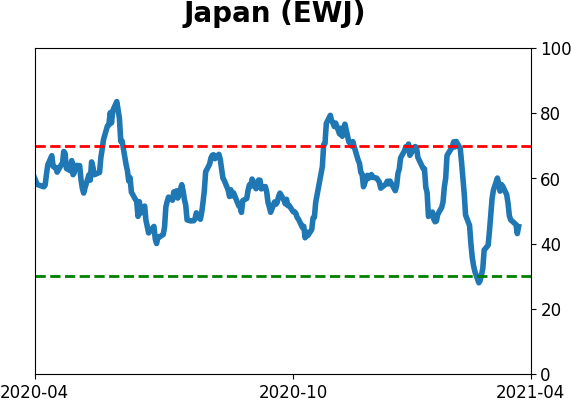
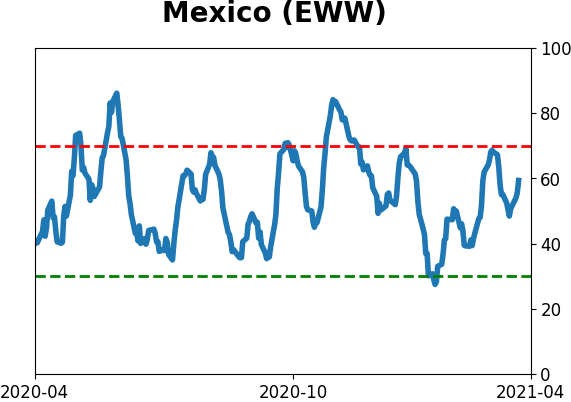
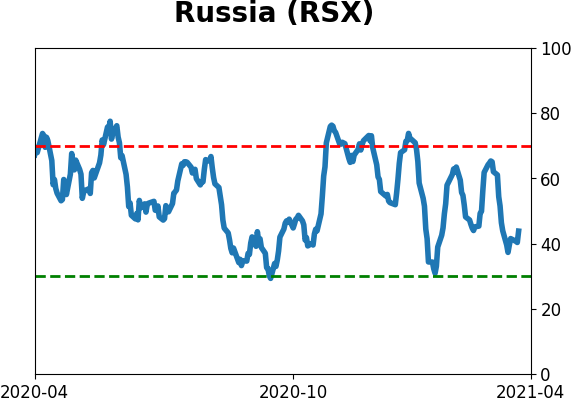
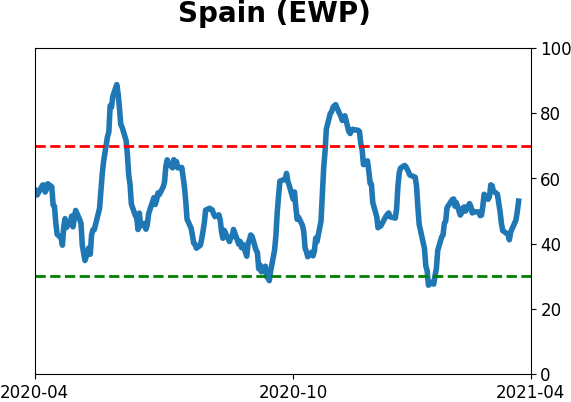
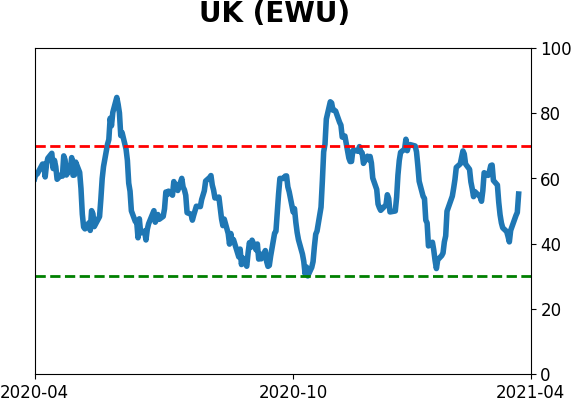
Country ETF's - 10-Day Moving Average
|
|
|
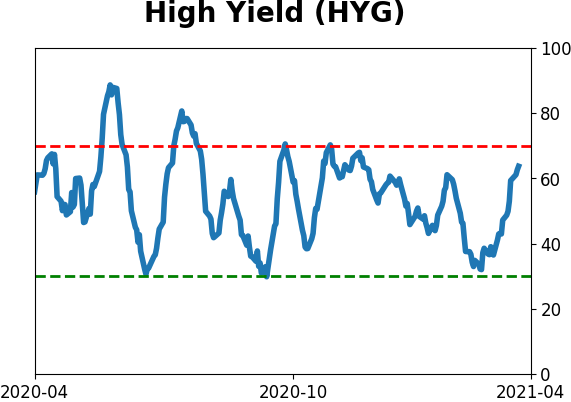
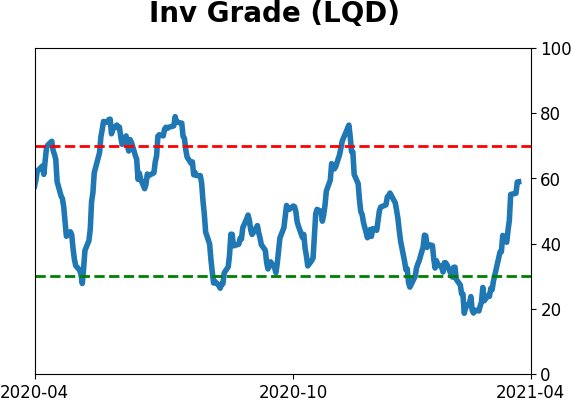
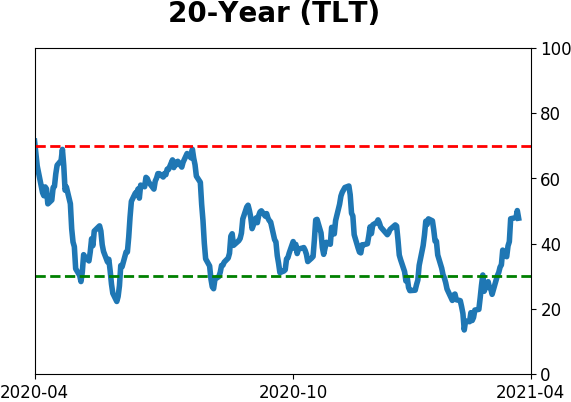
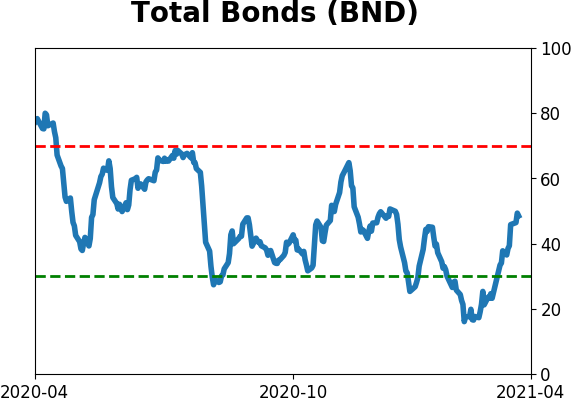
Bond ETF's - 10-Day Moving Average
|
|
|
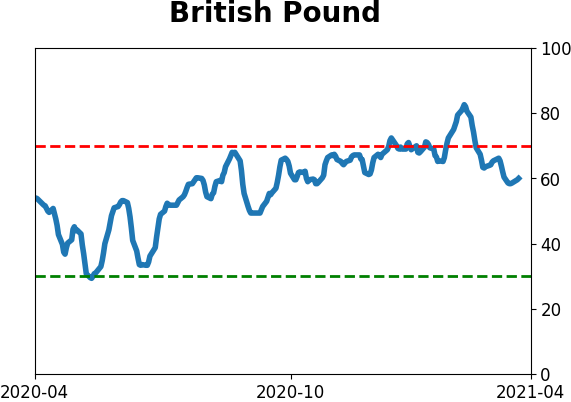
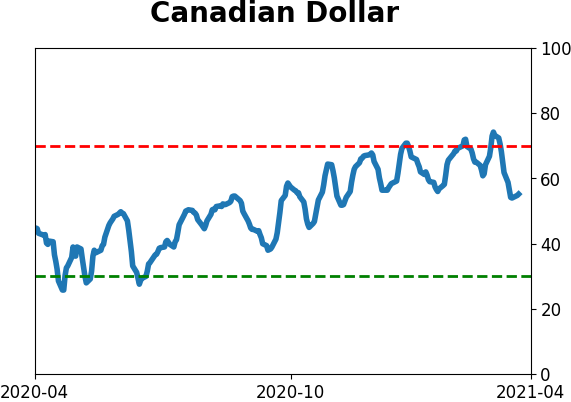
Currency ETF's - 5-Day Moving Average
|
|
|
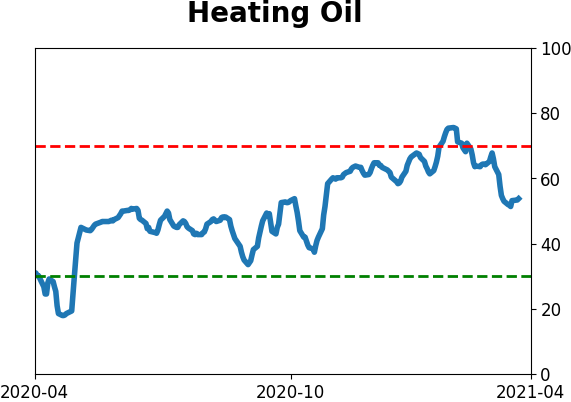
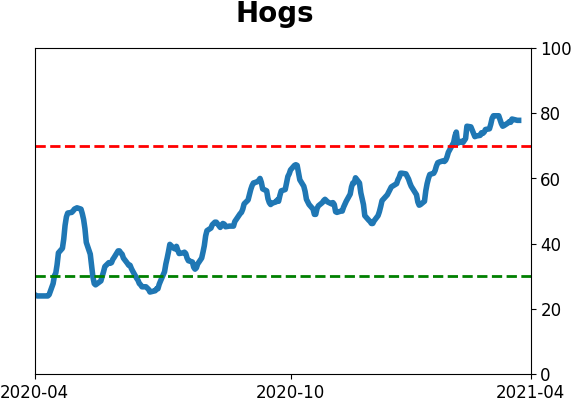
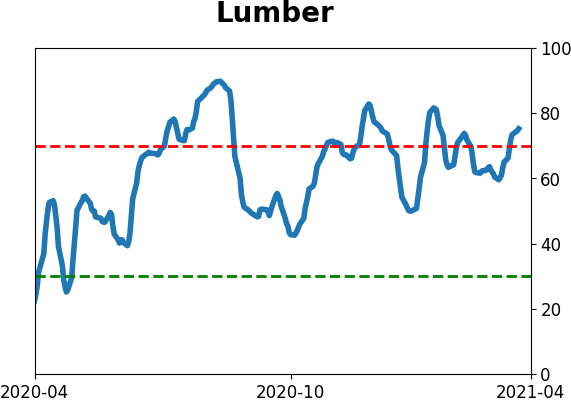
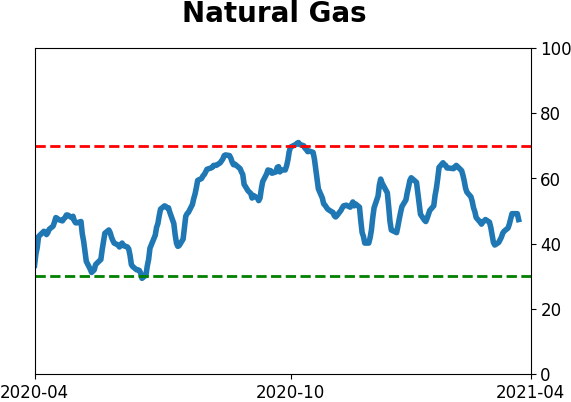
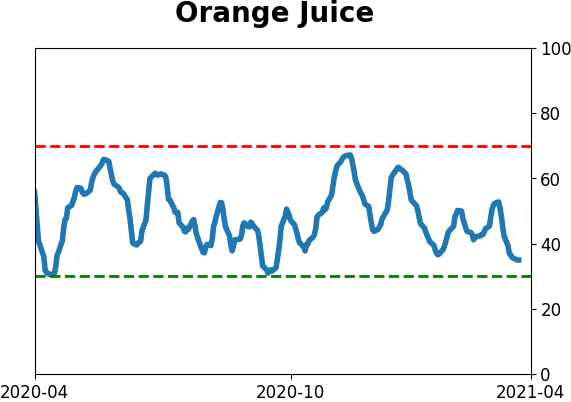
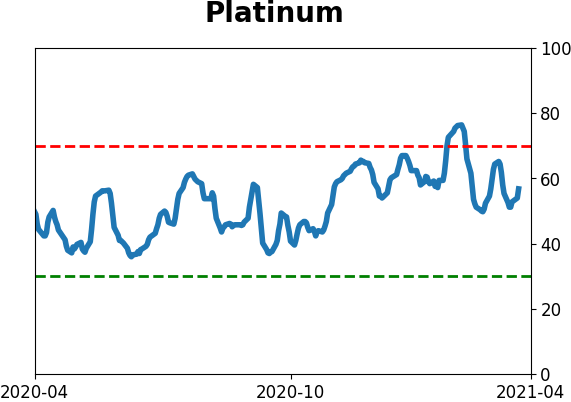
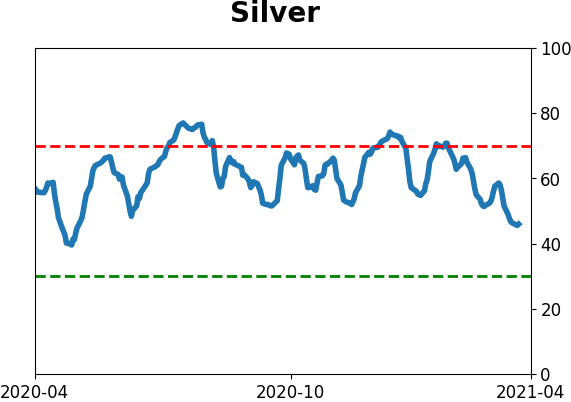
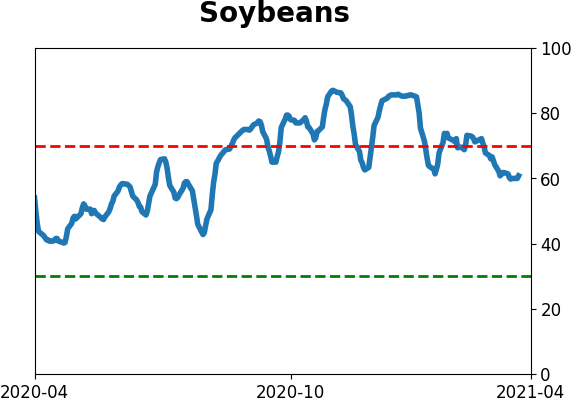
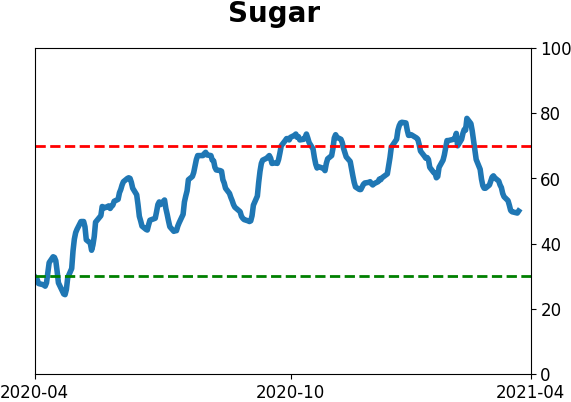
Commodity ETF's - 5-Day Moving Average
|
|