Headlines
|
|
Wall Street strategists stay put as index roars:
Wall Street strategists haven't been raising their year-end price targets on the S&P 500 fast enough. The index is now trading above the median estimate for where the index will end the year.
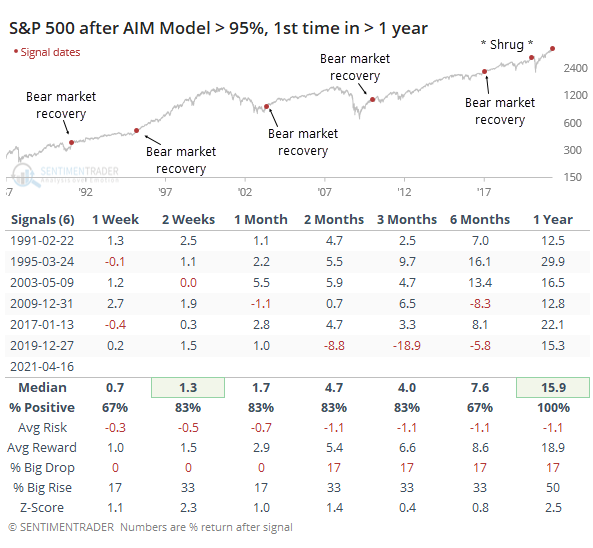
Lotsa bulls: With stocks ignoring every negative, investors have followed along. The investors and advisors that are represented by the AIM Model show near-universal optimism. For the first time in over a year, the model will rise over 95% this week. It's notable that almost every time when surveys were this optimistic, it was in the initial thrust off of a bear market. The most questionable among them was in 2020, which also preceded the biggest (and really only) major decline.
Bottom Line:
See the Outlook & Allocations page for more details on these summaries STOCKS: Weak sell
The extreme speculation registered in January and February is starting to get wrung out. Internal dynamics have mostly held up, so a return to neutral sentiment conditions would improve the forward risk/reward profile substantially. We're still a ways off from that. BONDS: Weak buy
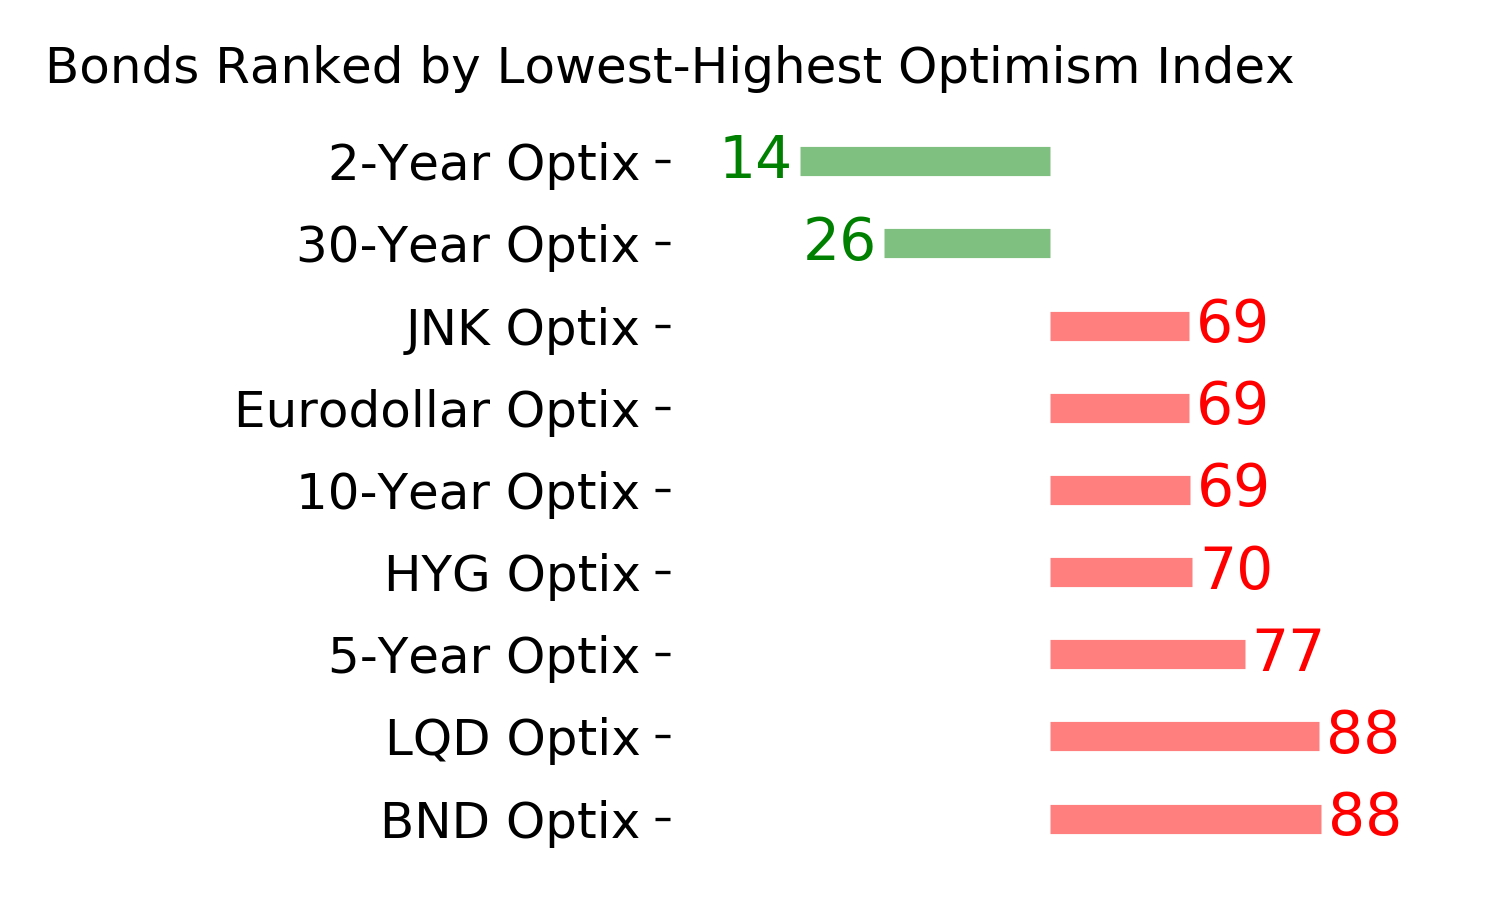
Various parts of the market have been hit in recent weeks, with mild oversold conditions. The Bond Optimism Index is now about as low as it gets during healthy bond market environments. Fixed income isn't responding well, so that needs to be monitored in case it's transitioning to a longer-term negative market environment. GOLD: Weak buy
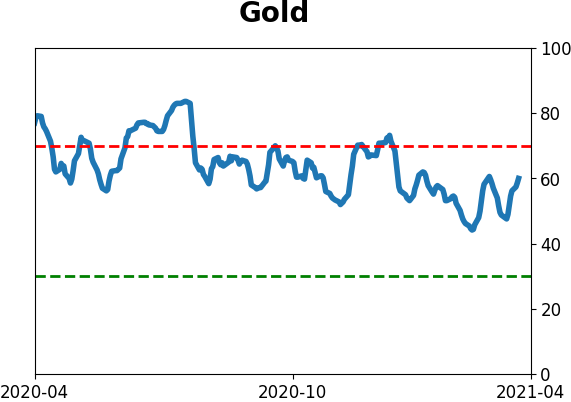
A dollar trying to rebound from a severe short position has weighed on gold and miners. The types of signals they've given in recent weeks, within the context of their recent surge, have usually resulted in higher prices over a medium- to long-term time frame. Like bonds, gold and miners aren't responding very well, and this needs to be monitored.
|
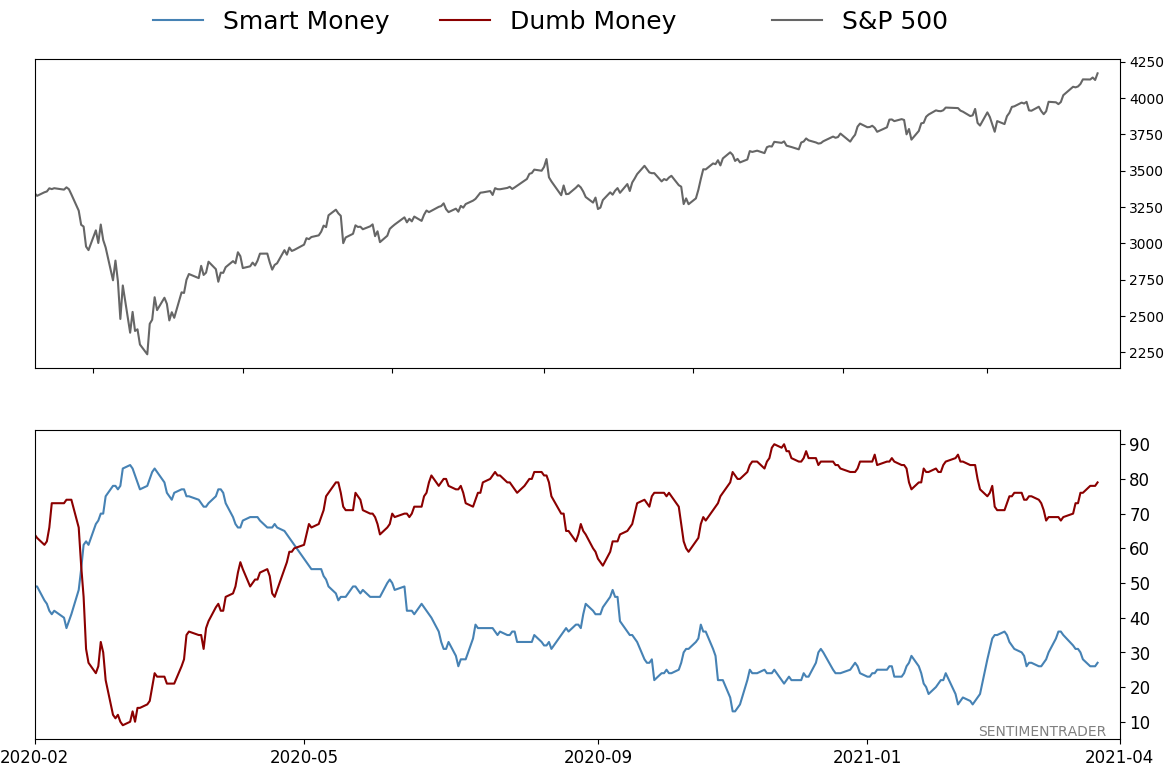
Smart / Dumb Money Confidence
|
Smart Money Confidence: 27%
Dumb Money Confidence: 79%
|
|
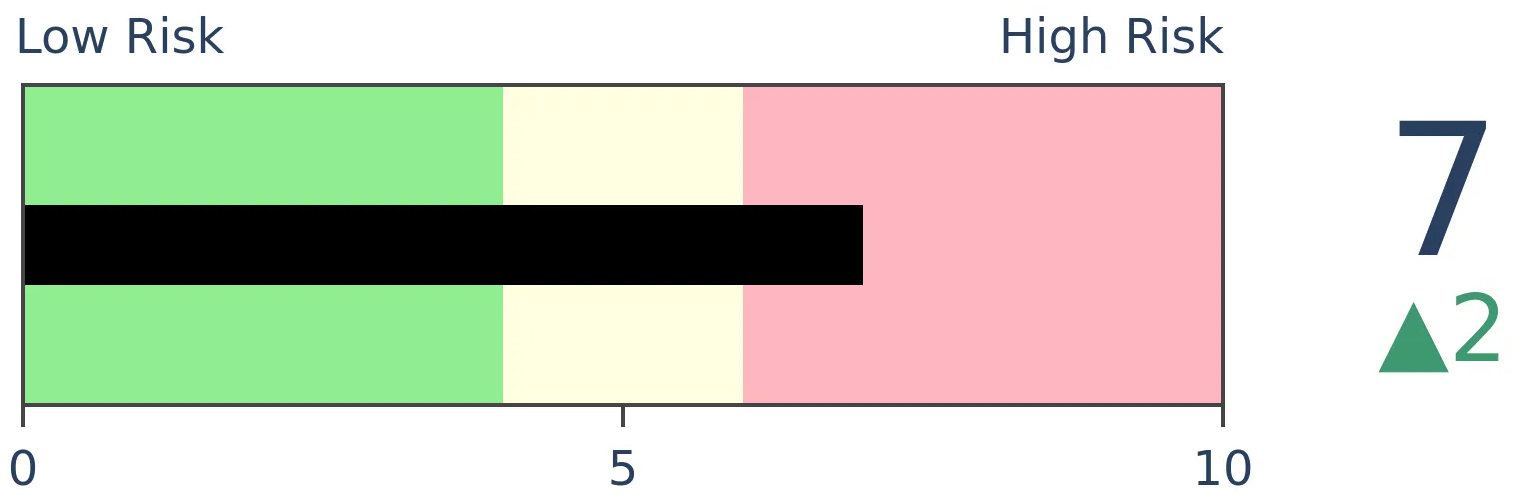
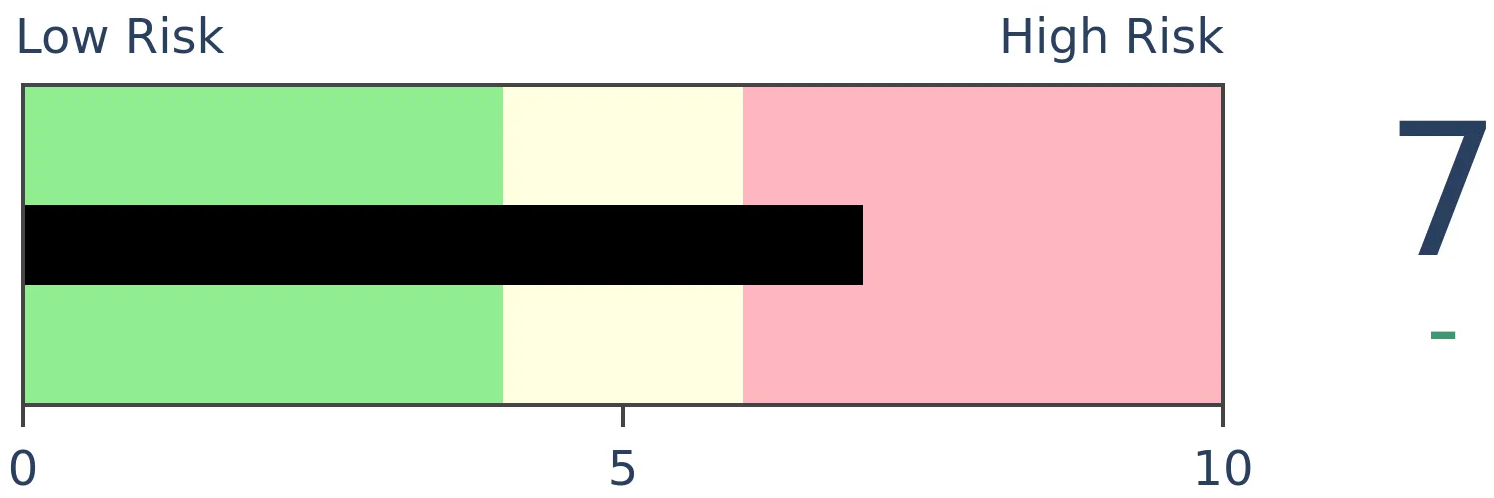
Risk Levels
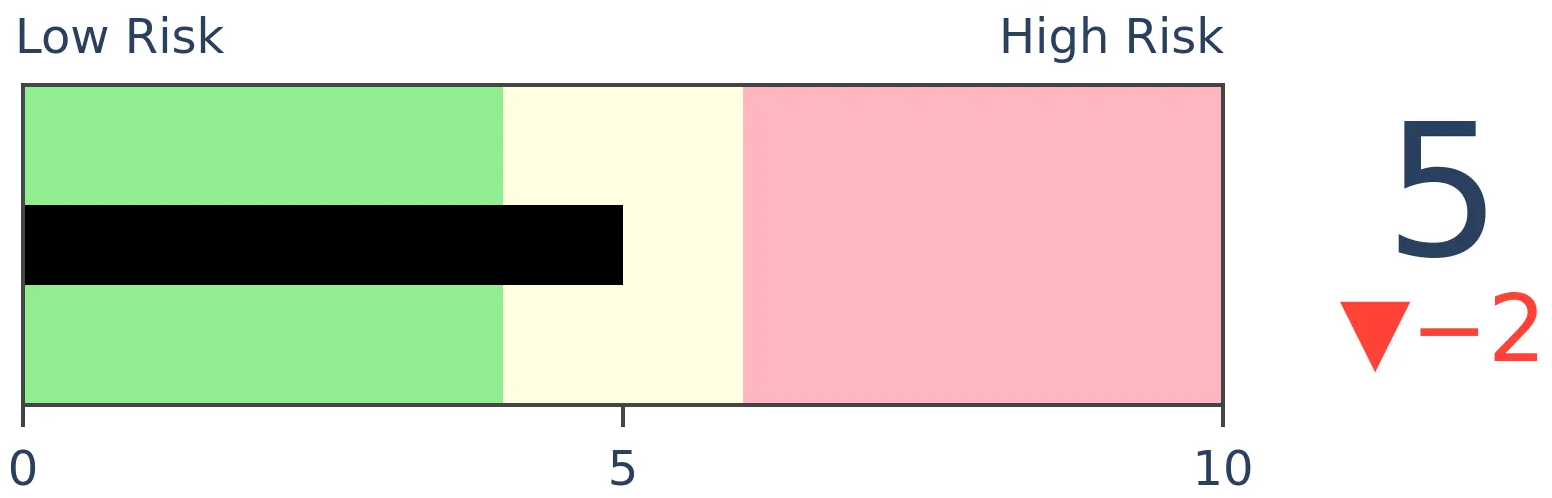
Stocks Short-Term
|
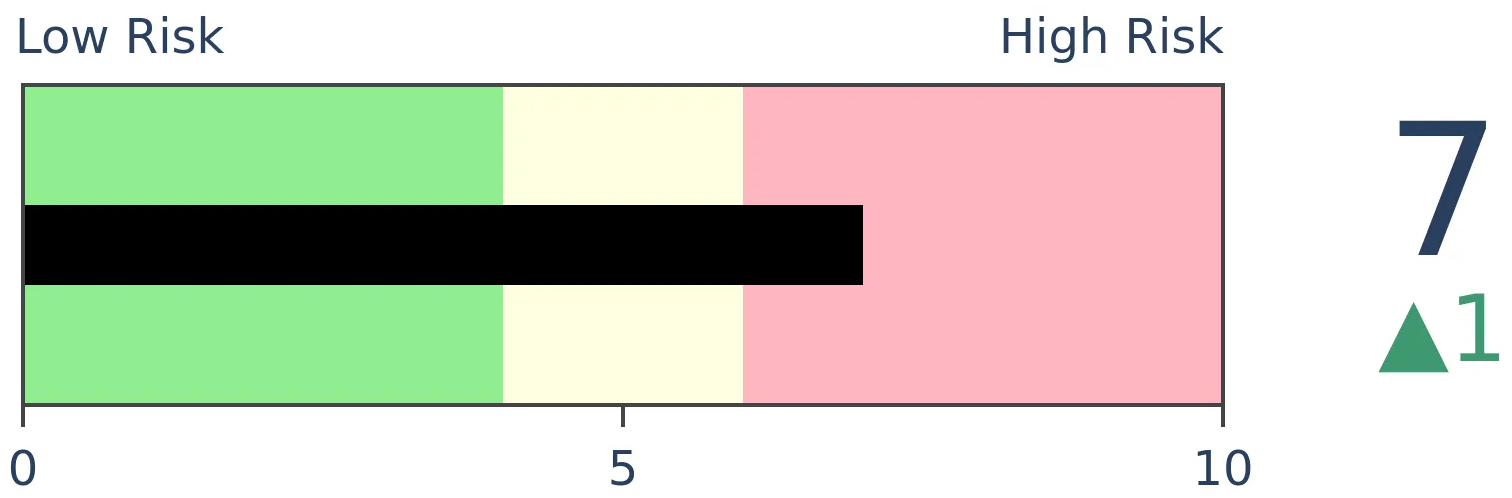
Stocks Medium-Term
|
|
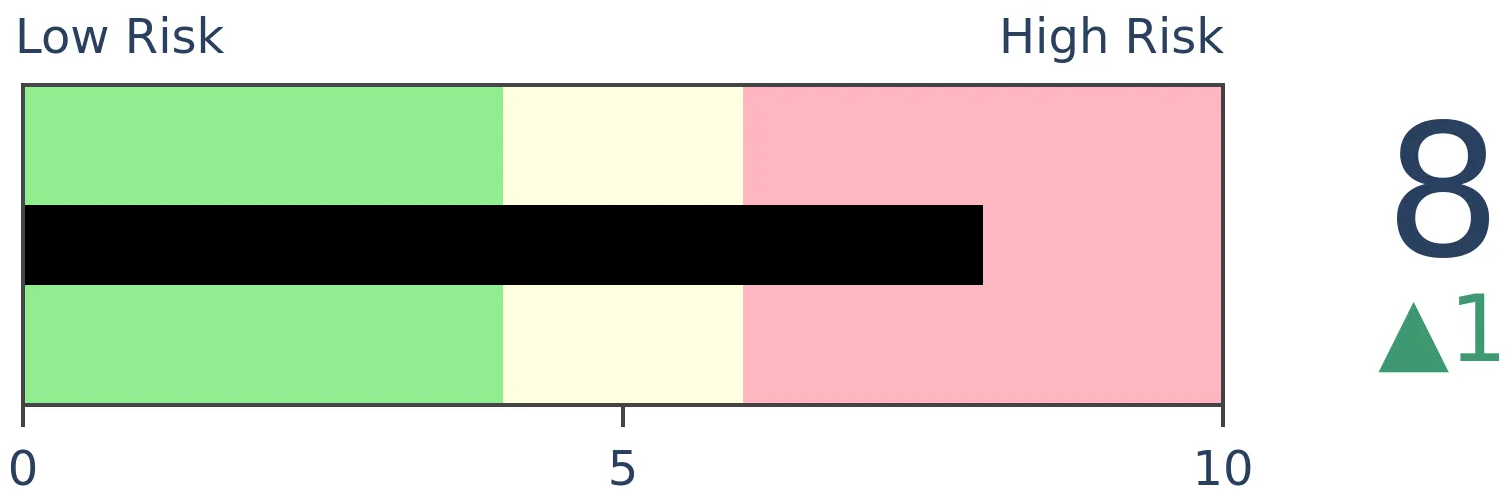
Bonds
|
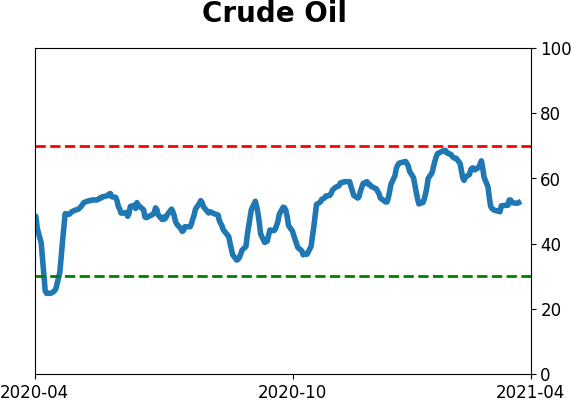
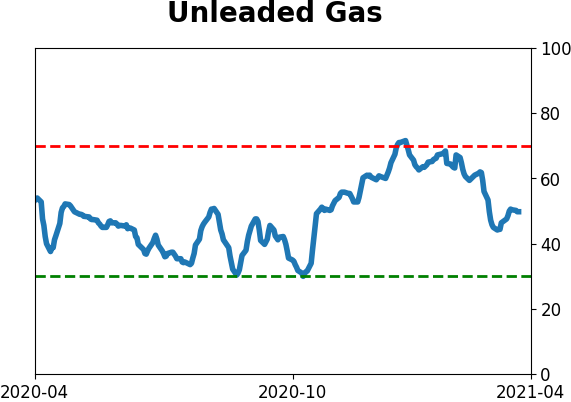
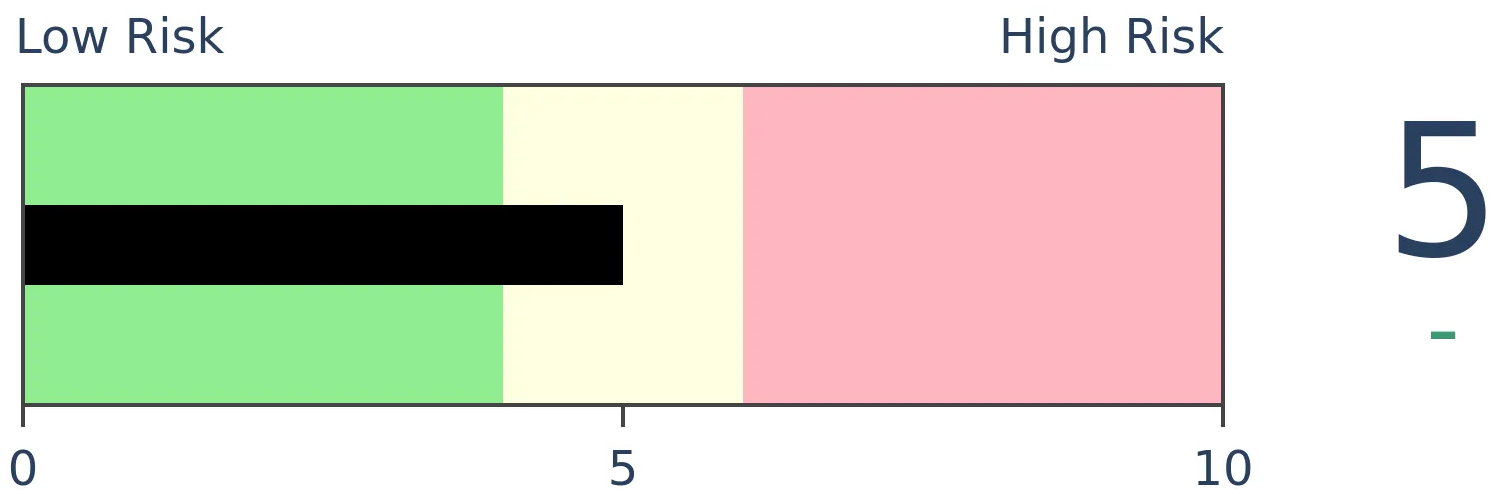
Crude Oil
|
|
Gold
|
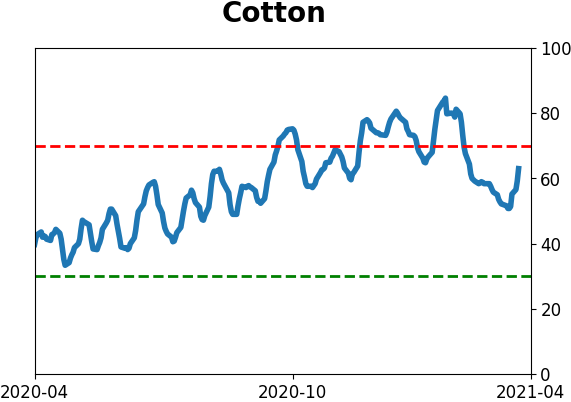
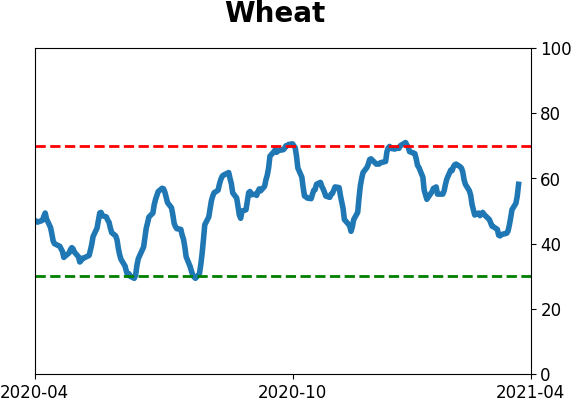
Agriculture
|
|
Research
BOTTOM LINE
Wall Street strategists haven't been raising their year-end price targets on the S&P 500 fast enough. The index is now trading above the median estimate for where the index will end the year.
FORECAST / TIMEFRAME
None
|
Earlier this week, we saw that as companies start to report Q1 earnings results in earnest, Wall Street analysts have been busy upgrading their estimates and price targets.
Analysts tend to work from the bottom up (fundamental earnings outlooks, company management quality, etc.), while strategists on the Street tend to work from the top down (macroeconomic principles, fiscal and monetary analysis, etc.). And those top-down outlooks haven't been able to keep up with stocks' torrid pace.
The S&P 500 is now above the median strategist year-end price target...and it's only April.
We've looked at this many times over the years, with the best opportunities coming when the S&P was 20% or more undervalued relative to strategists' price targets. When it gets more than 5% overvalued, then it has tended to pause and let strategists catch up.
We're not there yet, as the index is only about 1% above its average target price. This level of excess has led to an annualized return about in line with random, even a bit above.
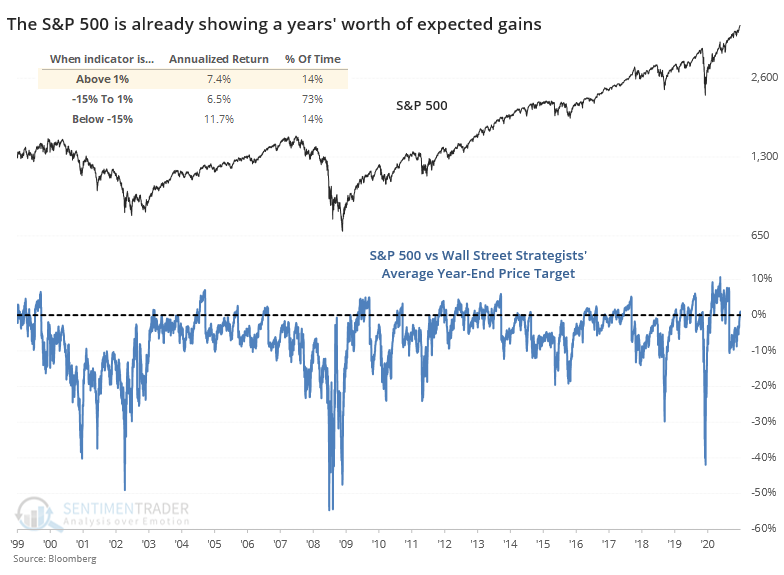
The more this travels above 0, the harder it gets to reach an even greater extreme, because strategists are more likely to upgrade their price targets the further the rally goes. That's why it cycles like it does, as professionals adjust their expectations based on current trends, much like the Economic Surprise Index.
The current minor overvaluation is coming after several months of the index trading below strategists' average price target. Below, we can see forward returns once it first exceeds its year-end price target after several months.
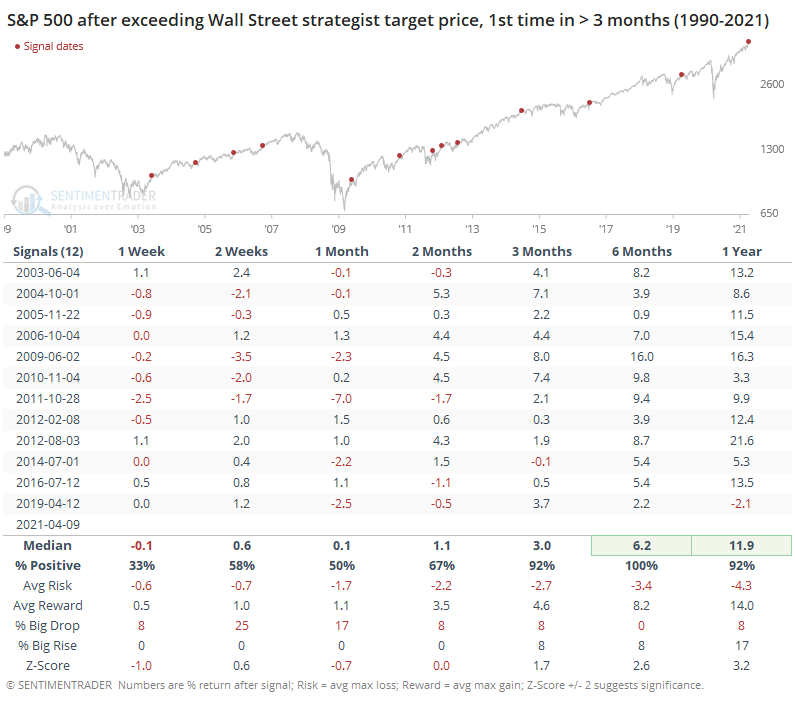
It's more common to see this happen later in the year. Only 2 out of the 12 signals triggered before June, not including the current one. The only other years when it triggered early in the year like this, in 2012 and 2019, the S&P had some trough holding its gains over the next 1-2 months. The usual caveats apply with such a tiny sample size.
Over the next 3-12 months, there were almost no losses and none of any consequence. This is not all that surprising given that it shows impressive momentum from the index, and impressive momentum tends to lead to positive medium- to long-term returns.
Shorter-term, it's more of a (minor) worry.
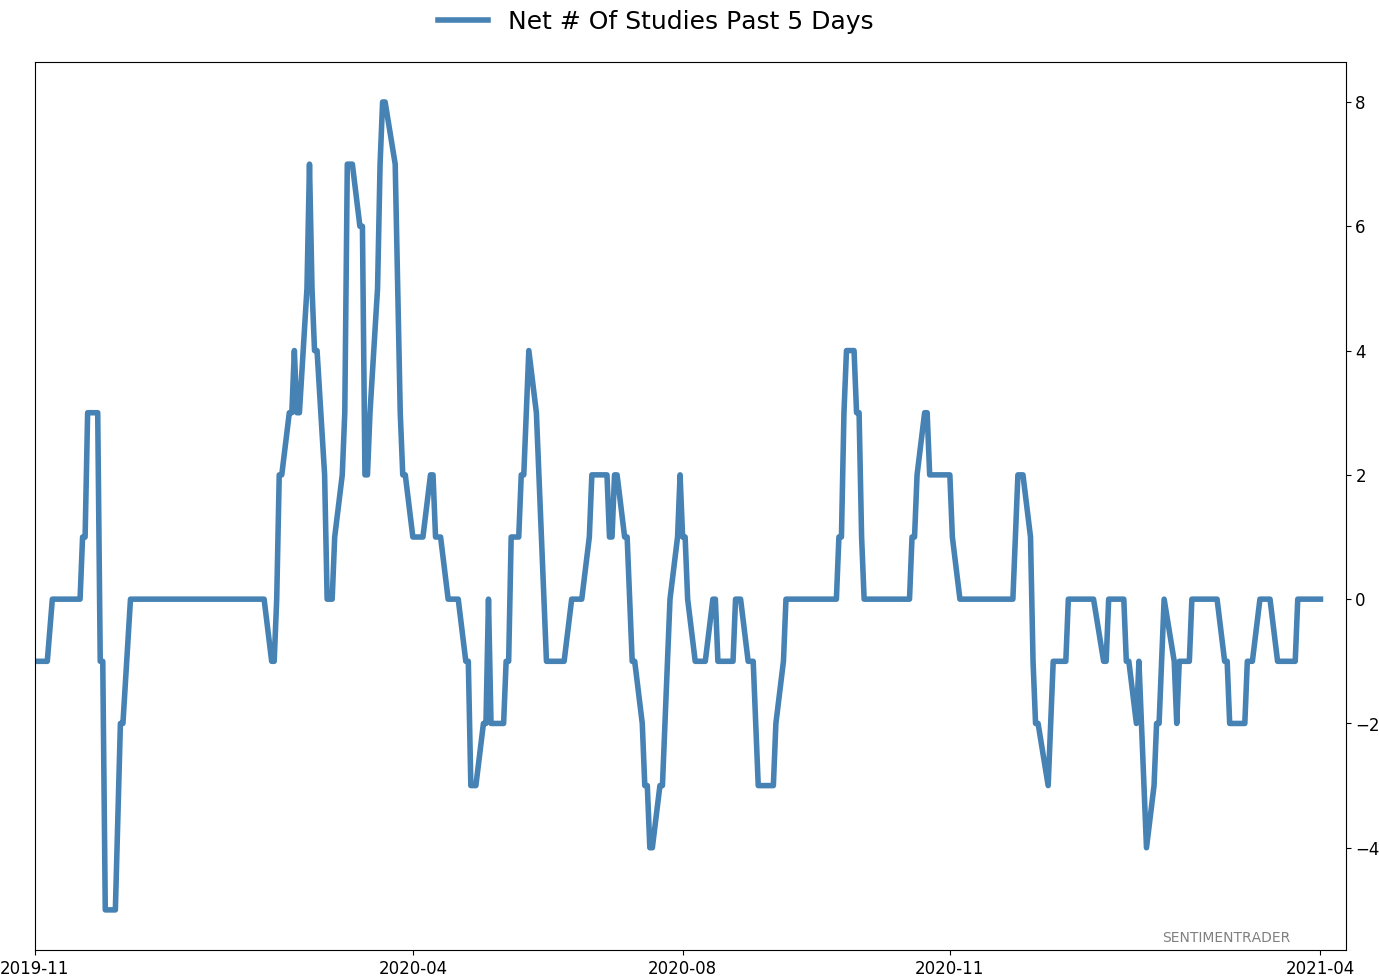
Active Studies
| Time Frame | Bullish | Bearish | | Short-Term | 0 | 0 | | Medium-Term | 0 | 10 | | Long-Term | 11 | 4 |
|
Indicators at Extremes
Portfolio
| Position | Description | Weight % | Added / Reduced | Date | | Stocks | RSP | 4.9 | Reduced 4% | 2021-02-09 | | Bonds | 30.0% BND, 8.8% SCHP | 38.8 | Added 15.1% | 2021-02-18 | | Commodities | GCC | 2.3 | Reduced 2.1%
| 2020-09-04 | | Precious Metals | GDX | 9.0 | Added 0.1% | 2021-02-18 | | Special Situations | 7.3% XLE, 4.8% PSCE | 12.1 | Reduced 5.6% | 2021-02-18 | | Cash | | 32.8 | | |
|
Updates (Changes made today are underlined)
With a market that has seen the kinds of broad participation and big breath thrusts like we did in the fall, it's hard to become too negative. Those kinds of conditions have consistently preceded higher returns over the next 6-12 months. It's the interim that's more of an issue. Even conditions like that haven't prevented some shorter-term pullbacks. And when we combine an environment where speculation is rampant and recent days have seen an increase in cracks under the surface of the indexes, it's enough to become more defensive over a short- to medium-term time frame. We still don't have much confirmation from the price action in the indexes, so those who are more conservative would likely wait before increasing cash levels. I've decreased risk exposure a bit more, mainly in terms of energy stocks and the ANGL fund, while adding more to the broader bond market. RETURN YTD: 7.3% 2020: 8.1%, 2019: 12.6%, 2018: 0.6%, 2017: 3.8%, 2016: 17.1%, 2015: 9.2%, 2014: 14.5%, 2013: 2.2%, 2012: 10.8%, 2011: 16.5%, 2010: 15.3%, 2009: 23.9%, 2008: 16.2%, 2007: 7.8%
|
|
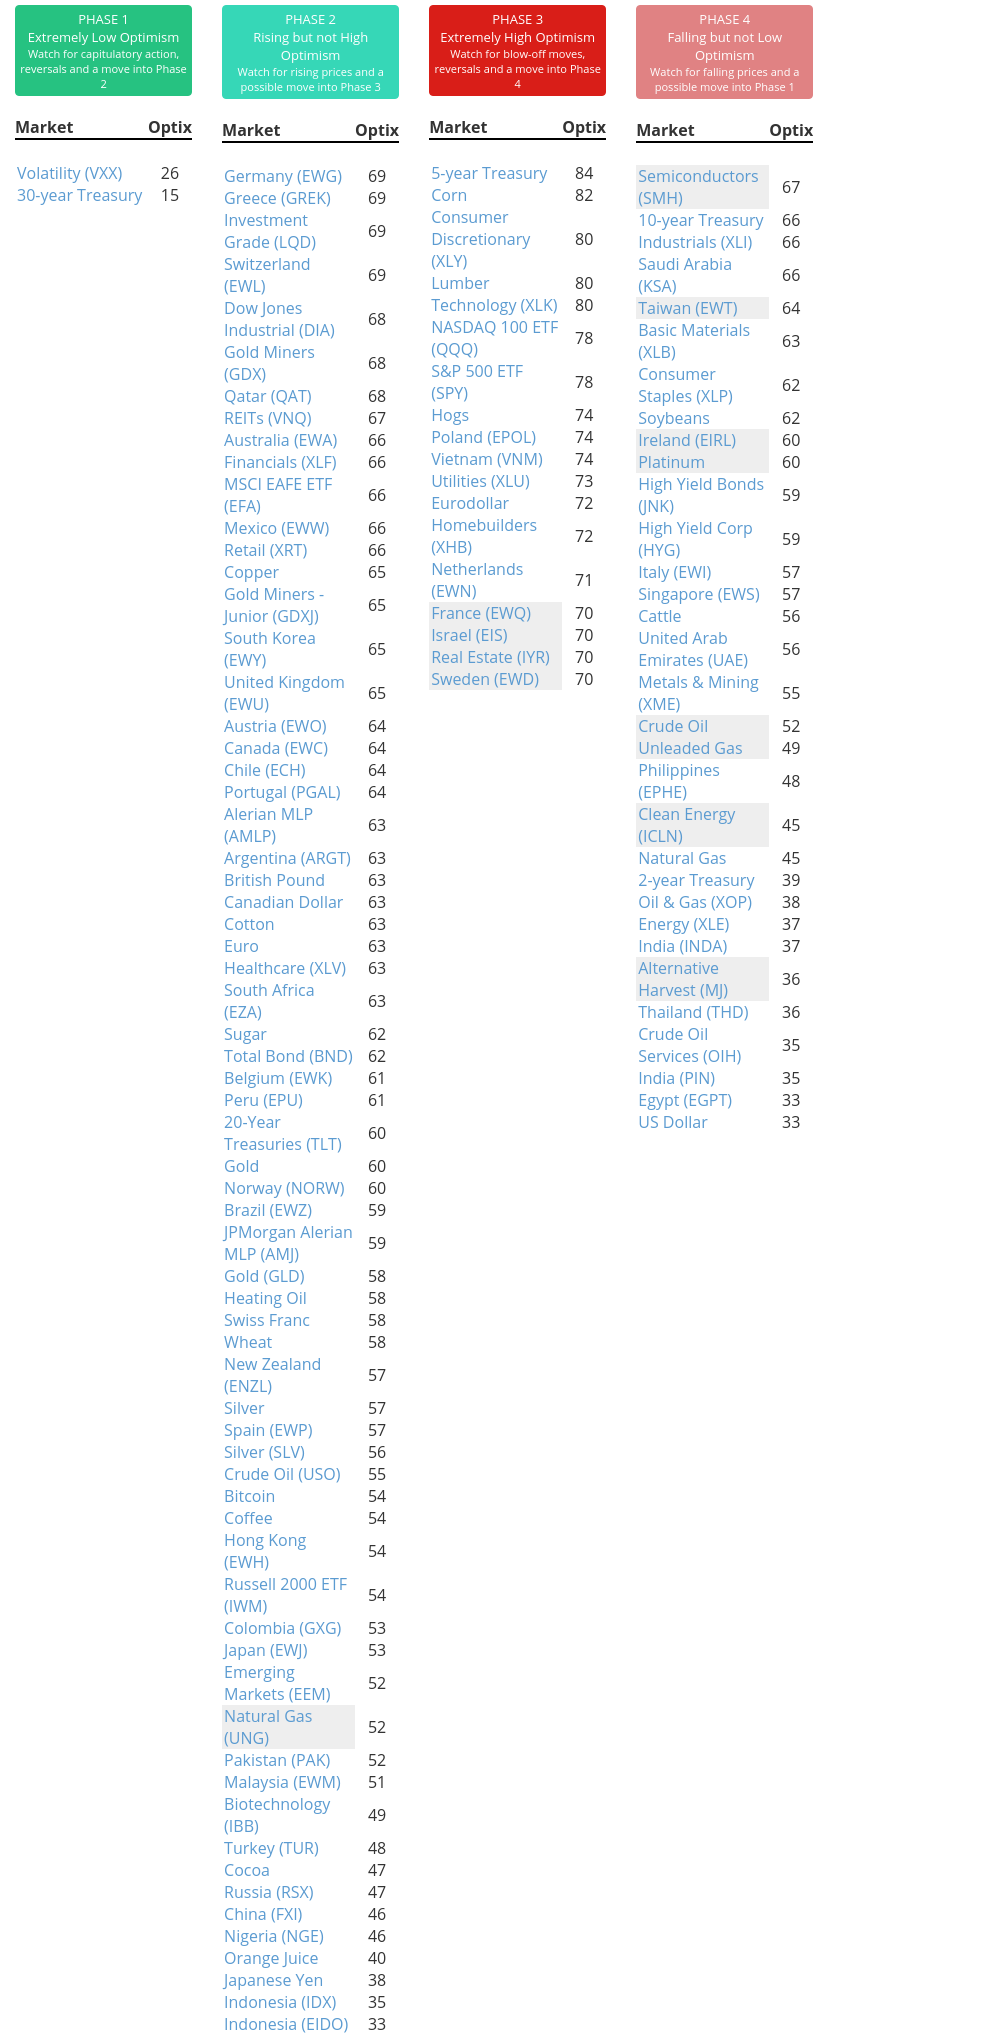
Phase Table
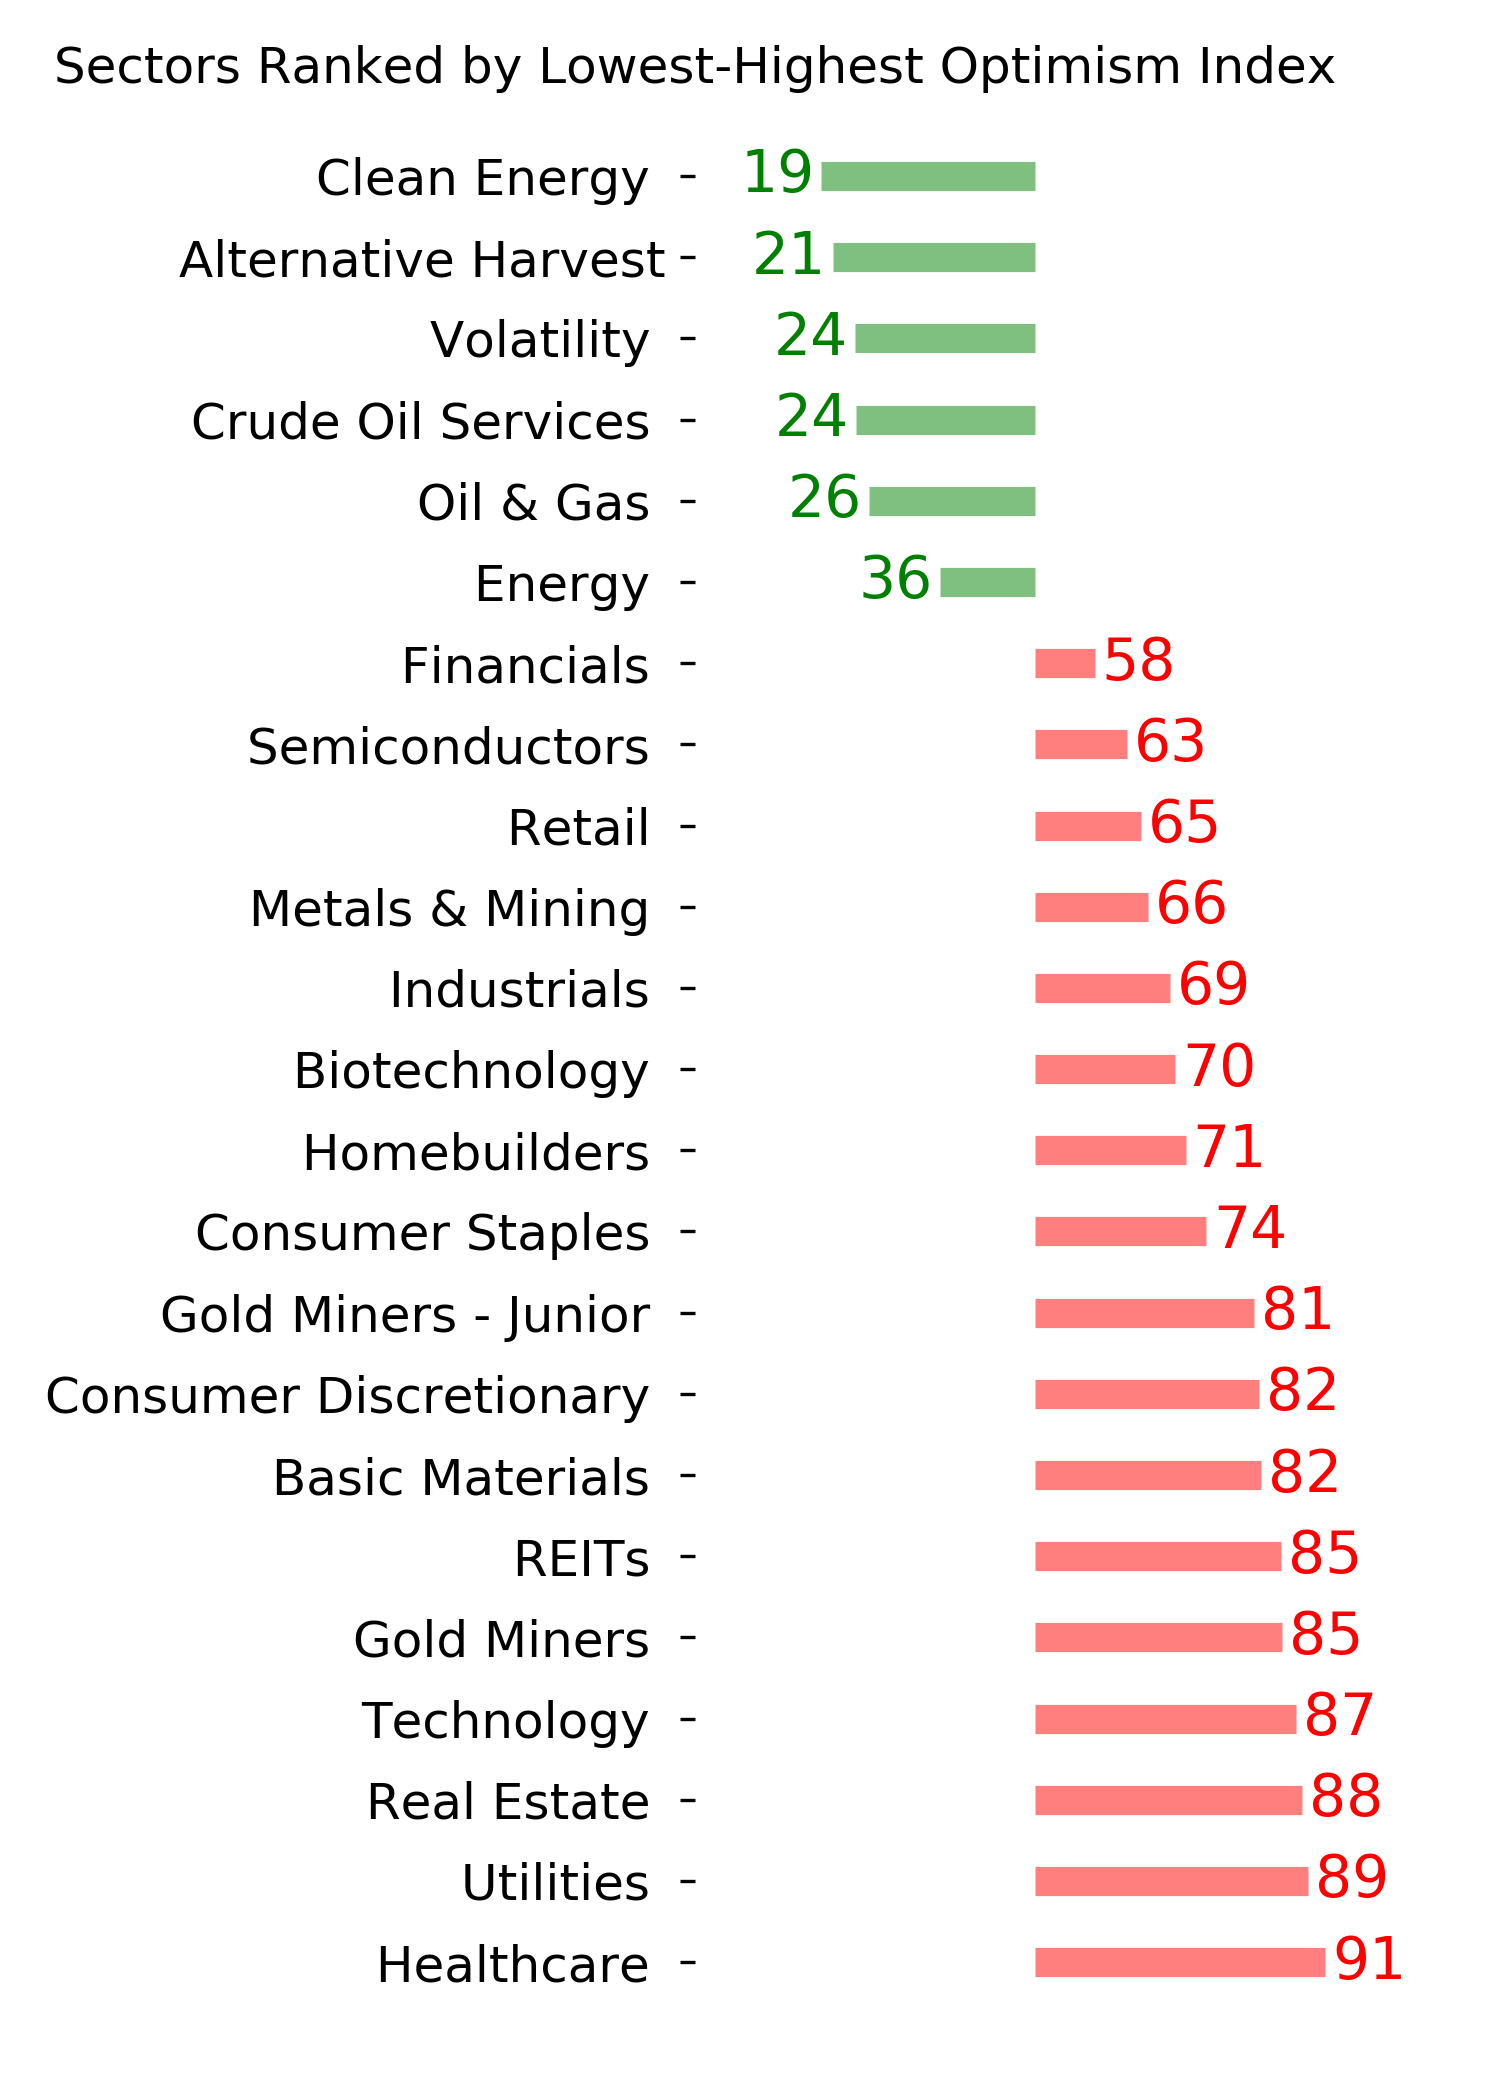
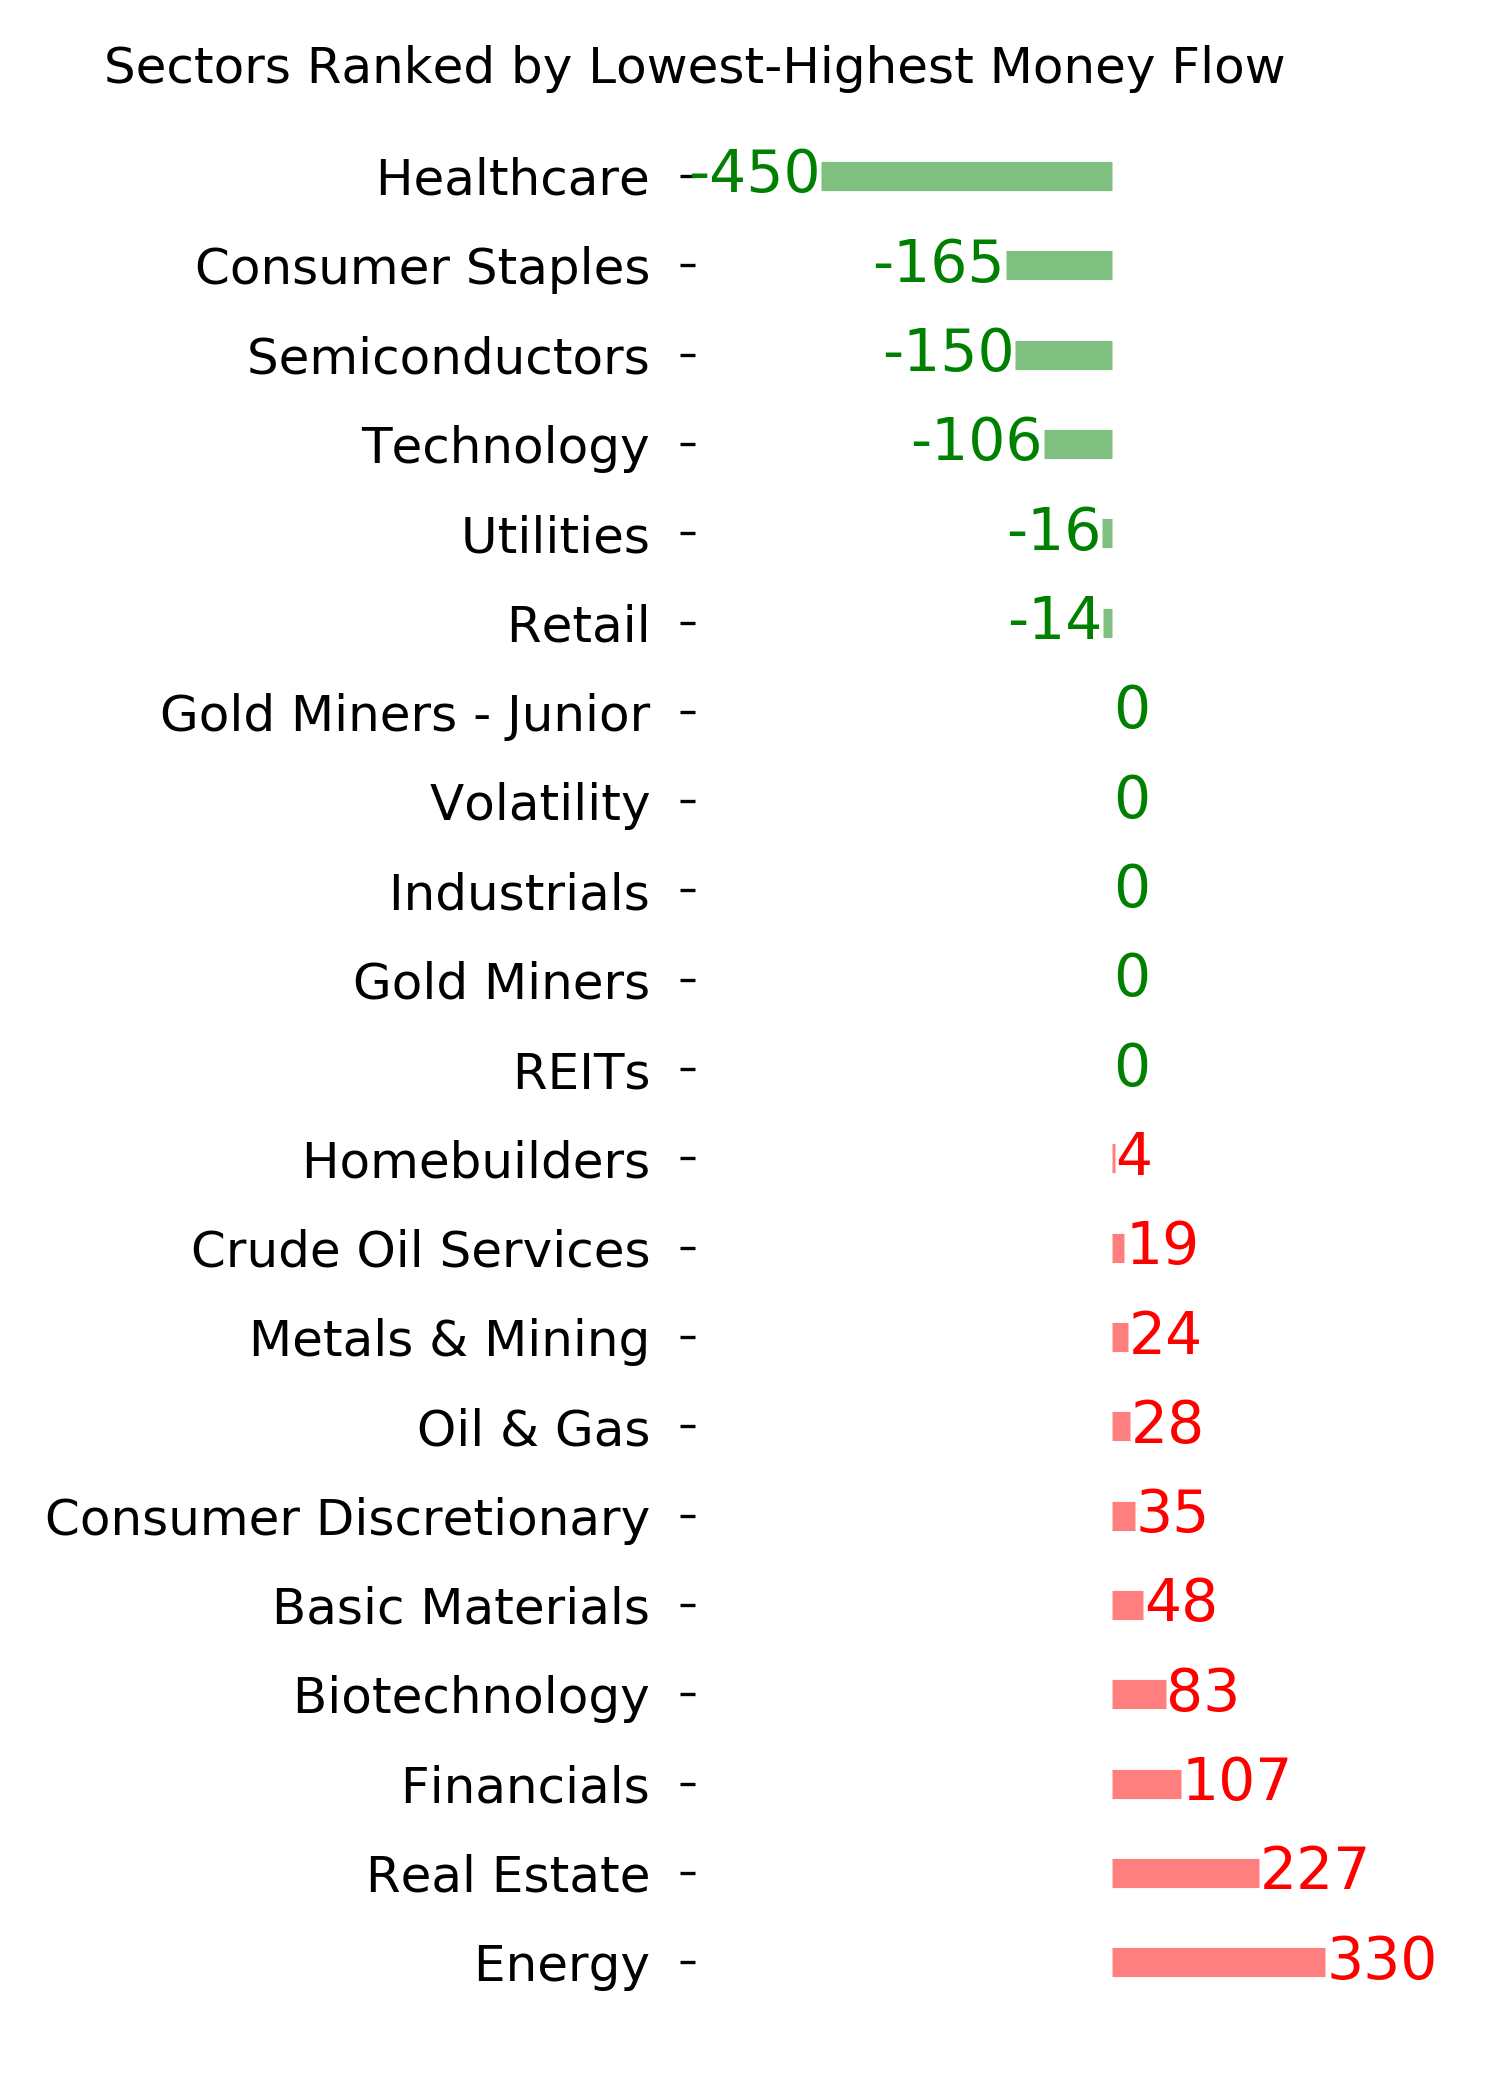
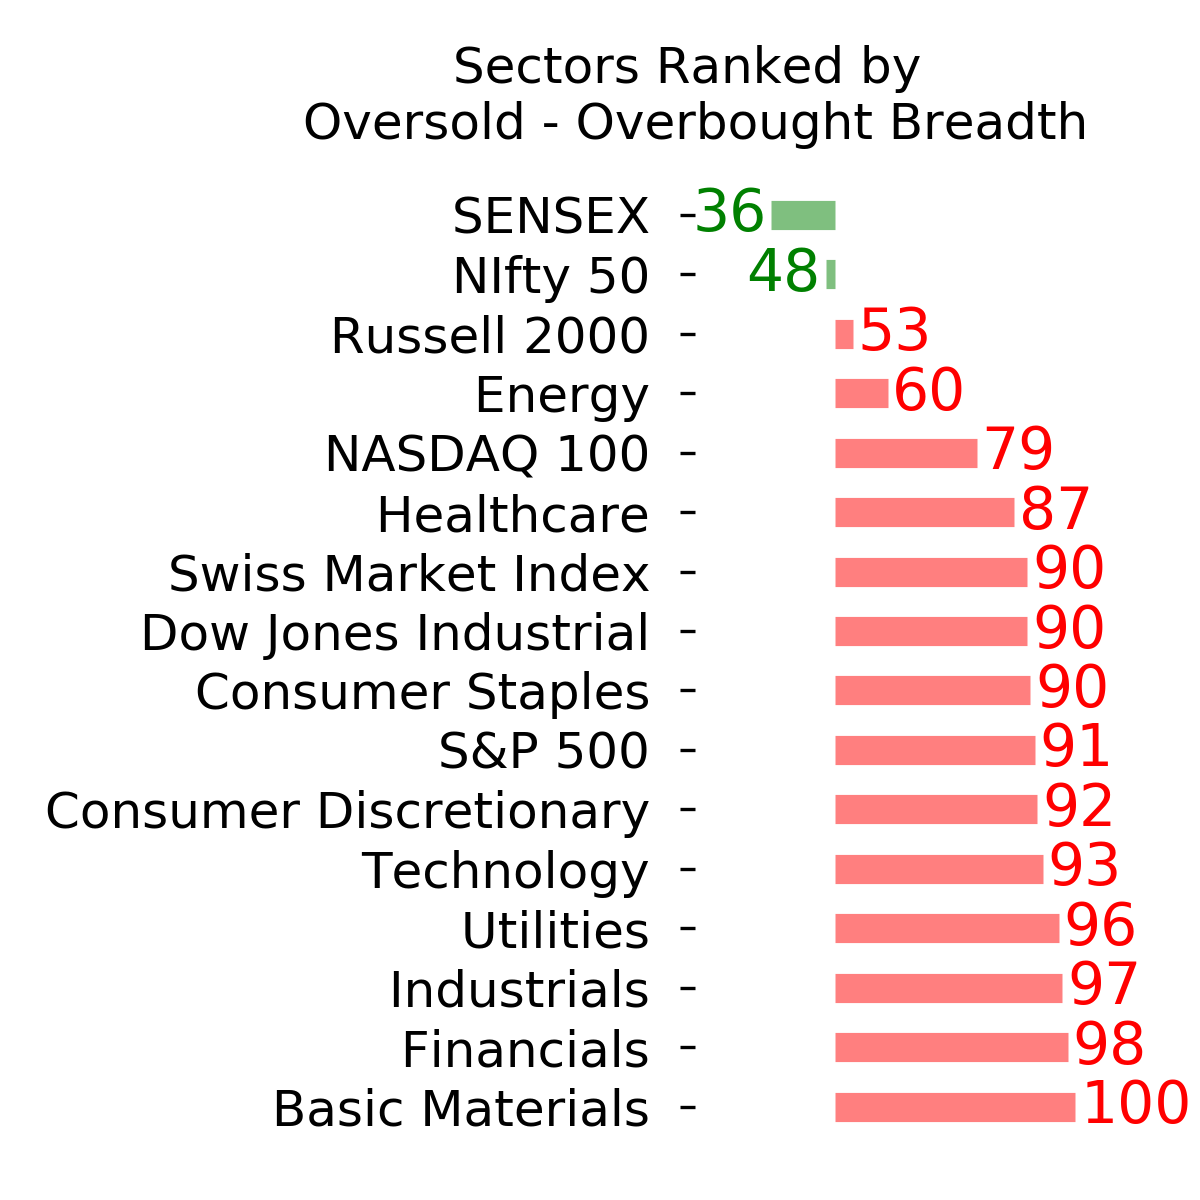
Ranks
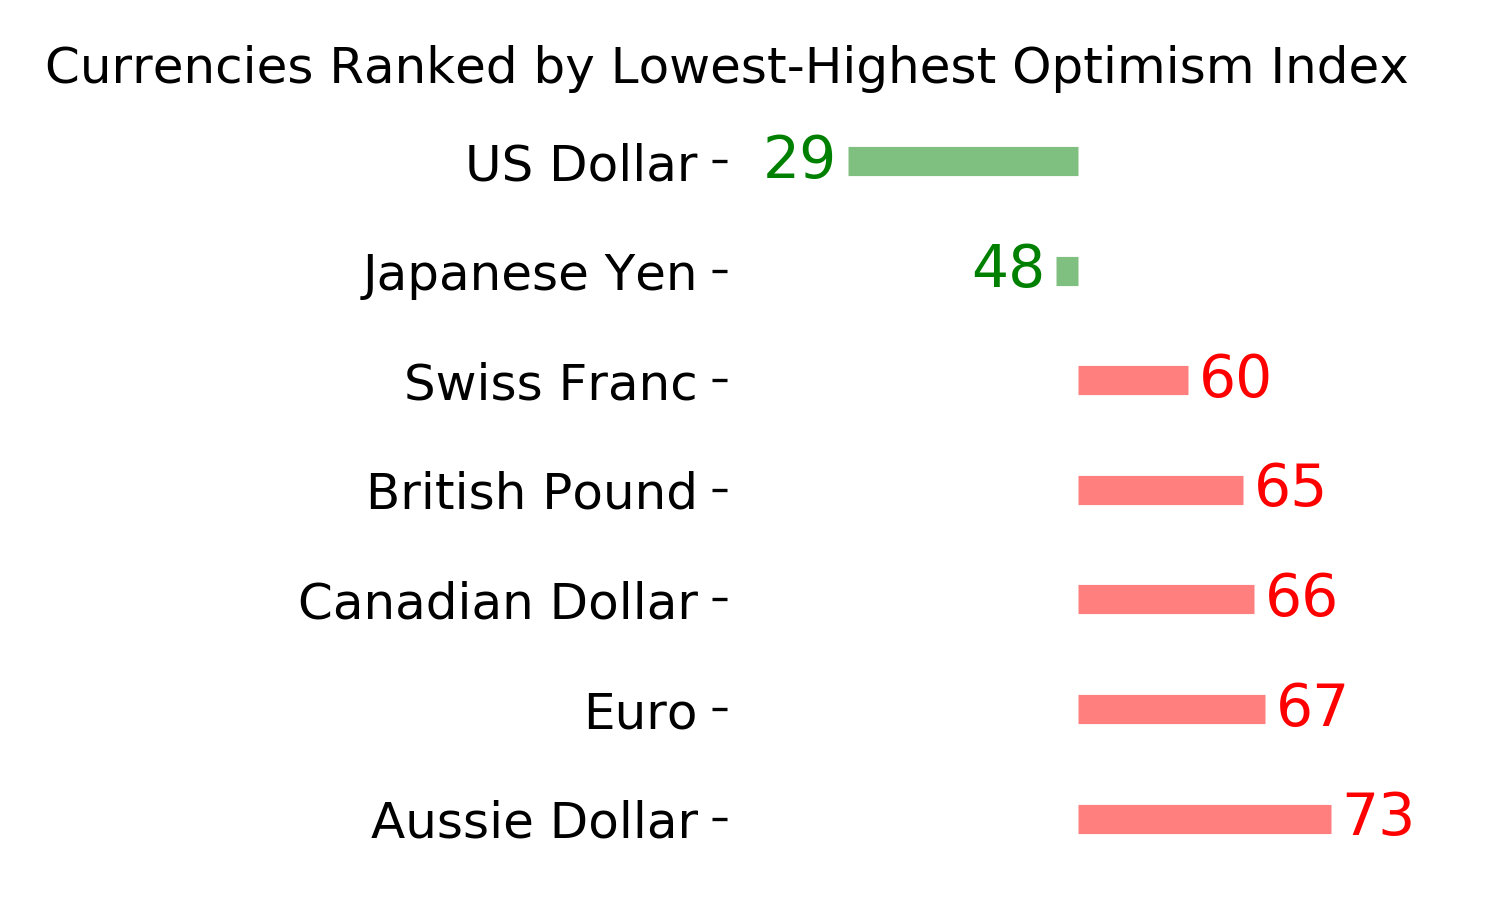
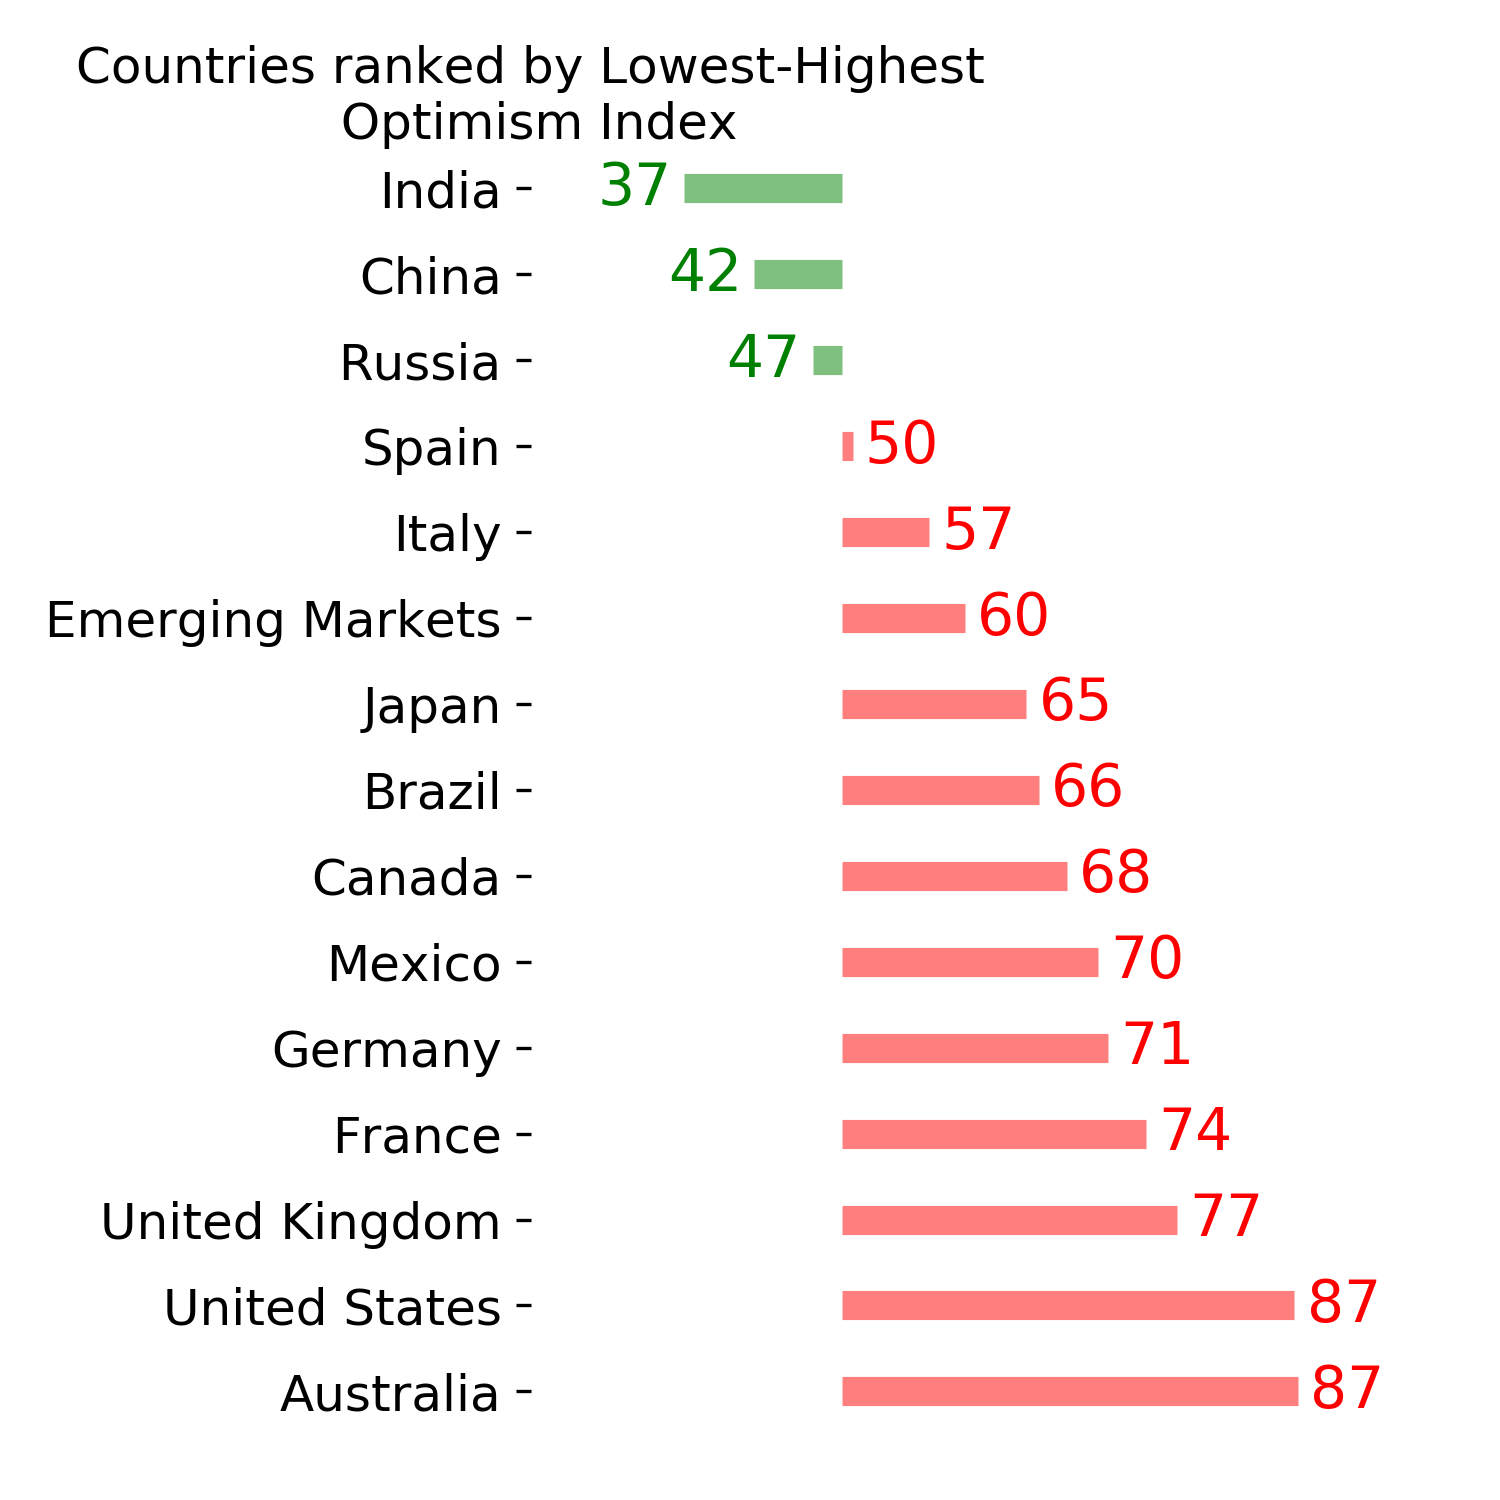
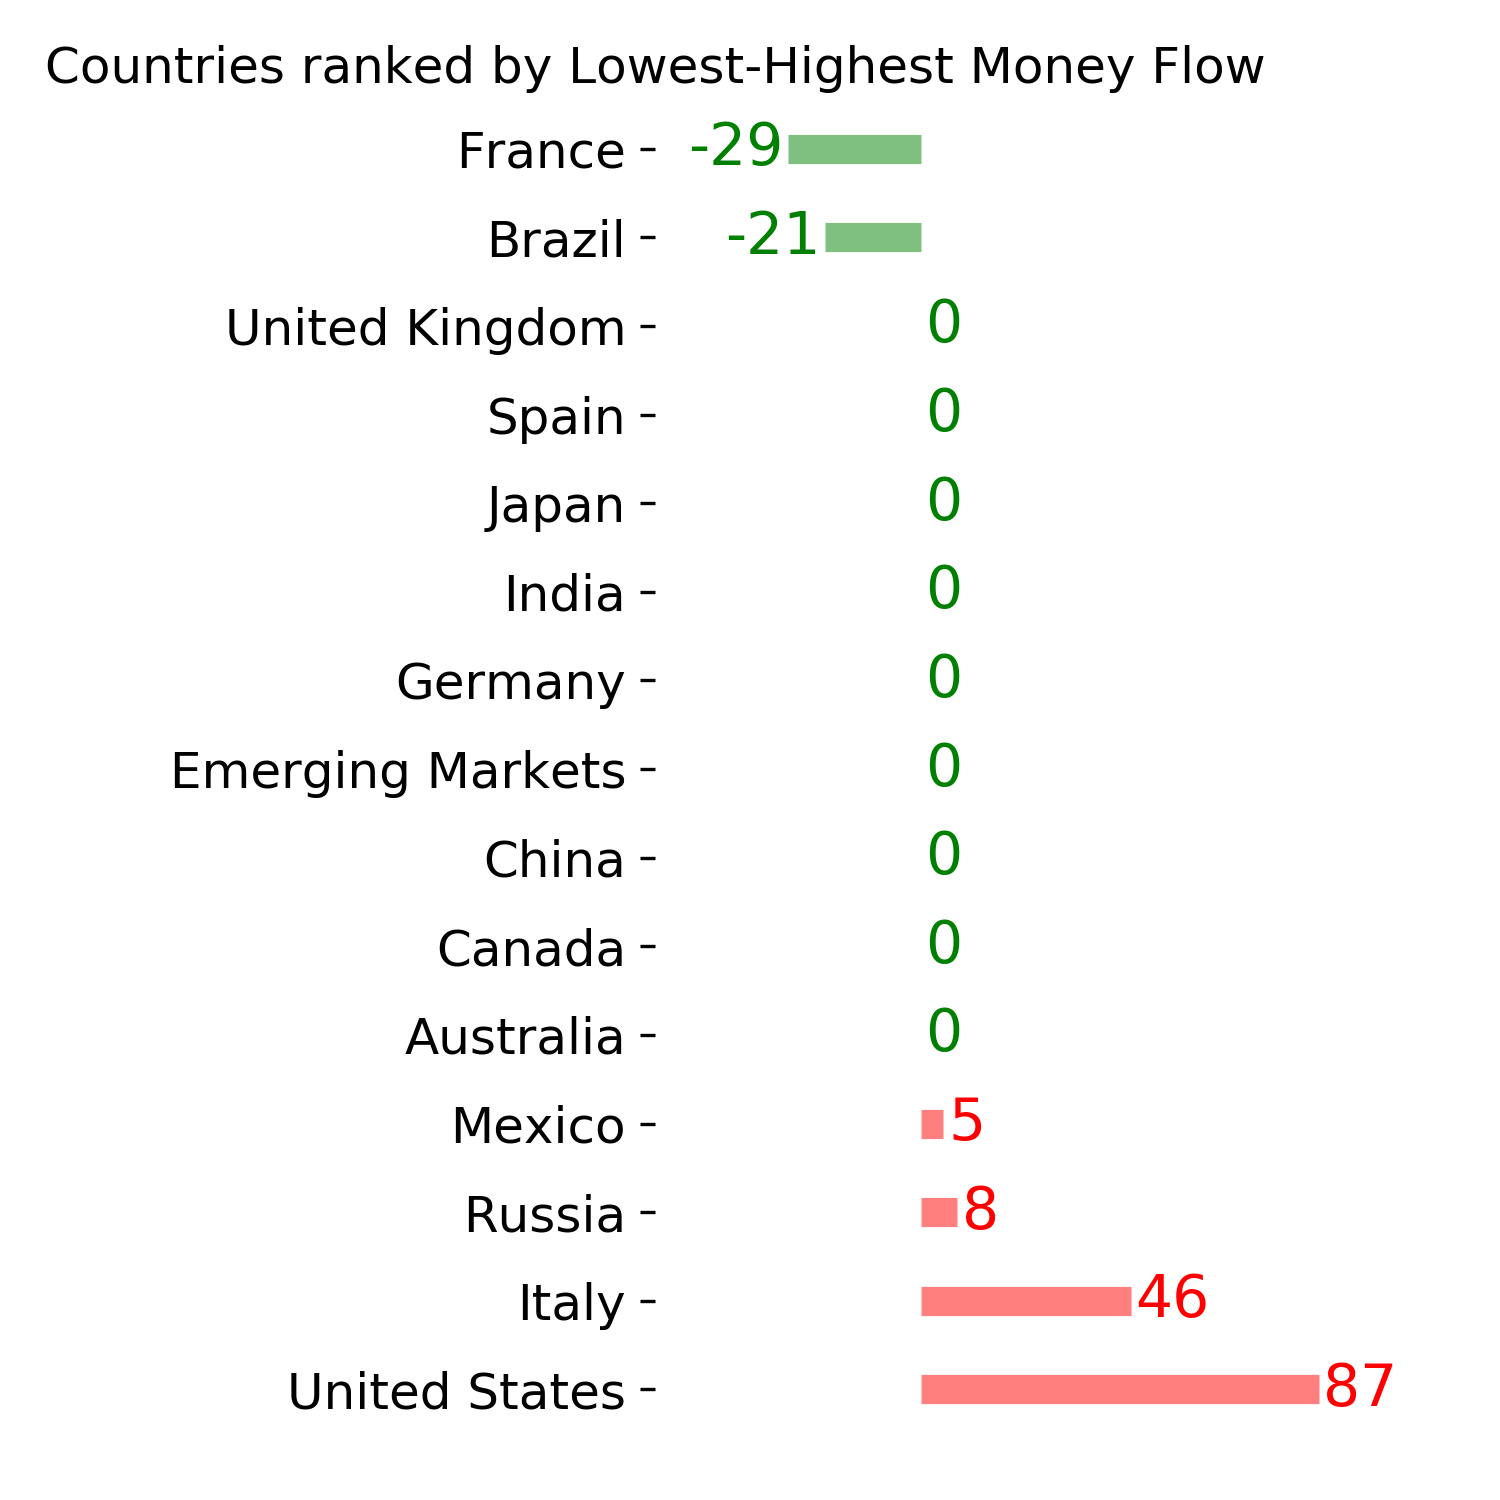
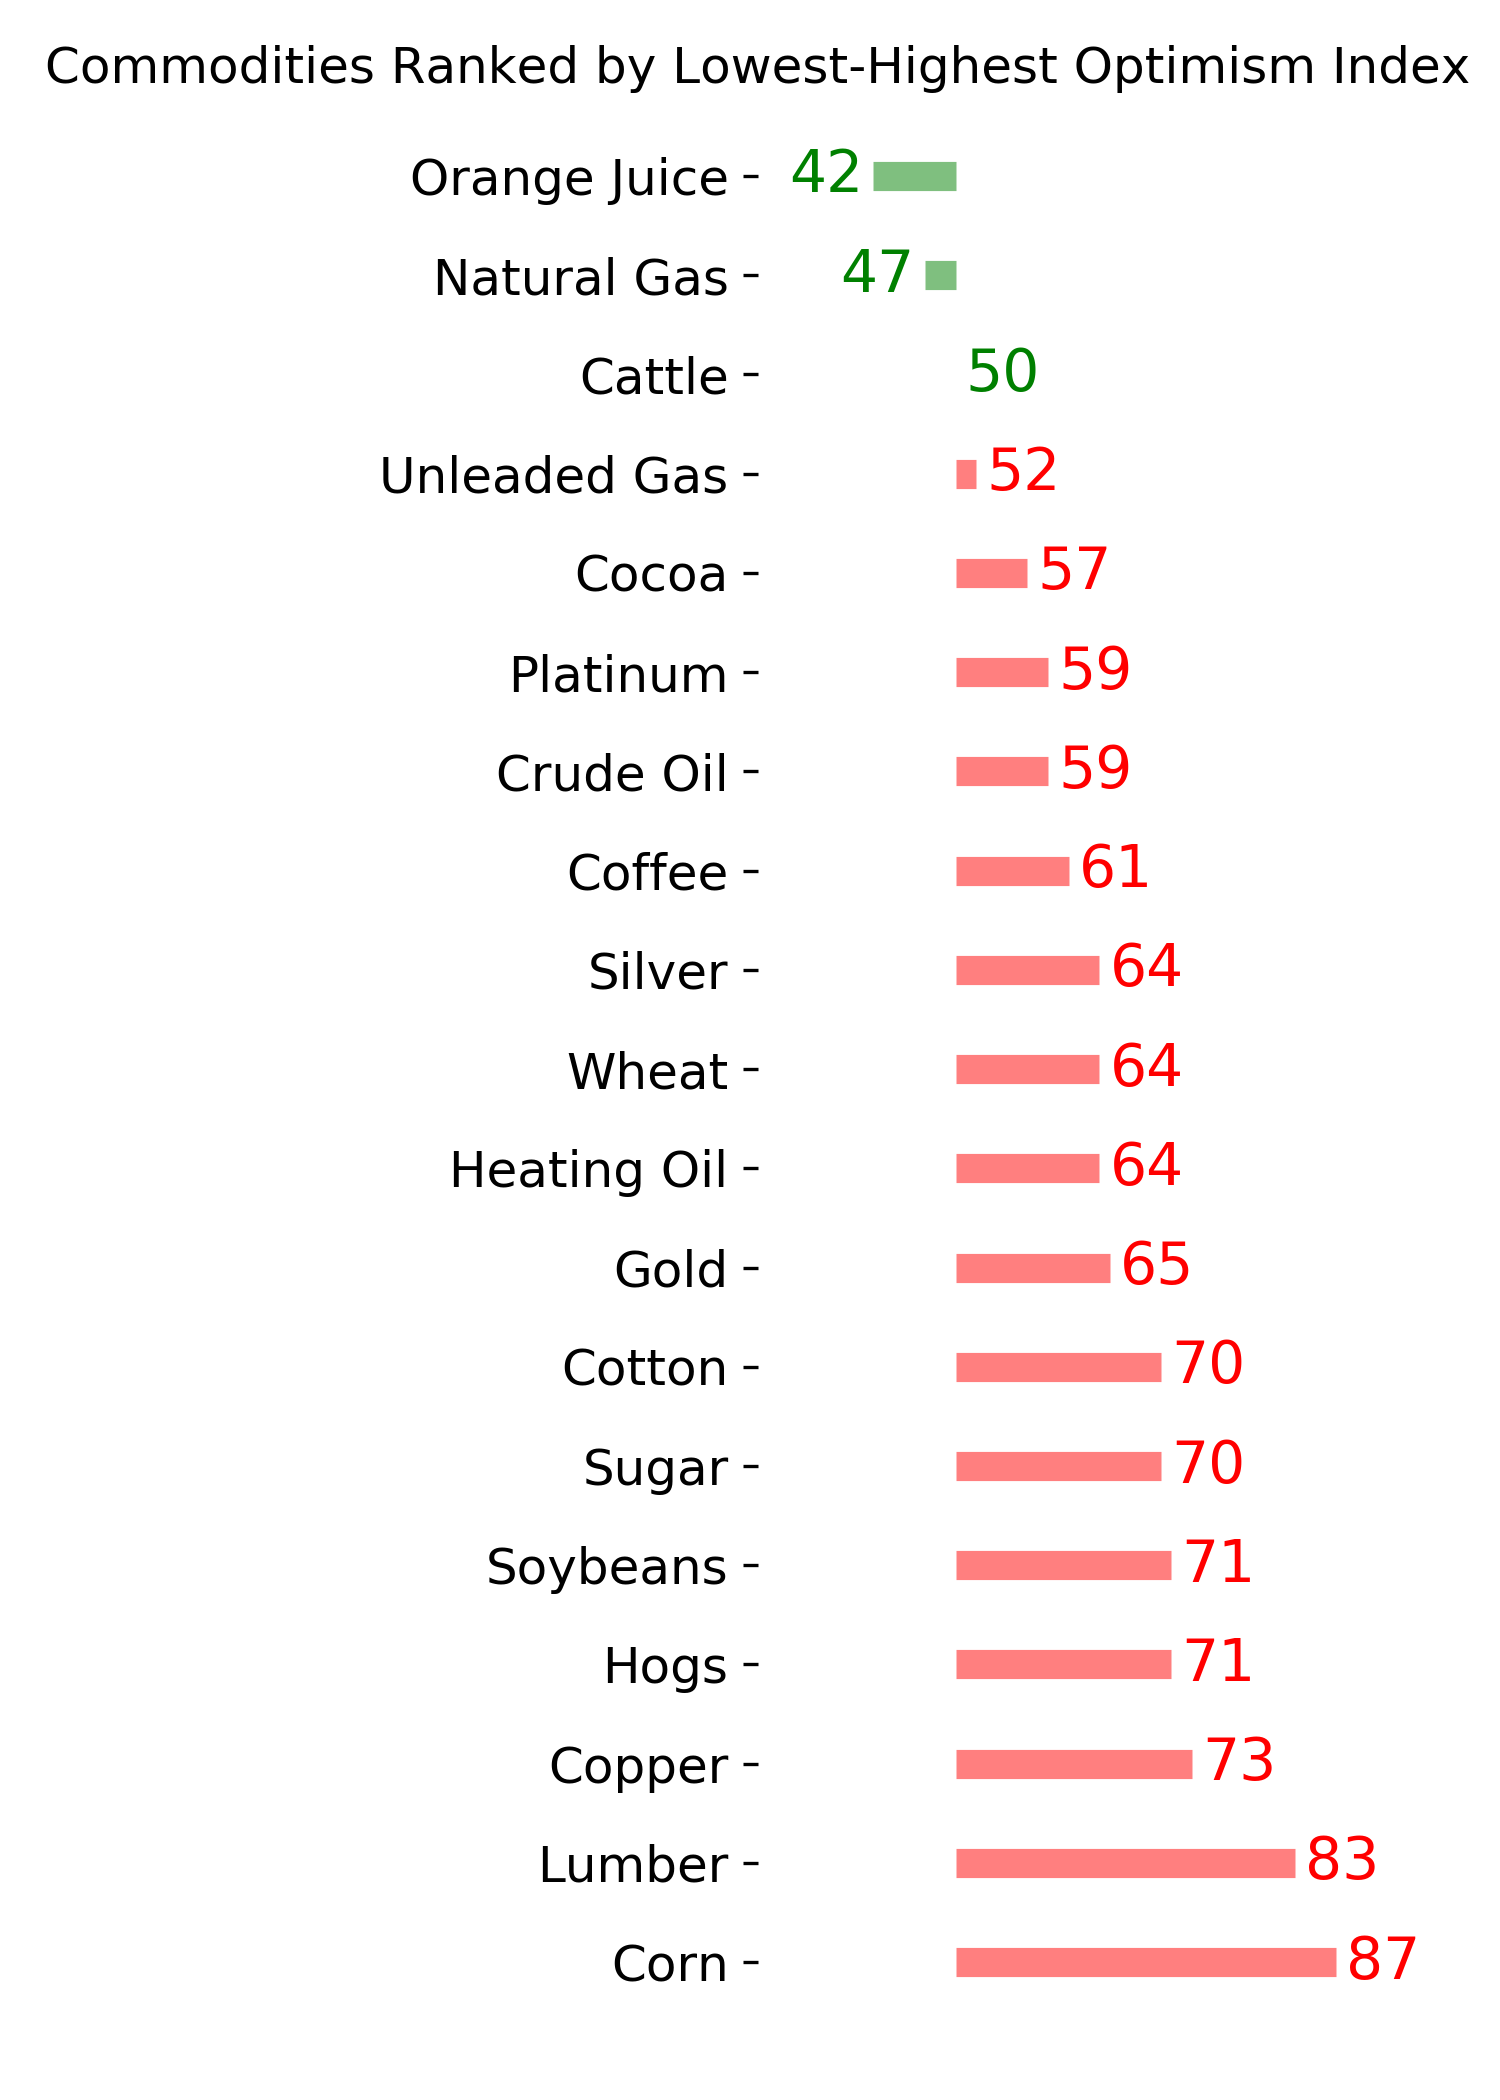
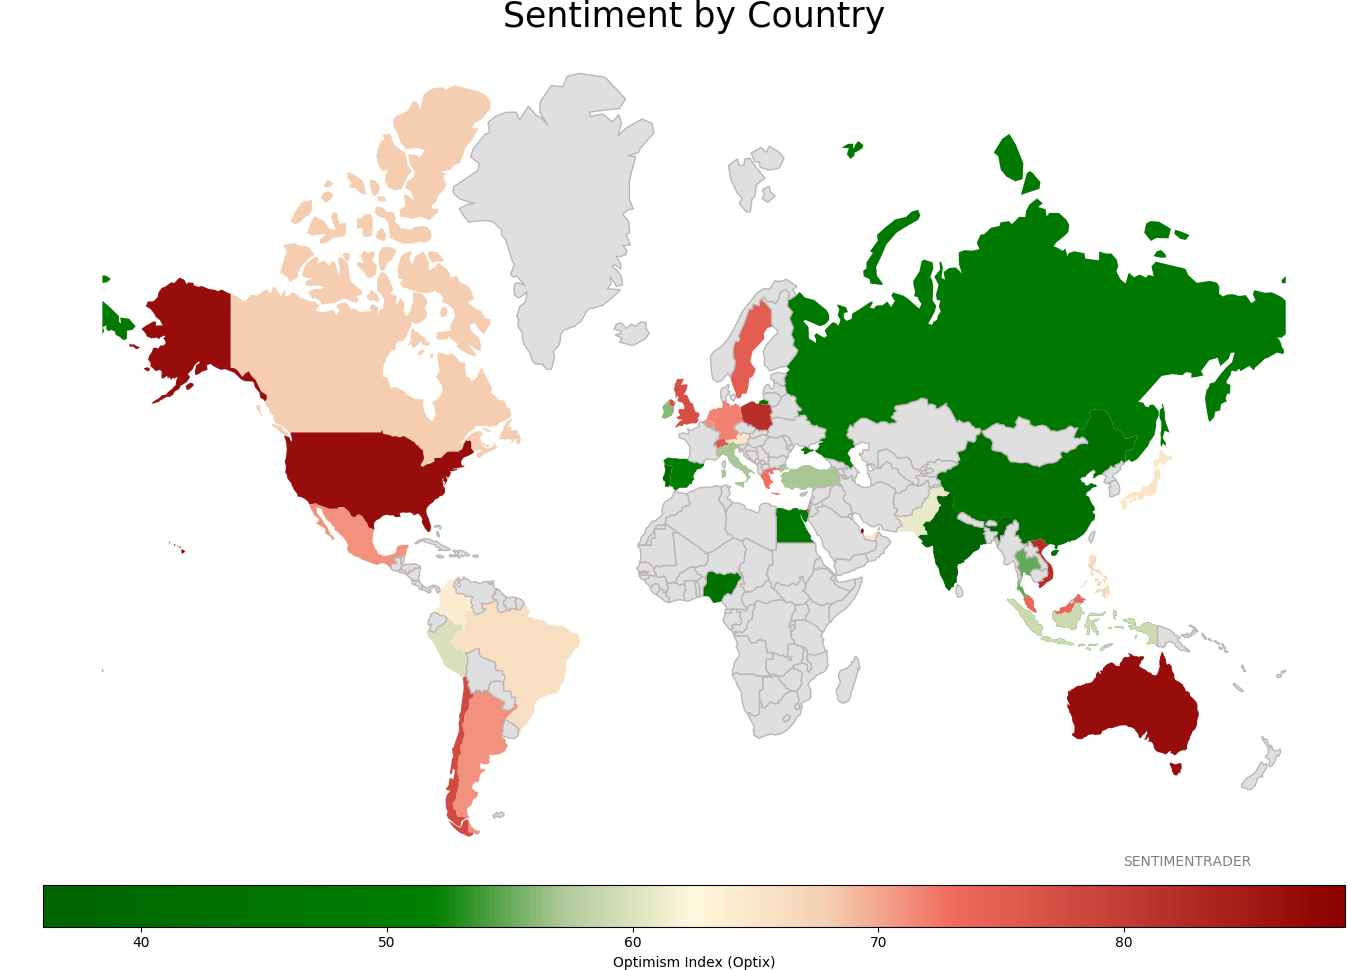
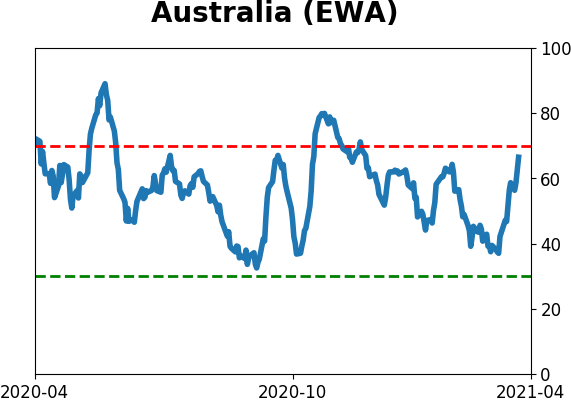
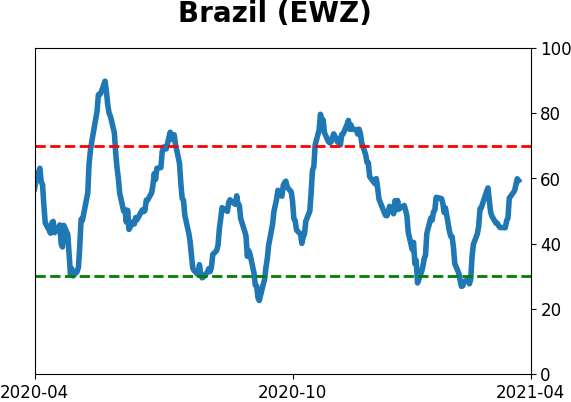
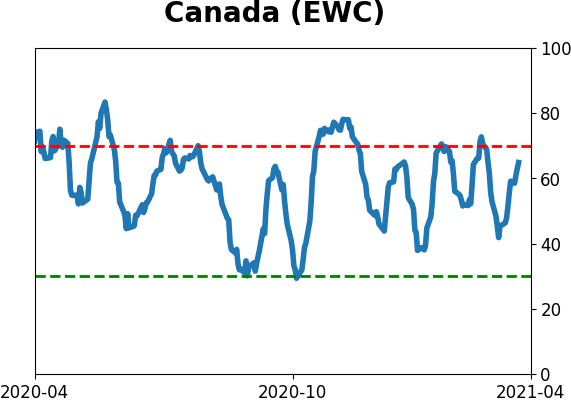
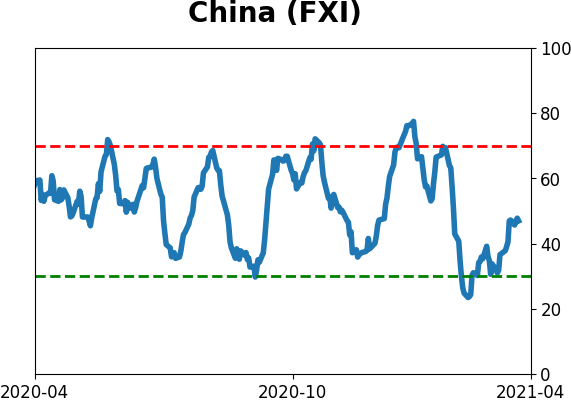
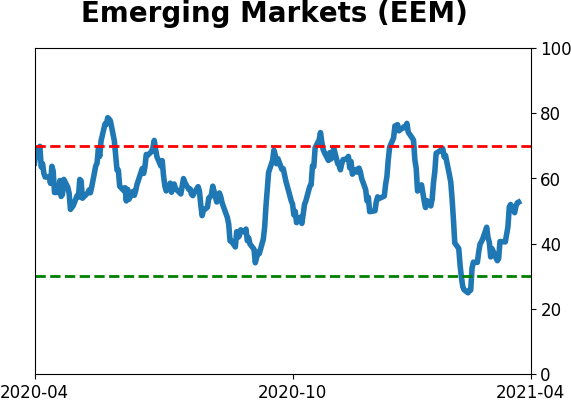
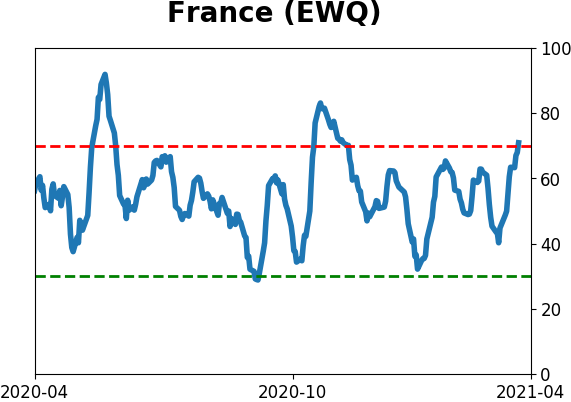
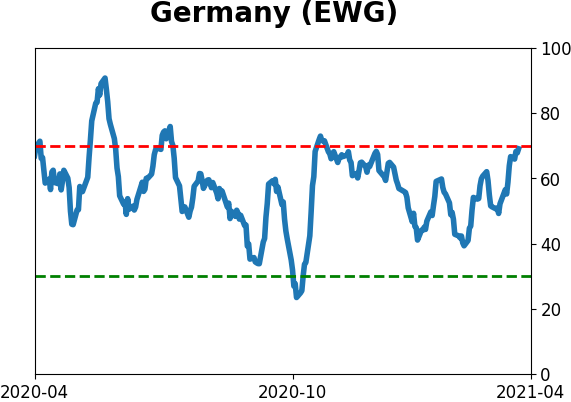
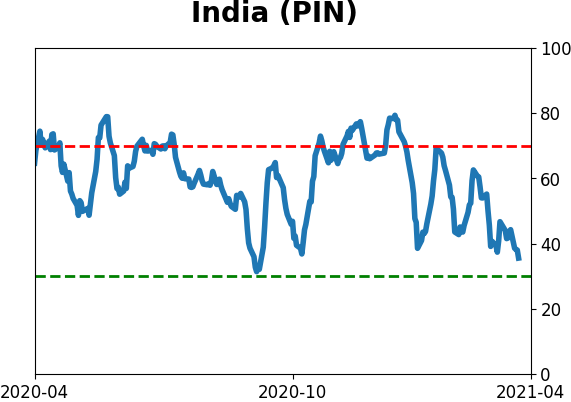
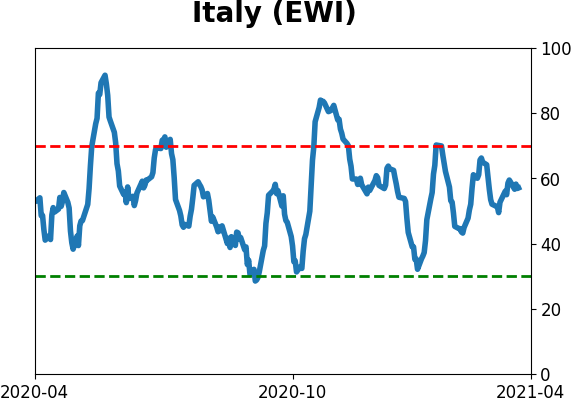
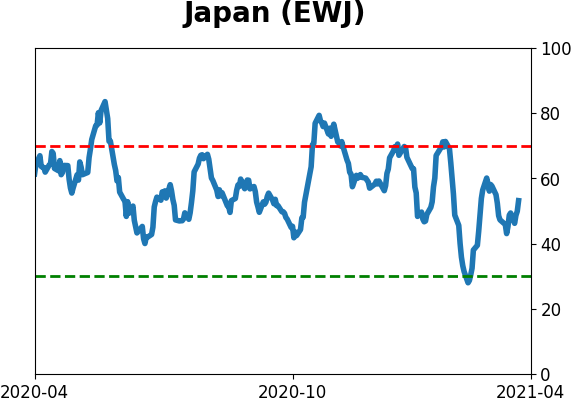
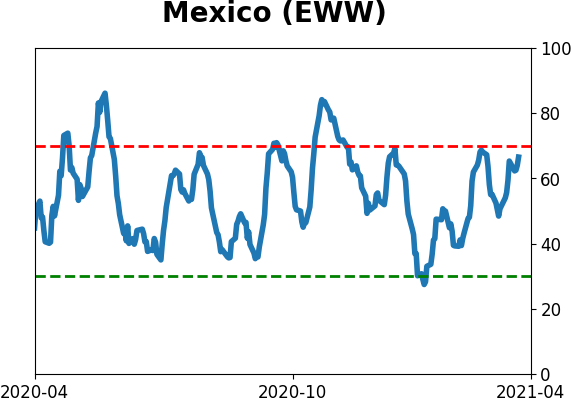
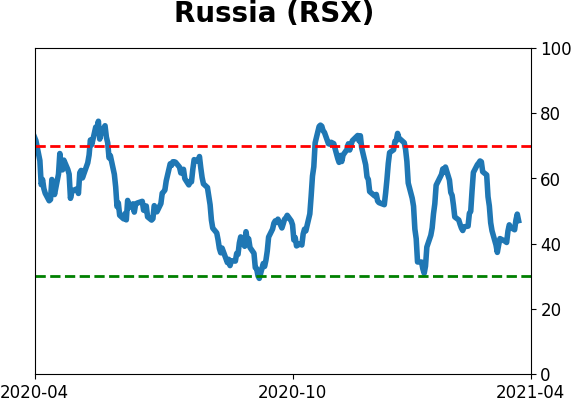
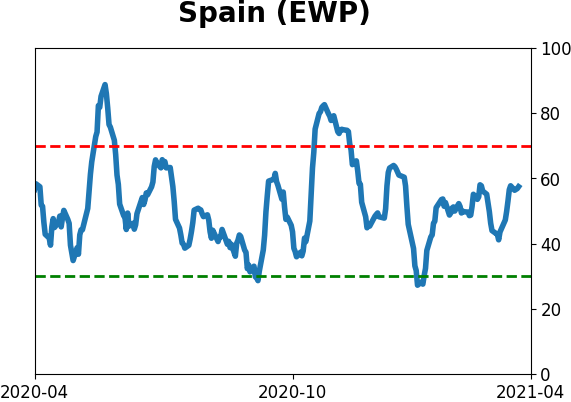
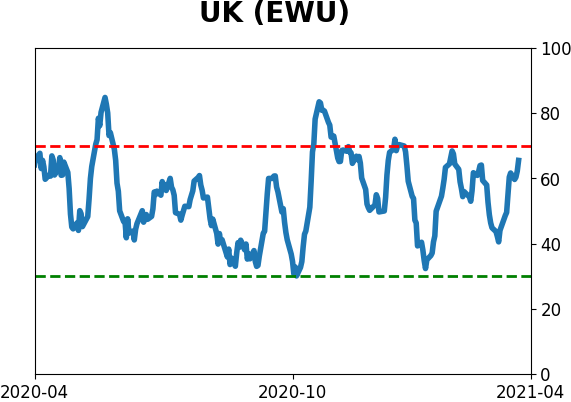
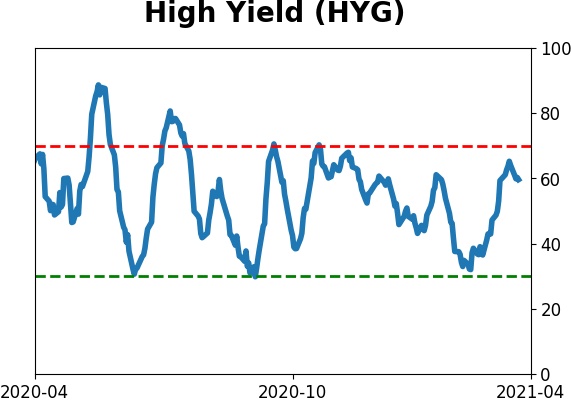
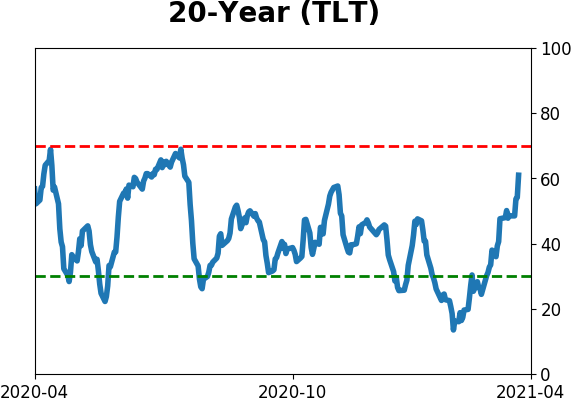
Sentiment Around The World
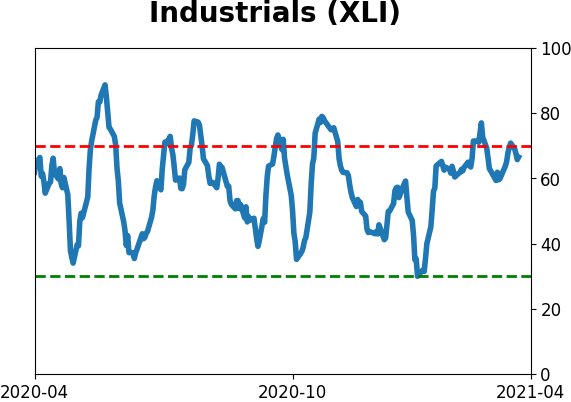
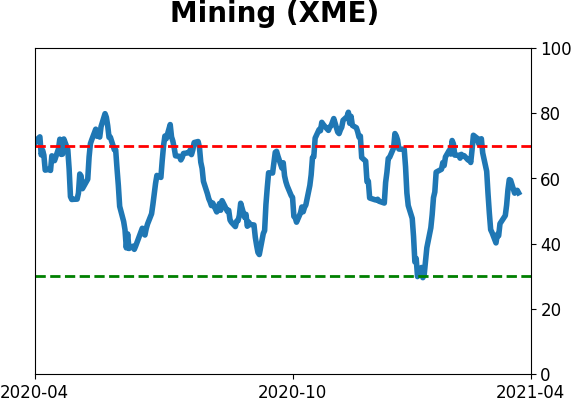
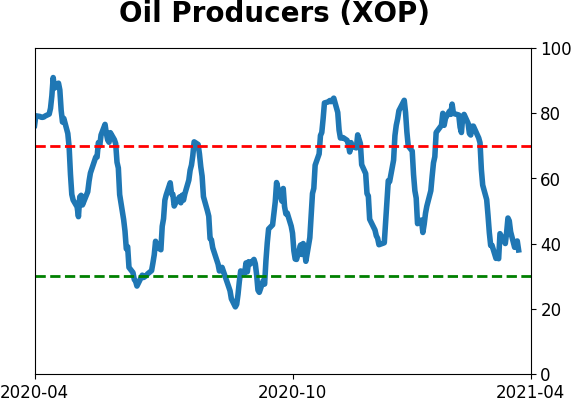
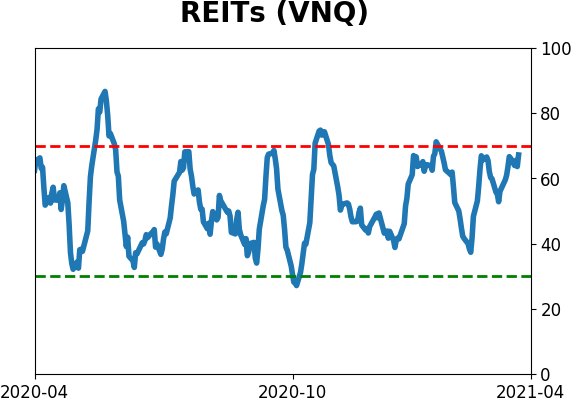
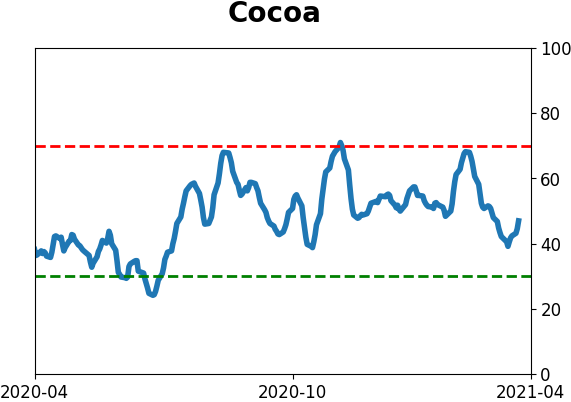
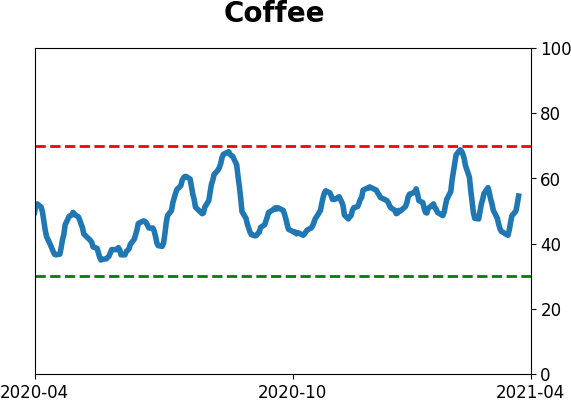
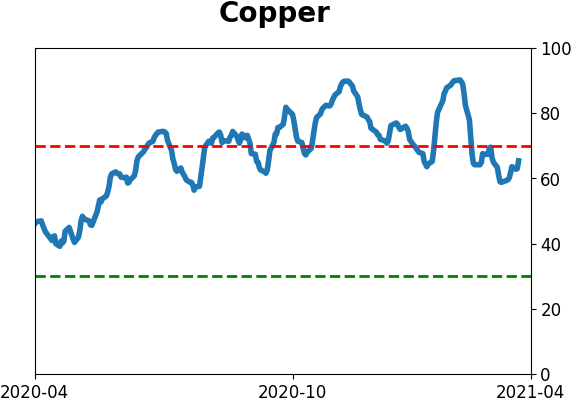
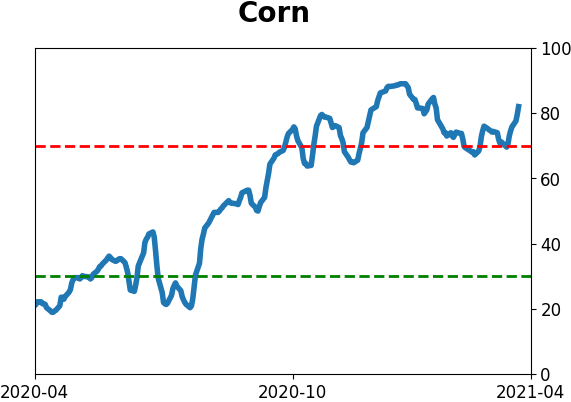
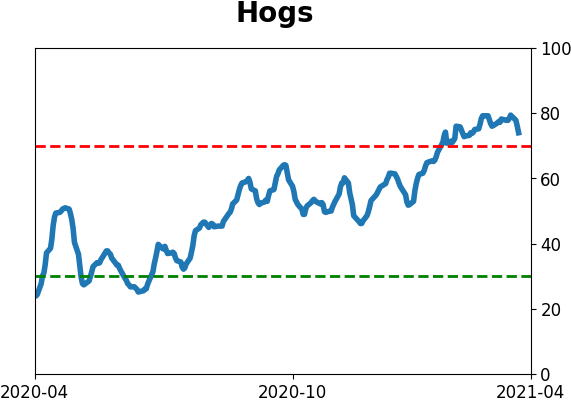
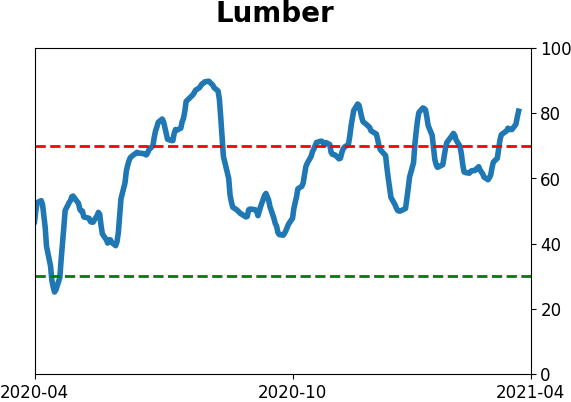
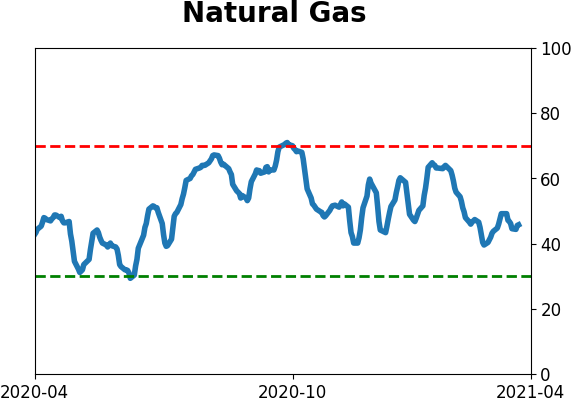
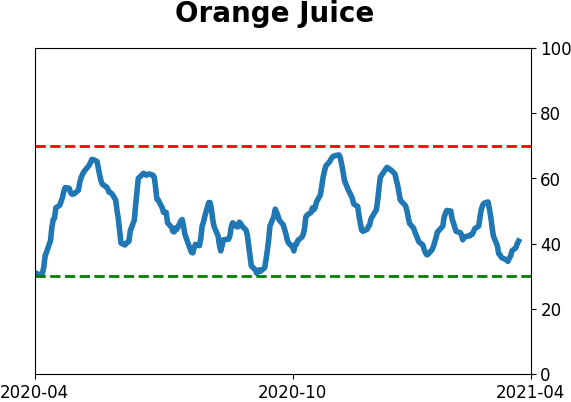
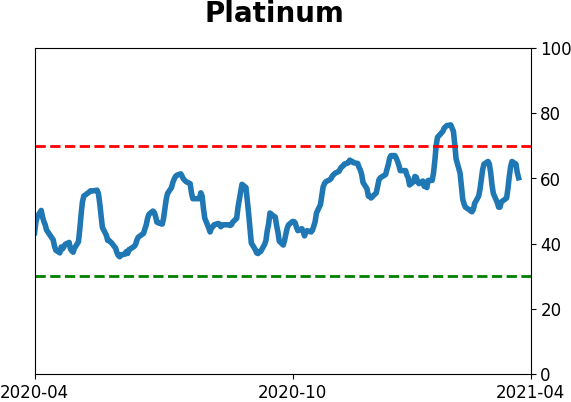
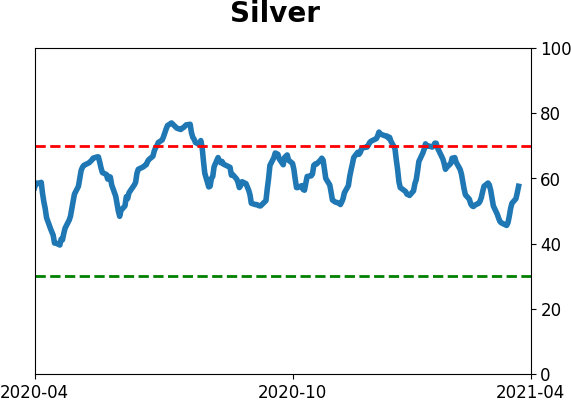
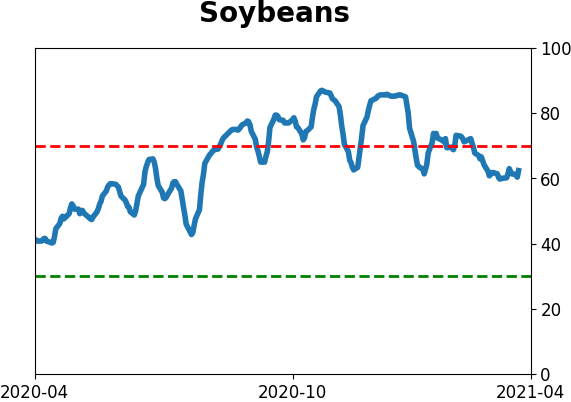
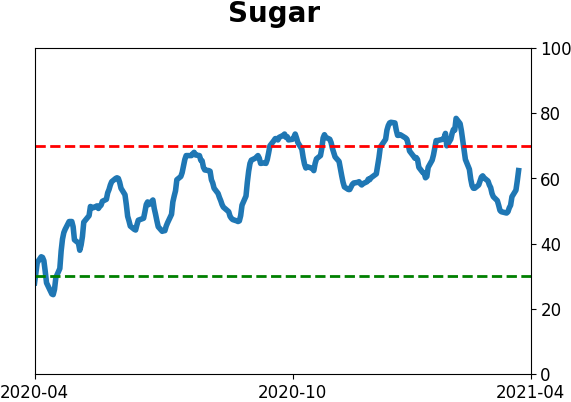
Optimism Index Thumbnails
|
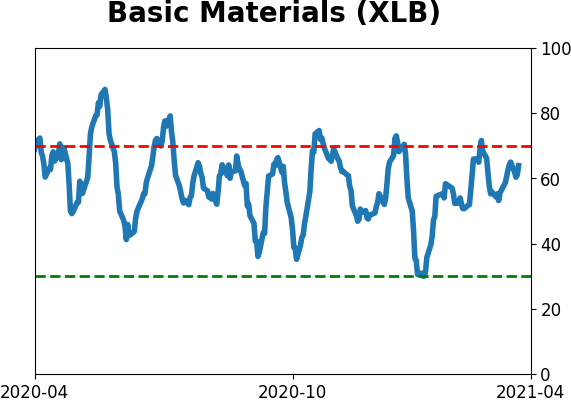
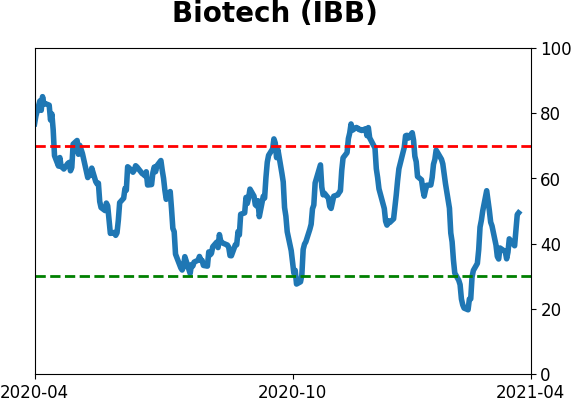
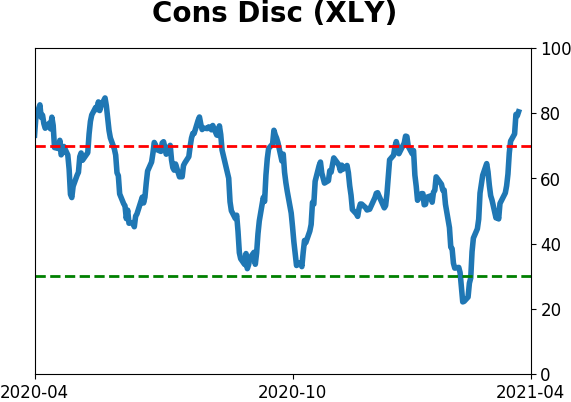
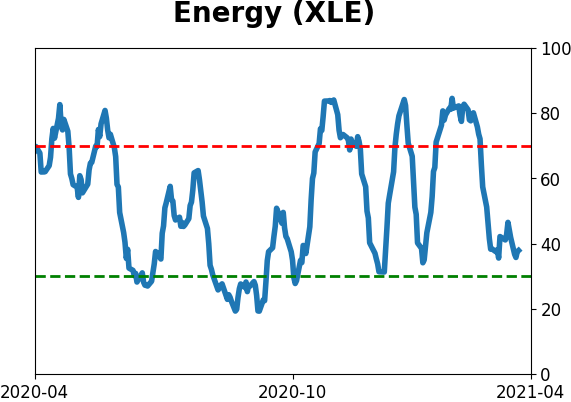
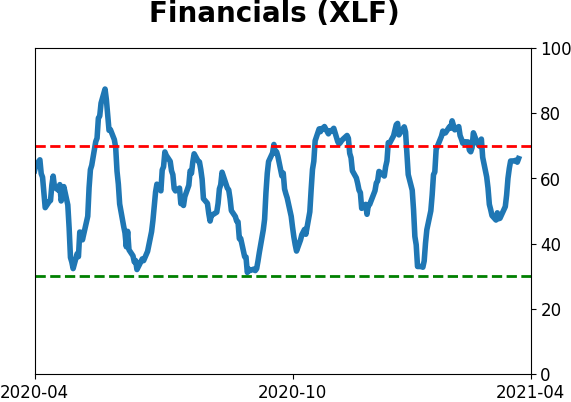
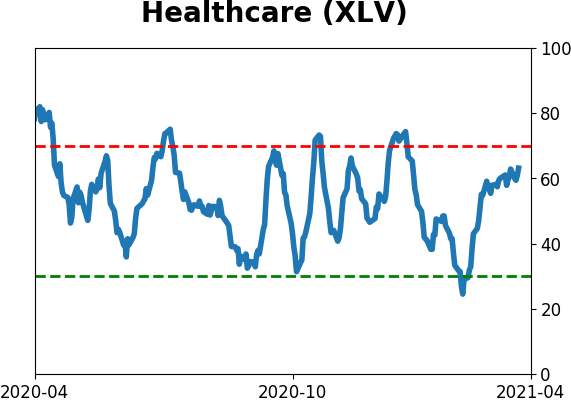
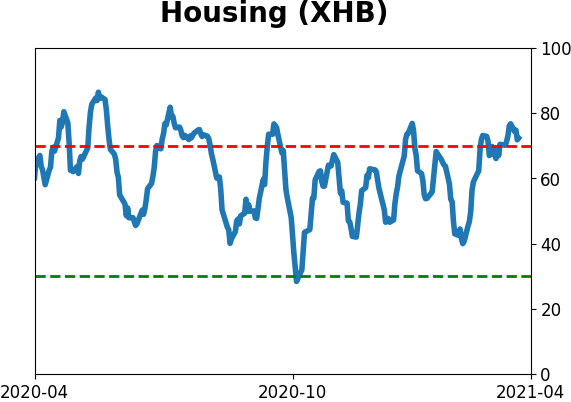
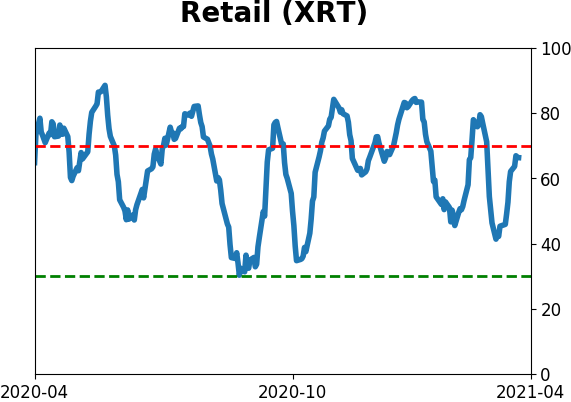
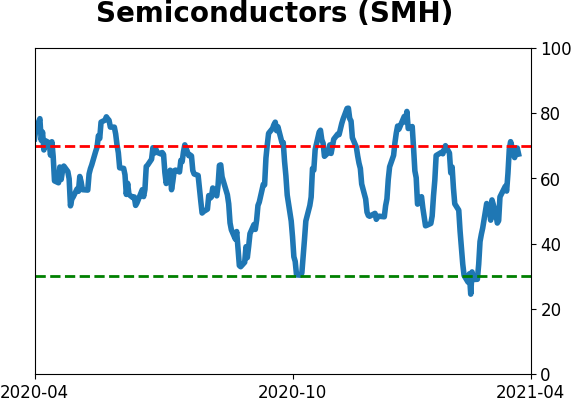
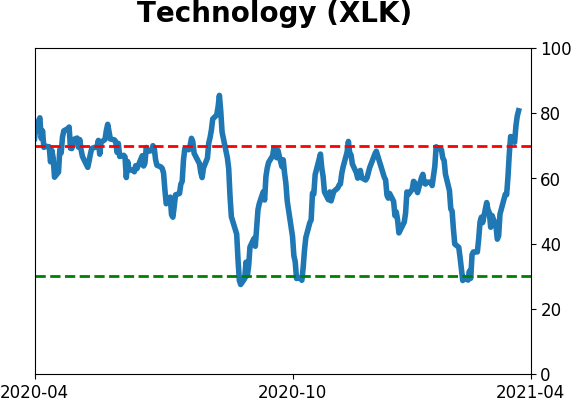
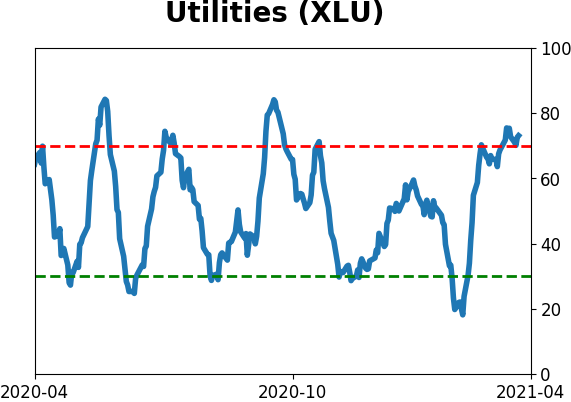
Sector ETF's - 10-Day Moving Average
|
|
|
Country ETF's - 10-Day Moving Average
|
|
|
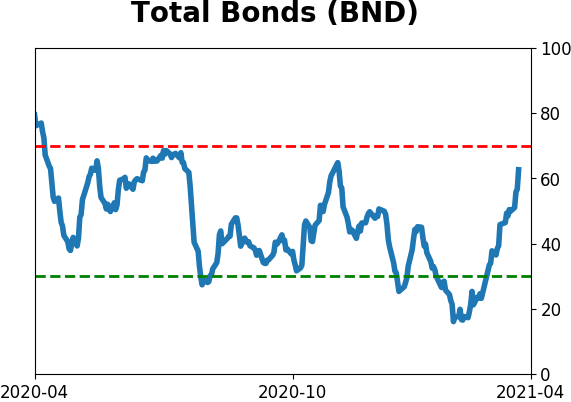
Bond ETF's - 10-Day Moving Average
|
|
|
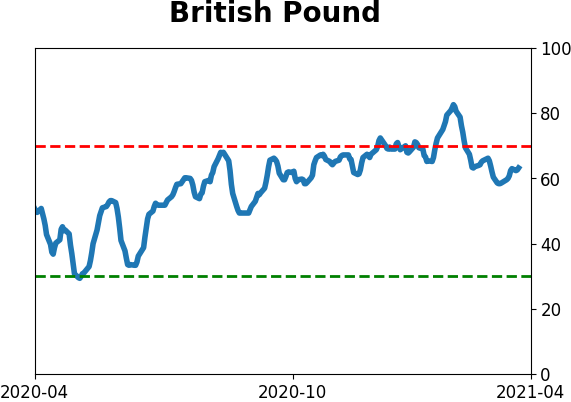
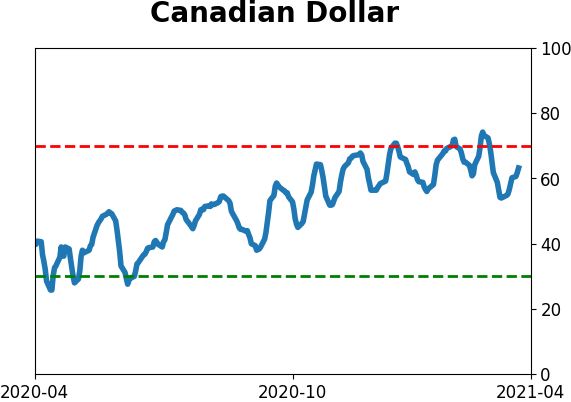
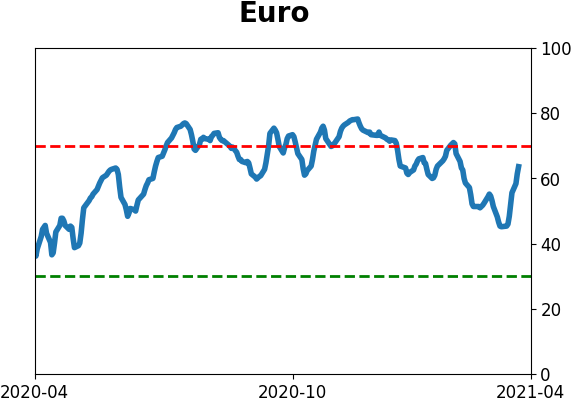
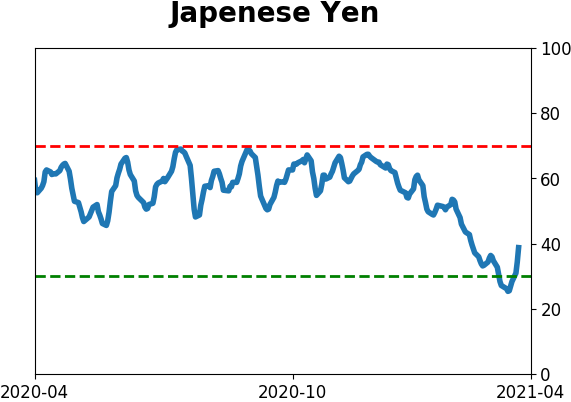
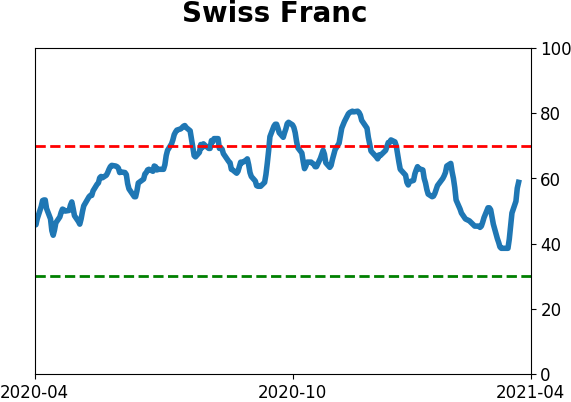
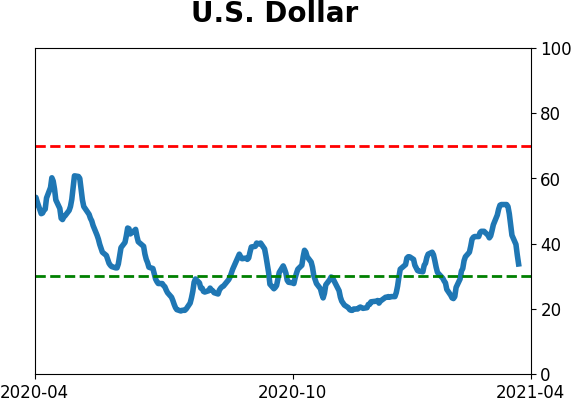
Currency ETF's - 5-Day Moving Average
|
|
|
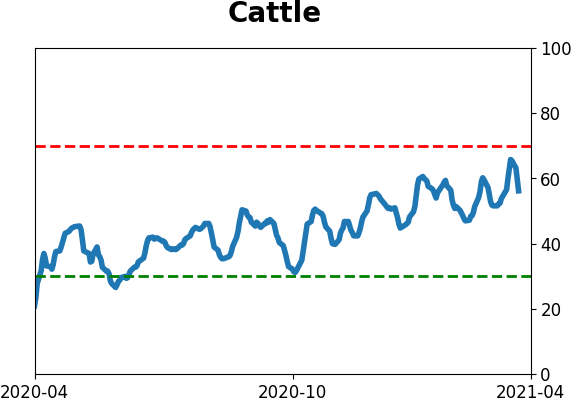
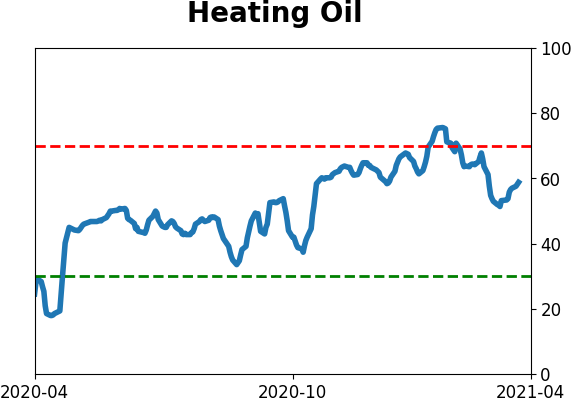
Commodity ETF's - 5-Day Moving Average
|
|