Headlines
|
|
Weekly Wrap for Apr 16 - More of the same:
This week saw very little hedging activity among investors, with even Wall Street showing high optimism. But there have still not been many, if any, major warning signs triggering. Gold has started to recover, but historically those recoveries have been an inconsistent signal.
The latest Commitments of Traders report was released, covering positions through Tuesday: The 3-Year Min/Max Screen shows that "smart money" commercial hedgers established only one new extreme relative to the past 3 years, and that was in hogs. By holding more than 25% of open interest net short, they have the 2nd-largest short exposure in 15 years, next to March-April 2014. In the major equity index futures, hedgers moved back to an almost perfectly neutral position. They reduced their short exposure to gold by a small amount, and their positioning now is only about in the middle of the long-term range. They continue to have some of their largest relative short positions in agriculture contracts.
Bottom Line:
See the Outlook & Allocations page for more details on these summaries STOCKS: Weak sell
The extreme speculation registered in January and February is starting to get wrung out. Internal dynamics have mostly held up, so a return to neutral sentiment conditions would improve the forward risk/reward profile substantially. We're still a ways off from that. BONDS: Weak buy
Various parts of the market have been hit in recent weeks, with mild oversold conditions. The Bond Optimism Index is now about as low as it gets during healthy bond market environments. Fixed income isn't responding well, so that needs to be monitored in case it's transitioning to a longer-term negative market environment. GOLD: Weak buy
A dollar trying to rebound from a severe short position has weighed on gold and miners. The types of signals they've given in recent weeks, within the context of their recent surge, have usually resulted in higher prices over a medium- to long-term time frame. Like bonds, gold and miners aren't responding very well, and this needs to be monitored.
|
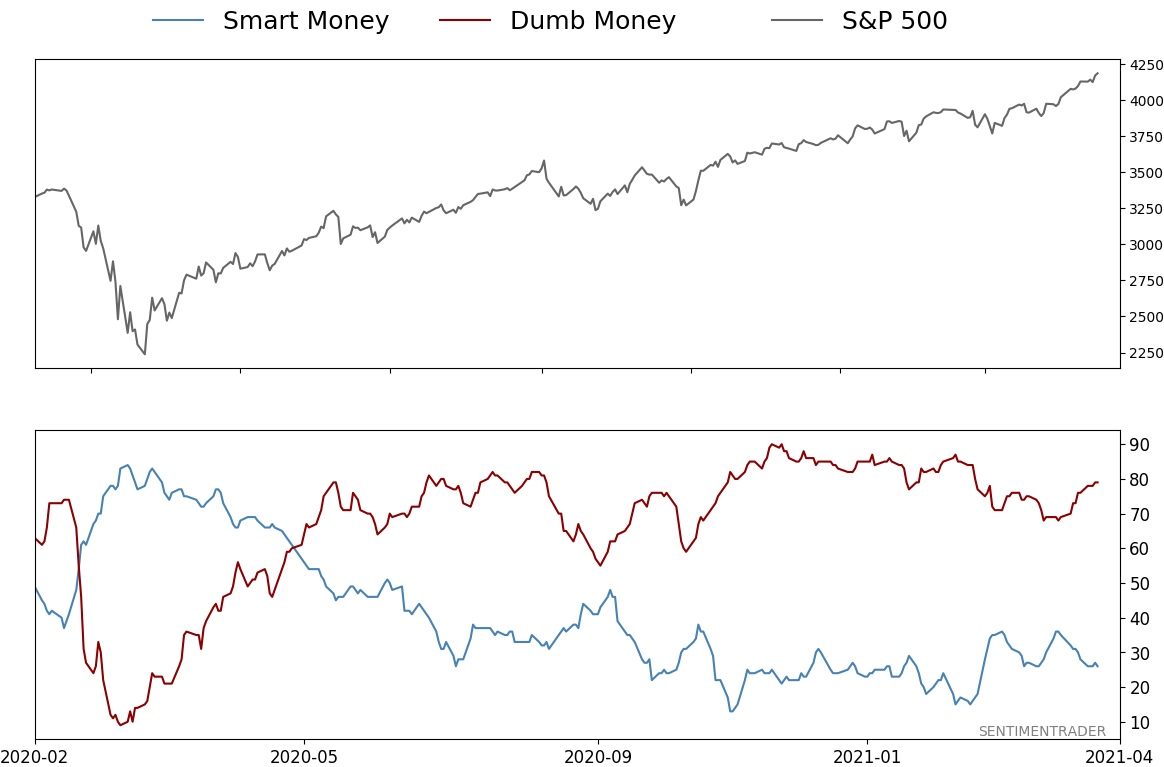
Smart / Dumb Money Confidence
|
Smart Money Confidence: 26%
Dumb Money Confidence: 79%
|
|
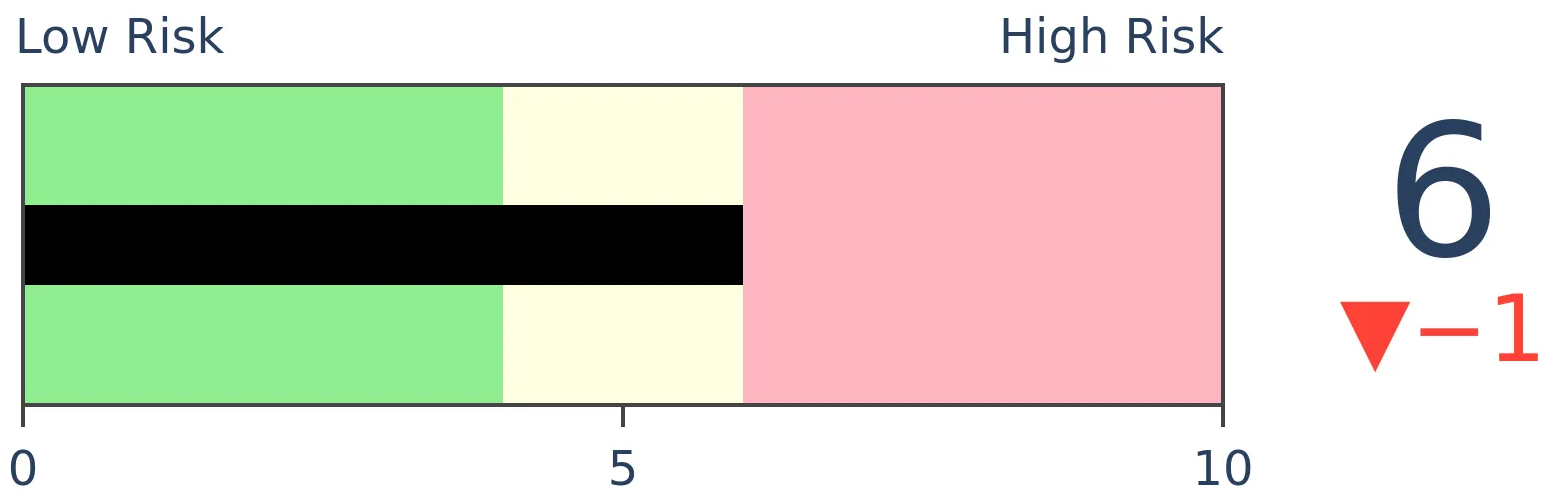
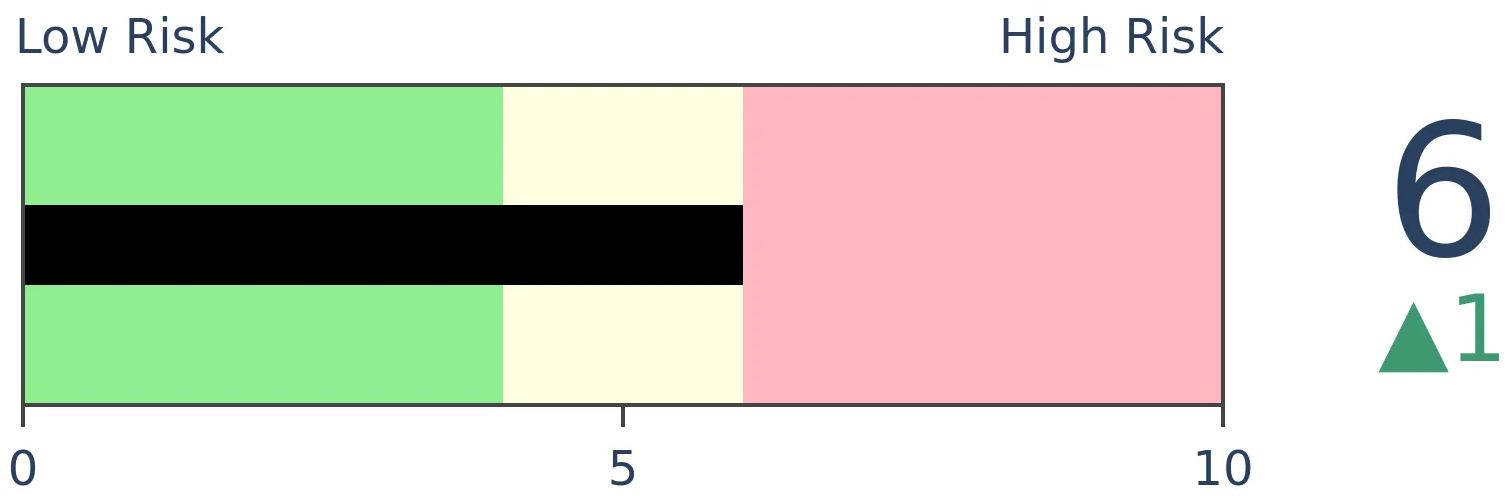
Risk Levels
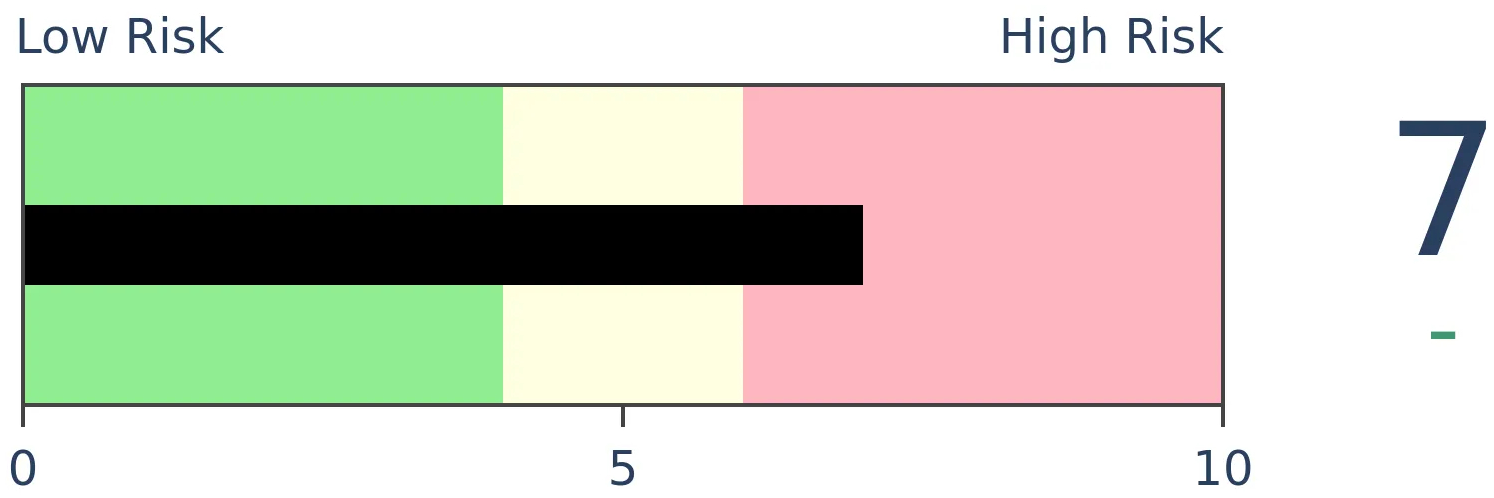
Stocks Short-Term
|
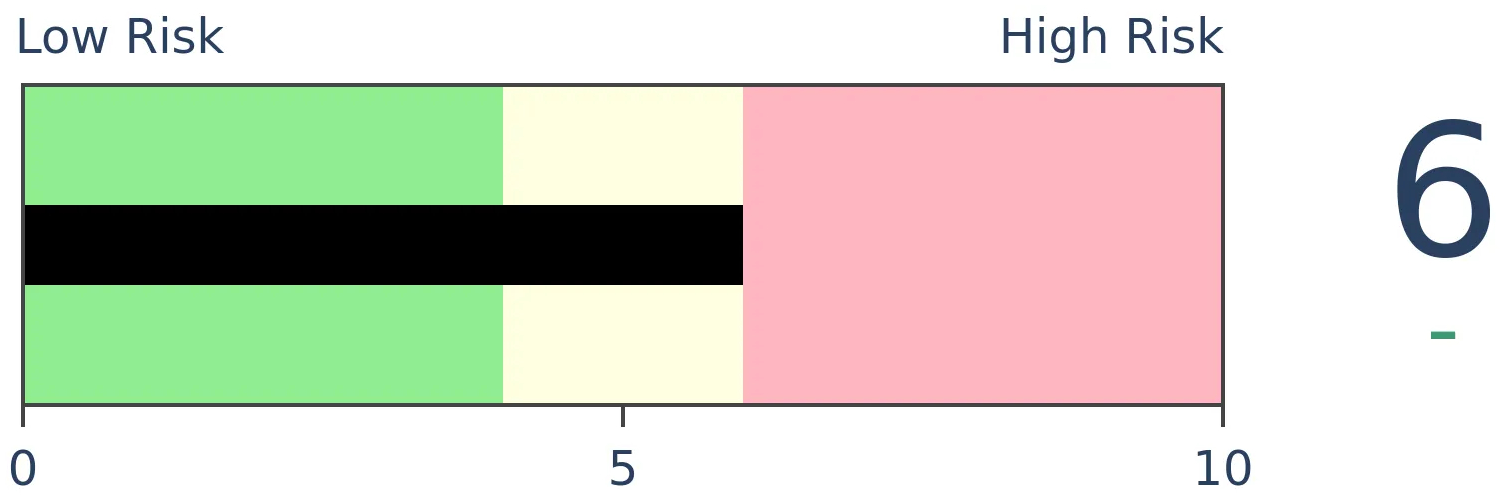
Stocks Medium-Term
|
|
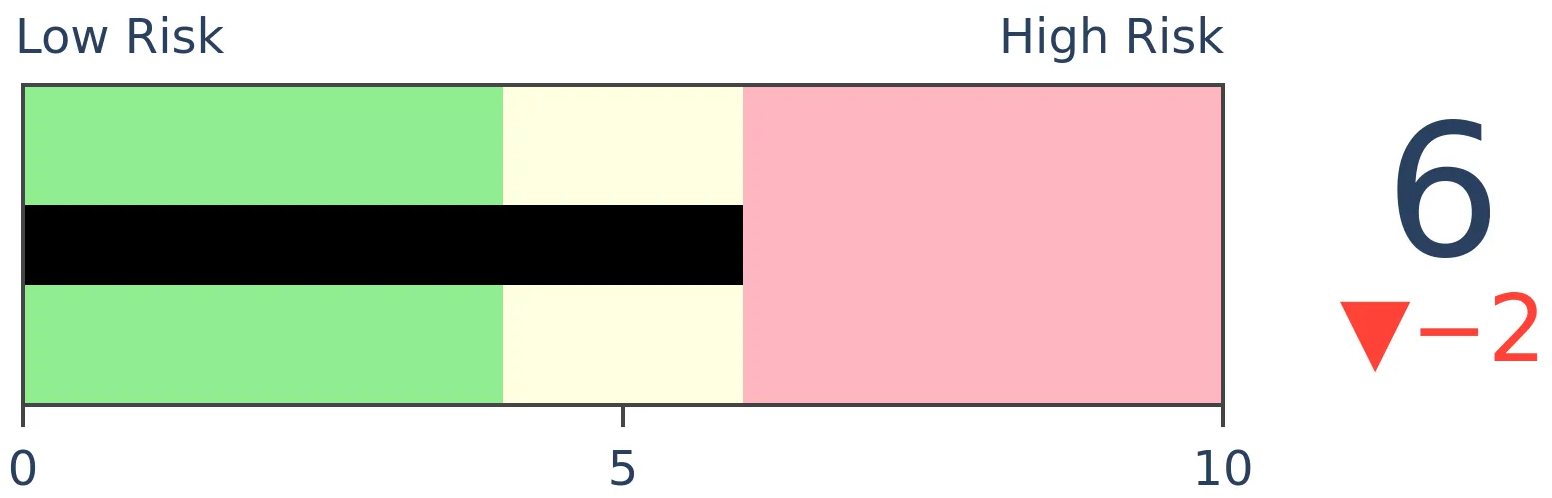
Bonds
|
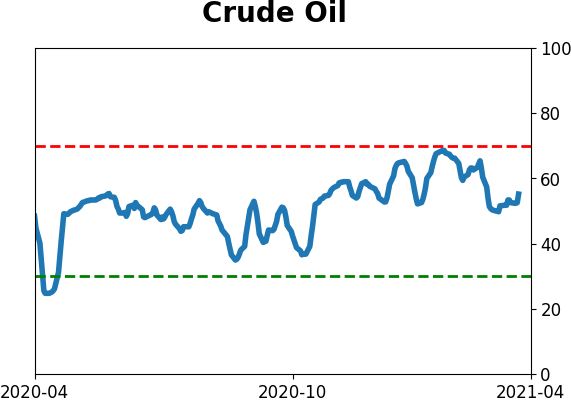
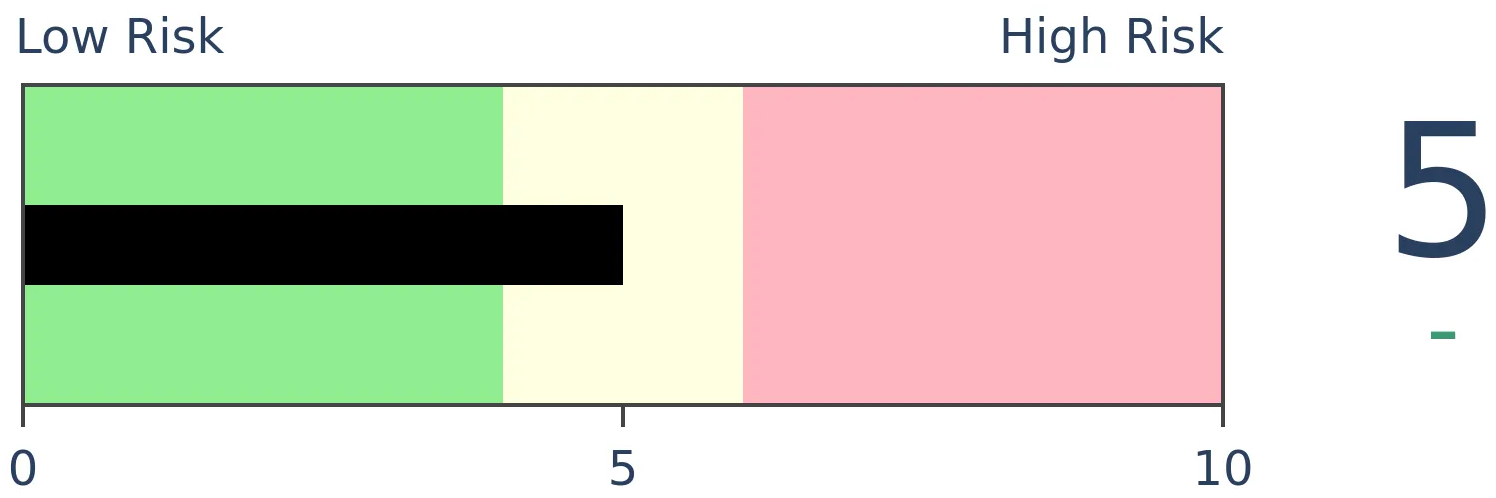
Crude Oil
|
|
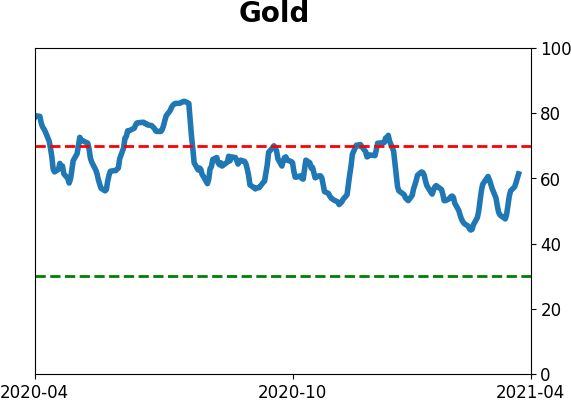
Gold
|
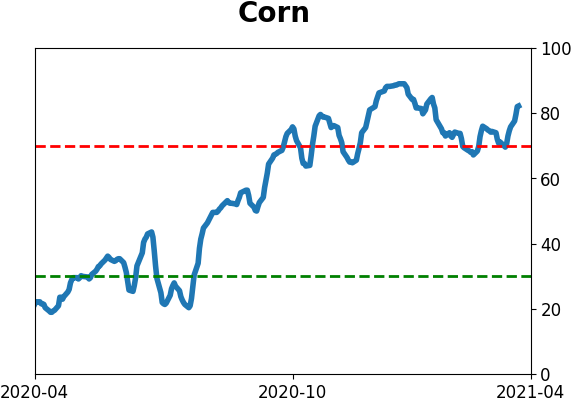
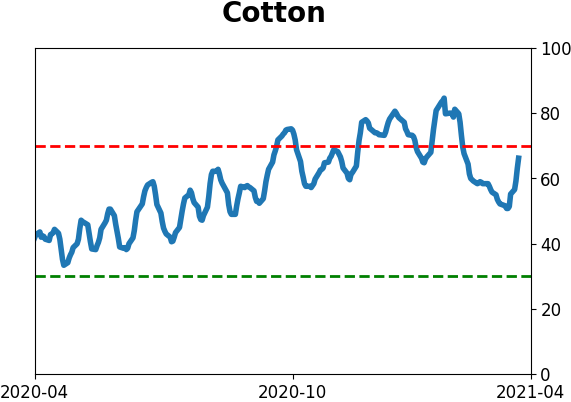
Agriculture
|
|
Research
BOTTOM LINE
This week saw very little hedging activity among investors, with even Wall Street showing high optimism. But there have still not been many, if any, major warning signs triggering. Gold has started to recover, but historically those recoveries have been an inconsistent signal.
FORECAST / TIMEFRAME
None
|
The goal of the Weekly Wrap is to summarize our recent research. Some of it includes premium content (underlined links), but we're highlighting the key focus of the research for all. Sometimes there is a lot to digest, with this summary meant to highlight the highest conviction ideas we discussed. Tags will show any symbols and time frames related to the research.
| STOCKS |
 |  |
|
Sentiment remains optimistic, with little hedging activity
With stocks on a persistent rip higher, what's the point in hedging? Investors seem to be asking themselves that more and more.
Last week, the Equity Hedging Index (EHI) dropped below 10 for one of the few times since we began calculating this nearly 20 years ago.
There are many ways in which an investor can hedge against a stock market decline, and we follow 6 of the most common ones in the EHI. The more each indicator shows hedging activity, the higher the Equity Hedging Index will be.
This is a contrary indicator, meaning that the higher the Equity Hedging Index is, the more likely stocks will rally going forward; the lower the Equity Hedging Index, the less likely stocks will rally, which we can see from the annualized returns in the chart below.
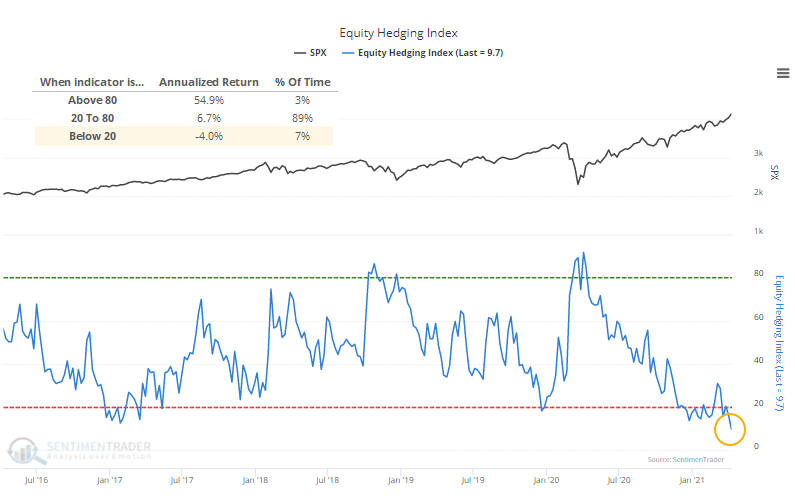
In that entire history, there have been only 9 other weeks with an EHI as low as this according to our Backtest Engine. All of them preceded weak medium- to long-term returns.
Last week, we saw the highly unusual - perhaps unprecedented - situation of massively positive medium- to long-term breadth thrusts not just among individual stocks, but also industries, sectors, and global indexes. This is happening despite many warnings from extended sentiment readings like the Equity Hedging Index. We've never really seen such a large and protracted tension like this, with the suggestion continuing to be that it's risky for late buyers, and also risky to bet against the momentum.
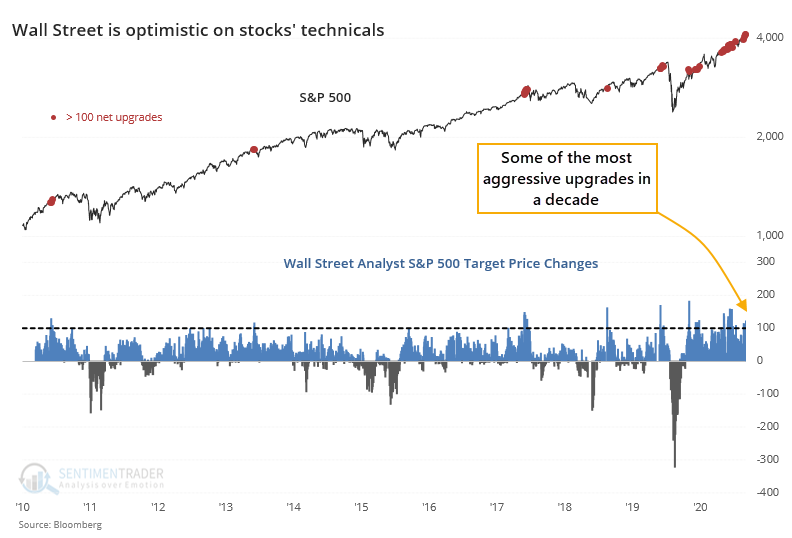
Wall Street is buying in
As we head into Q1 earnings reporting season, expectations are high and stocks are expensive. At the start of the last 282 earnings seasons, dating back to 1950, the average Shiller PE ratio for the S&P 500 was 19.3. This season, its valuation is nearly twice that.
Wall Street has been warming up to the upcoming reports with a bevy of bottom-up upgrades. Analysts have consistently upgraded the net price targets on more than 100 stocks in the S&P 500 in recent days.
 So, we're entering the coming month of earnings reports with extremely high valuations already, and anticipation that those values will get even more stretched as companies report their results. The only real comparison to this is Q3 of 2017, when stocks were highly valued (but not as high as they are currently) and Wall Street was extremely optimistic (but not as optimistic as it is now).
Analysts tend to work from the bottom up (fundamental earnings outlooks, company management quality, etc.), while strategists on the Street tend to work from the top down (macroeconomic principles, fiscal and monetary analysis, etc.).
Those top-down outlooks haven't been able to keep up with stocks' torrid pace; the S&P 500 is now above the median strategist year-end price target...and it's only April.
When the S&P gets more than 5% above strategists' price target, then it has tended to pause and let strategists catch up. We're not there yet, as the index is only about 1% above its average target price. This level of excess has led to an annualized return about in line with random, even a bit above.
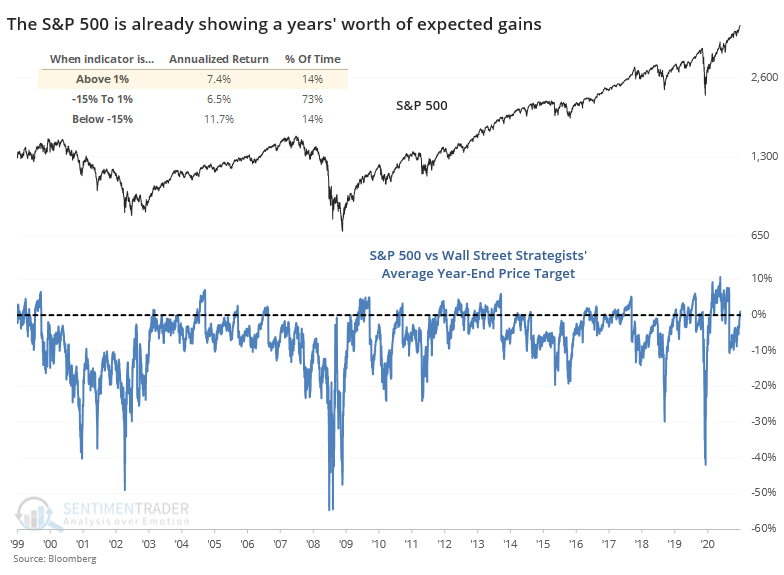
The more this travels above 0, the harder it gets to reach an even greater extreme, because strategists are more likely to upgrade their price targets the further the rally goes. Still, based on the current level and historical reactions, this is more of a (minor) worry in the shorter-term.
It helps that momentum and seasonality remain excellent
Jay detailed a recent buy signal from an obscure - and very long-term - technical indicator.
The Commodity Channel Index (CCI) is a fairly commonly used technical analysis tool. However, not many people use it like this: If the 90-month CCI (yes, 90 months!) CCI for the S&P 500 Index tops 180, a 48-month buy signal occurs.
For testing purposes, when the 90-month CCI ends a month above 180, we will categorize the next 48 months as bullish and we will ignore any new signals that occur within 24 months of a previous initial 48-month bullish period.
The chart below displays the cumulative price gain for the S&P 500 Index if held for 48 months after the dates listed in the table above.
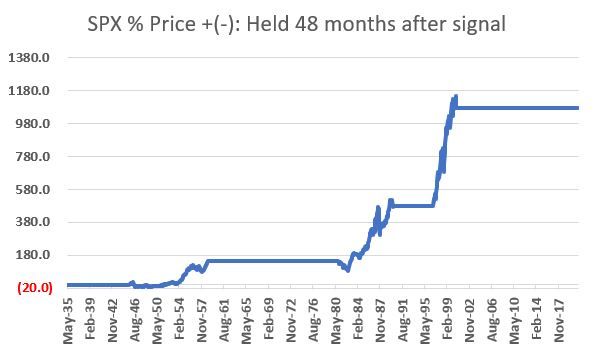
This version of the CCI just gave a buy signal near the end of March.
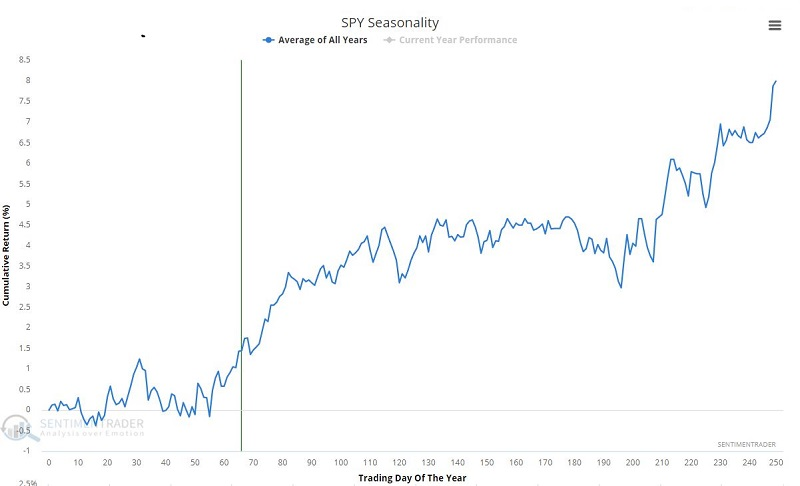
Along with momentum, stocks are also entering a seasonal sweet spot, as highlighted by Jay.
Jay noted another seasonal positive - the S&P 500 hasn't traded below its December low.
One of the many unique indicators popularized by The Stock Traders Almanac is this one: If the S&P 500 Index DOES NOT register a daily close during the first quarter of a year that is below the low of the previous December, then a favorable sign is flashed for stocks for the remainder of the calendar year.
The chart below displays the cumulative monthly return from 1950 into 2021, only holding from April through December, if the S&P 500 did not close below the previous December low during the first quarter. It far outpaced the Apr-Dec periods of years when the S&P did violate the December low in Q1.
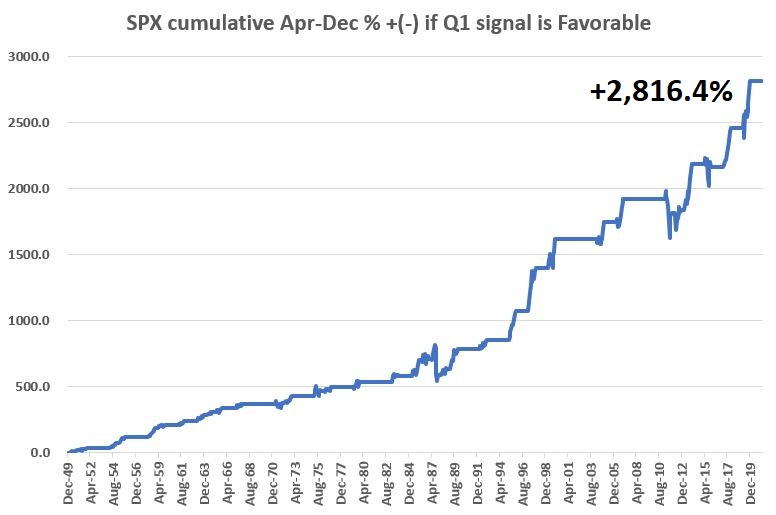
This triggered for 2021, suggesting a positive bias for the rest of the year.
STILL no warnings from the risk models
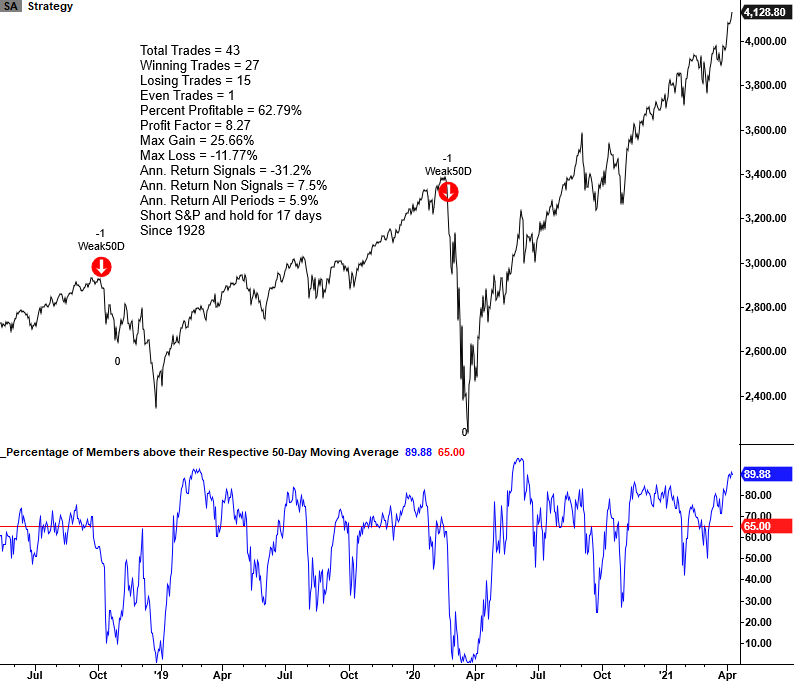
Dean outlined a risk-off signal using the percentage of stocks within the S&P 500 trading above their medium-term trends, which gave a buy signal recently.
In light of the new momentum buy signal for the percentage of members above the 50-day moving average, we can use the same time series to identify a risk-off environment.
This warning sign would trigger if about 2/3 of S&P 500 members dropped below their 50-day averages while the S&P index itself was near a 52-week high recently. Any further deterioration triggers the actual warning, and we've very far from that currently.
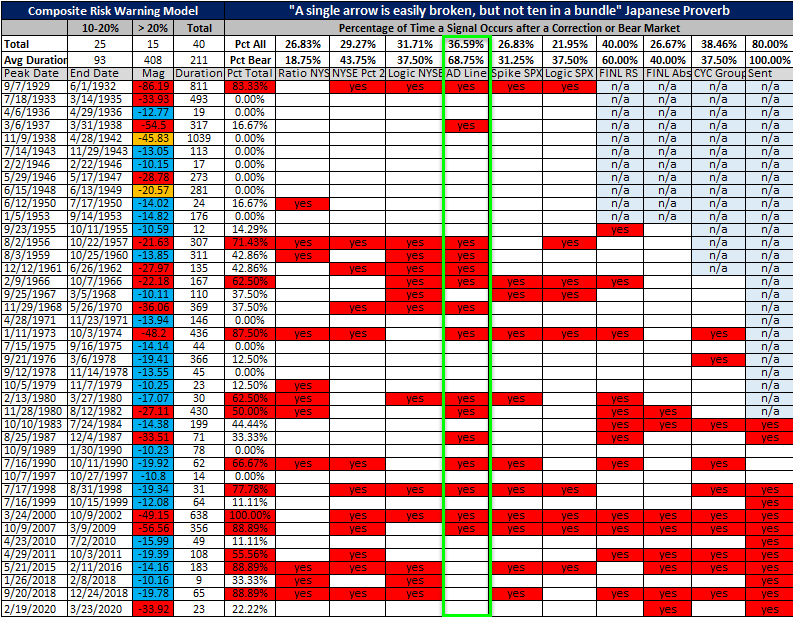
Dean updated another risk model using the NYSE Cumulative Advance/Decline Line.
The NYSE Advance-Decline Line Divergence Model seeks to identify instances in history when the NYSE cumulative advance-decline line falls as the S&P 500 Index closes at a multi-year high. If the A/D Line struggles and doesn't set a new high along with the S&P, then the warning sign will trigger.
Among Dean's major Risk Warning Models, this one triggered before 69% of bear markets. The NYSE cumulative advance-decline line continues to register new highs as most issues participate with the broad market advance, so this is not in danger of triggering soon.
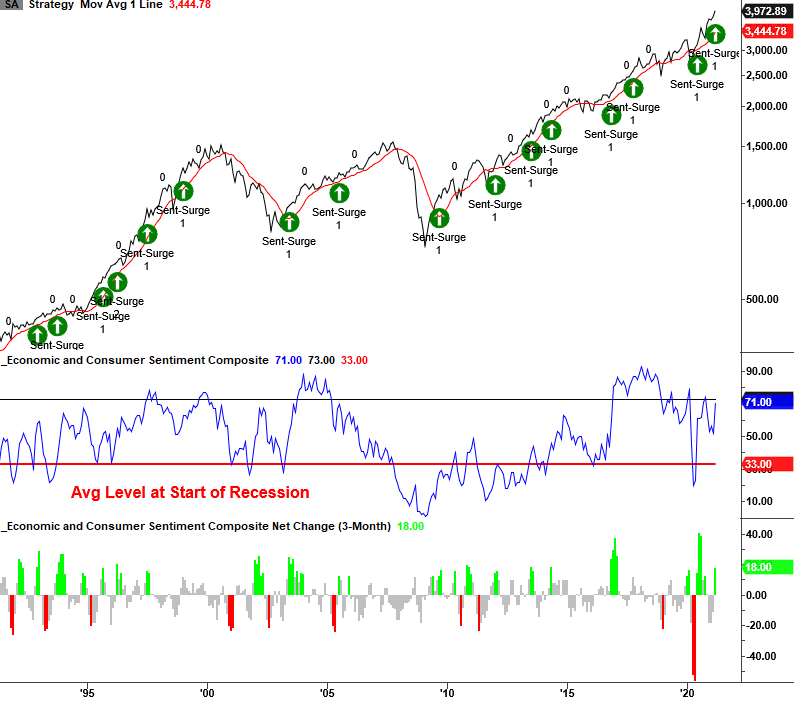
Fundamentals are supporting the recovery and helping to prevent many of those warning signs we'd normally see before a major decline. Dean outlined a model using economic inputs to represent those macro fundamentals, using 8 data series and ranking them based on their historical ranges.
The Economic and Consumer Sentiment Composite model seeks to identify instances in history when the 3-month net change in the composite surges above a user-defined threshold when the S&P 500 is in an uptrend. The model just gave another buy signal, which not only preceded mostly positive returns for the S&P 500, but also favored growth-oriented sectors.
All of this is just more evidence of the tension we're facing right now; a mostly pristine market environment with almost no internal risk signals triggering, versus stretched sentiment and lopsided positioning. It would be rare to see an immediate, large, and protracted decline from these conditions, just as it would be rare to see a large, sustained advance.
Staples vs Discretionary determined by inflation
One of the never ending "tug of war" battles in the market is that between the consumer staples sector and the consumer discretionary sector. The theory is that in stable times consumers will splurge on "wants" which should pump up discretionary stocks. On the other hand, during more troubled times consumers will focus on "needs" which should be a boost for staples stocks.
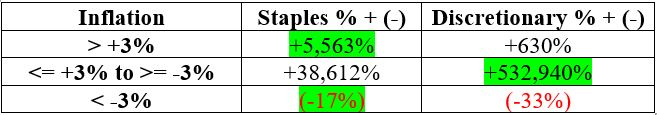
Jay detailed a strategy that looks solely at inflation to decide whether to be in the staples or discretionary sectors.
He measured inflation using the 12-month rate-of-change in the Consumer Price Index, using the month-end reading to decide what to hold during the following month. If inflation is high (greater than or equal to +3%) OR low (less than or equal to -3%), then we hold consumer staples. If inflation is within that range (greater than -3% to less than +3%), then we hold consumer discretionary.
The differences in returns between the sectors based on the rate of inflation was stark.
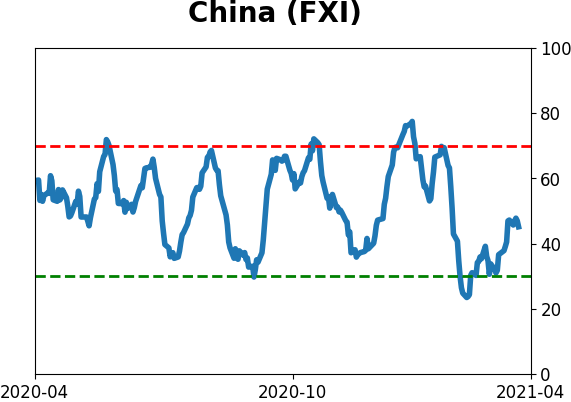
Chinese stocks struggling
Last week, we saw that there has been a remarkable thrust in breadth among global markets.
But not everyone is participating. Appetite for trading in China has wanted, as Bloomberg recently noted. The lack of enthusiasm is even more pronounced among those trading on margin. Turnover in margin accounts over the past month has sunk dramatically.
It's not hard to see why. The average stock in that market has been declining for months, even if some of the major Chinese indexes have held up despite that deterioration. The Cumulative Advance/Decline Line for the Shanghai Composite is challenging its 5-year low.
This activity has pushed the McClellan Summation Index for the Shanghai below zero...and kept it there. This is exactly the opposite of what we see in a healthy market environment.
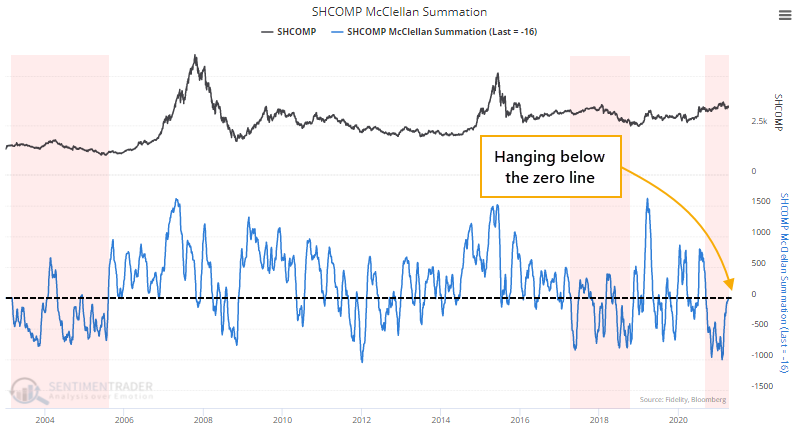
None of this is especially damning evidence for buyers, but there isn't much here to suggest it's a great opportunity. Chinese stocks have been showing poor participation, and buyers have not been eager like they are in healthier market environments. Many stocks are lagging, and it's not like we're seeing overwhelming displays of pessimism that might hint at a contrarian opportunity.
Vietnam has been stellar
Dean did a deep dive on other emerging and frontier countries, and noted that Vietnam sticks out for its internal, absolute, and relative performance.
In addition to a whole host of positive trends relative to recent activity and also relative to other markets, Vietnam looks good with a recent internal breadth thrust buy signal.
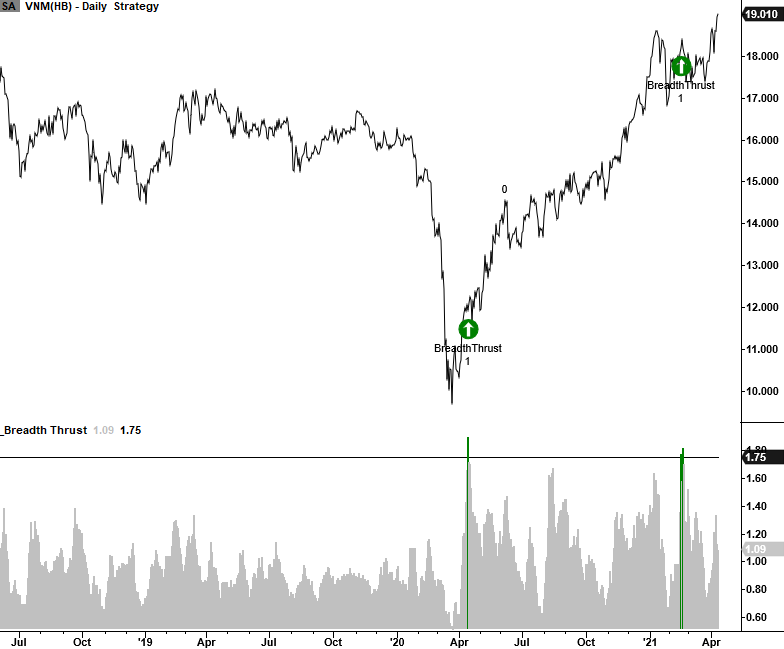
Vietnam is a shining light in an otherwise weak environment for emerging market countries as measured by absolute and relative trends. As always, I will be keeping an eye on the Dollar Index.
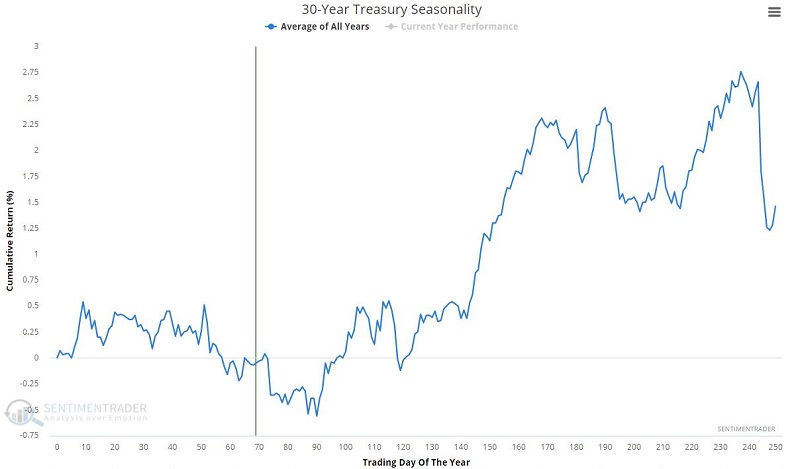
Jay asked whether this is a good time to get very bullish on t-bonds? Seasonality suggests one be patient just a bit longer for a potentially better buying opportunity and/or better odds of an advance in late spring or early summer.
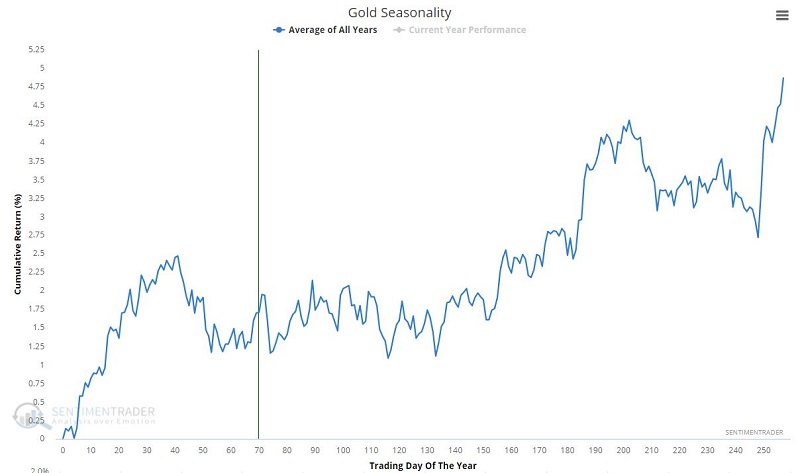
Jay also asked what the heck to do with gold? Seasonality suggests nothing at all for a while. If you want to trade gold you'd better find some other tool with which to form an opinion.
The barbarous relic has been lagging most other markets for months, but for the first time in more than 50 sessions, the metal is set to close above its 50-day average, triggering a pretty decent-looking bottoming pattern for those who pay attention to charts.
The biggest issue is that gold hasn't responded very well to improving conditions like this. It can be a trendy market, and the fact that it held below its 50-day average for so long suggests that sellers have been fairly aggressive. And they haven't let up so easily in the past.
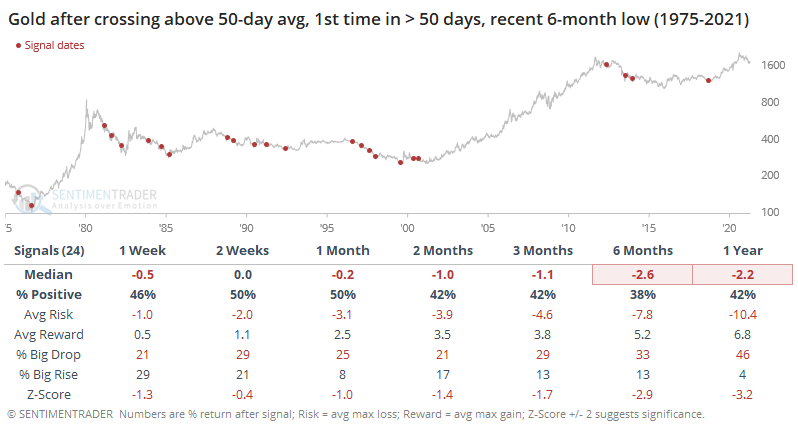
The last signal was an excellent sign for buyers as it was at the start of a long-term recovery. The last signal in a cluster usually is. The problem is that most of the signals failed, and usually quickly.
There was a +0.38 correlation (on a scale of -1.0 to +1.0) between gold's return 1 week later and its return 6 months later. This gives us a bit of a hint that if buyers come in quickly after this recovery, then gold has a better probability of adding to those gains in the months ahead.
These crosses above the 50-day in gold weren't that great of a sign for gold mining stocks, either.
Active Studies
| Time Frame | Bullish | Bearish | | Short-Term | 0 | 0 | | Medium-Term | 0 | 10 | | Long-Term | 11 | 4 |
|
Indicators at Extremes
Portfolio
| Position | Description | Weight % | Added / Reduced | Date | | Stocks | RSP | 4.9 | Reduced 4% | 2021-02-09 | | Bonds | 30.0% BND, 8.8% SCHP | 38.8 | Added 15.1% | 2021-02-18 | | Commodities | GCC | 2.3 | Reduced 2.1%
| 2020-09-04 | | Precious Metals | GDX | 9.0 | Added 0.1% | 2021-02-18 | | Special Situations | 7.3% XLE, 4.8% PSCE | 12.1 | Reduced 5.6% | 2021-02-18 | | Cash | | 32.8 | | |
|
Updates (Changes made today are underlined)
With a market that has seen the kinds of broad participation and big breath thrusts like we did in the fall, it's hard to become too negative. Those kinds of conditions have consistently preceded higher returns over the next 6-12 months. It's the interim that's more of an issue. Even conditions like that haven't prevented some shorter-term pullbacks. And when we combine an environment where speculation is rampant and recent days have seen an increase in cracks under the surface of the indexes, it's enough to become more defensive over a short- to medium-term time frame. We still don't have much confirmation from the price action in the indexes, so those who are more conservative would likely wait before increasing cash levels. I've decreased risk exposure a bit more, mainly in terms of energy stocks and the ANGL fund, while adding more to the broader bond market. RETURN YTD: 7.2% 2020: 8.1%, 2019: 12.6%, 2018: 0.6%, 2017: 3.8%, 2016: 17.1%, 2015: 9.2%, 2014: 14.5%, 2013: 2.2%, 2012: 10.8%, 2011: 16.5%, 2010: 15.3%, 2009: 23.9%, 2008: 16.2%, 2007: 7.8%
|
|
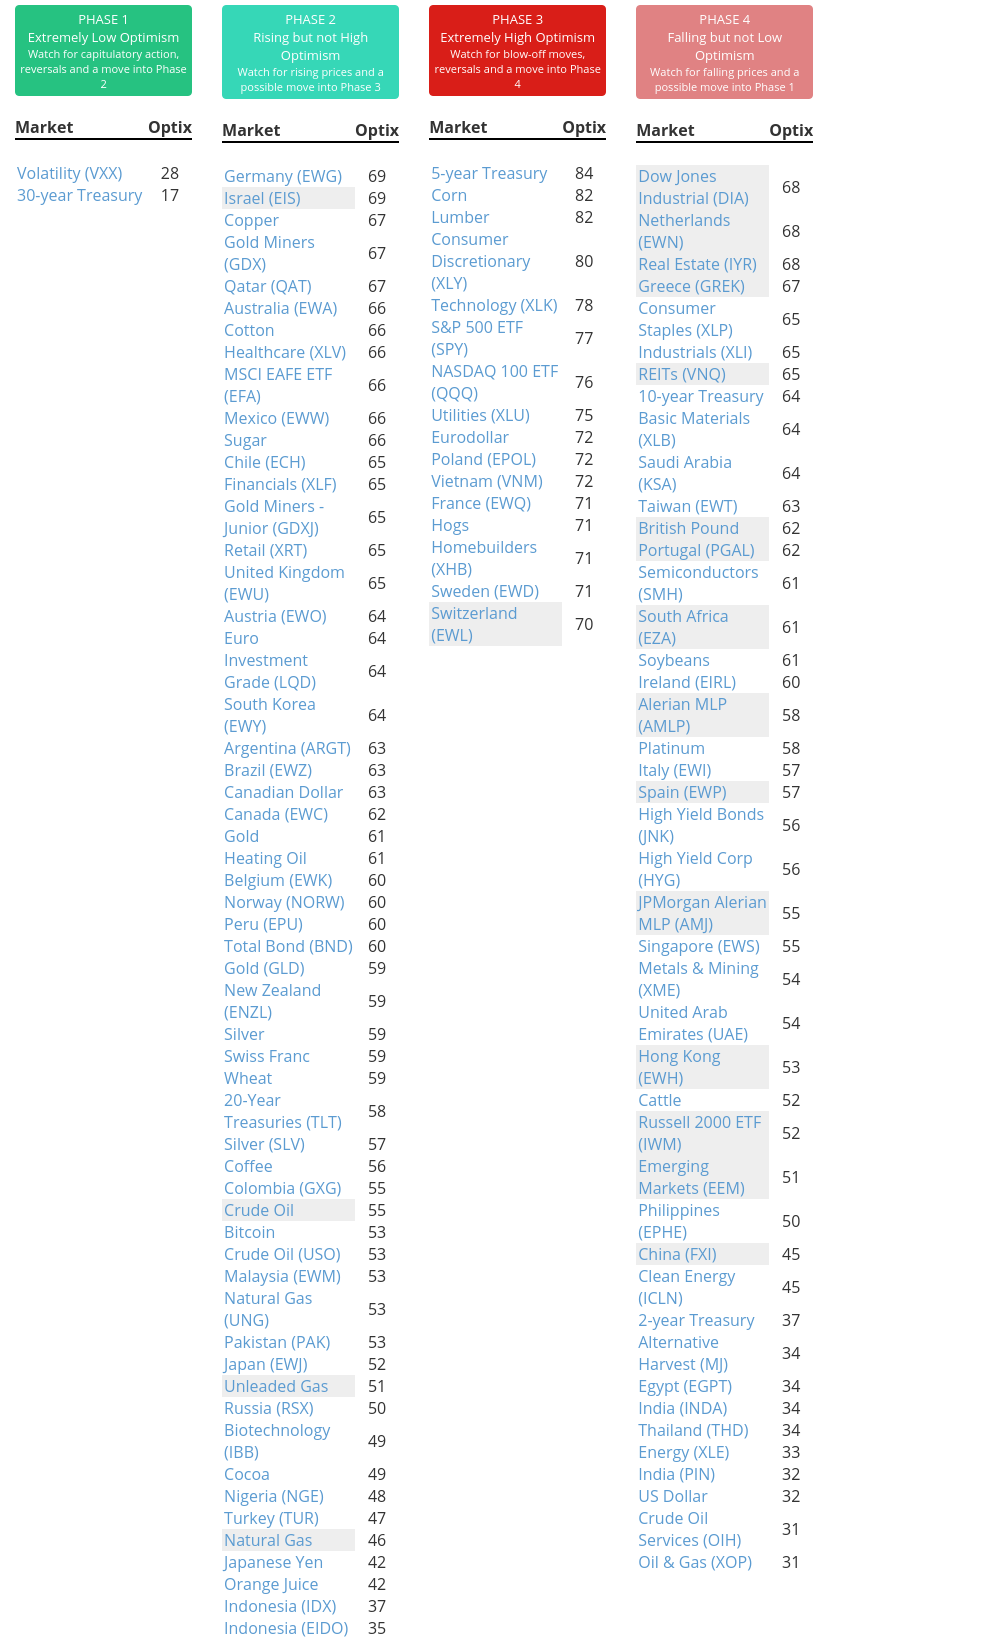
Phase Table
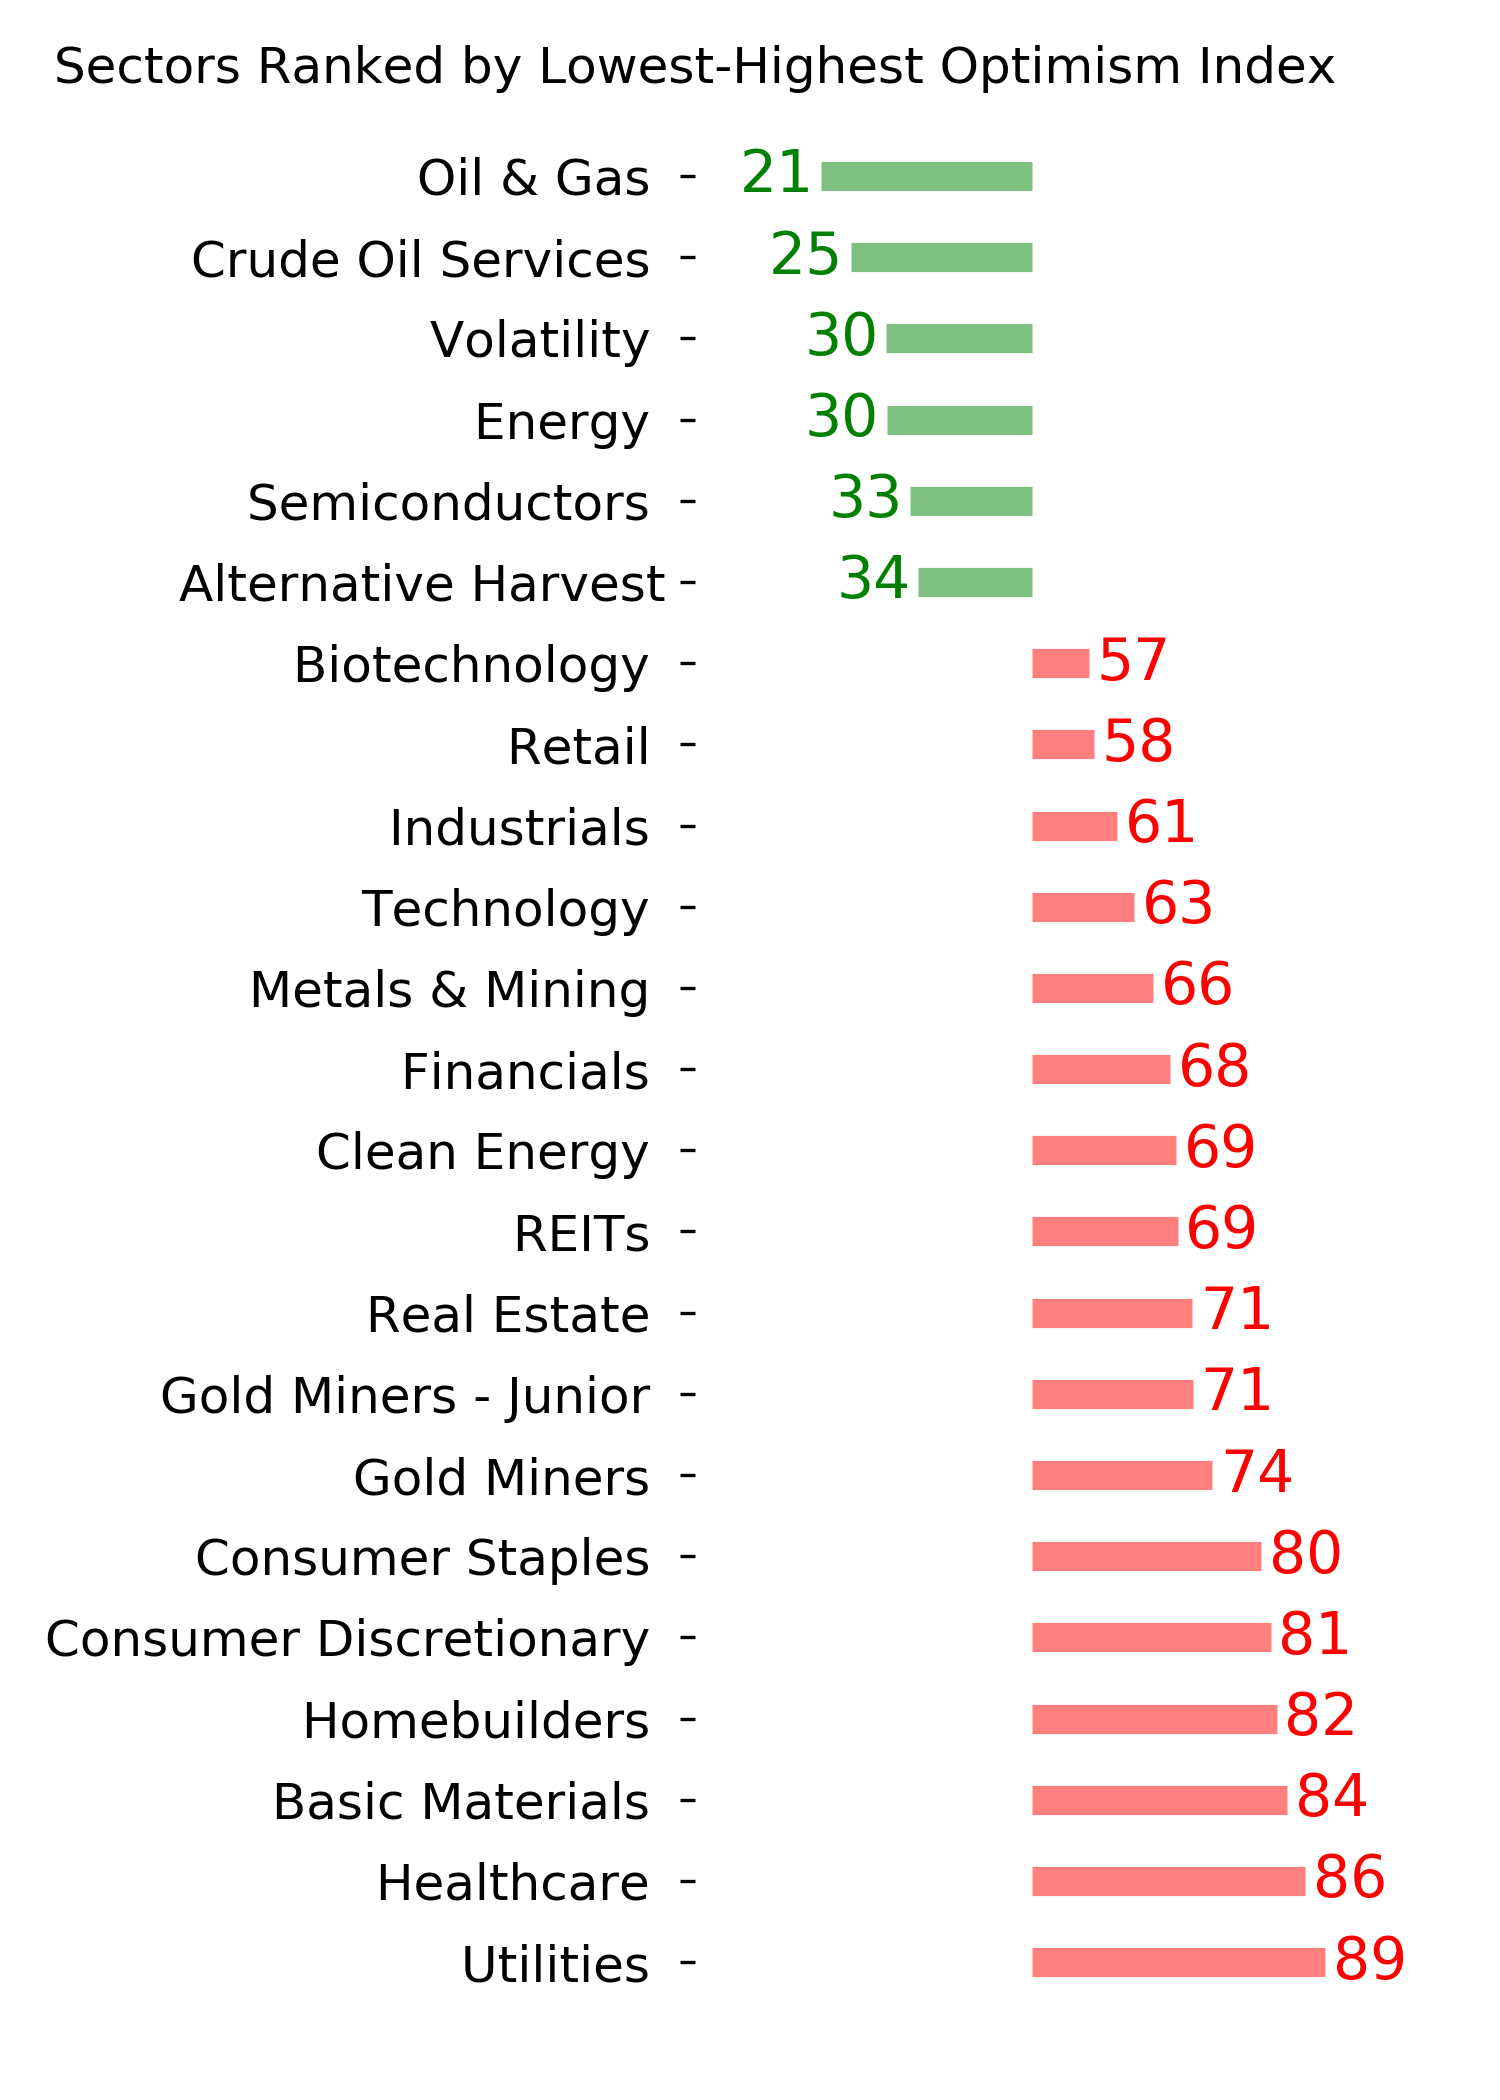
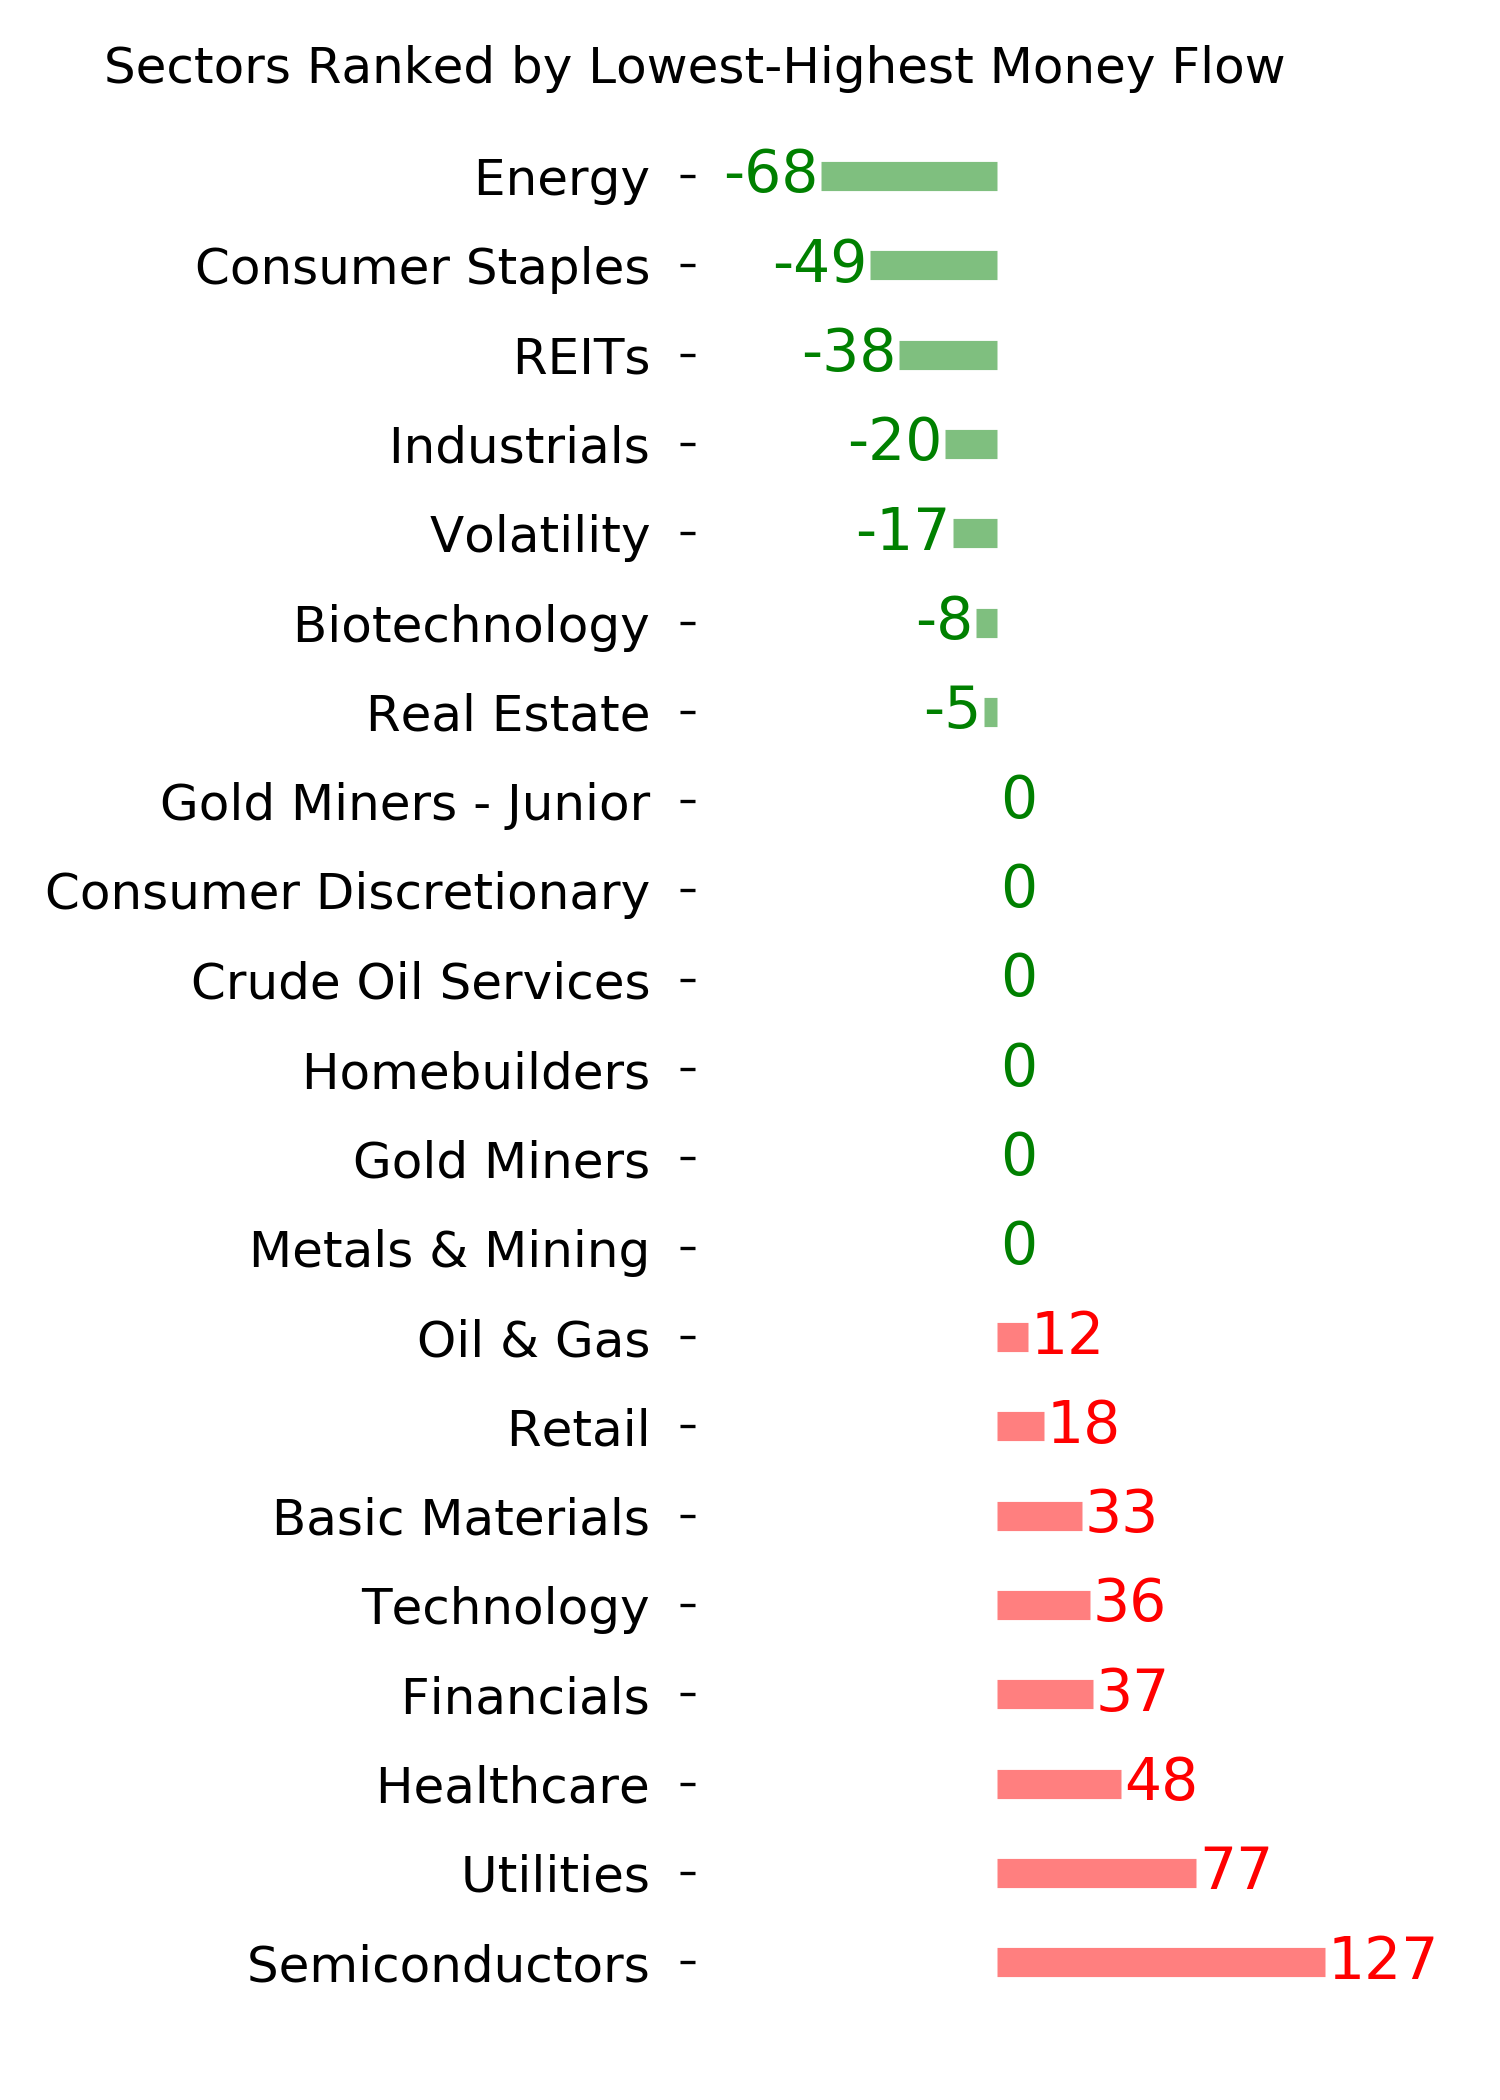
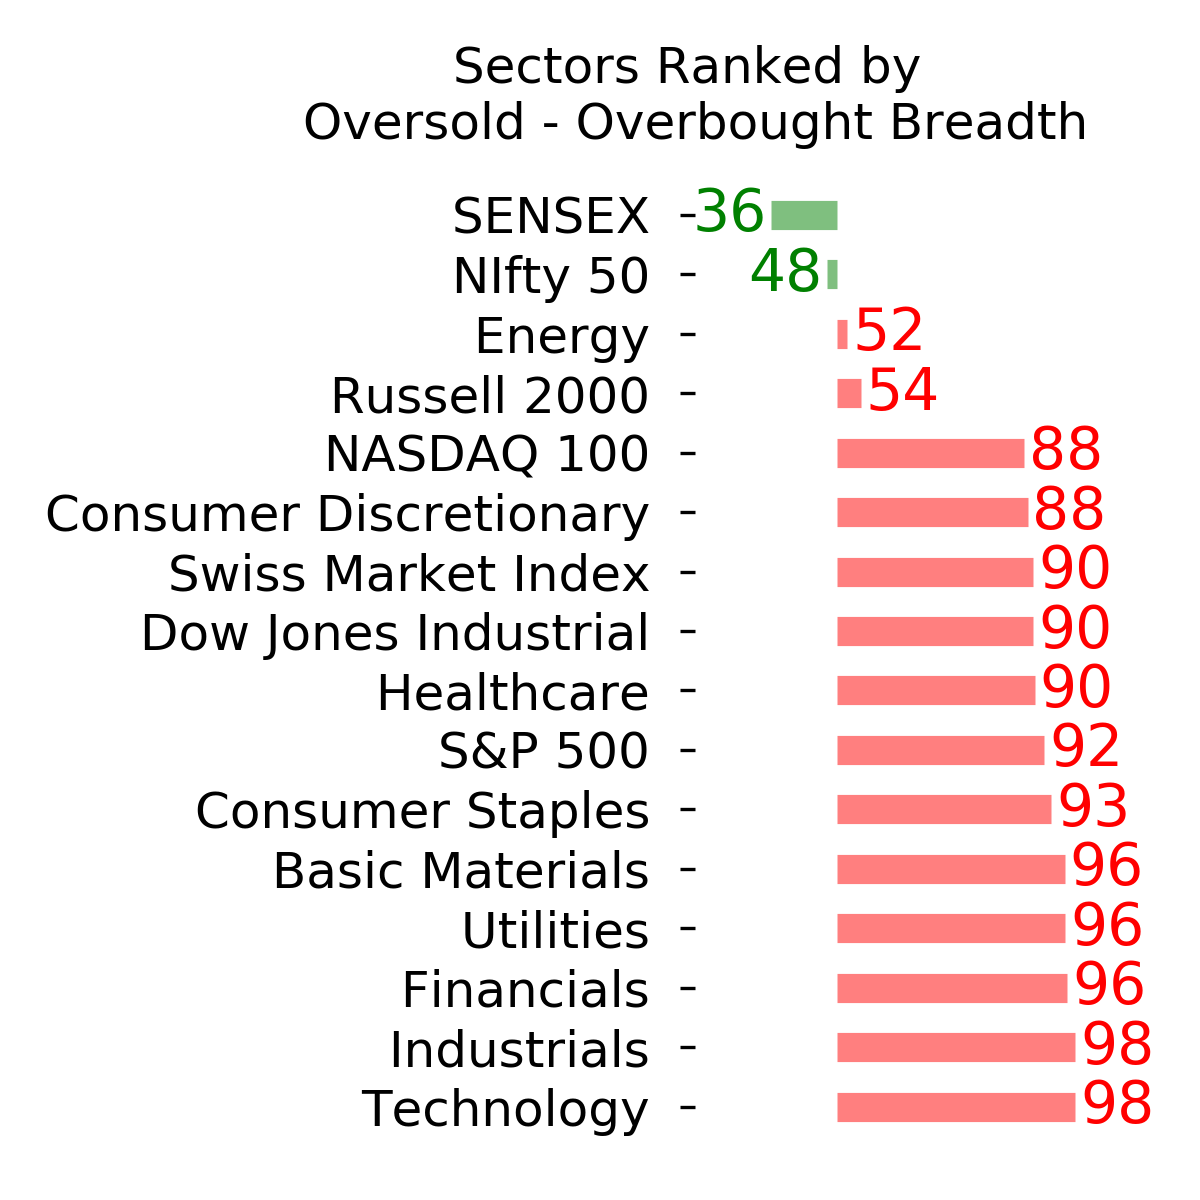
Ranks
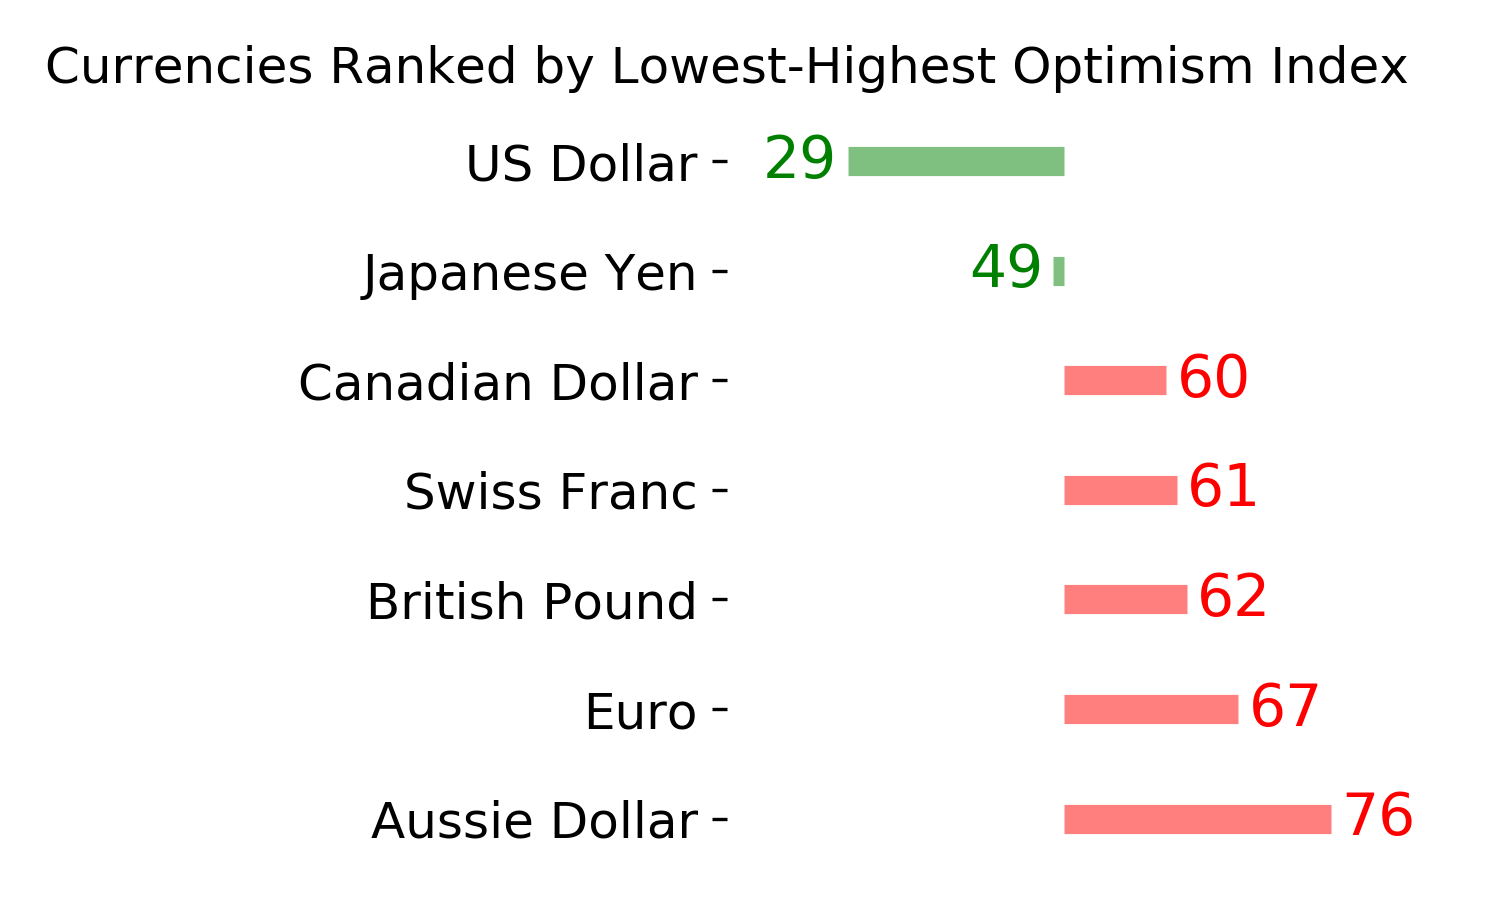
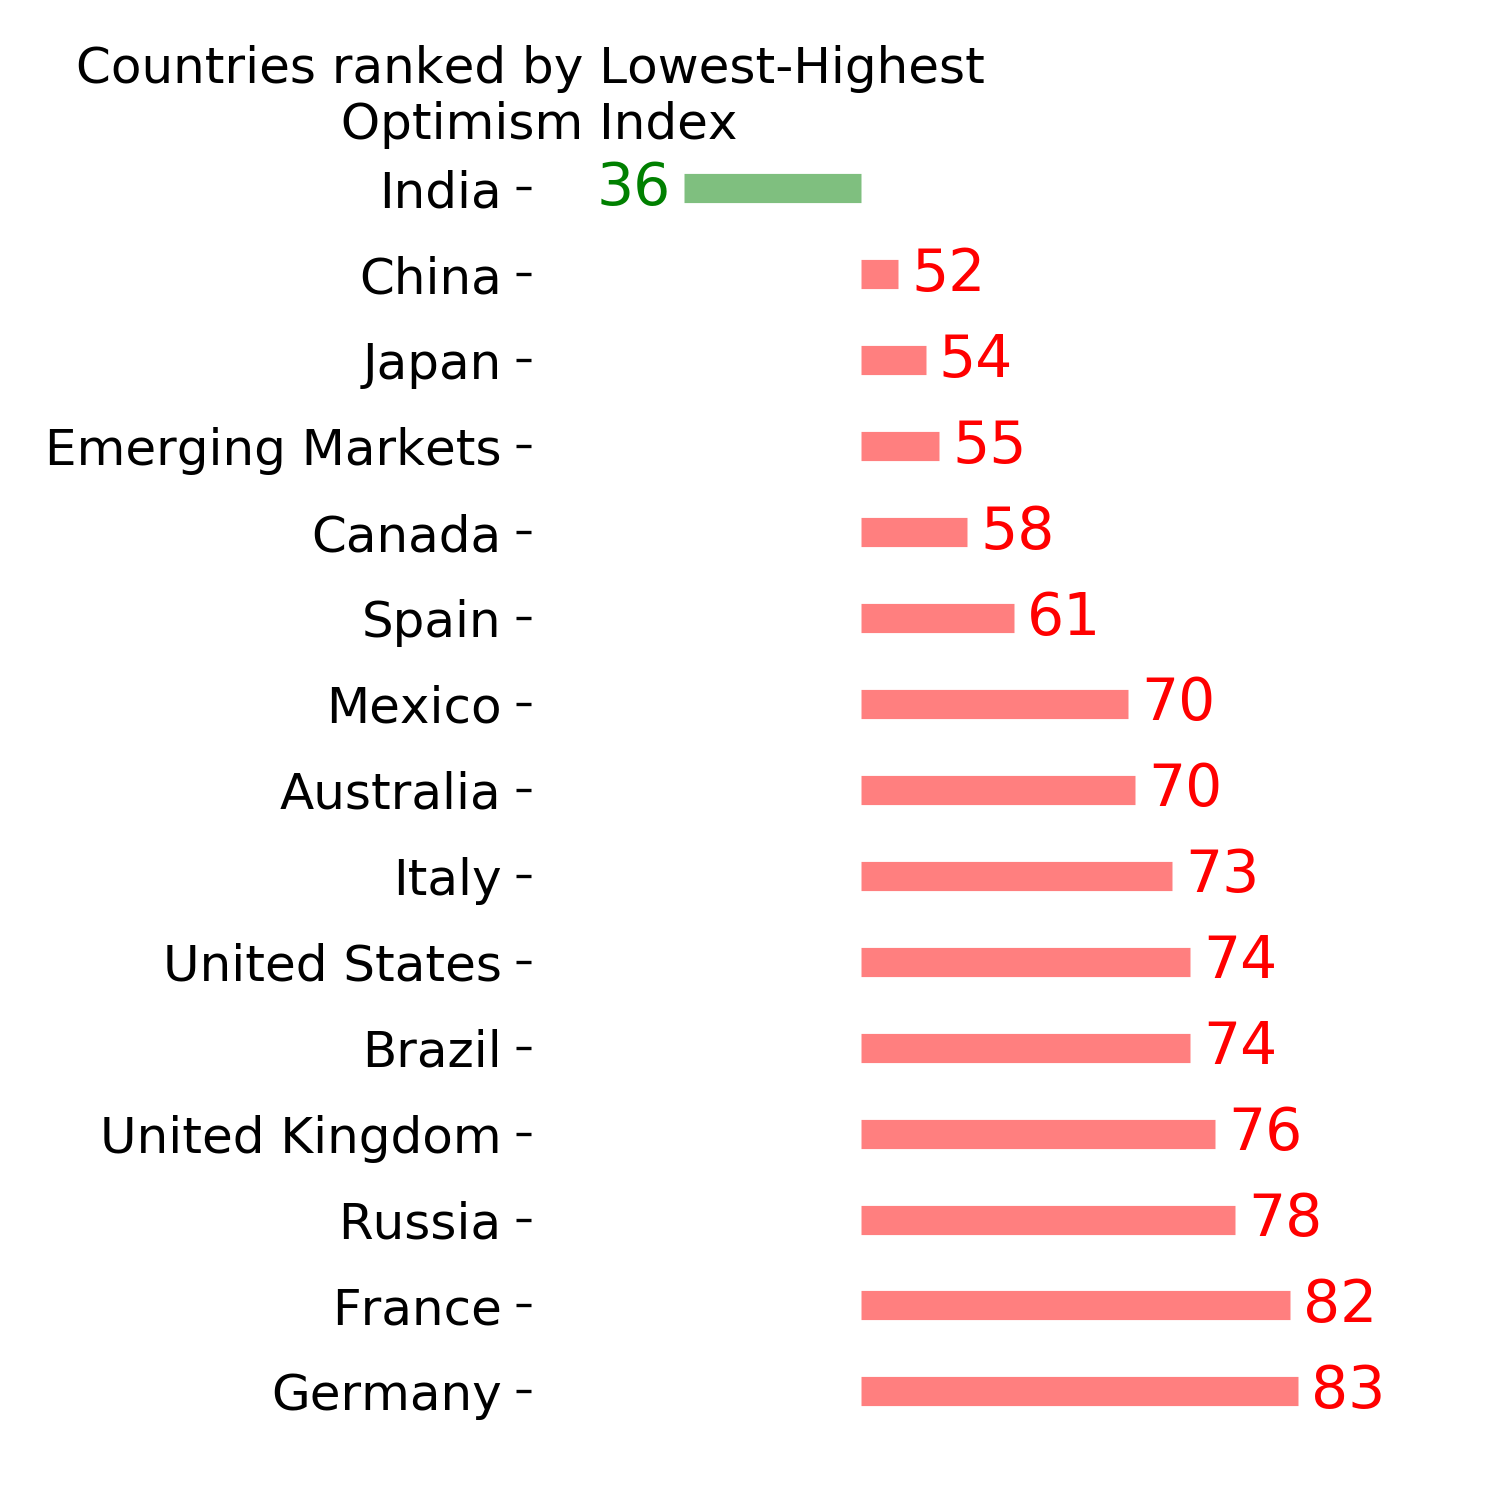
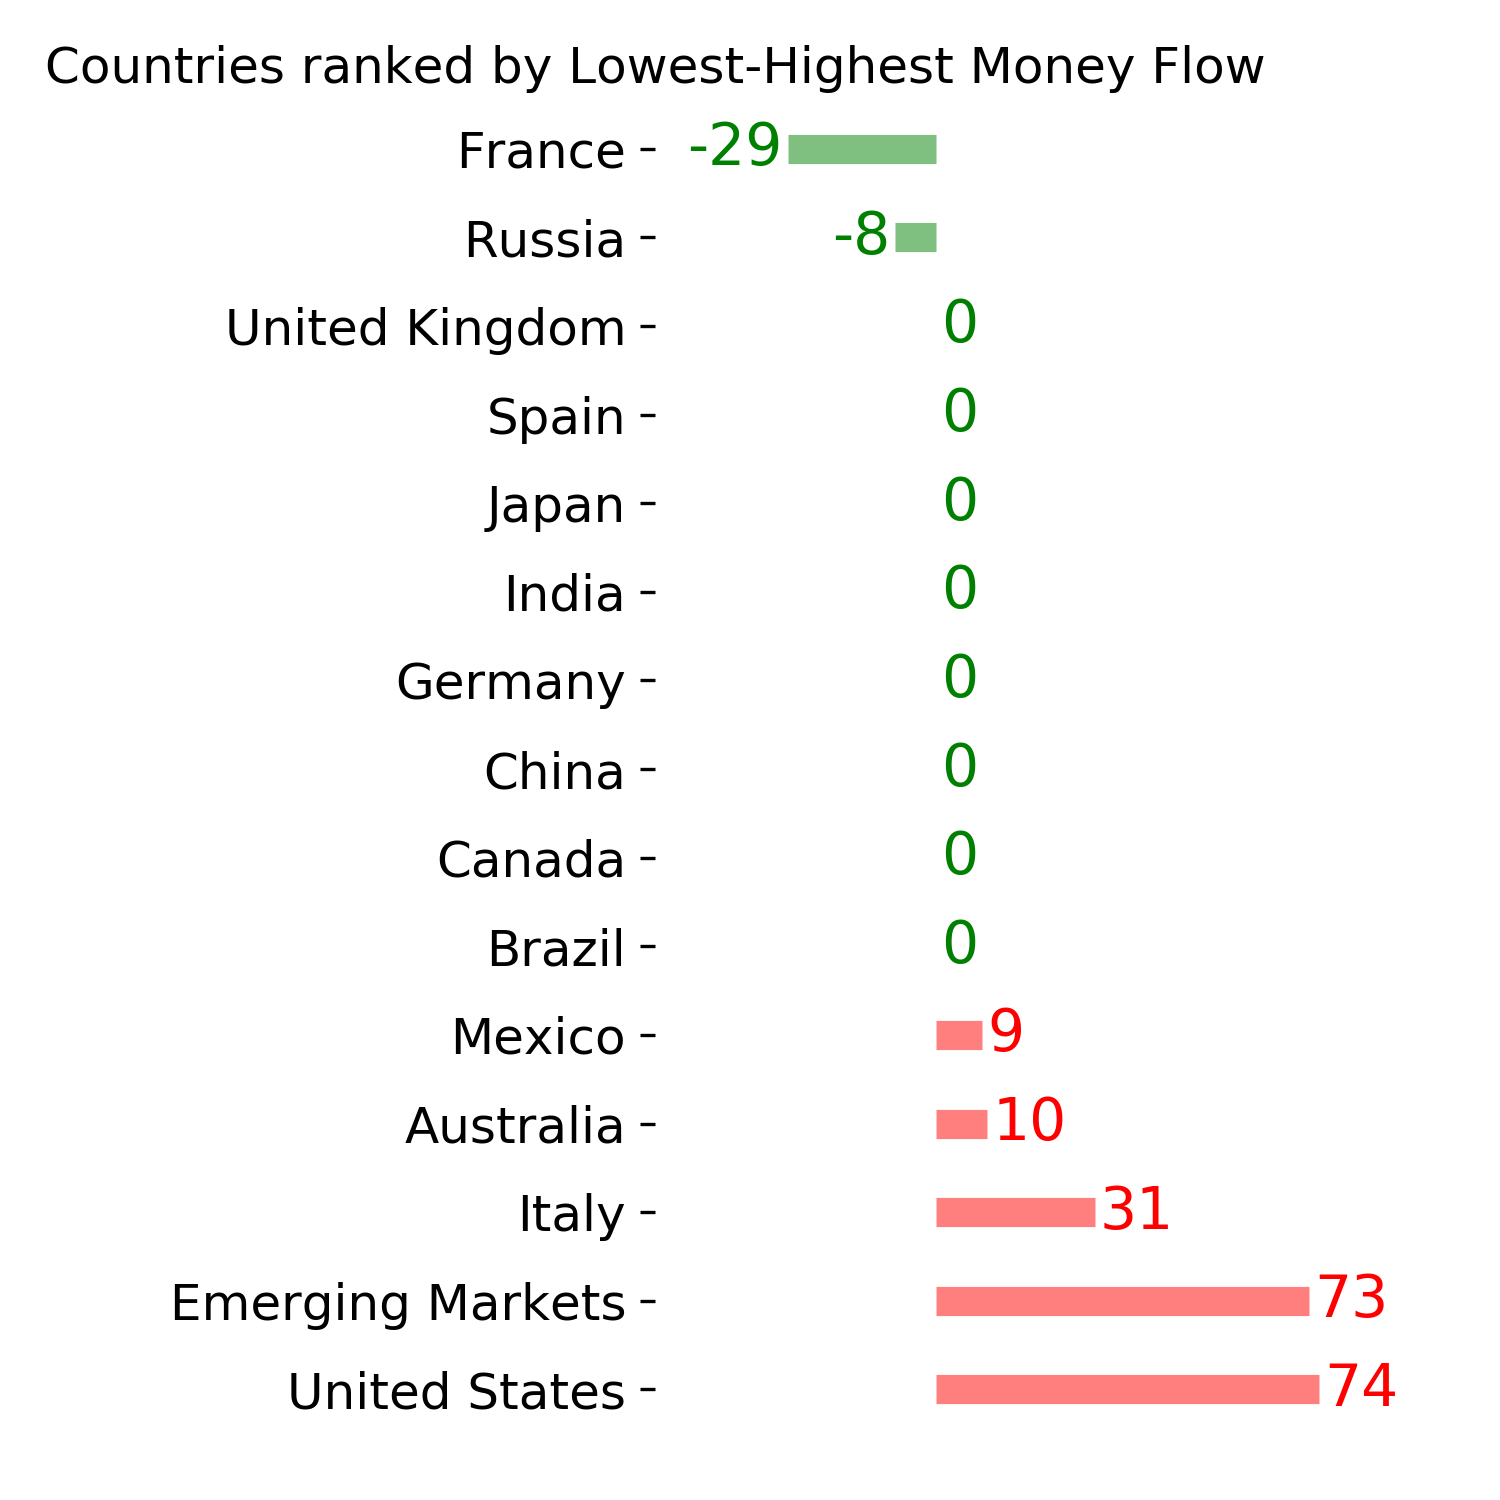
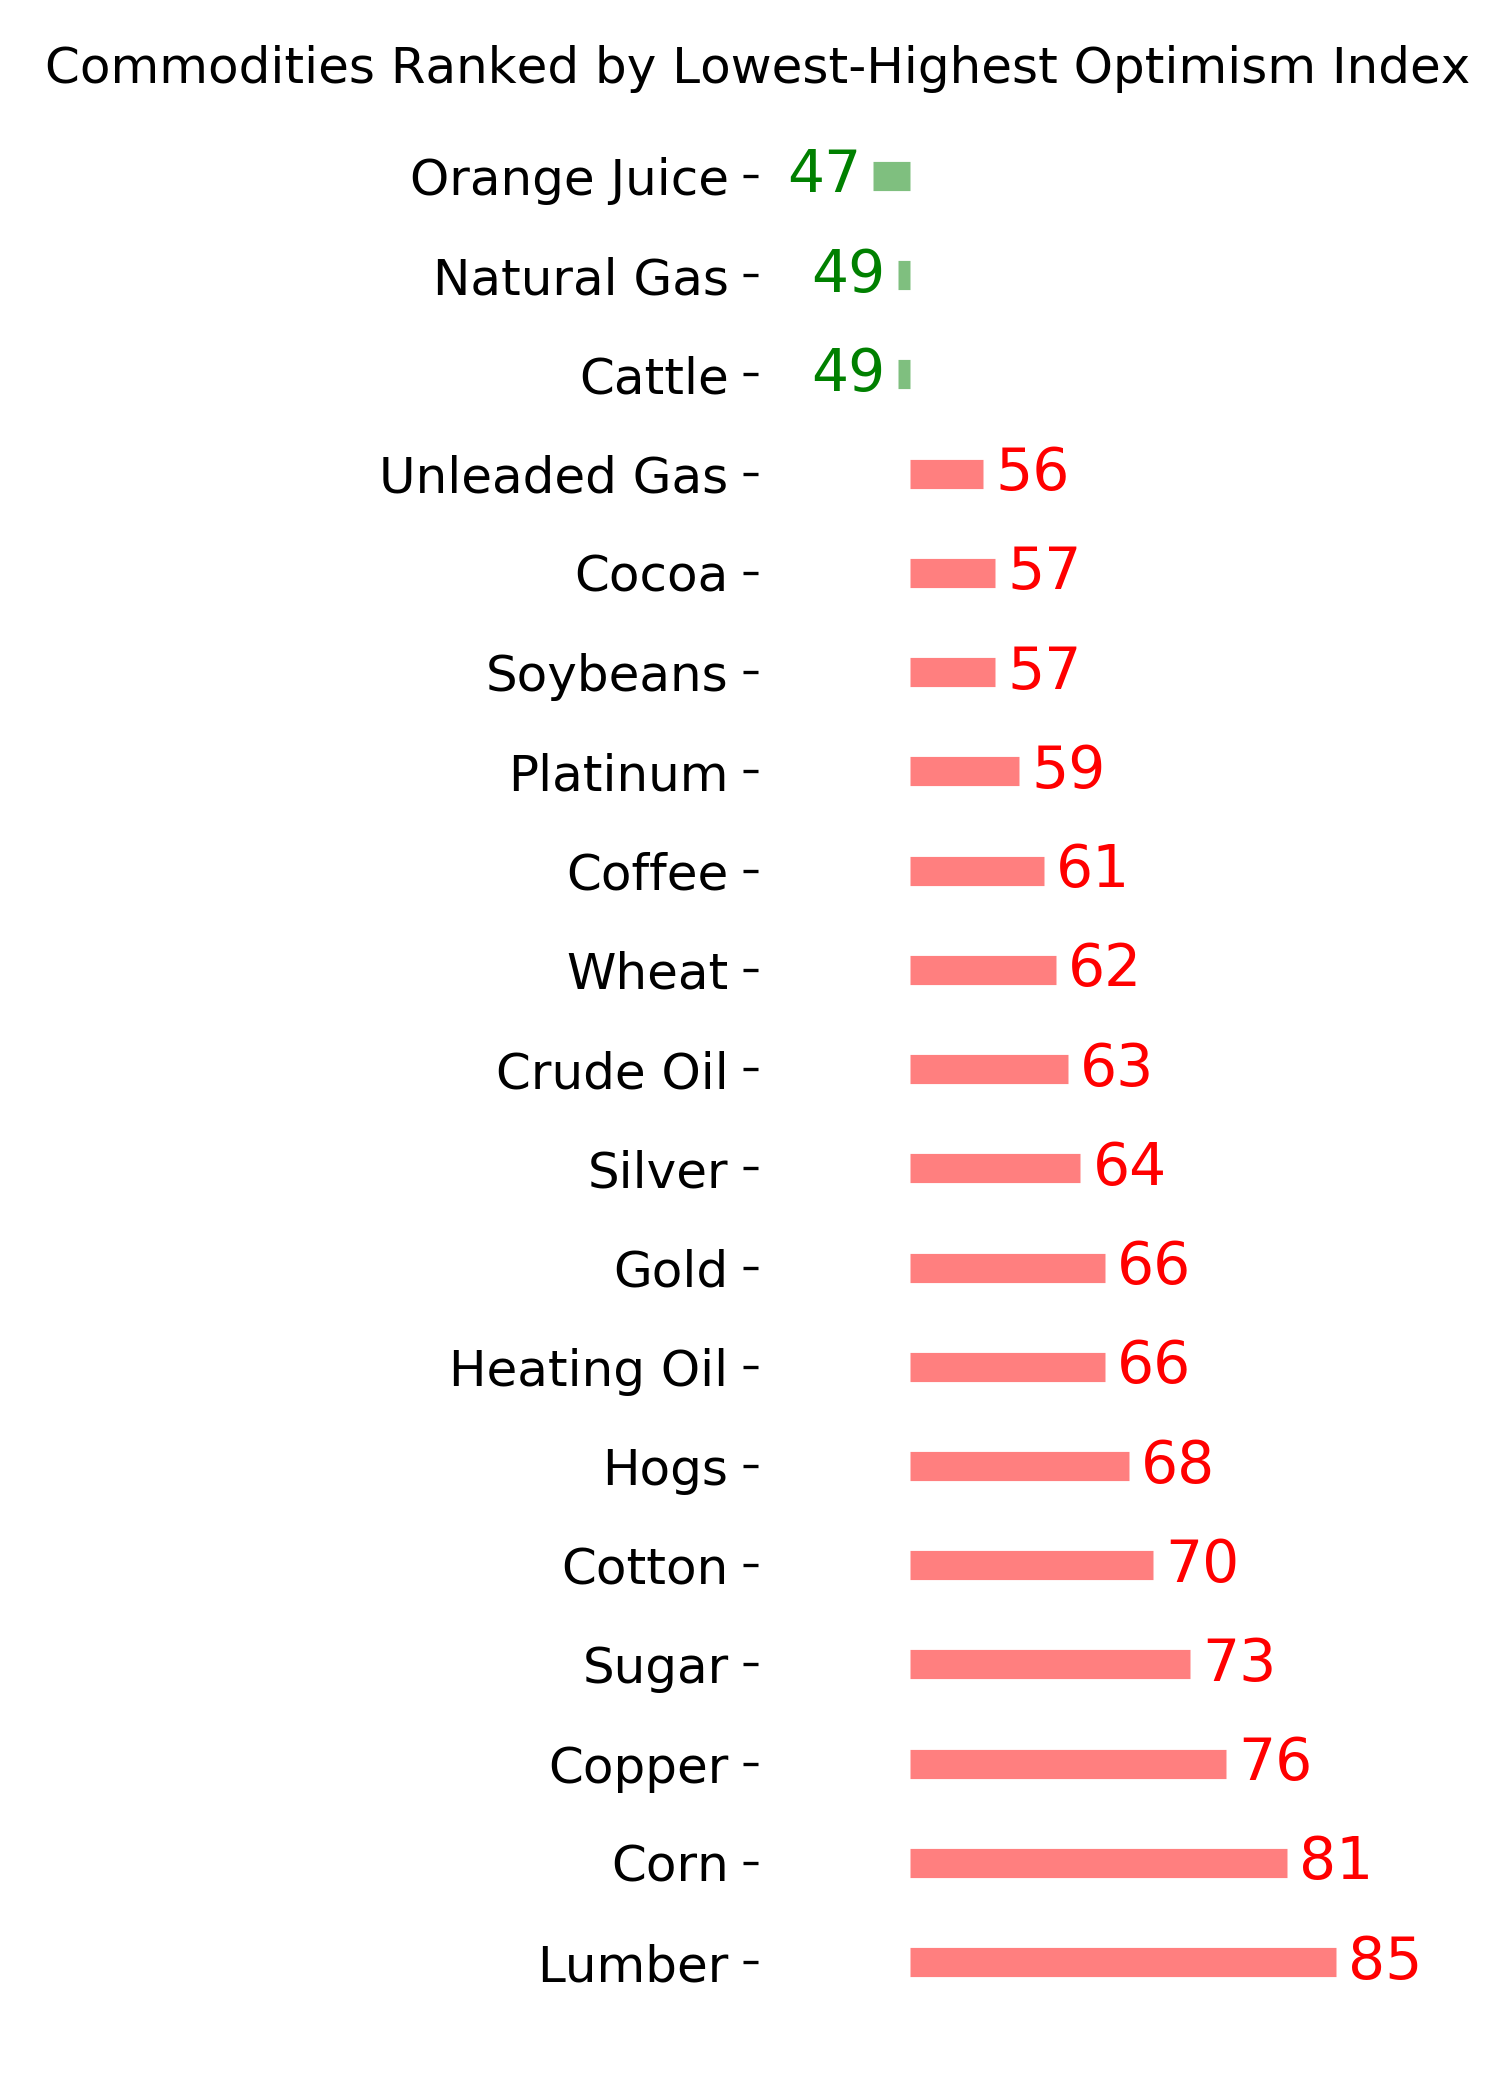
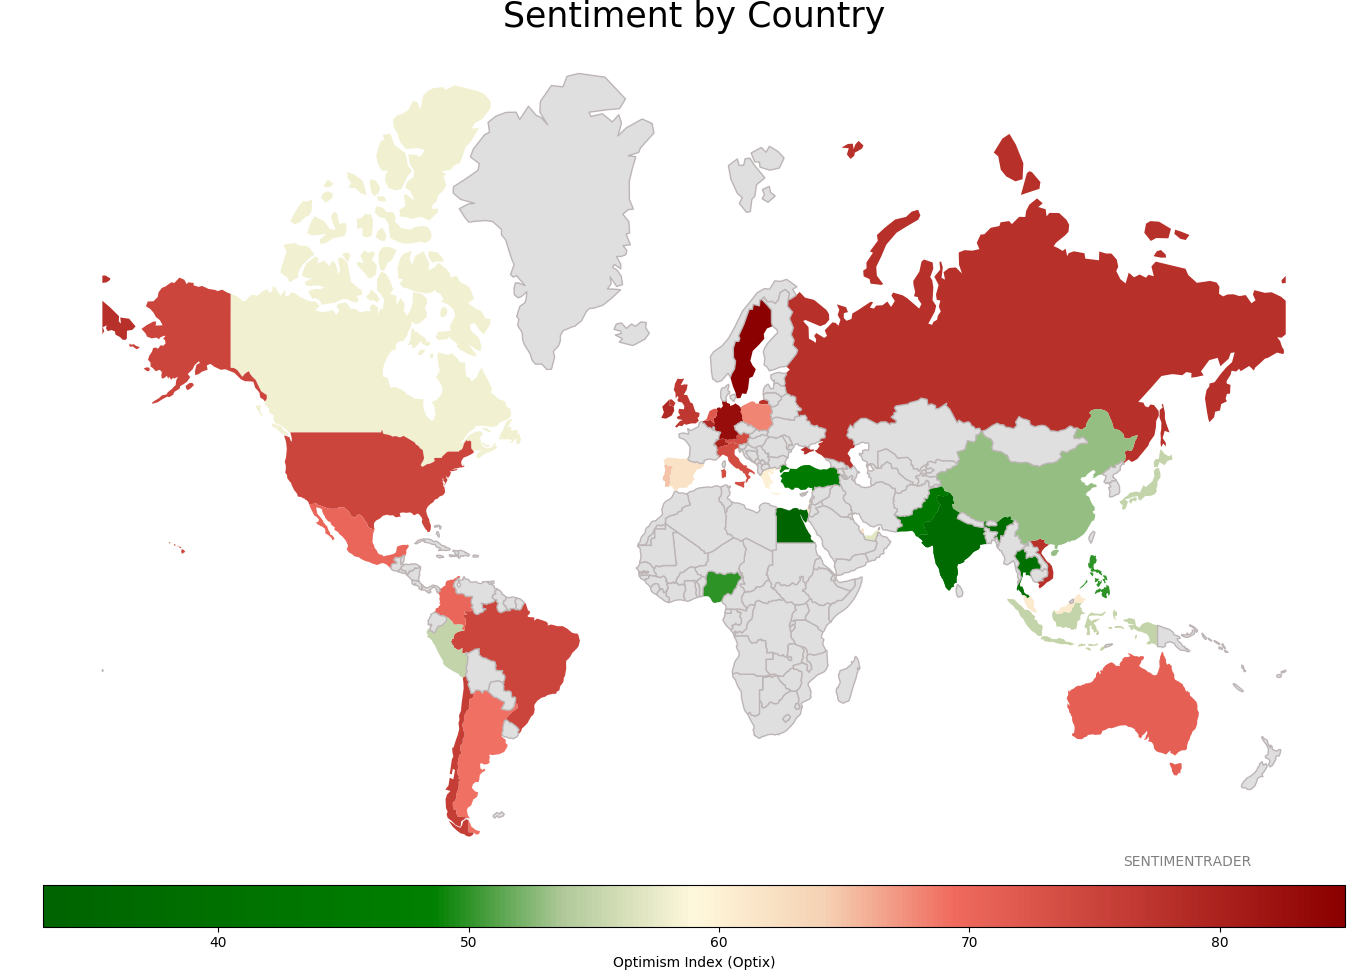
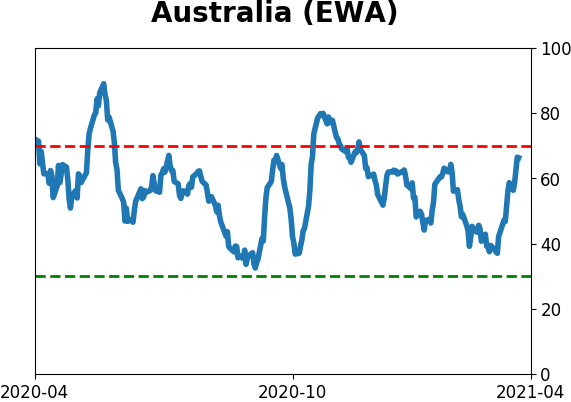
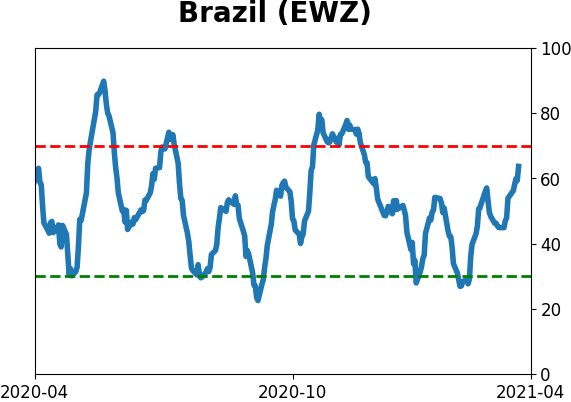
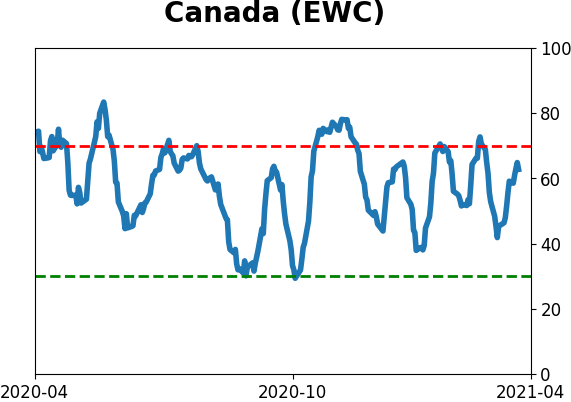
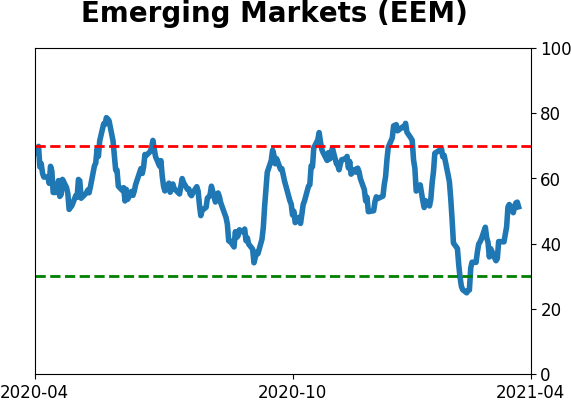
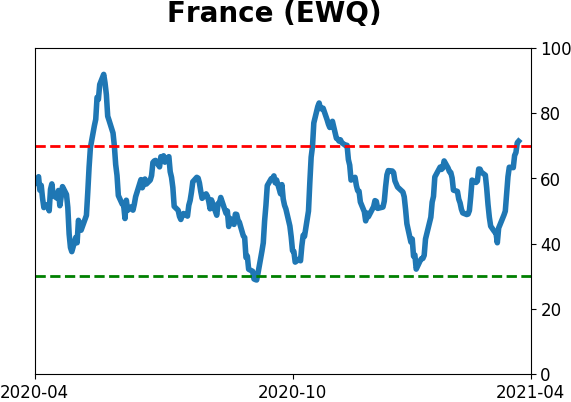
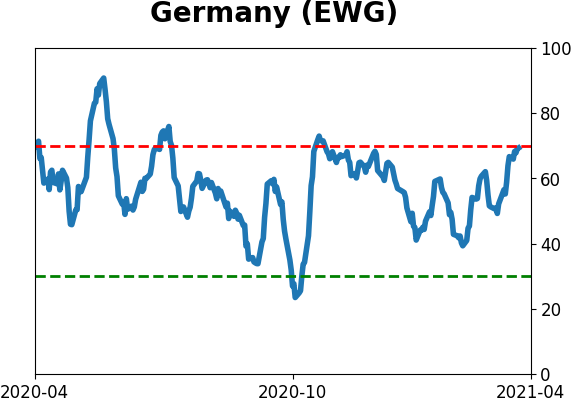
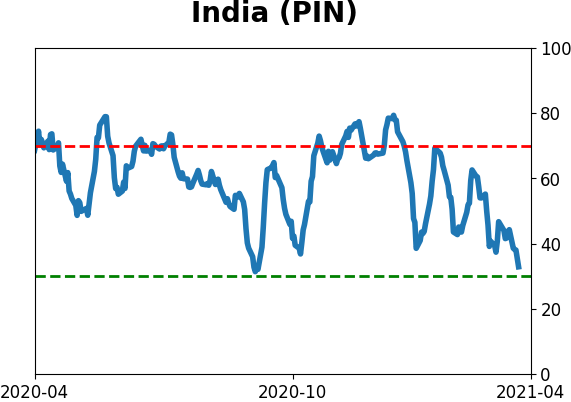
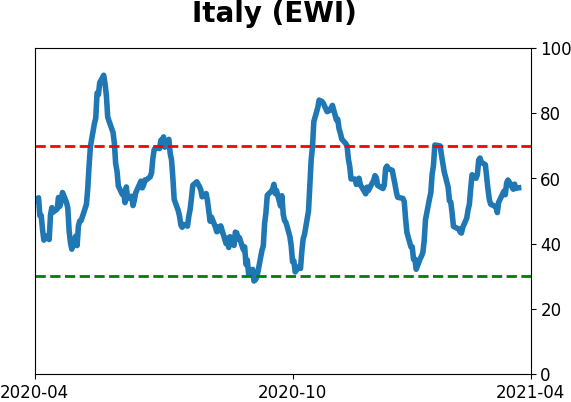
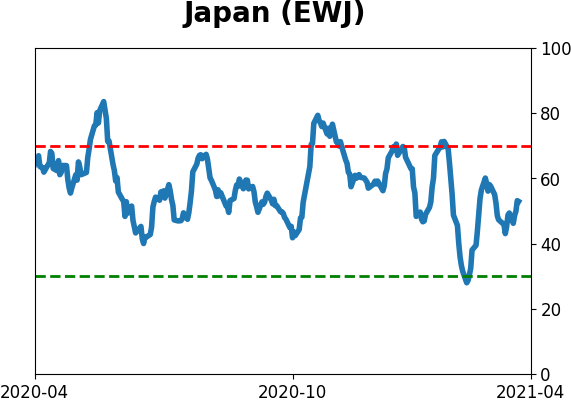
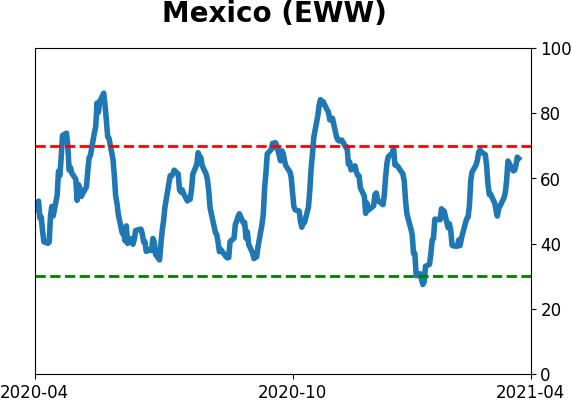
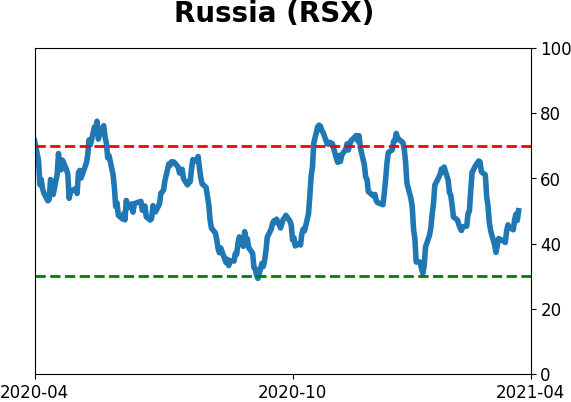
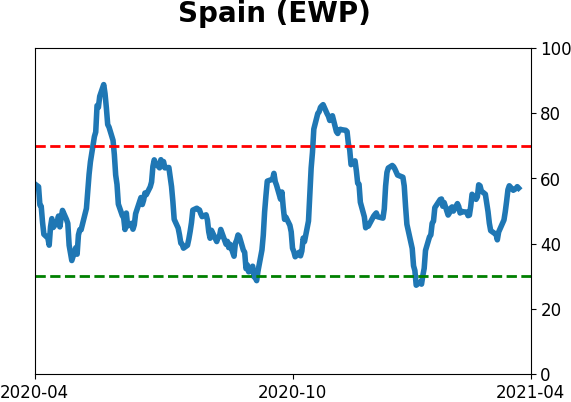
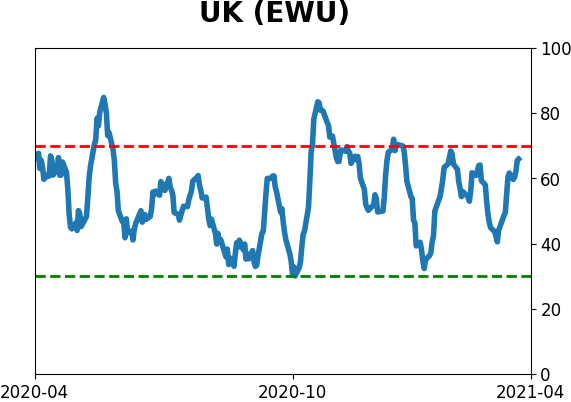
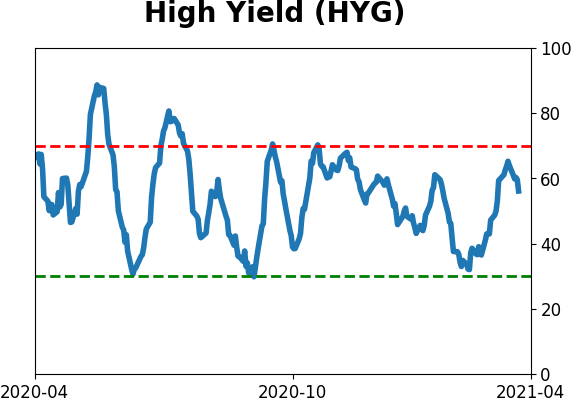
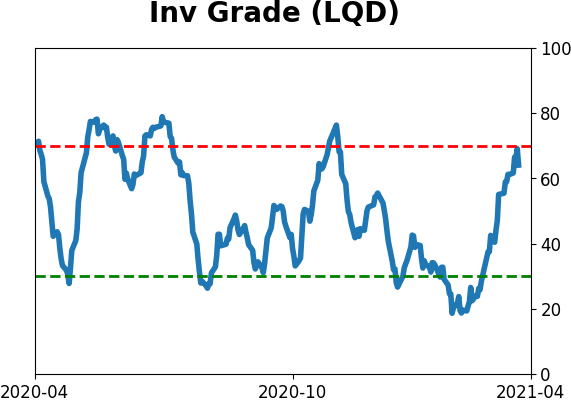
Sentiment Around The World
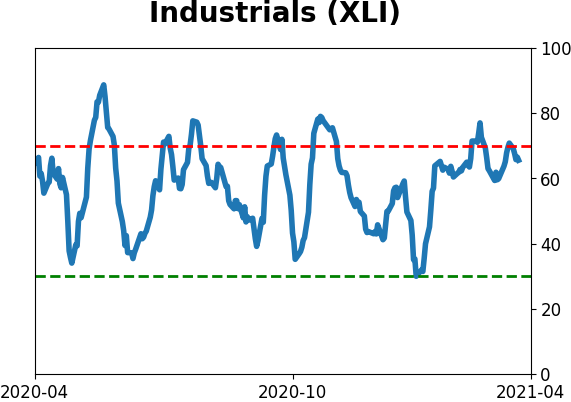
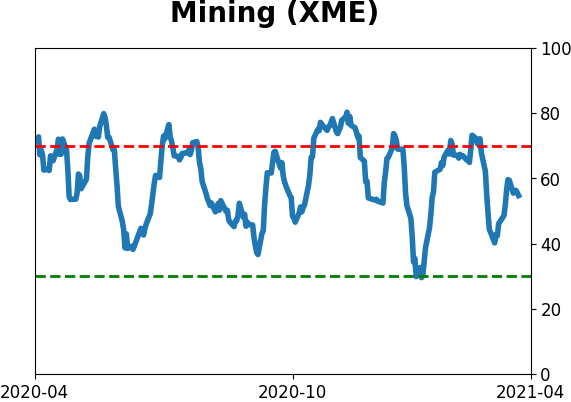
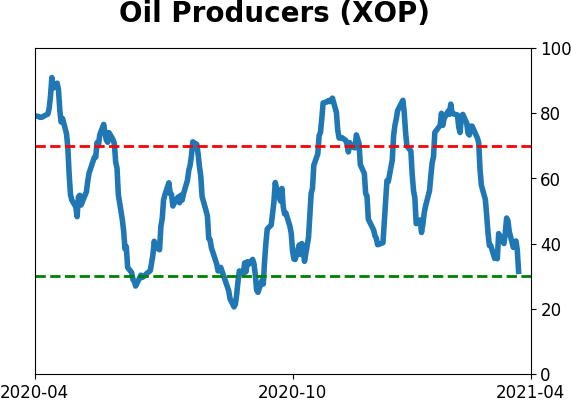
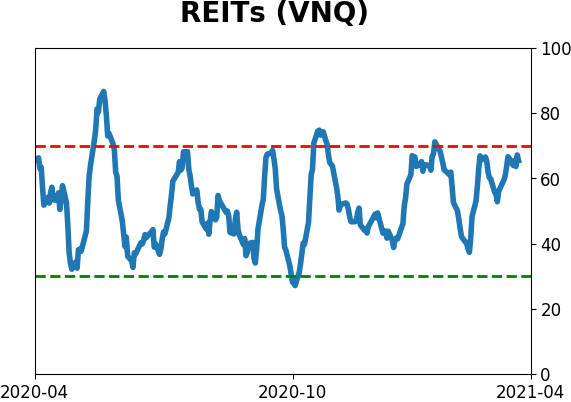
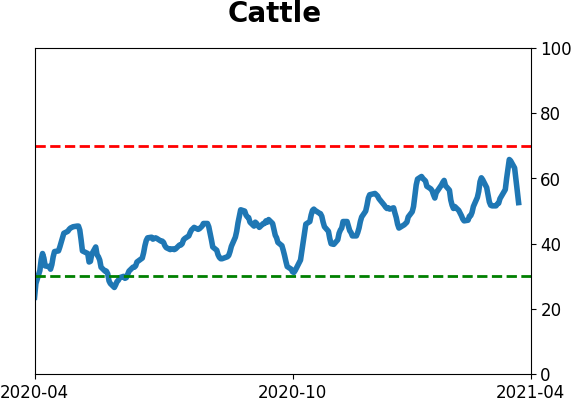
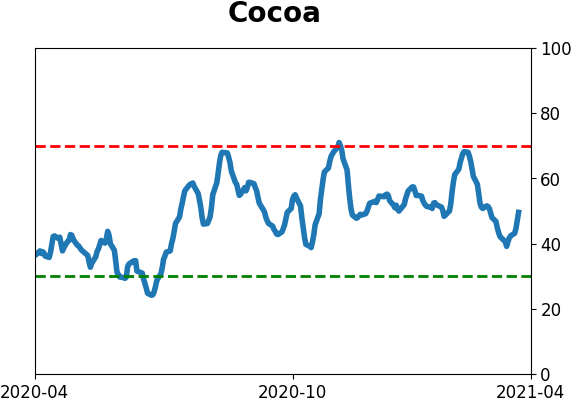
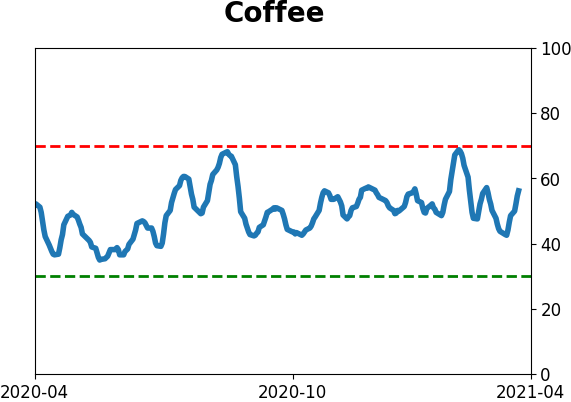
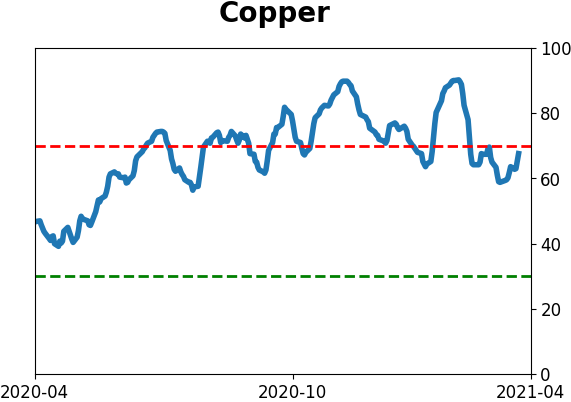
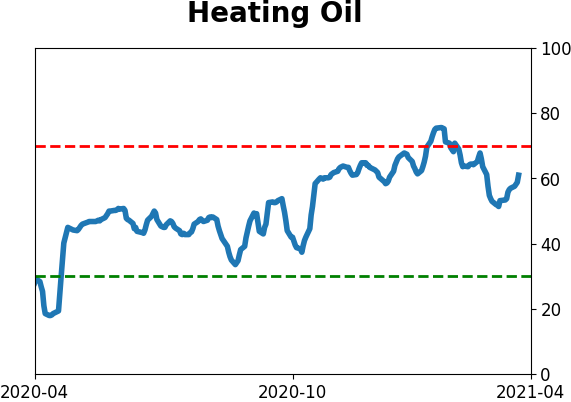
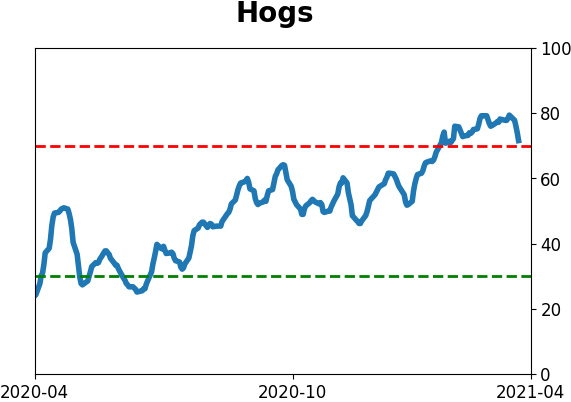
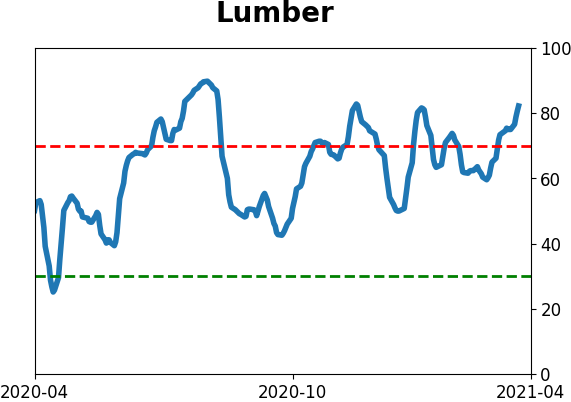
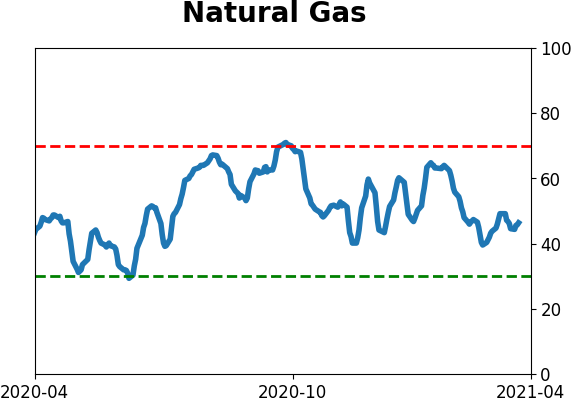
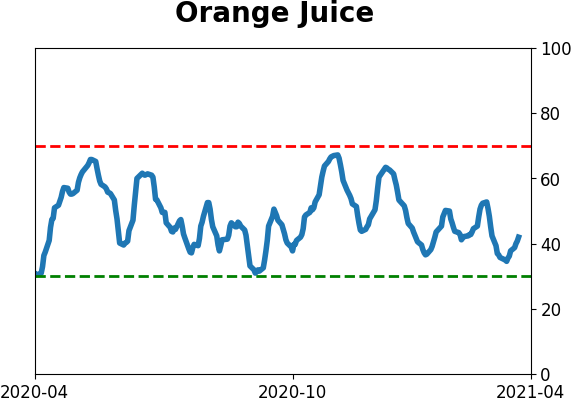
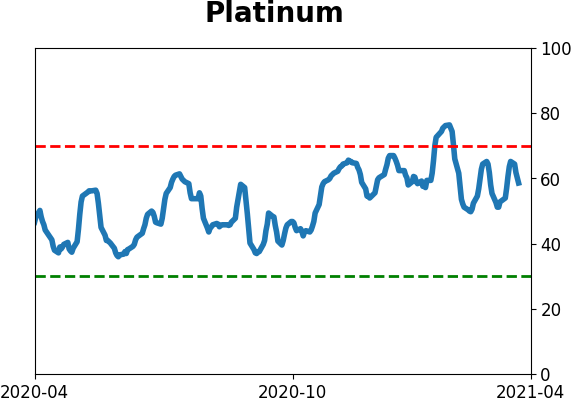
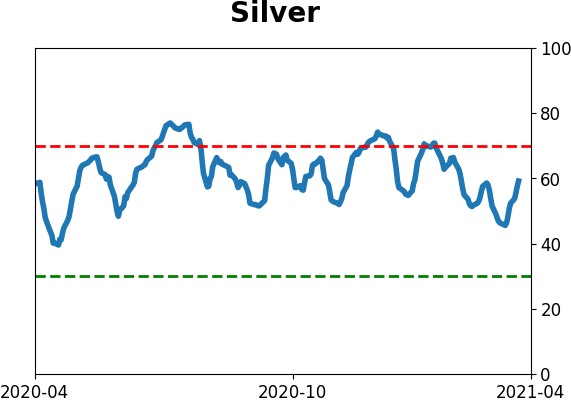
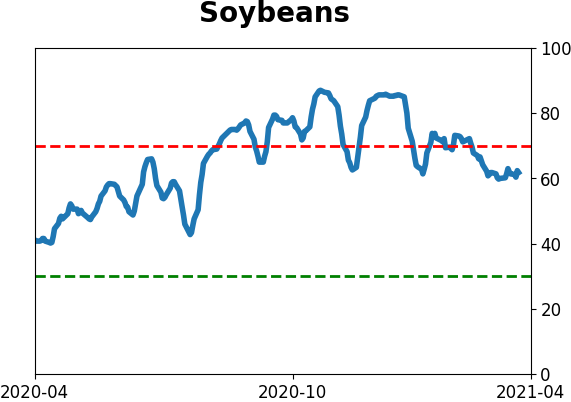
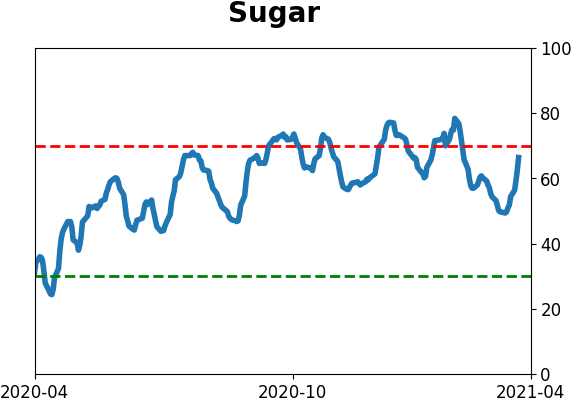
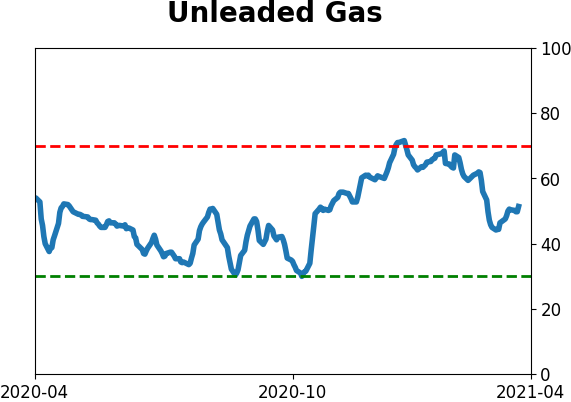
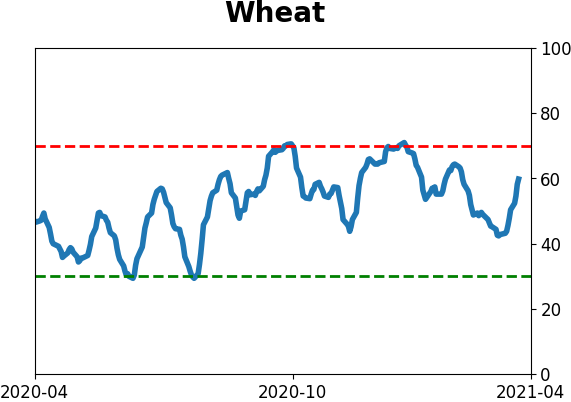
Optimism Index Thumbnails
|
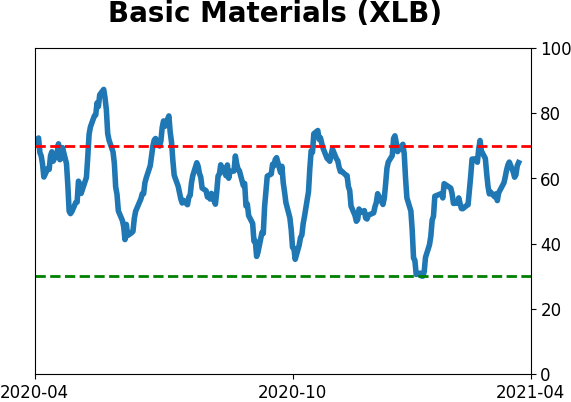
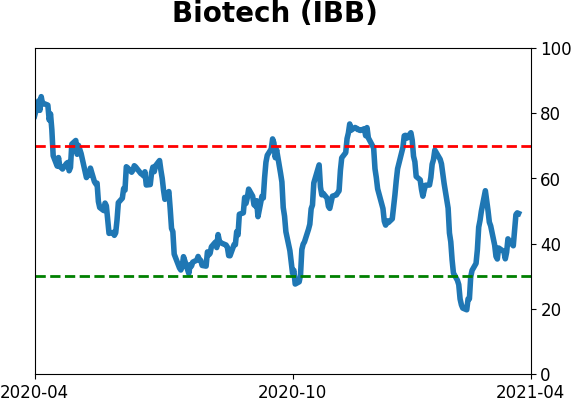
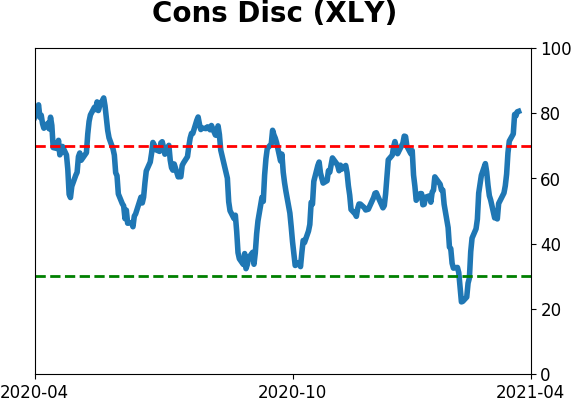
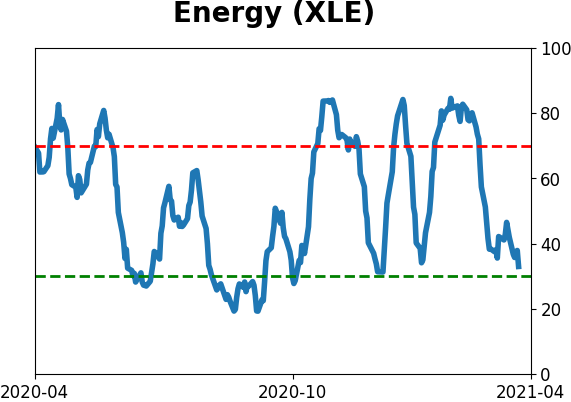
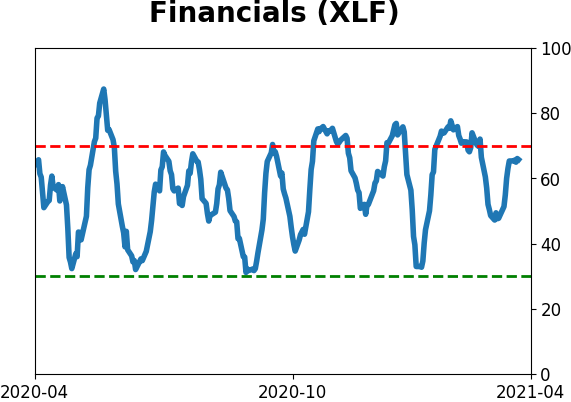
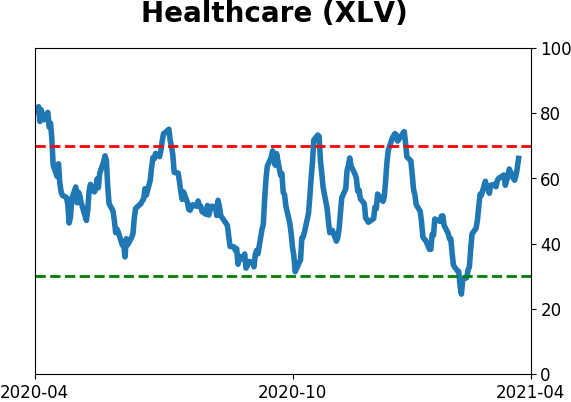
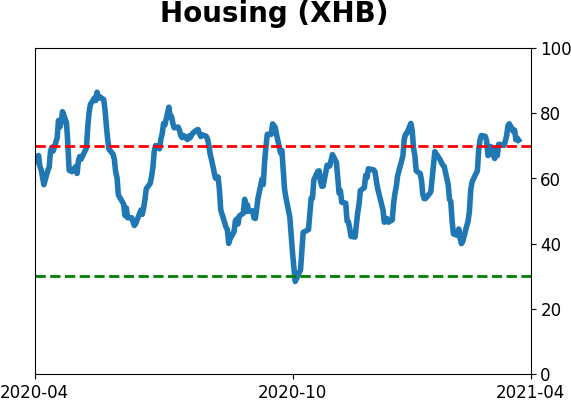
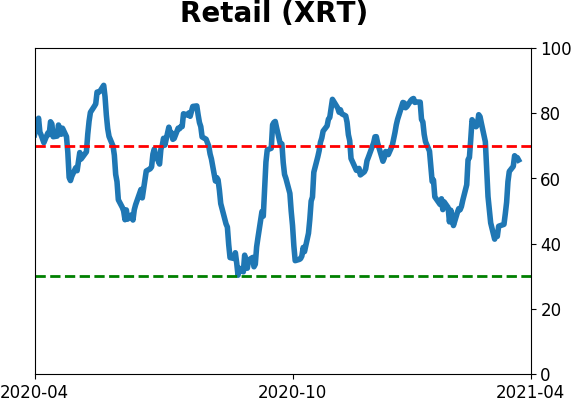
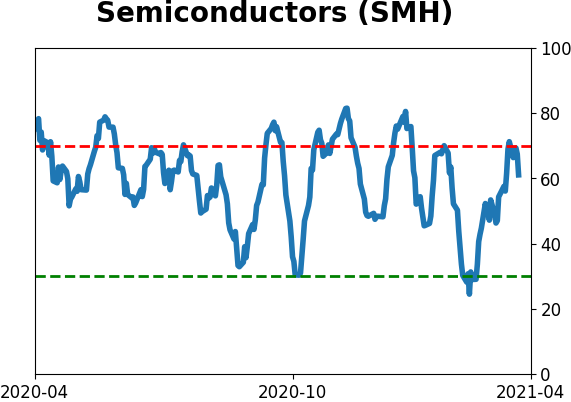
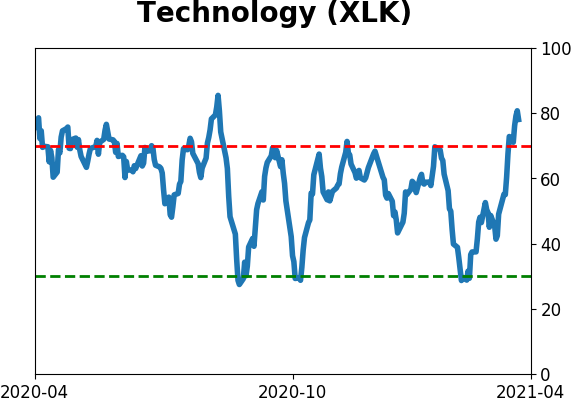
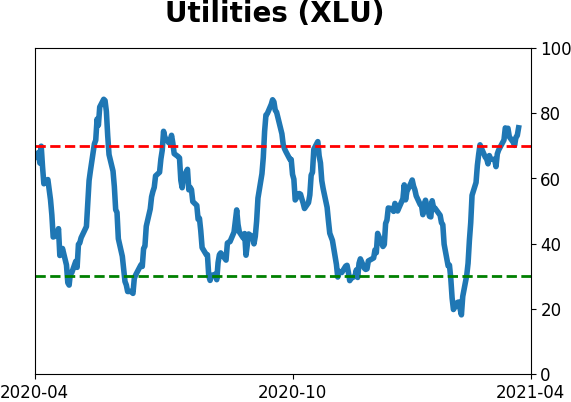
Sector ETF's - 10-Day Moving Average
|
|
|
Country ETF's - 10-Day Moving Average
|
|
|
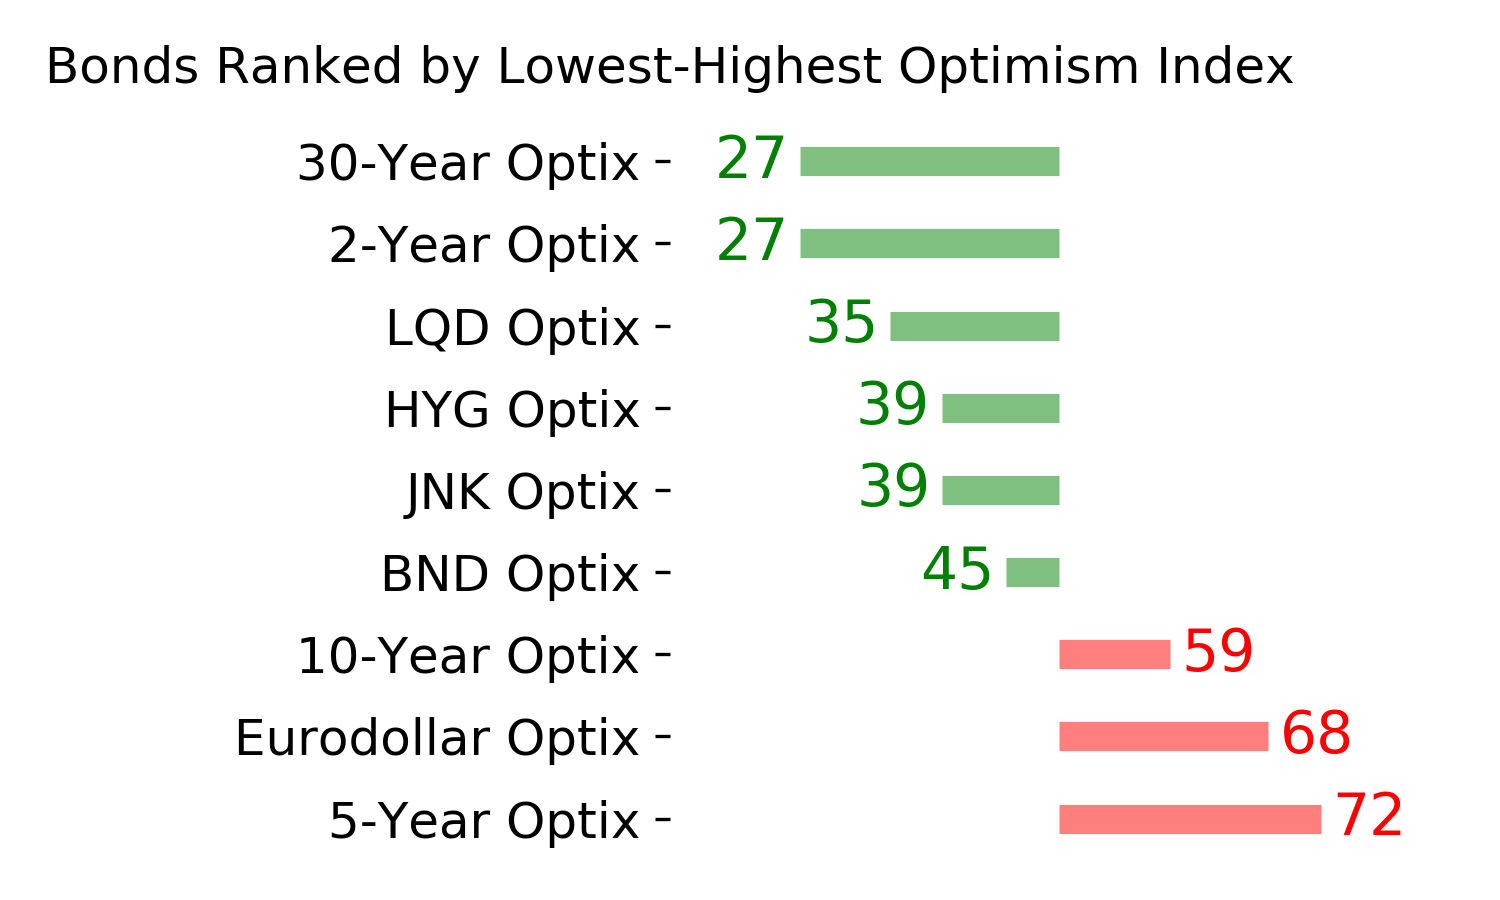
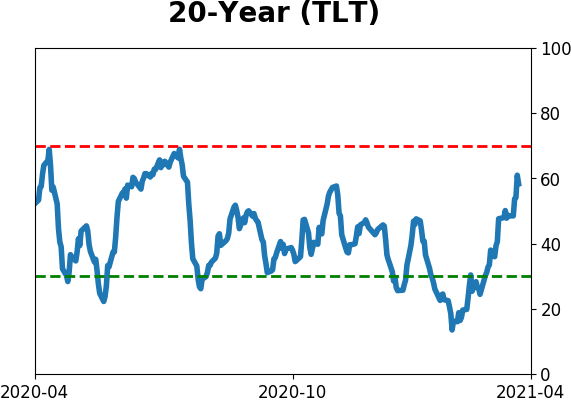
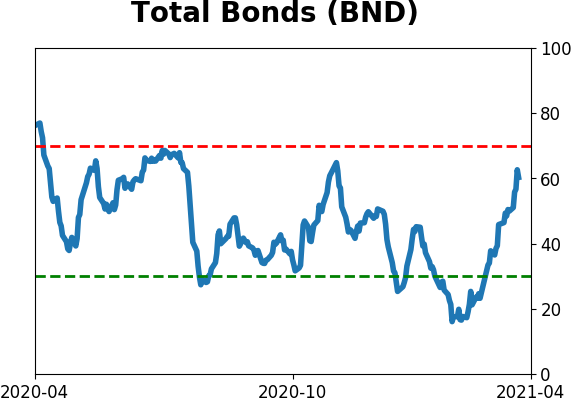
Bond ETF's - 10-Day Moving Average
|
|
|
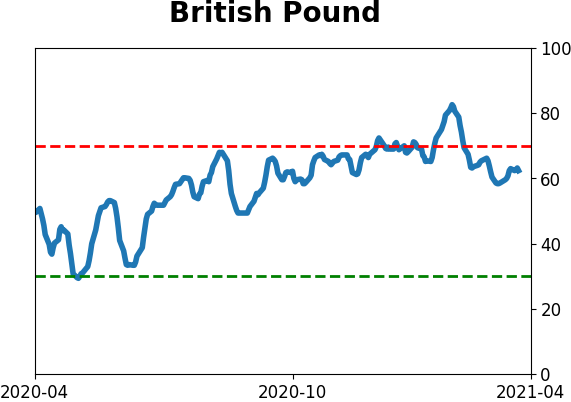
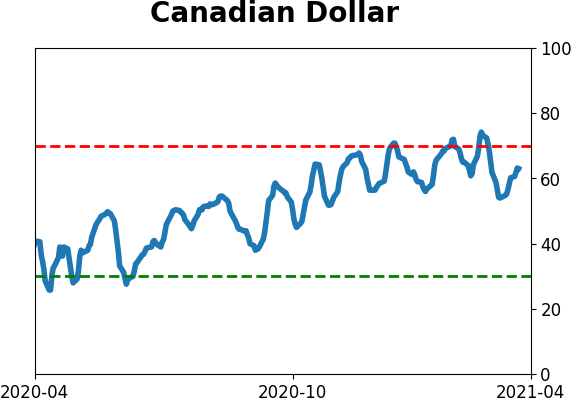
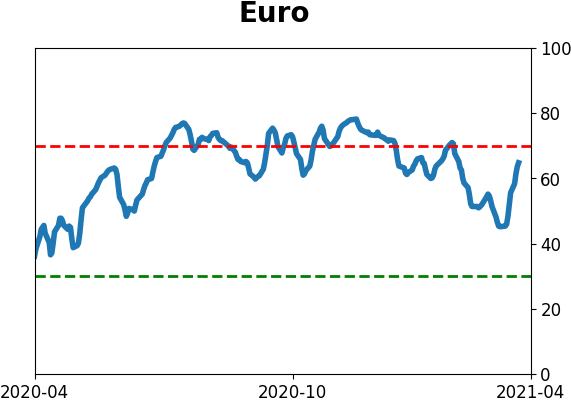
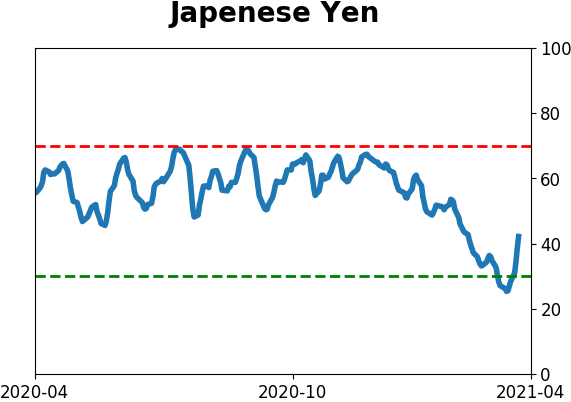
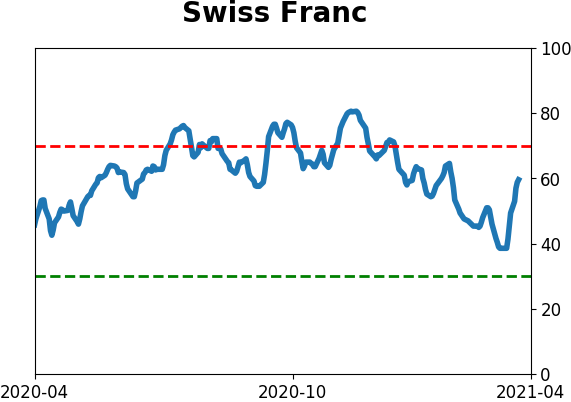
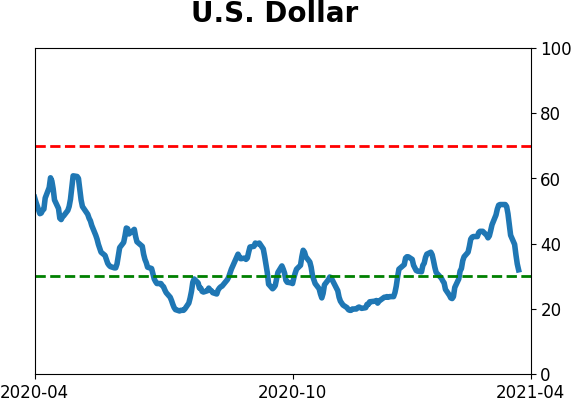
Currency ETF's - 5-Day Moving Average
|
|
|
Commodity ETF's - 5-Day Moving Average
|
|