Headlines
|
|
Like Tech Stocks, Small-Caps Plunge to Relative Lows:
A ratio of Small-Cap stocks to the S&P 500 has slipped to a multi-month low, within days of the S&P being at a record high. Since 1928, similar behavior tended to lead to Small-Caps stocks continuing to underperform the S&P.
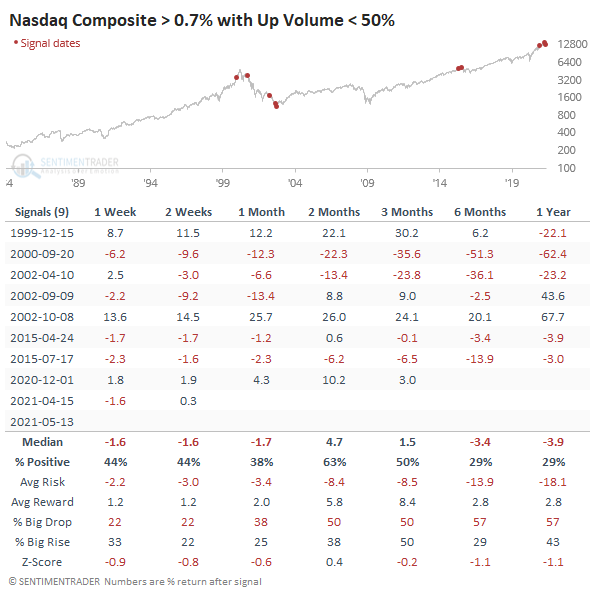
Big day, bad volume: Traders enjoyed a bit of a relief rally, at least in the indexes. The Nasdaq Composite jumped more than 0.7%, yet only 41% of volume flowed into advancing stocks on the Nasdaq. That's the worst Up Volume Ratio since at least 1984 for such a big up day in the Composite. Other times it rallied this much with more volume in declining than advancing stocks, it tended to pull back.
Bottom Line:
See the Outlook & Allocations page for more details on these summaries STOCKS: Weak sell
The speculative frenzy in February is getting wrung out. Internal dynamics have mostly held up, with some recent exceptions. Most of our studies show a poor risk/reward over the short- to medium-term, with a more positive skew longer-term. BONDS: Hold
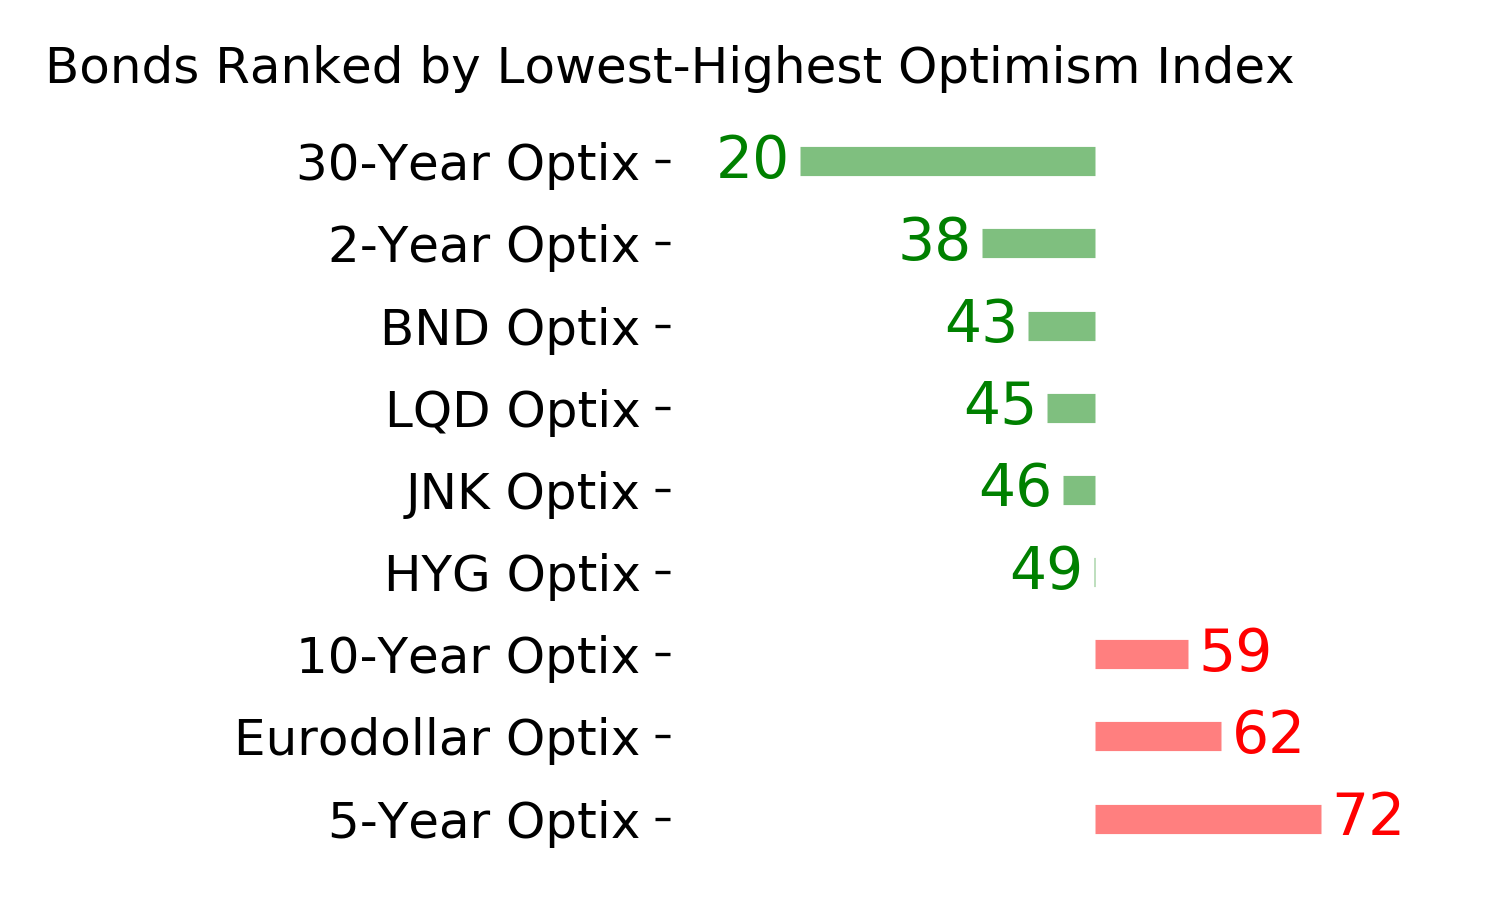
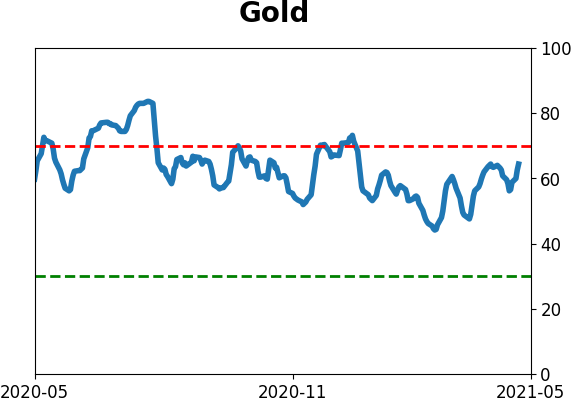
Various parts of the market got hit in March, with the lowest Bond Optimism Index we usually see during healthy environments. After a shaky couple of weeks, the broad bond market has modestly recovered. Not a big edge here either way. GOLD: Weak buy
The dollar keeps failing on bulls' hopes that it's finally going to turn a corner, so that's been good for gold and miners. Studies from recent months remain in effect, with a modest positive bias.
|
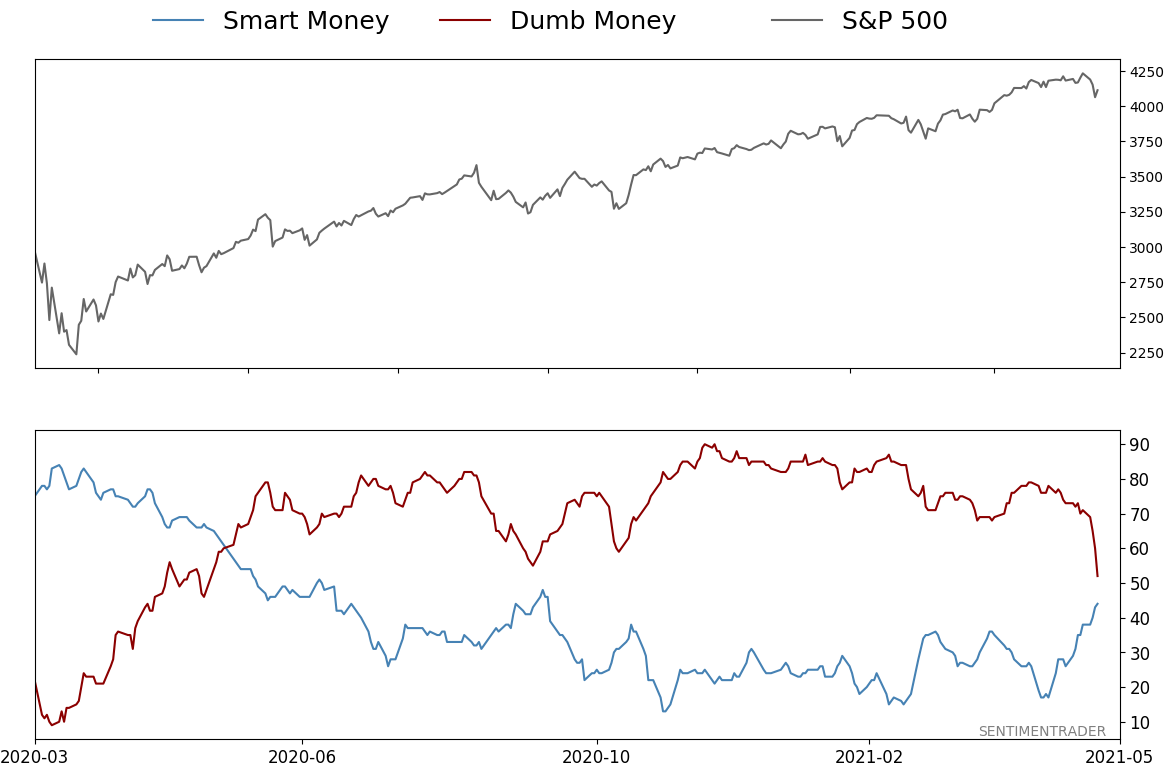
Smart / Dumb Money Confidence
|
Smart Money Confidence: 44%
Dumb Money Confidence: 52%
|
|
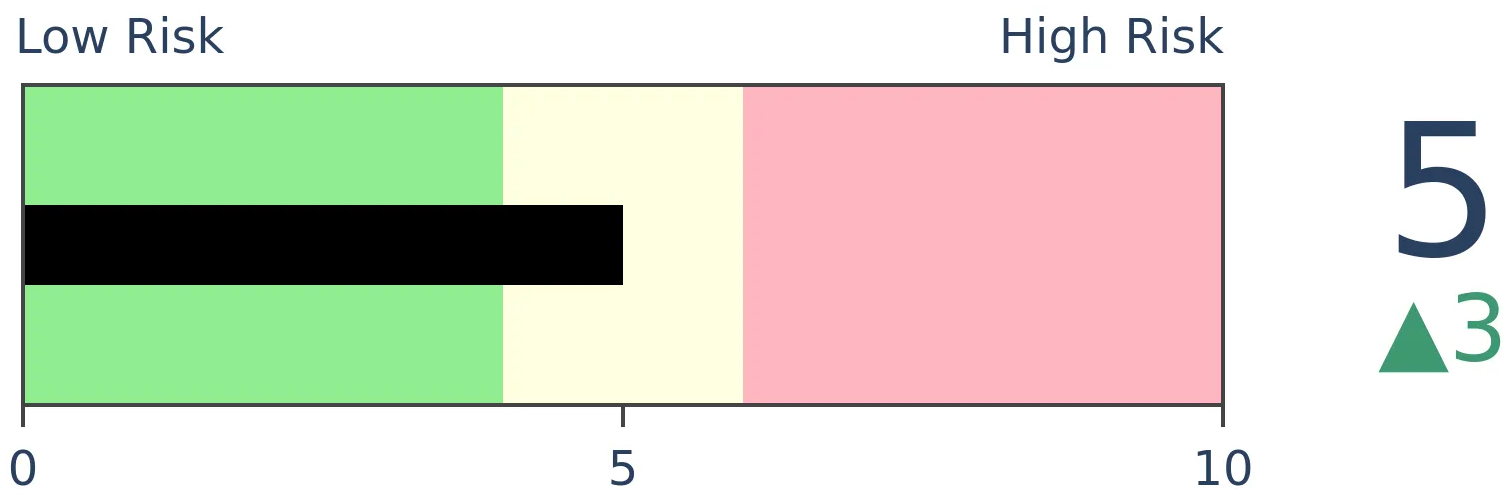
Risk Levels
Stocks Short-Term
|
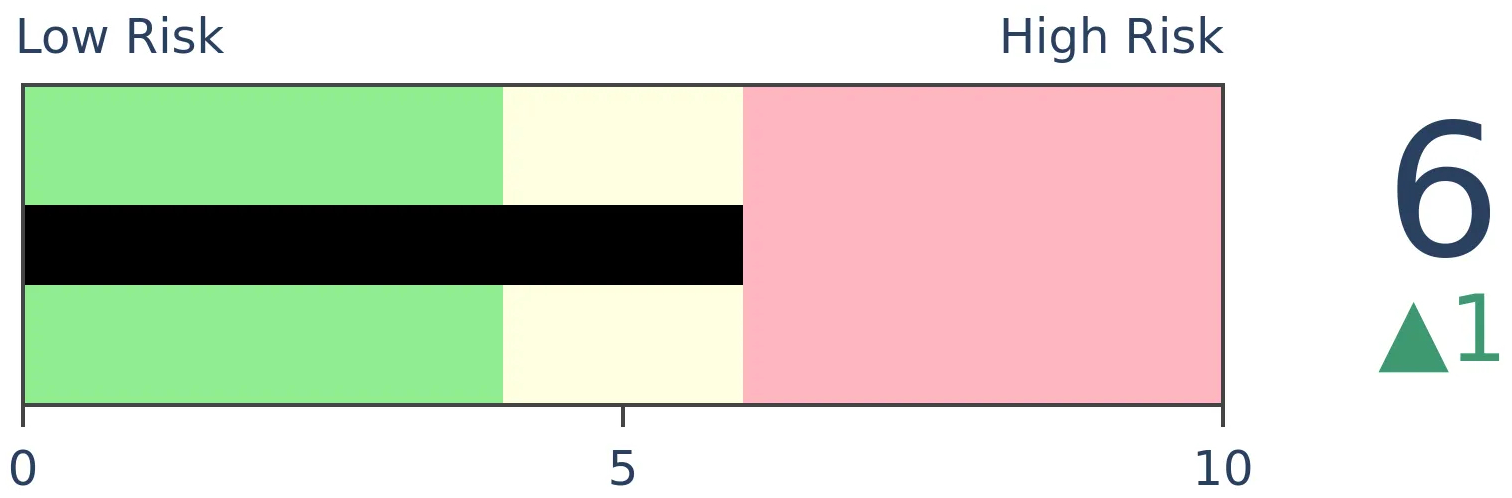
Stocks Medium-Term

|
|
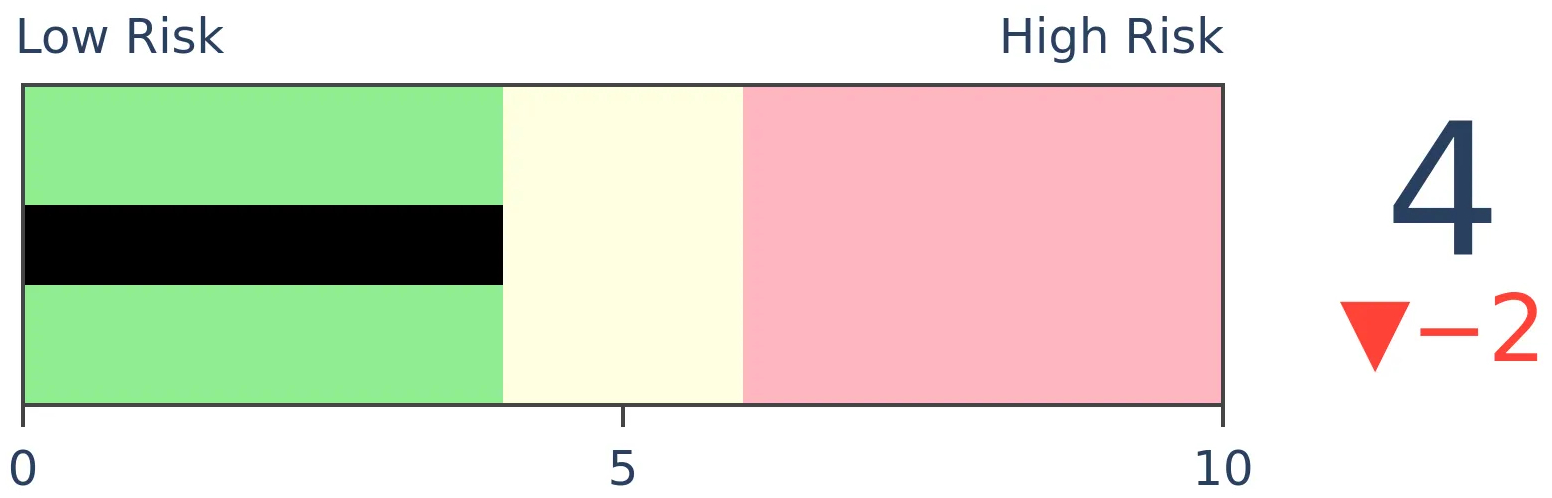
Bonds
|
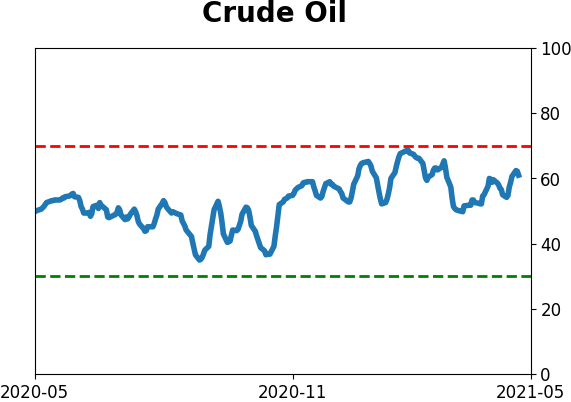
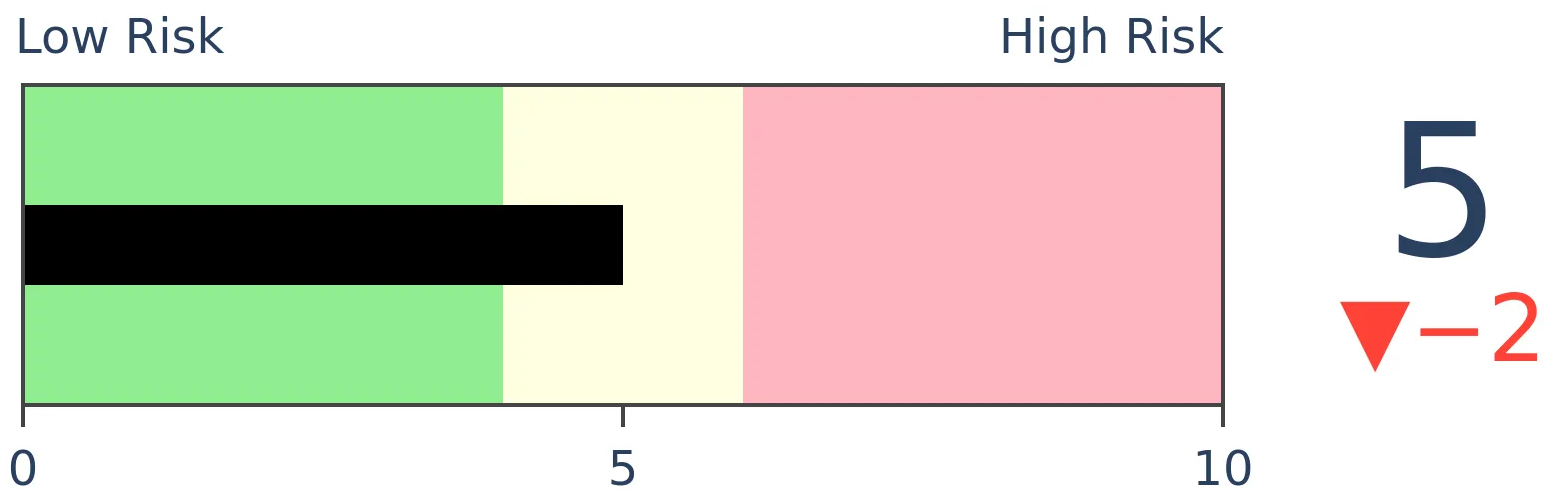
Crude Oil
|
|
Gold

|
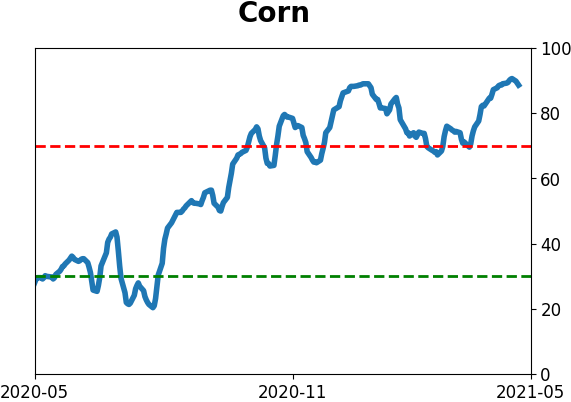
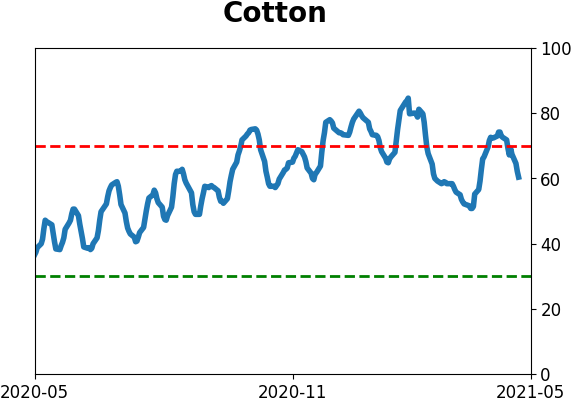
Agriculture
|
|
Research
BOTTOM LINE
A ratio of Small-Cap stocks to the S&P 500 has slipped to a multi-month low, within days of the S&P being at a record high. Since 1928, similar behavior tended to lead to Small-Caps stocks continuing to underperform the S&P.
FORECAST / TIMEFRAME
None
|
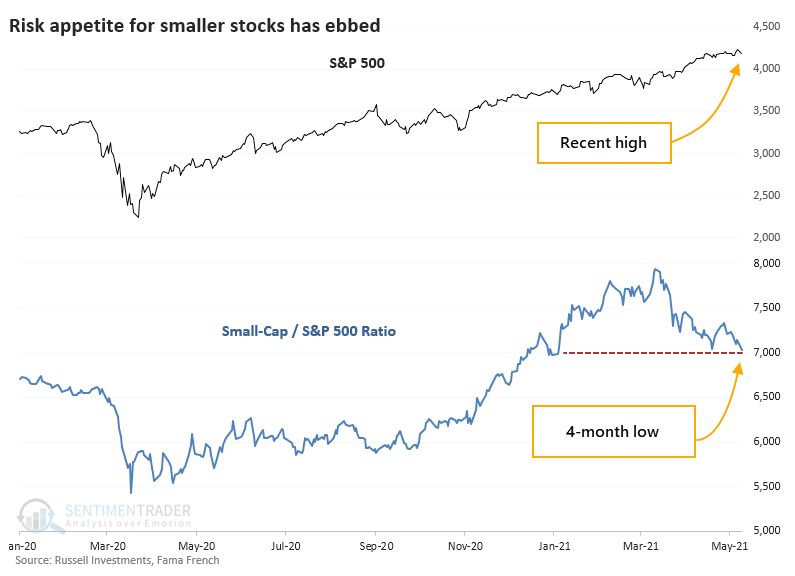
Tech stocks have been struggling. Another area of risk appetite, Small-Cap stocks, have struggled right along with them.
On Wednesday, we saw that the ratio of the Tech sector to the S&P 500 has sunk to nearly its lowest level in a year. While not as extreme, a ratio of Small-Cap stocks to the S&P has just dropped to a 4-month low.
A MEDIOCRE MEDIUM-TERM SIGN
This is a quick pullback in the appetite for riskier, or at least higher-beta, stocks - headlines were trumpeting all-time highs in the S&P 500 just a few days ago.
Other times when the S&P was recently at a 52-week high, then the ratio of Small-Cap stocks to the S&P plunged to at least a 4-month low, it preceded returns about in line with random for the S&P. Its returns were mediocre over the short- to medium-term with risk that was higher than reward up to 3 months later.
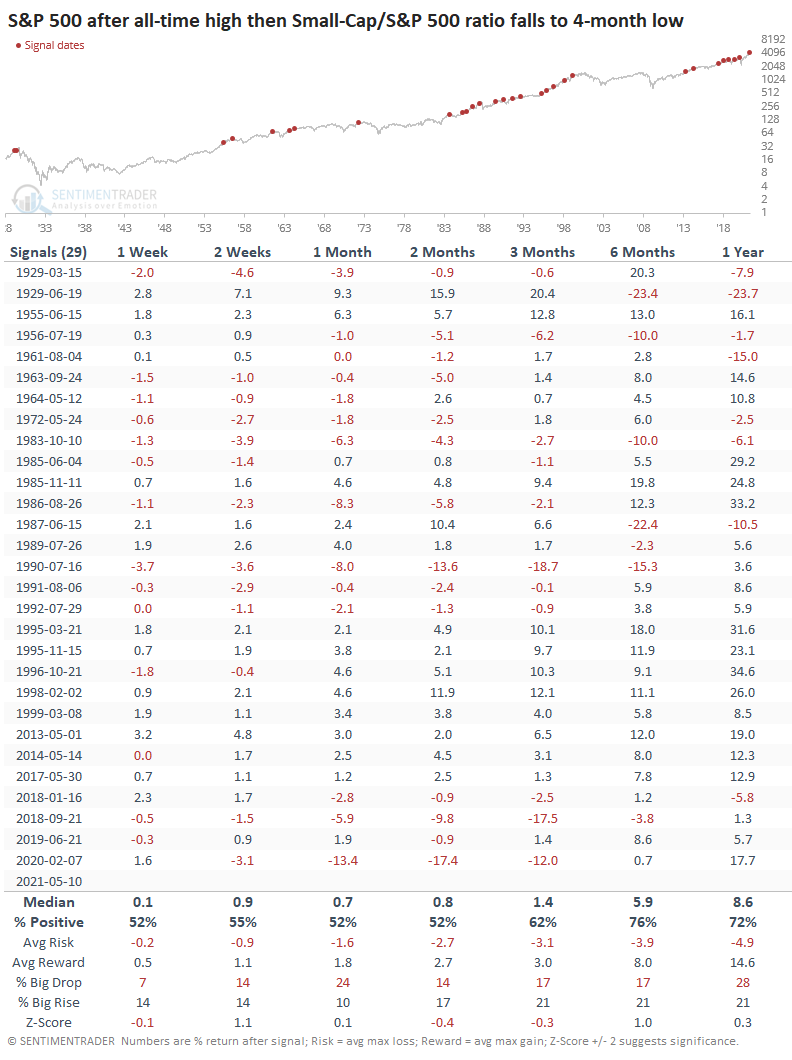
Over the past 30 years, there was less of a tendency to see weakness, especially over the next 6-12 months. But the last 4 signals all preceded losses over the medium-term.
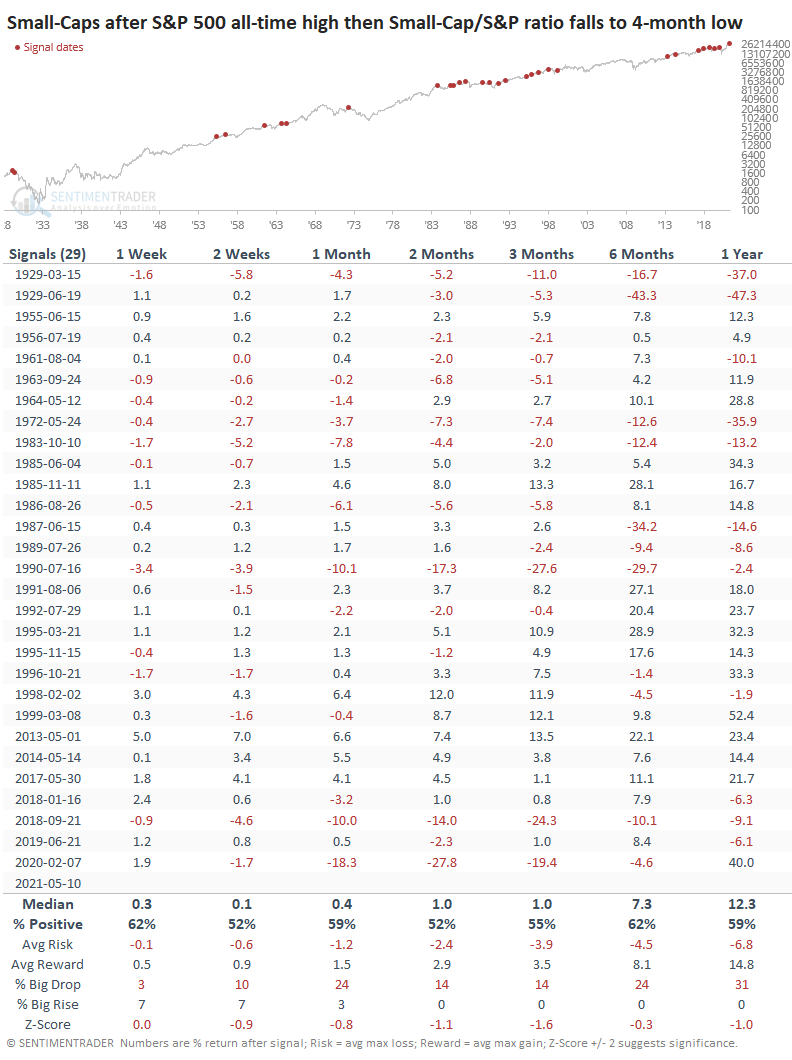
For Small-Cap stocks, it was a similar story but with modestly weaker returns.
SMALL-CAP RELATIVE WEAKNESS CONTINUED
Like we saw with Tech stocks, this relative weakness in Small-Caps suggested that the trend would continue. The ratio between the two kept sinking in the months ahead.
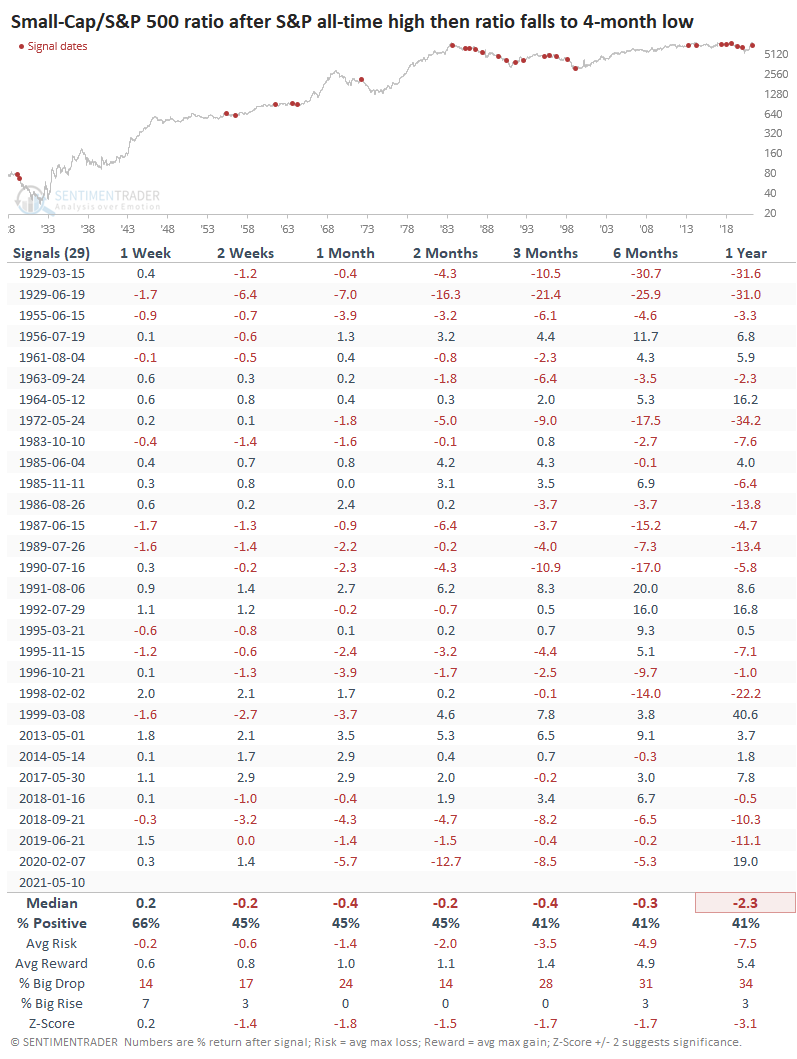
Across almost all time frames, Small-Cap stocks continued to underperform their larger-capitalized siblings. Over the past 30 years, the only time that Small-Caps completely reversed course and resumed strong leadership was in 2013. The other 11 signals all preceded either losses or minimal gains in this ratio.
At some point, we'll likely see some oversold types of indications in these stocks, either on an absolute basis or relative to other indexes. There aren't many signs of that yet.
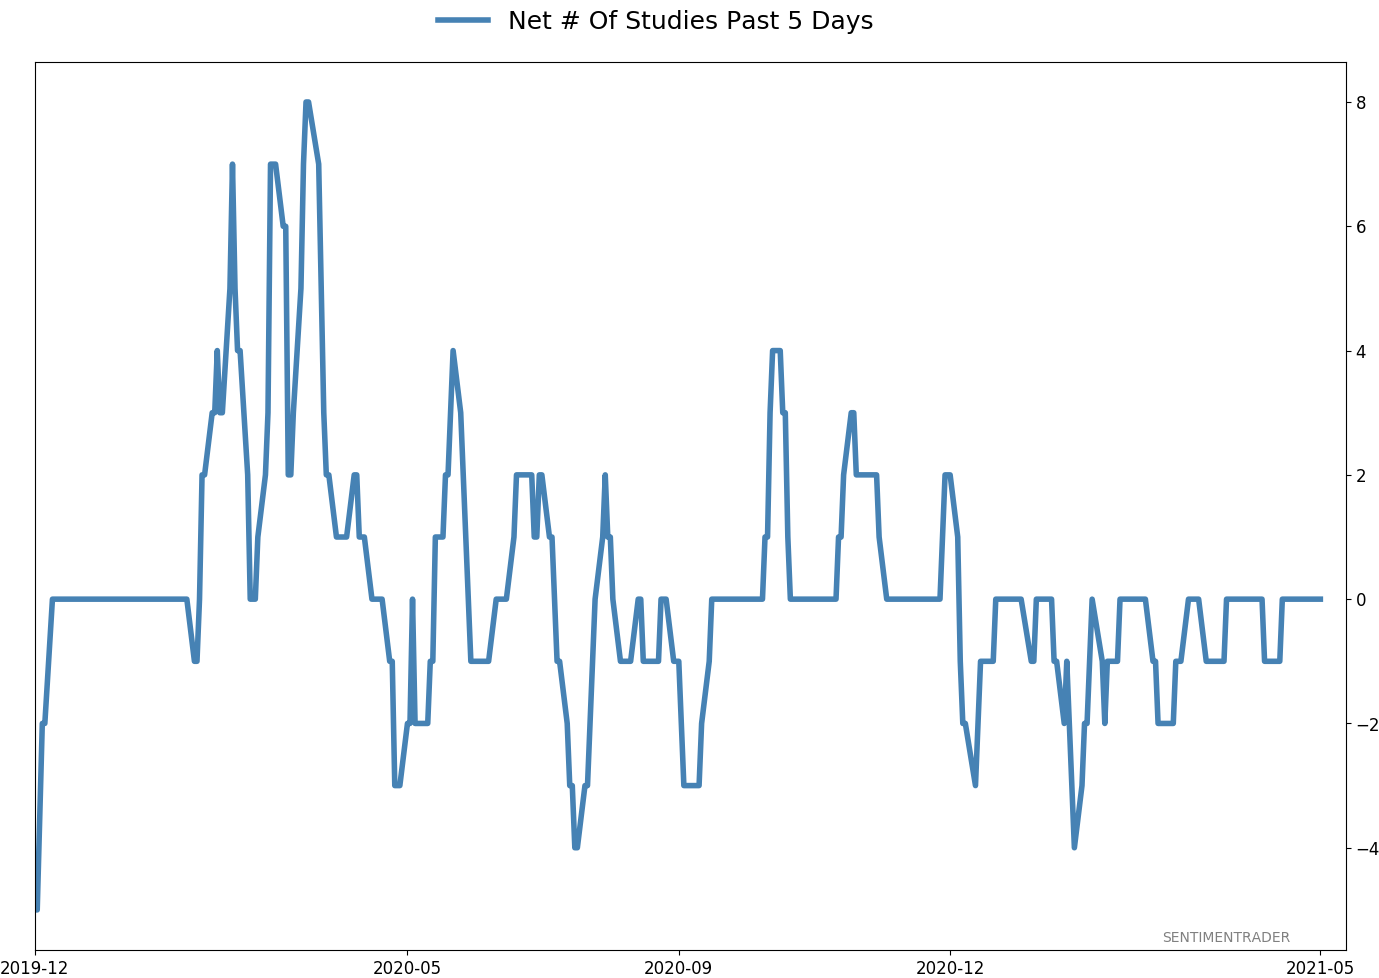
Active Studies
| Time Frame | Bullish | Bearish | | Short-Term | 0 | 0 | | Medium-Term | 1 | 11 | | Long-Term | 11 | 4 |
|
Indicators at Extremes
Portfolio
| Position | Description | Weight % | Added / Reduced | Date | | Stocks | RSP | 0.0 | Reduced 4.9% | 2021-04-22 | | Bonds | 30.0% BND, 8.8% SCHP | 37.9 | Added 15.1% | 2021-02-18 | | Commodities | GCC | 2.5 | Reduced 2.1%
| 2020-09-04 | | Precious Metals | GDX | 9.8 | Added 0.1% | 2021-02-18 | | Special Situations | 4.3% XLE, 2.2% PSCE | 6.5 | Reduced 5.6% | 2021-04-22 | | Cash | | 43.3 | | |
|
Updates (Changes made today are underlined)
I've made no adjustments for months, as the situation remained essentially stuck - energy was doing what it should, sentiment in the broader market was ridiculously stretched but with no major warning signs, and sentiment toward gold and bonds appeared overdone on the pessimistic side. Those conditions have started to reverse a bit, so I further reduced my risk. There are still no major warning signs, but I'm getting increasingly uncomfortable and would prefer to sit safely in cash and wait for better risk/reward opportunities. RETURN YTD: 8.0% 2020: 8.1%, 2019: 12.6%, 2018: 0.6%, 2017: 3.8%, 2016: 17.1%, 2015: 9.2%, 2014: 14.5%, 2013: 2.2%, 2012: 10.8%, 2011: 16.5%, 2010: 15.3%, 2009: 23.9%, 2008: 16.2%, 2007: 7.8%
|
|
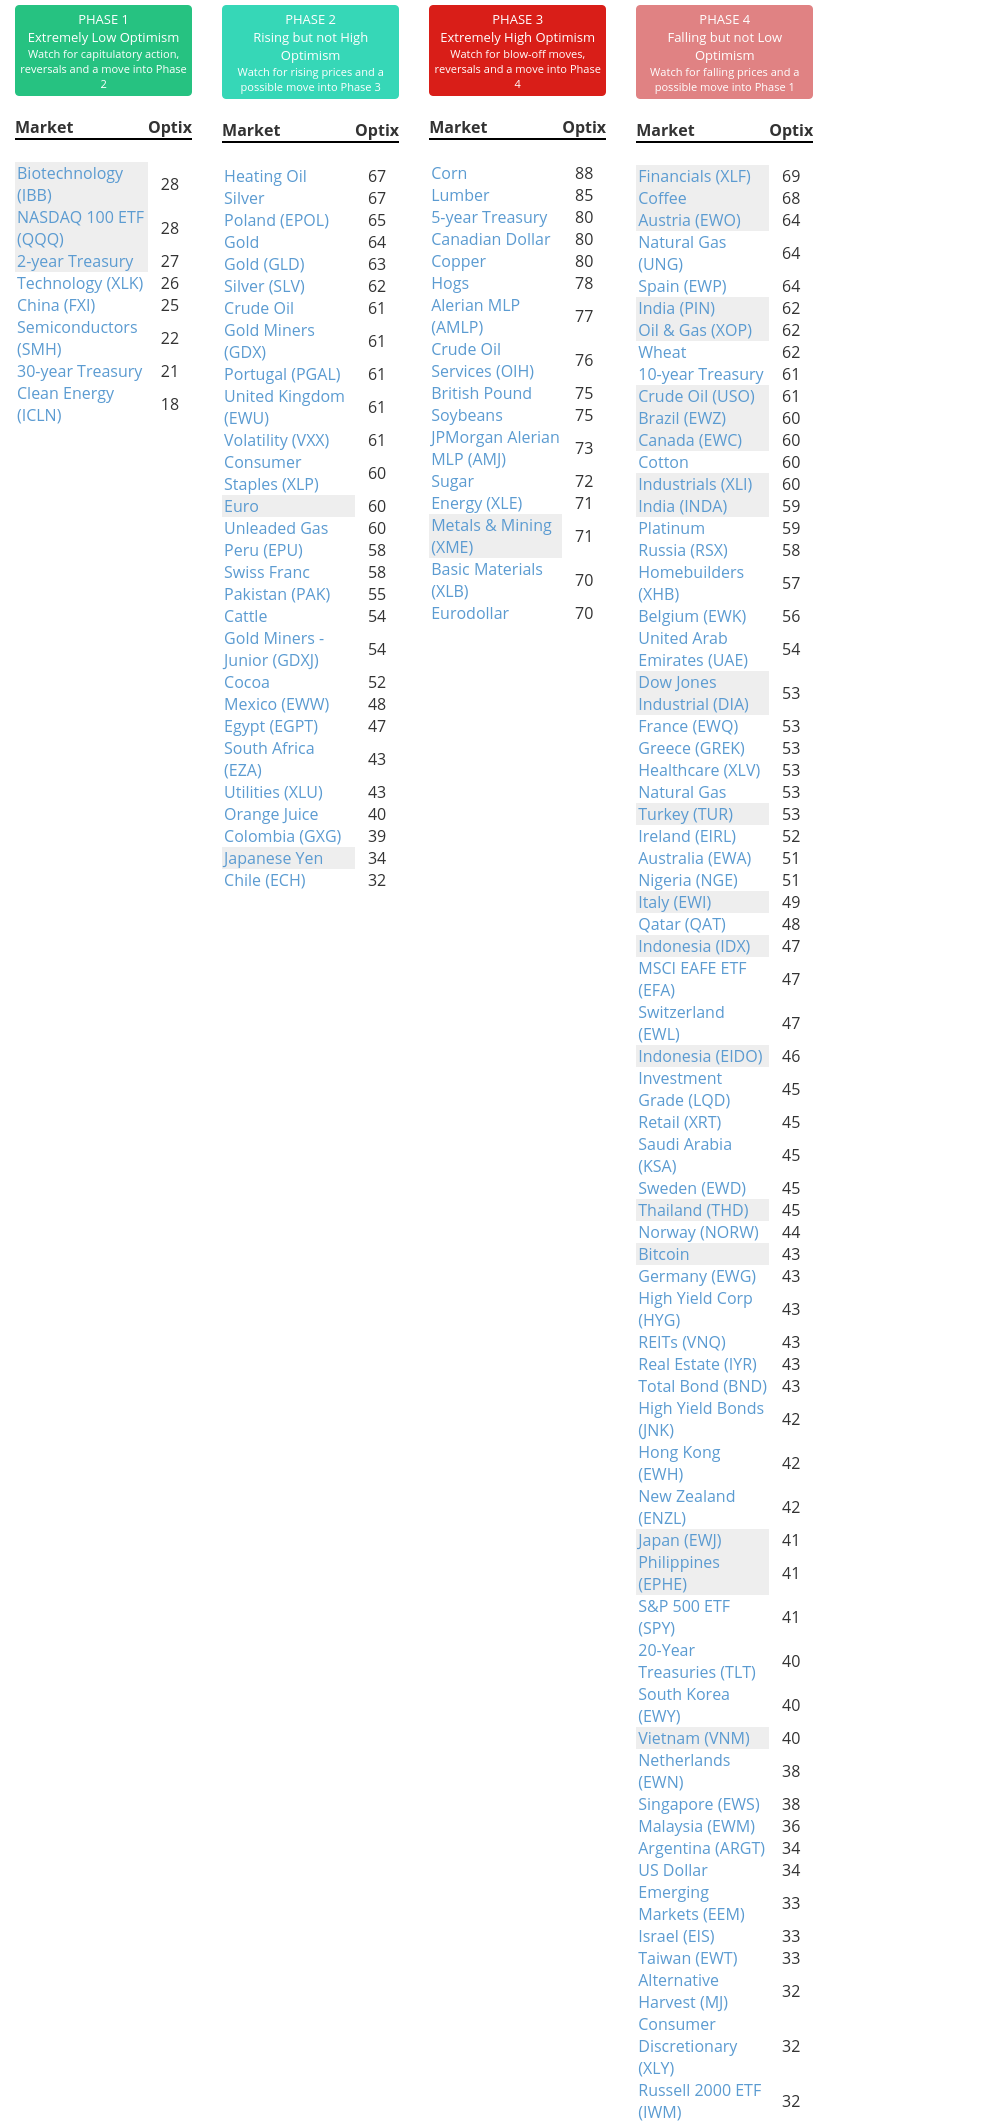
Phase Table
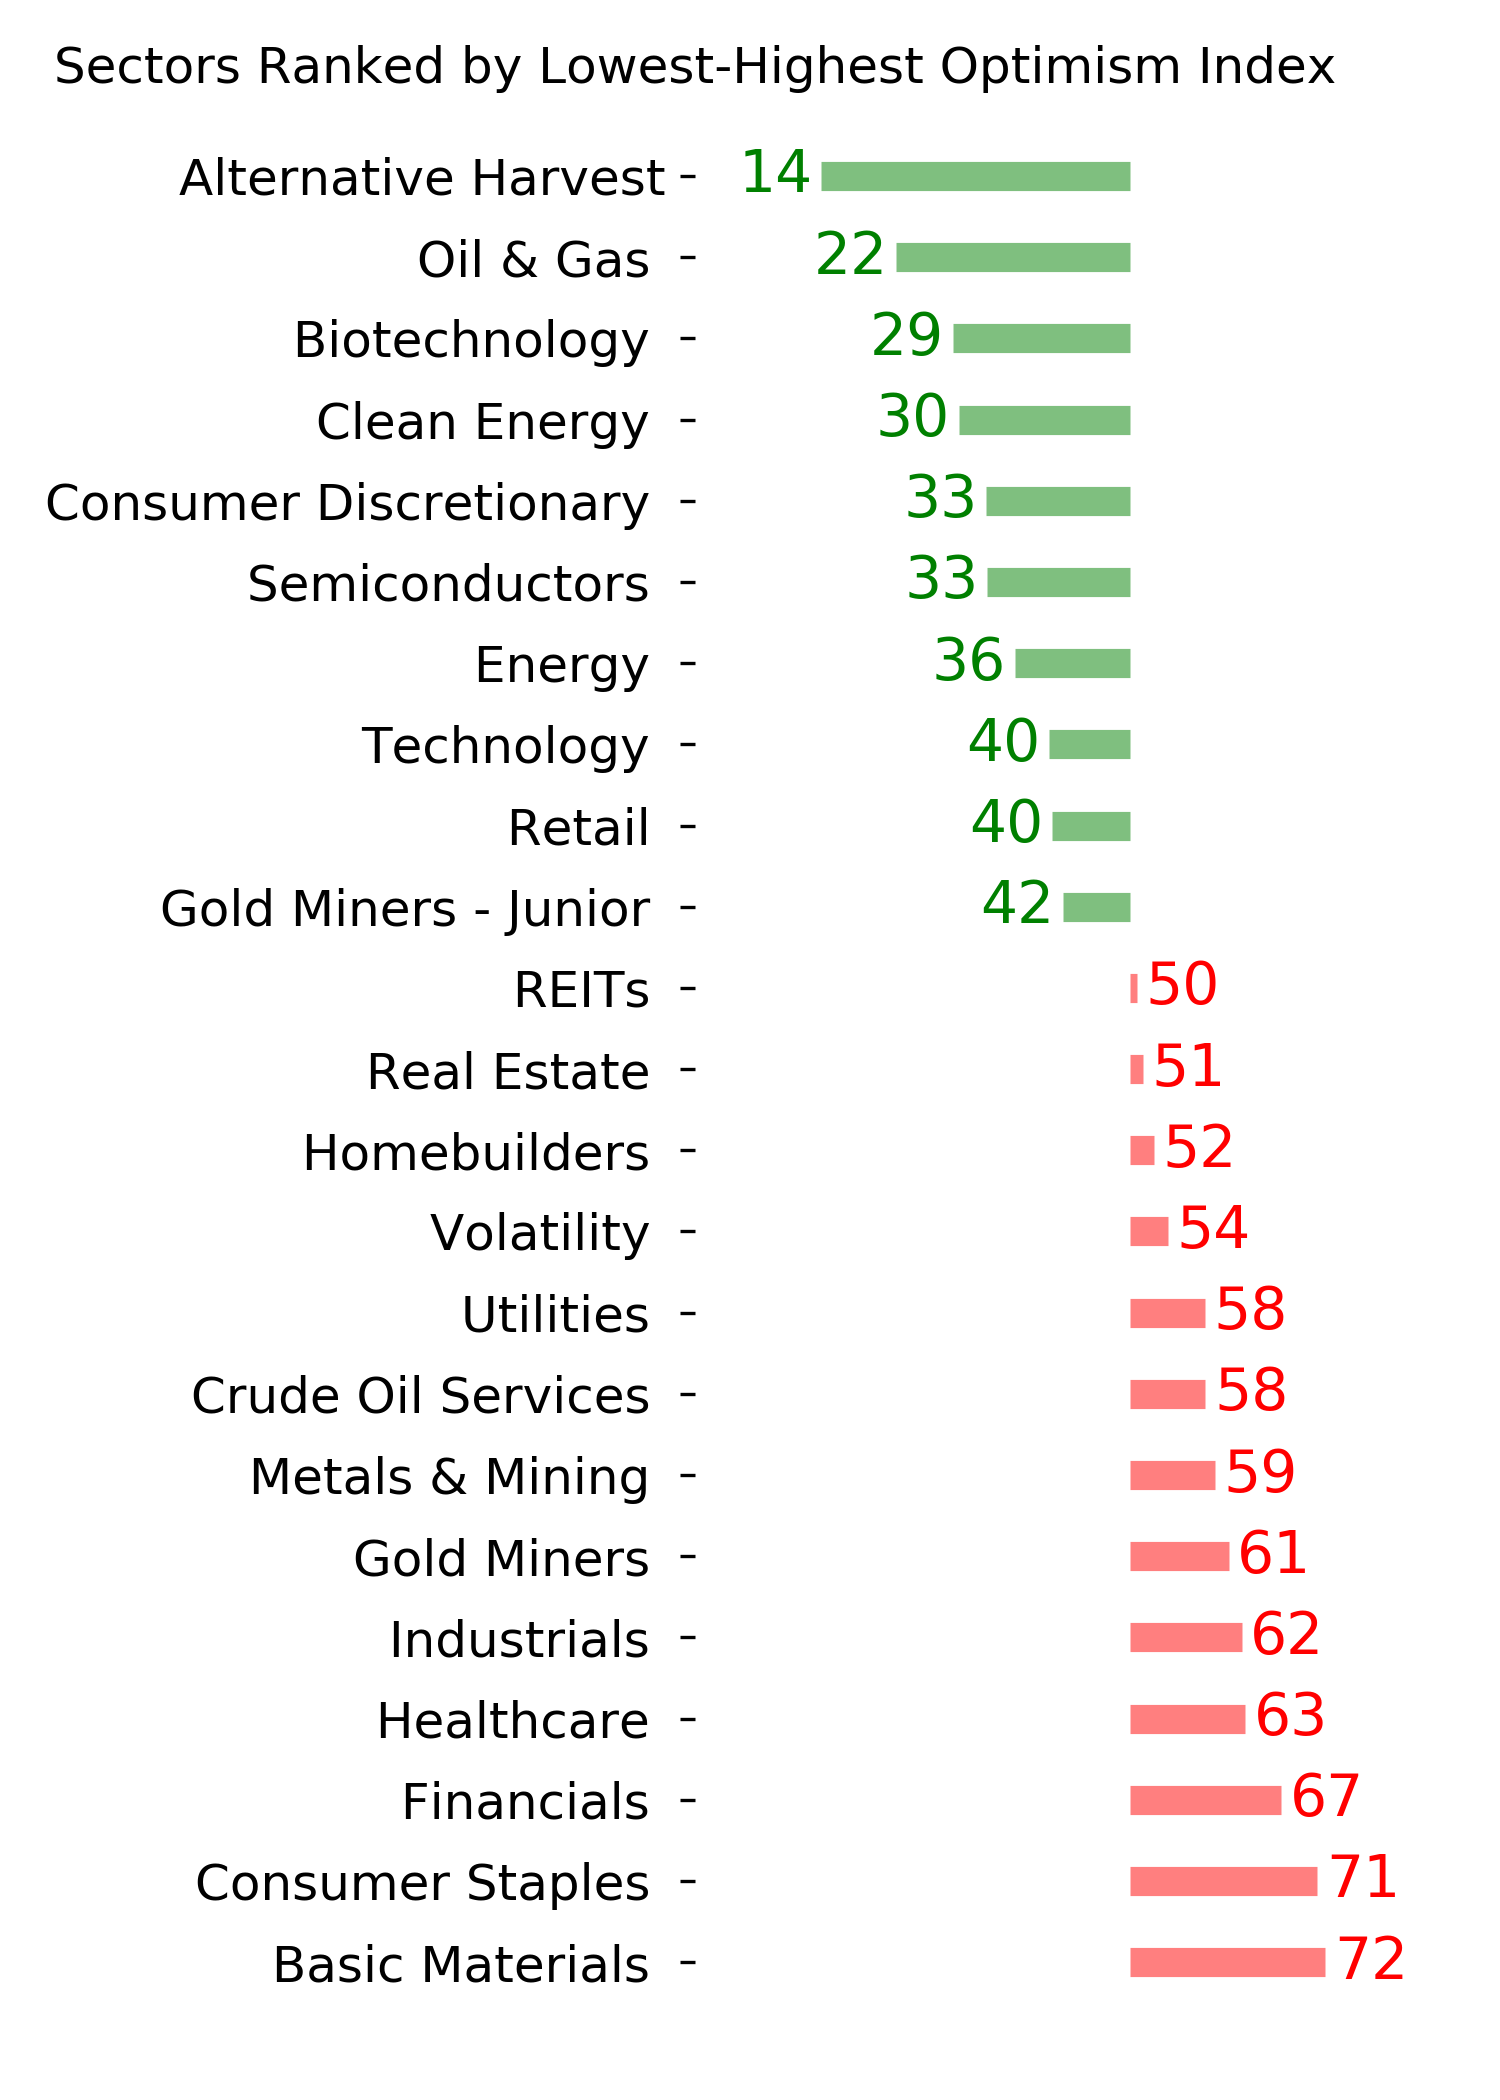
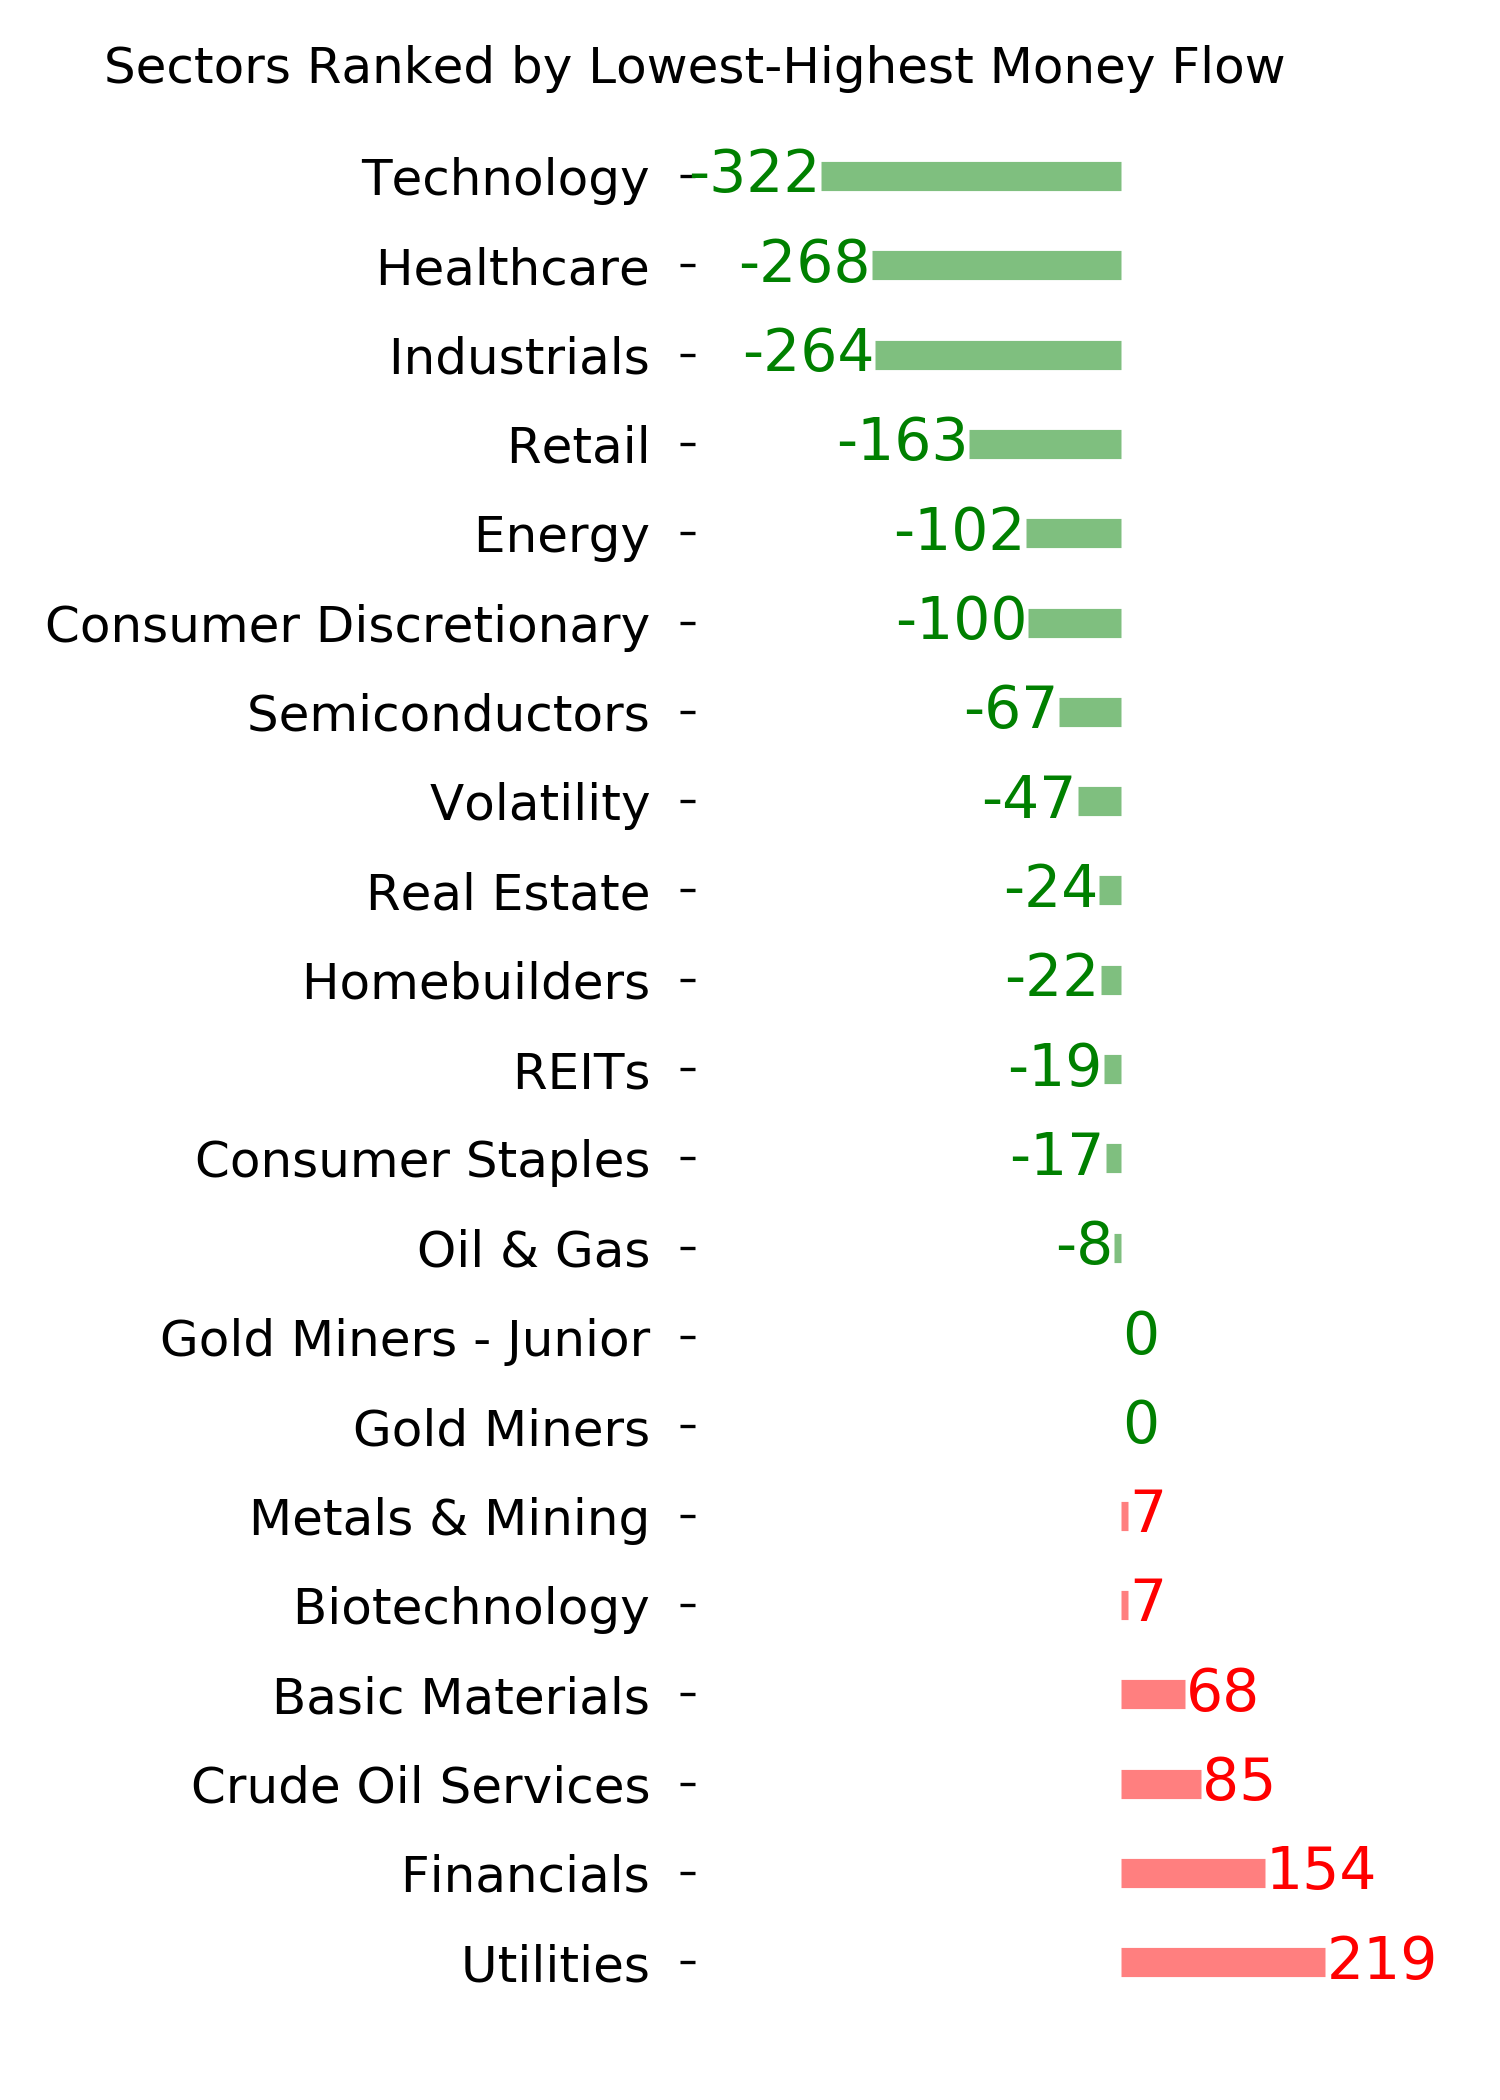
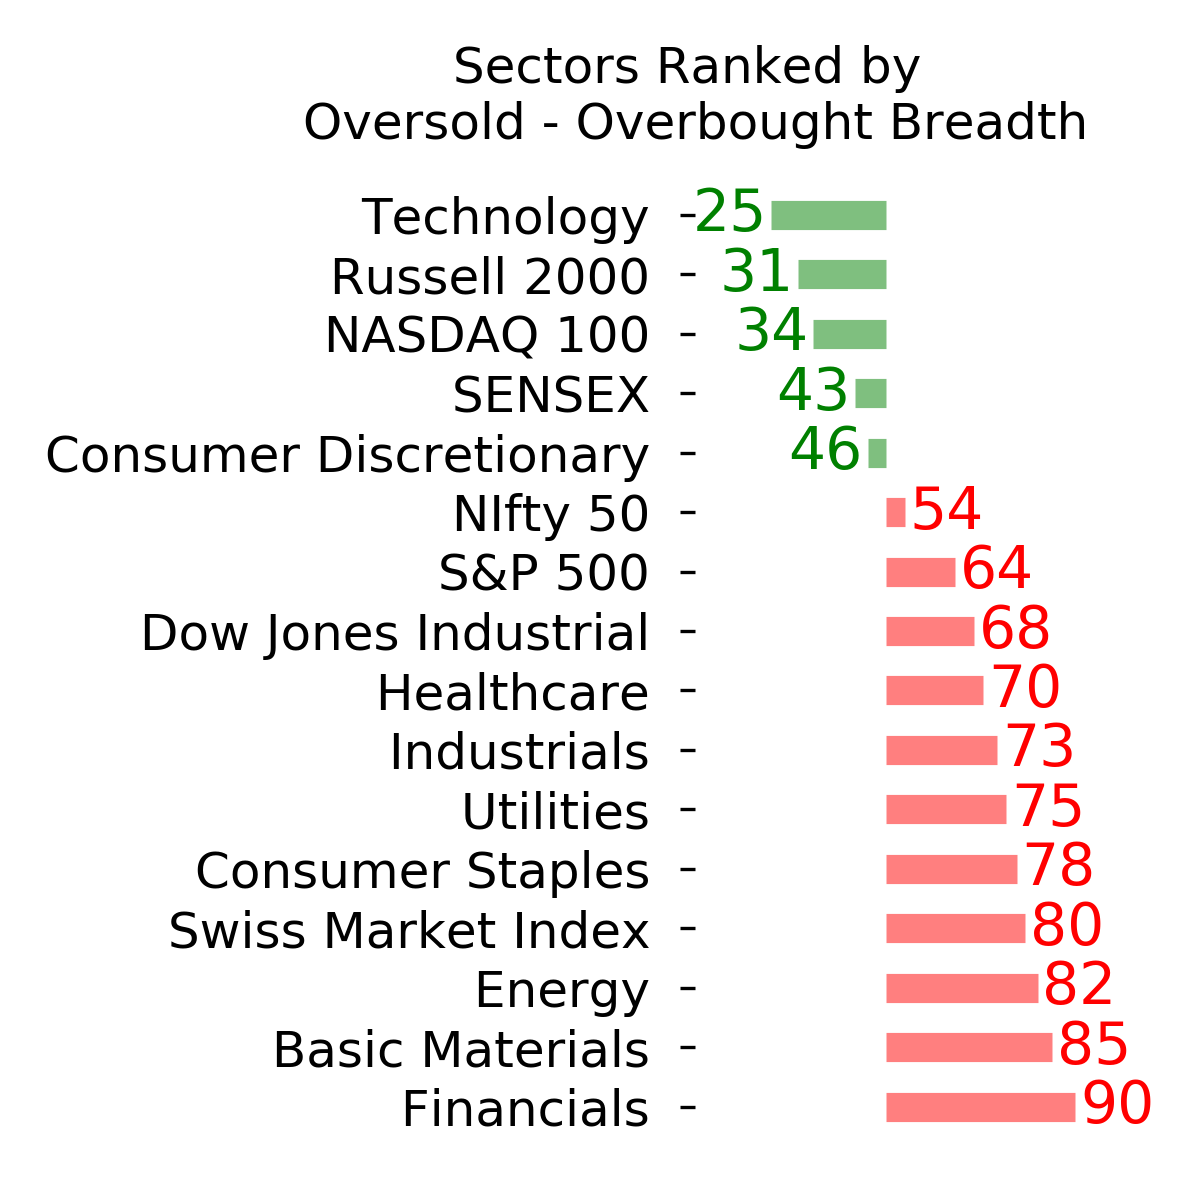
Ranks
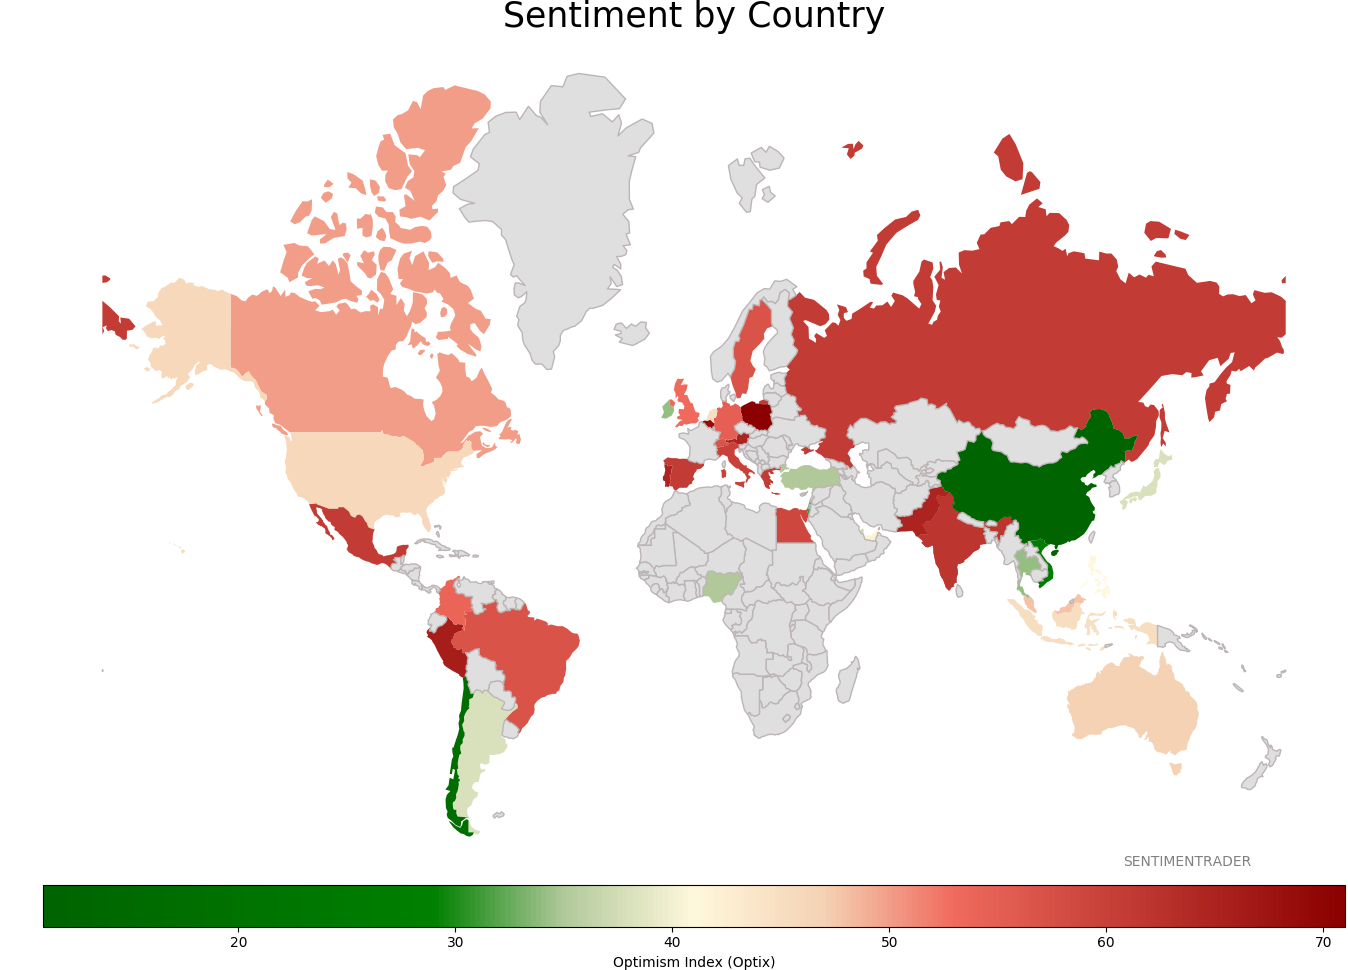
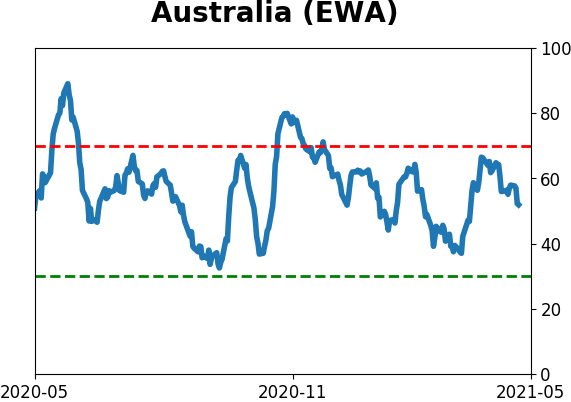
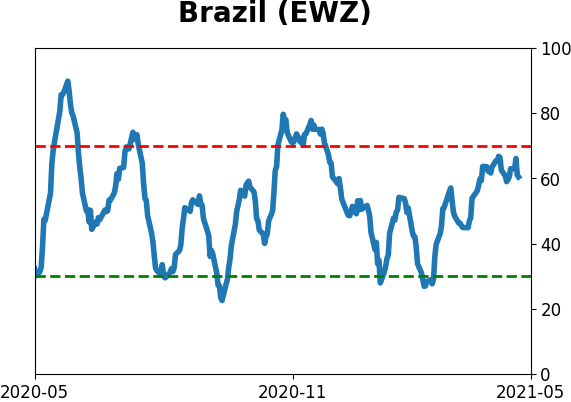
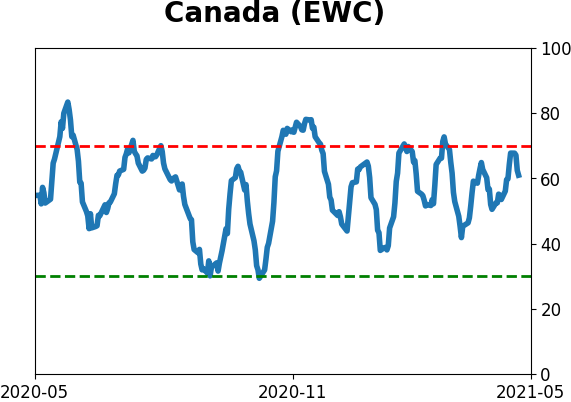
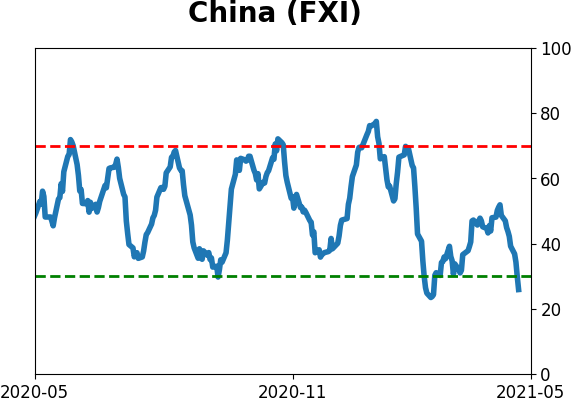
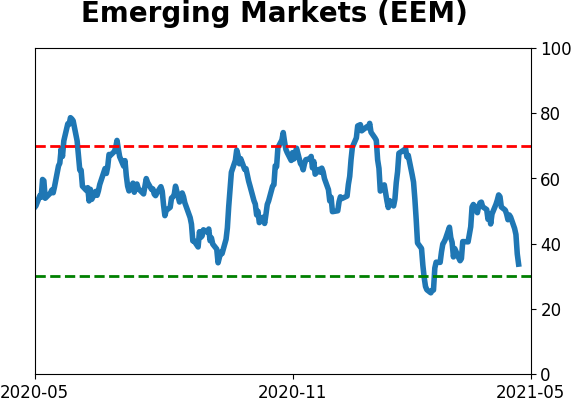
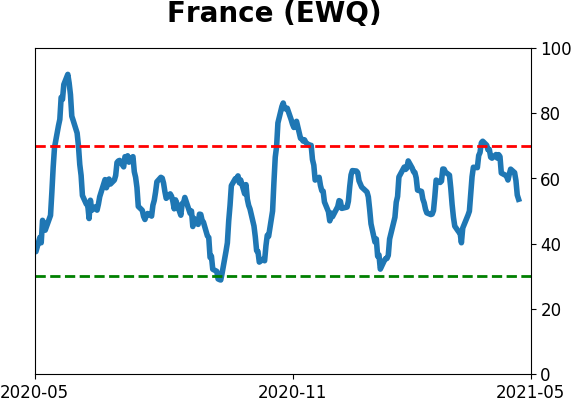
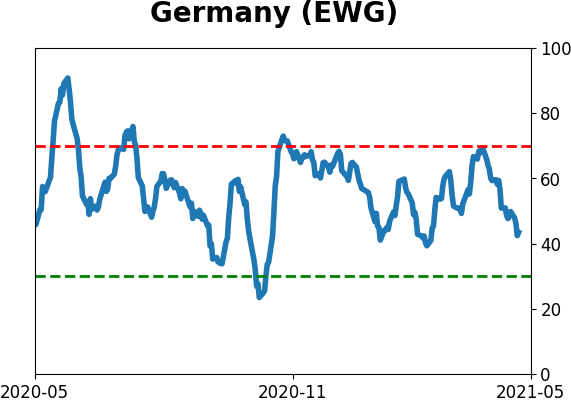
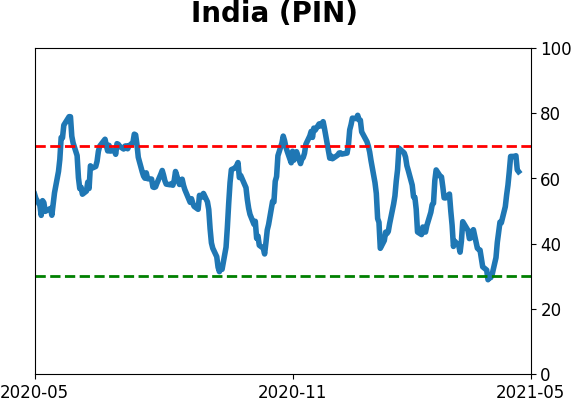
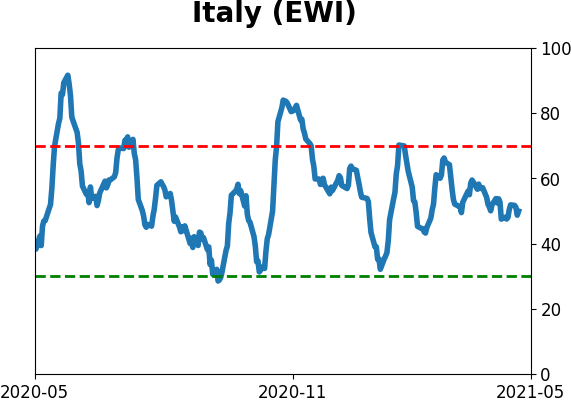
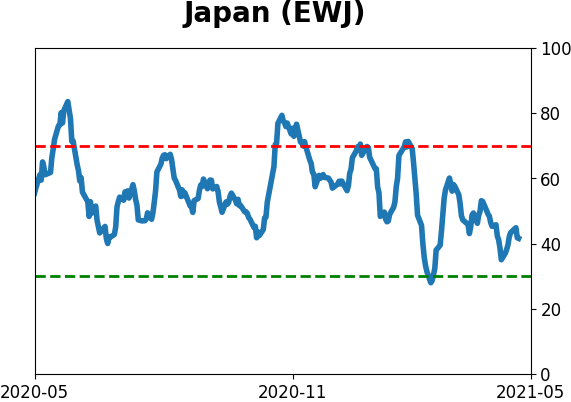
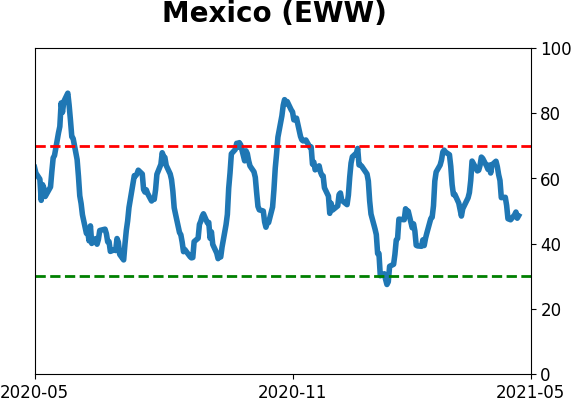
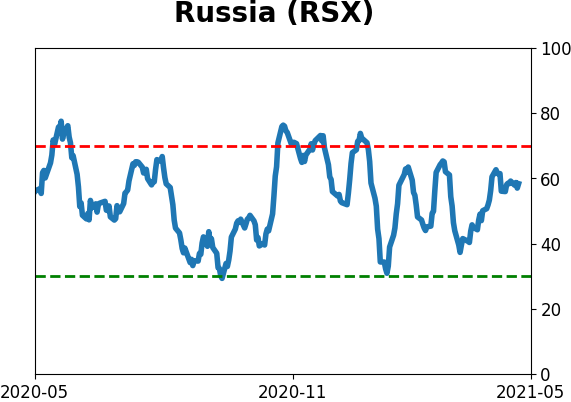
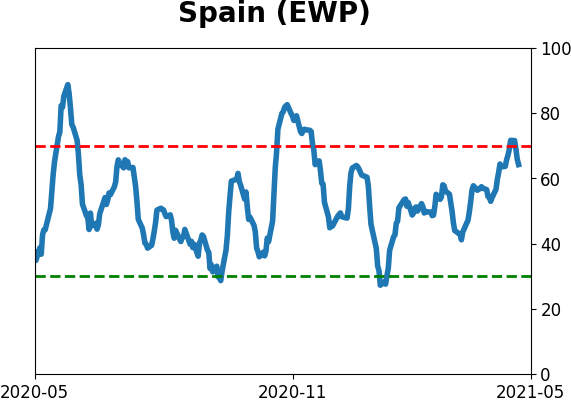
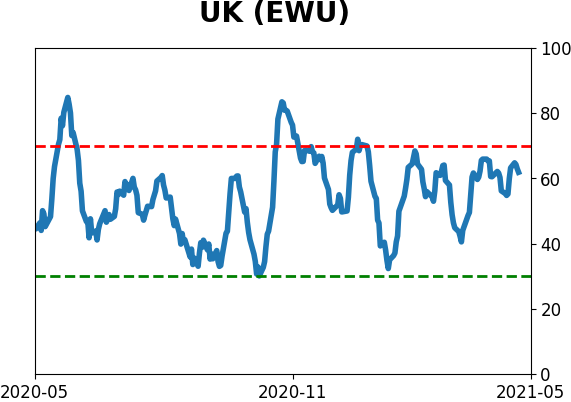
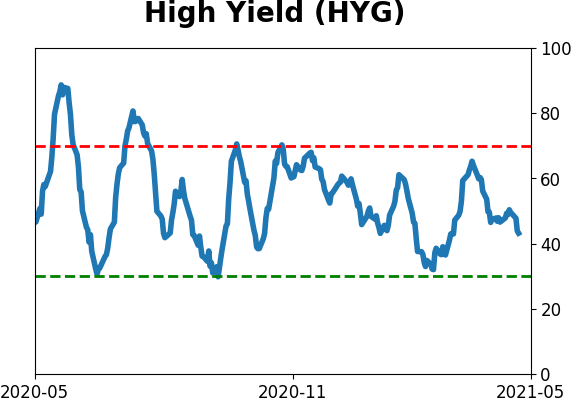
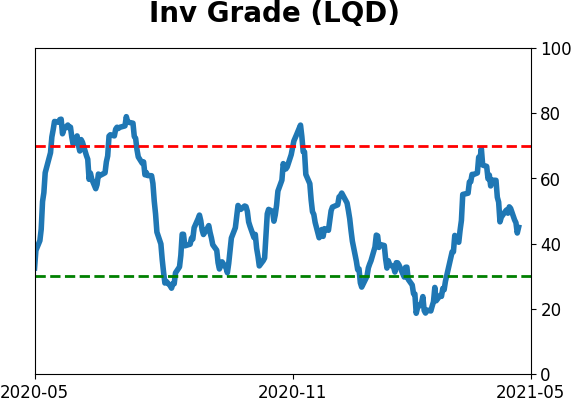
Sentiment Around The World
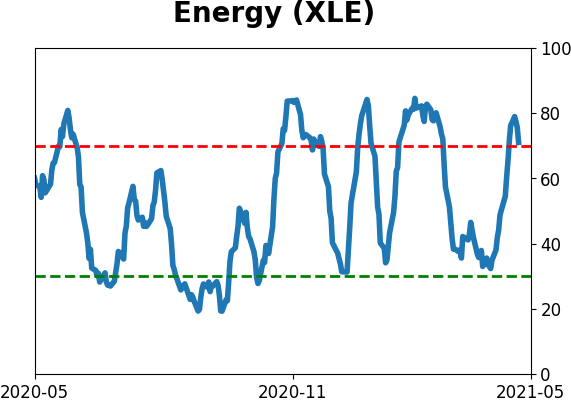
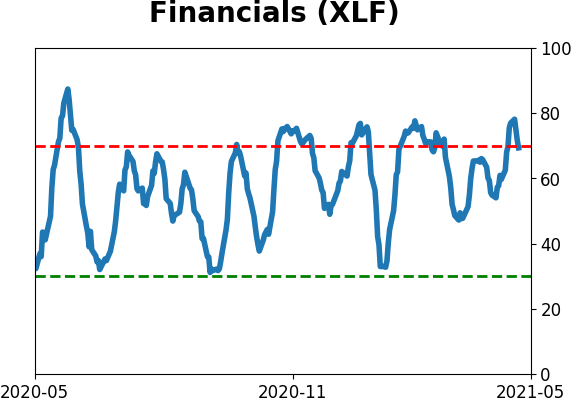
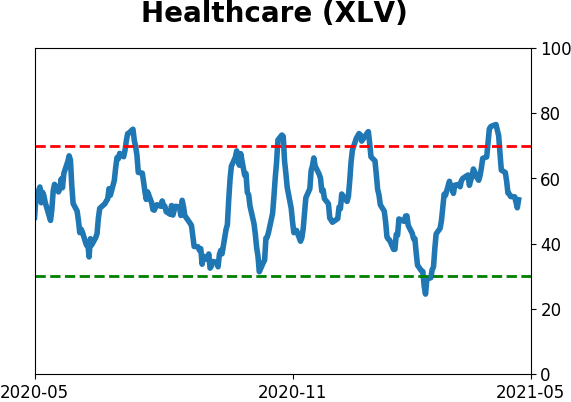
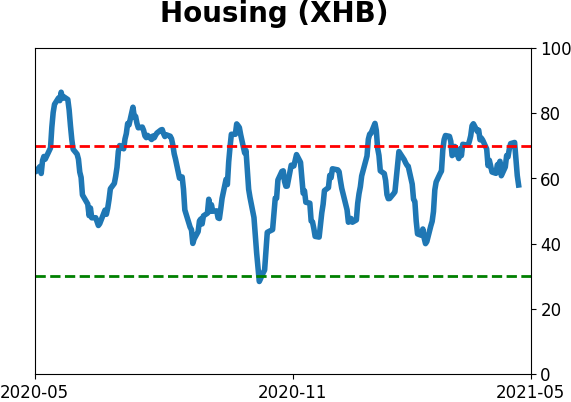
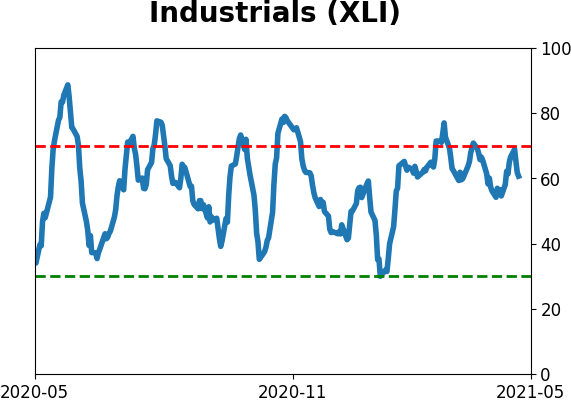
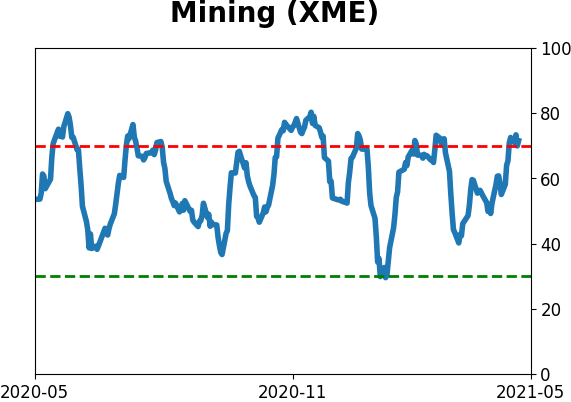
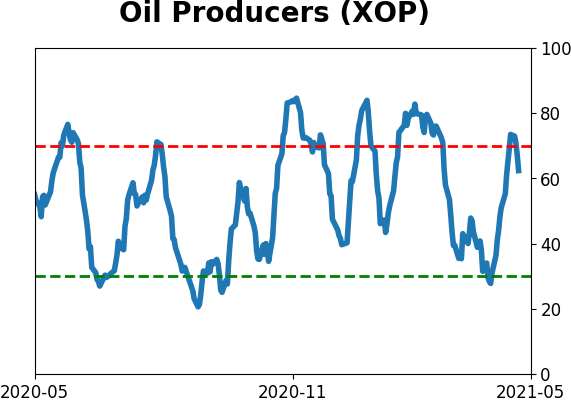
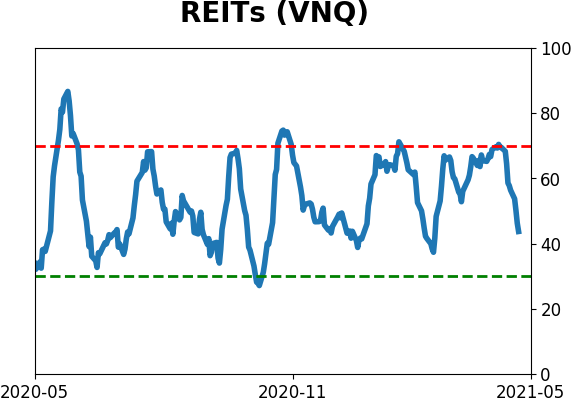
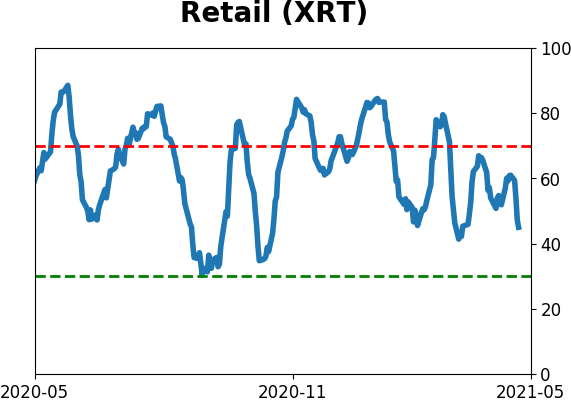
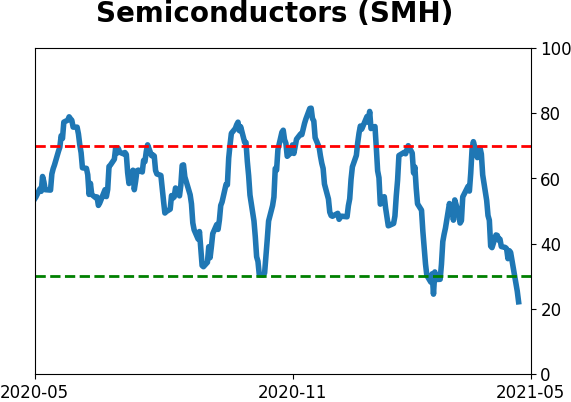
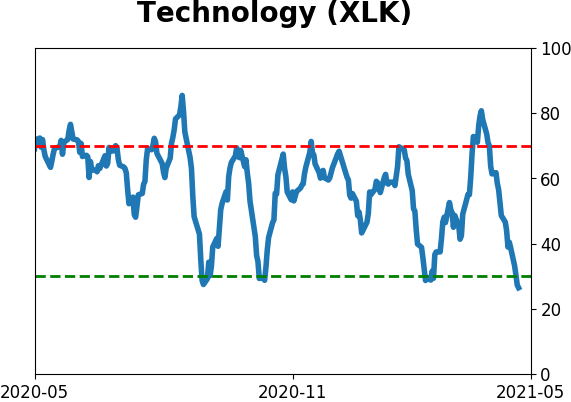
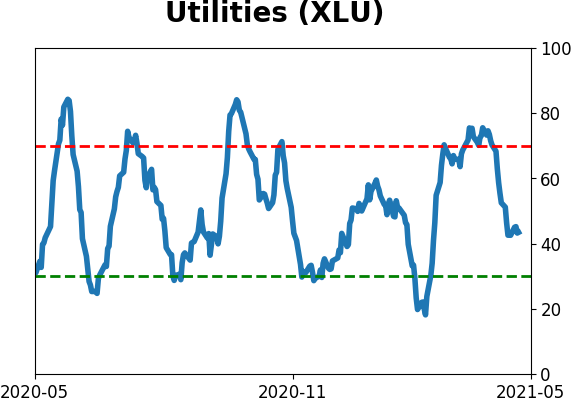
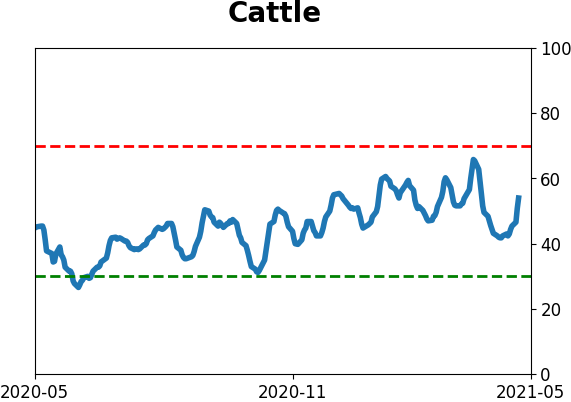
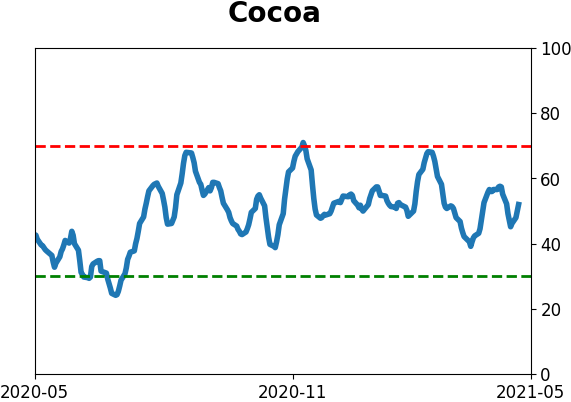
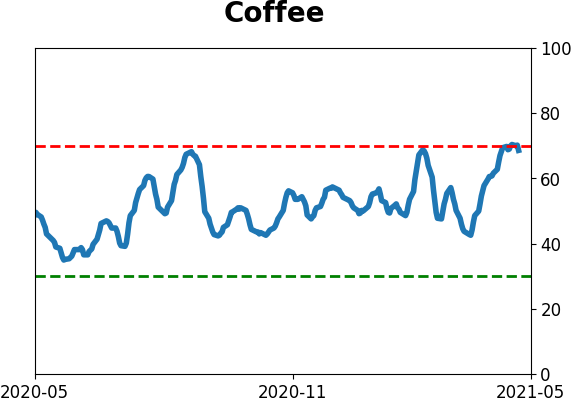
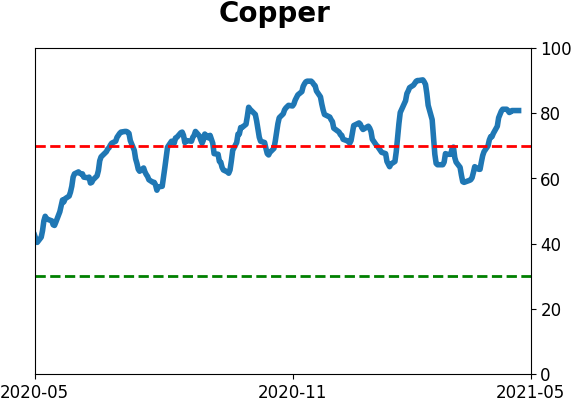
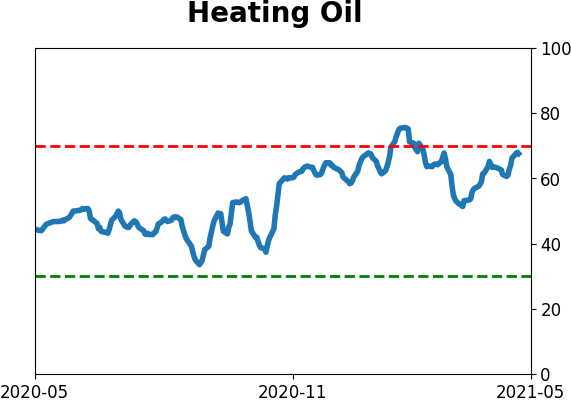
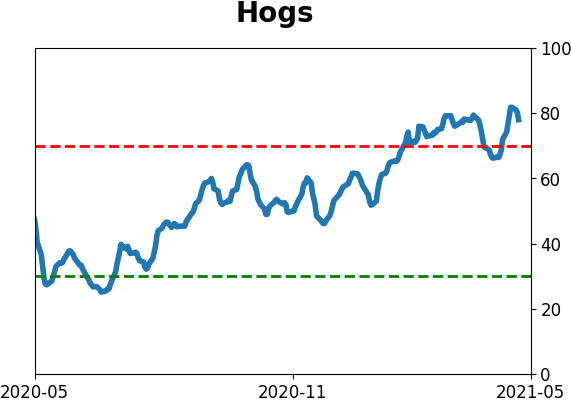
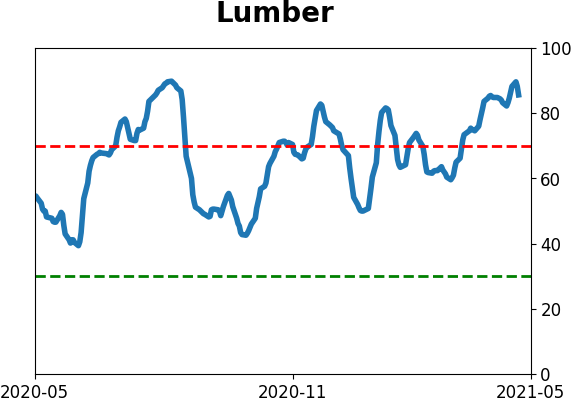
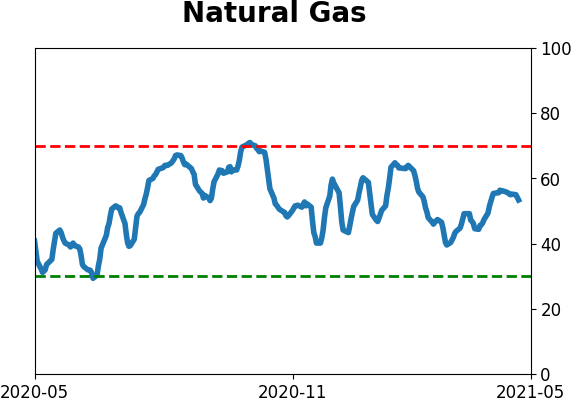
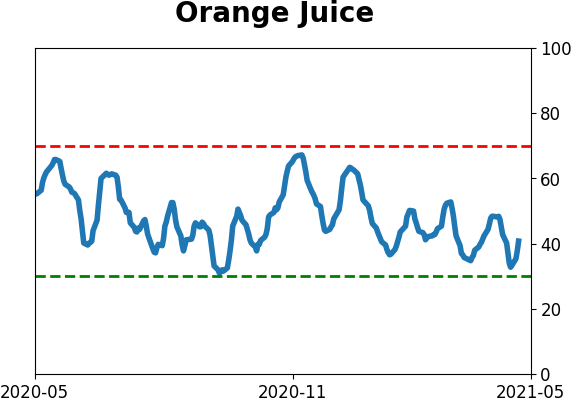
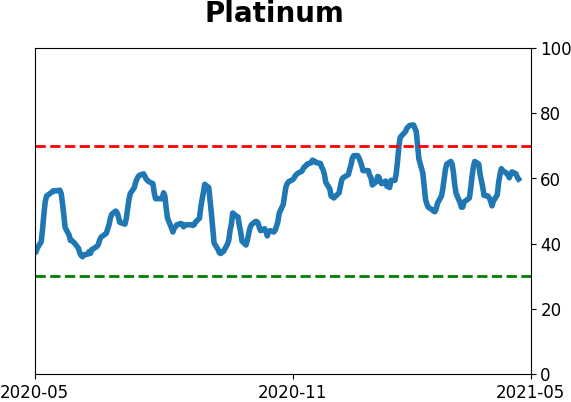
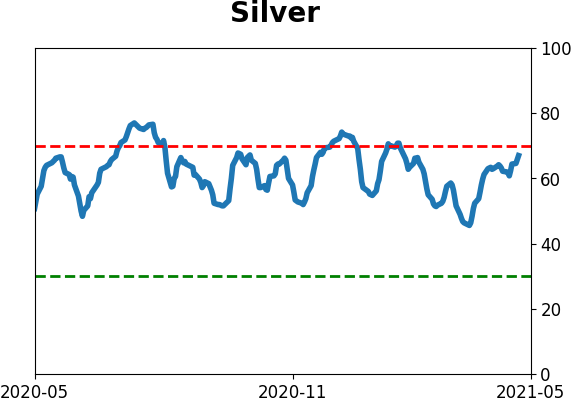
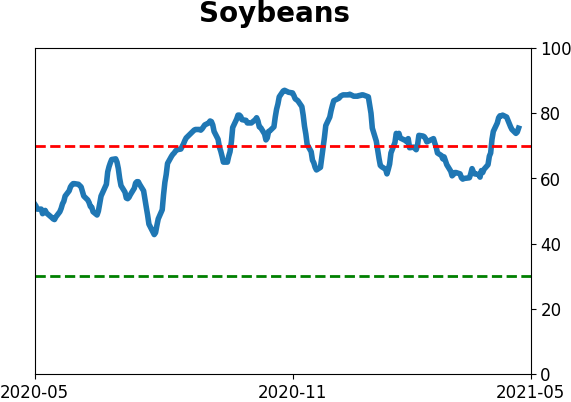
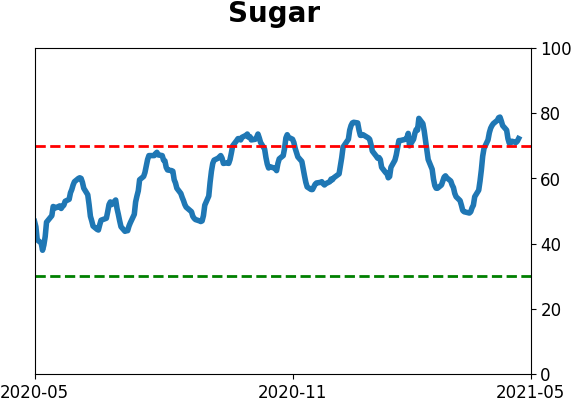
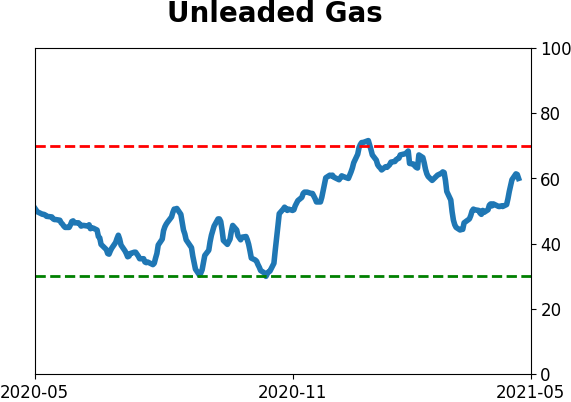
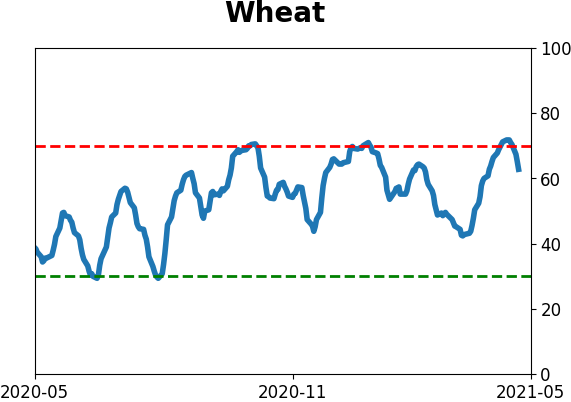
Optimism Index Thumbnails
|
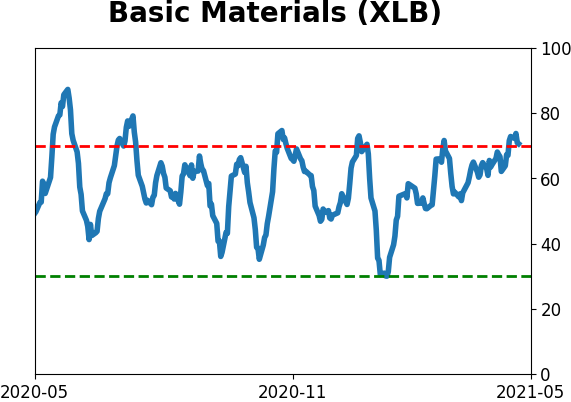
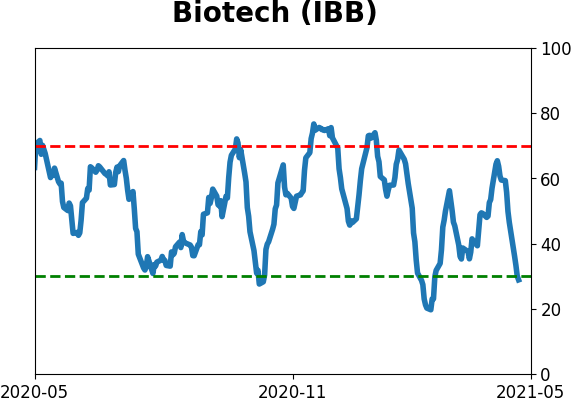
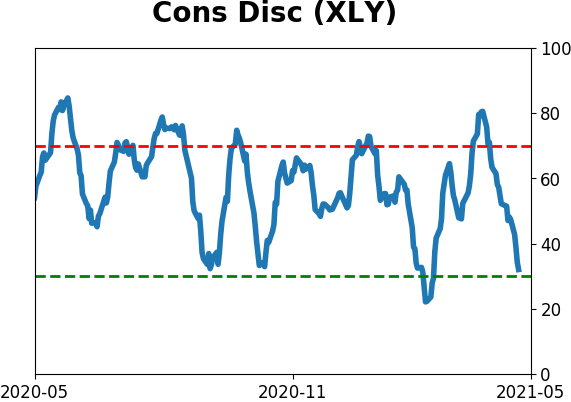
Sector ETF's - 10-Day Moving Average
|
|
|
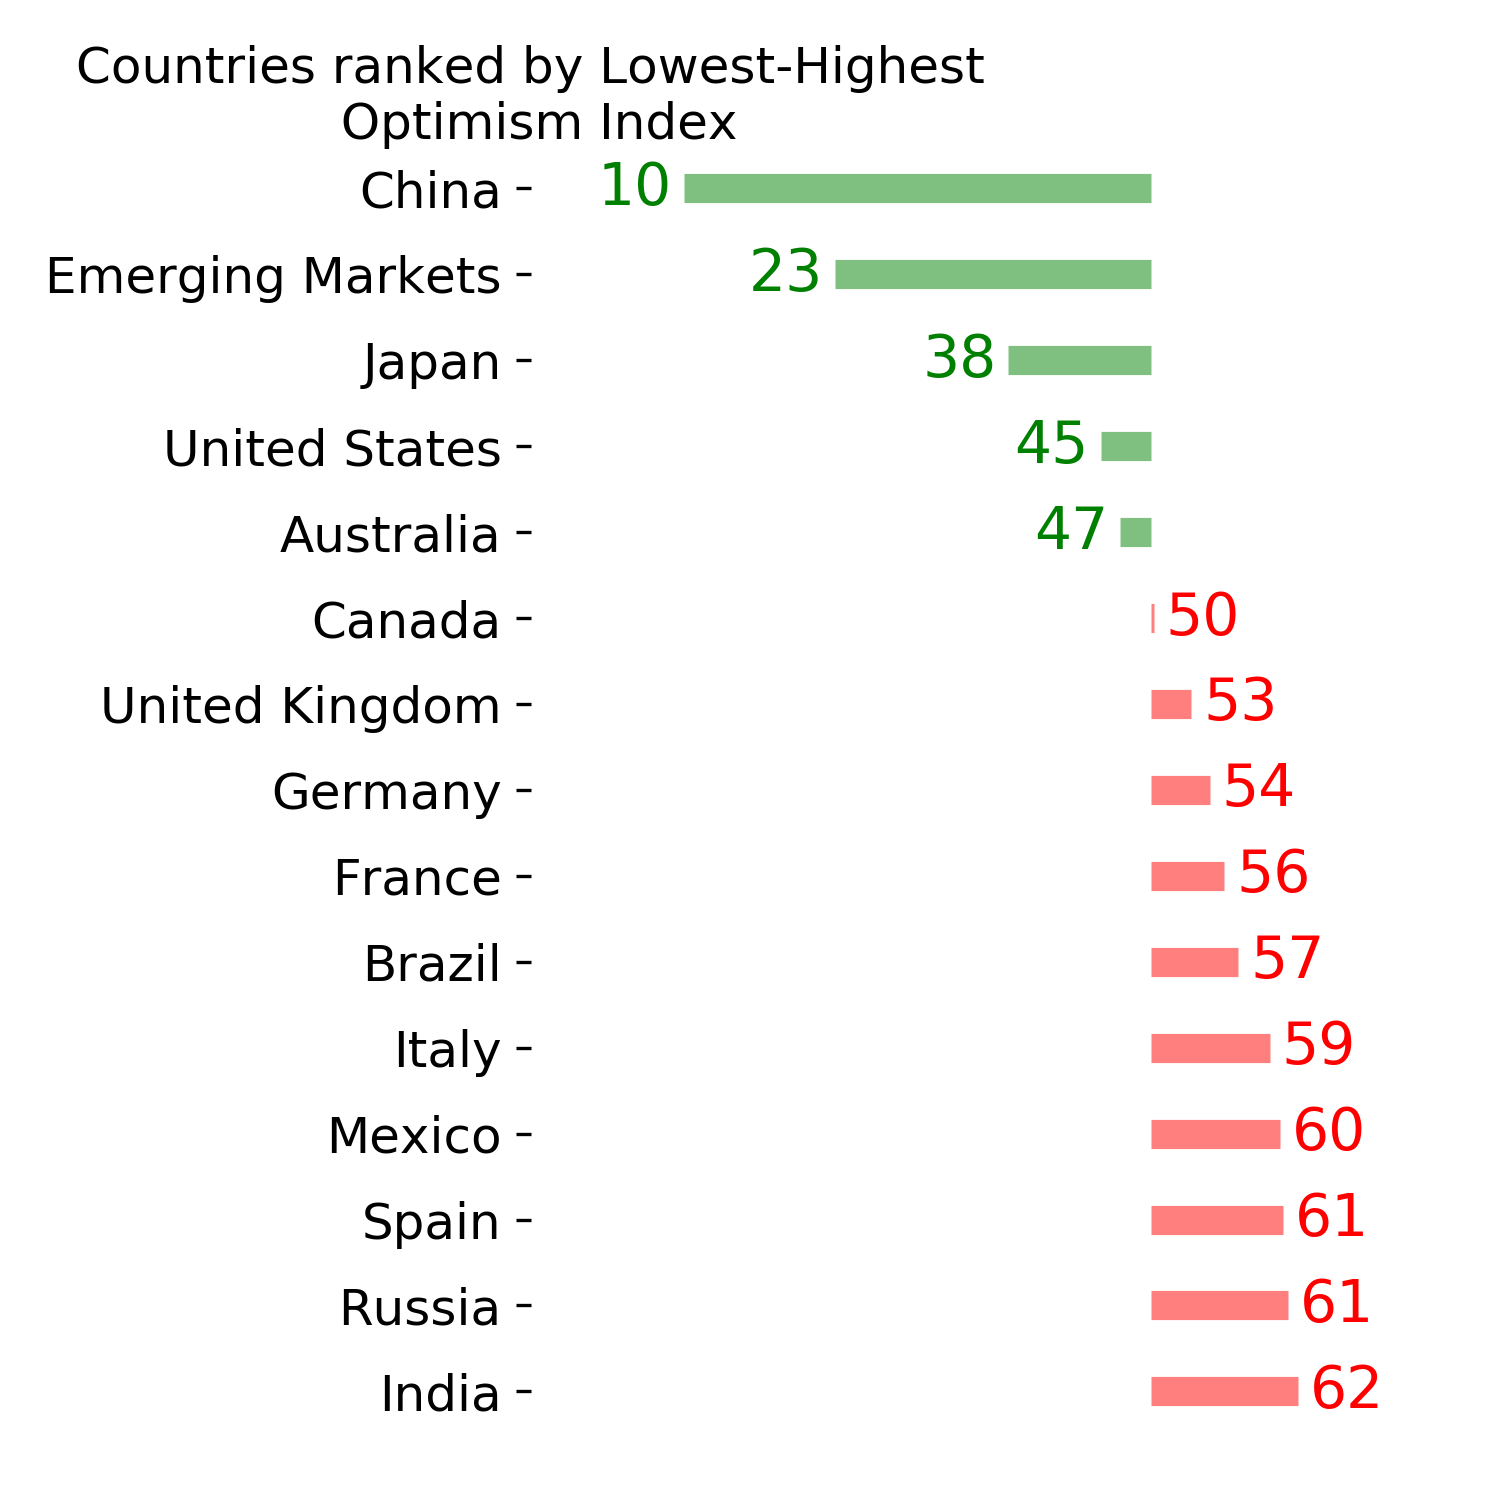
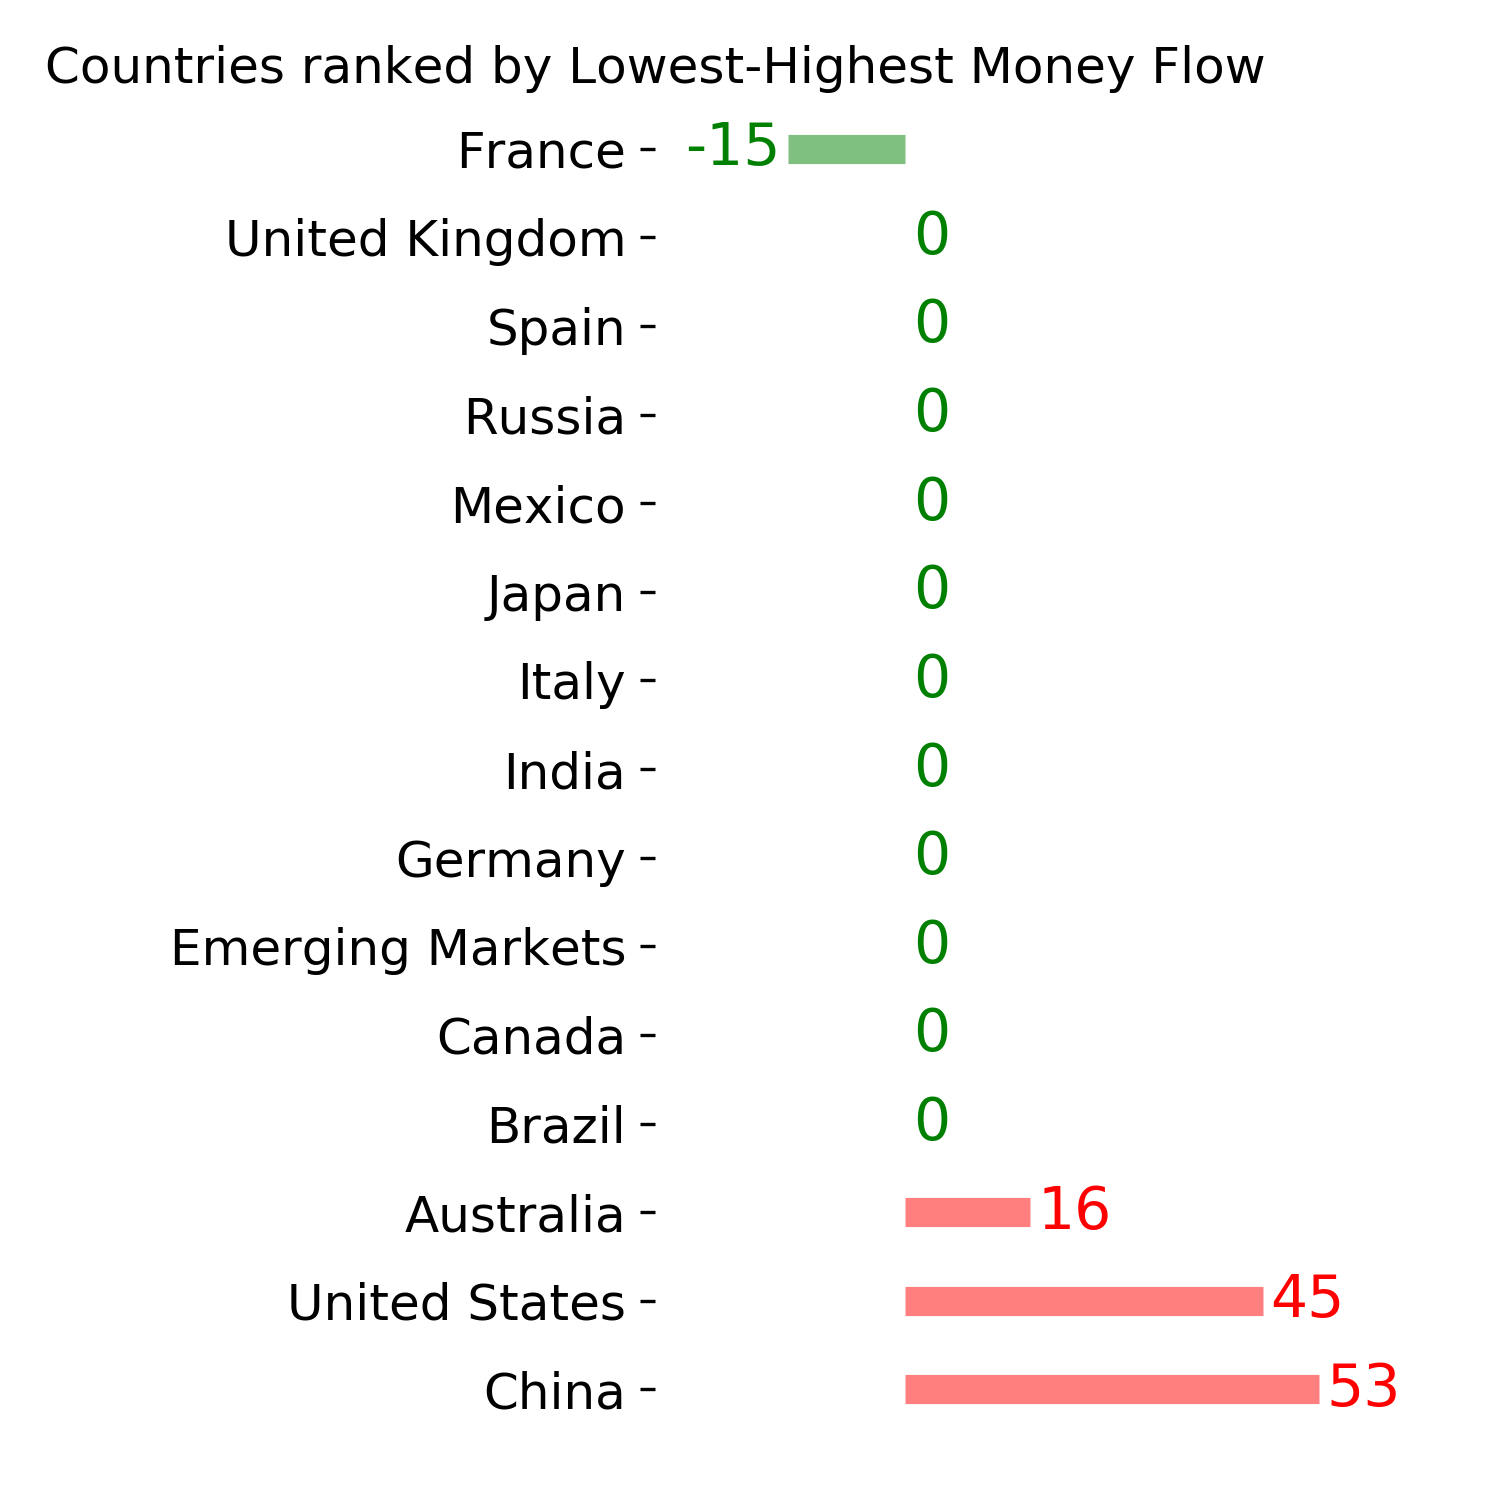
Country ETF's - 10-Day Moving Average
|
|
|
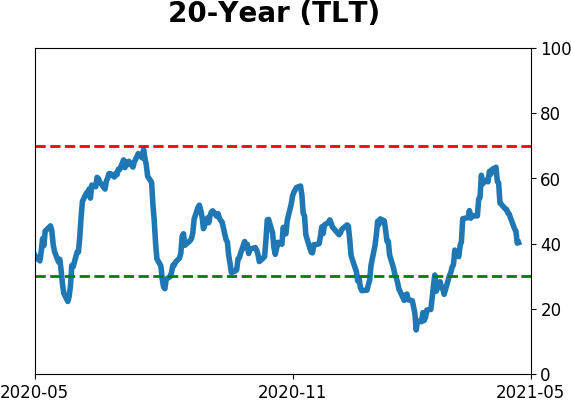
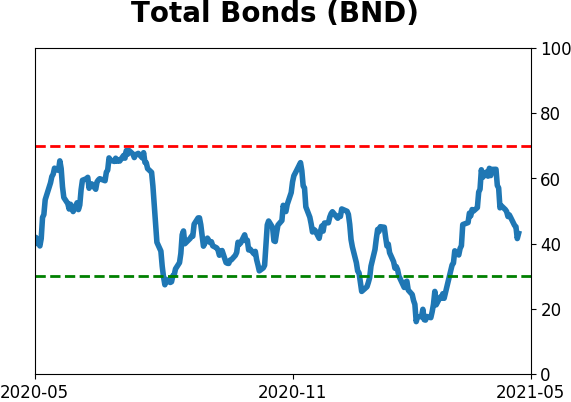
Bond ETF's - 10-Day Moving Average
|
|
|
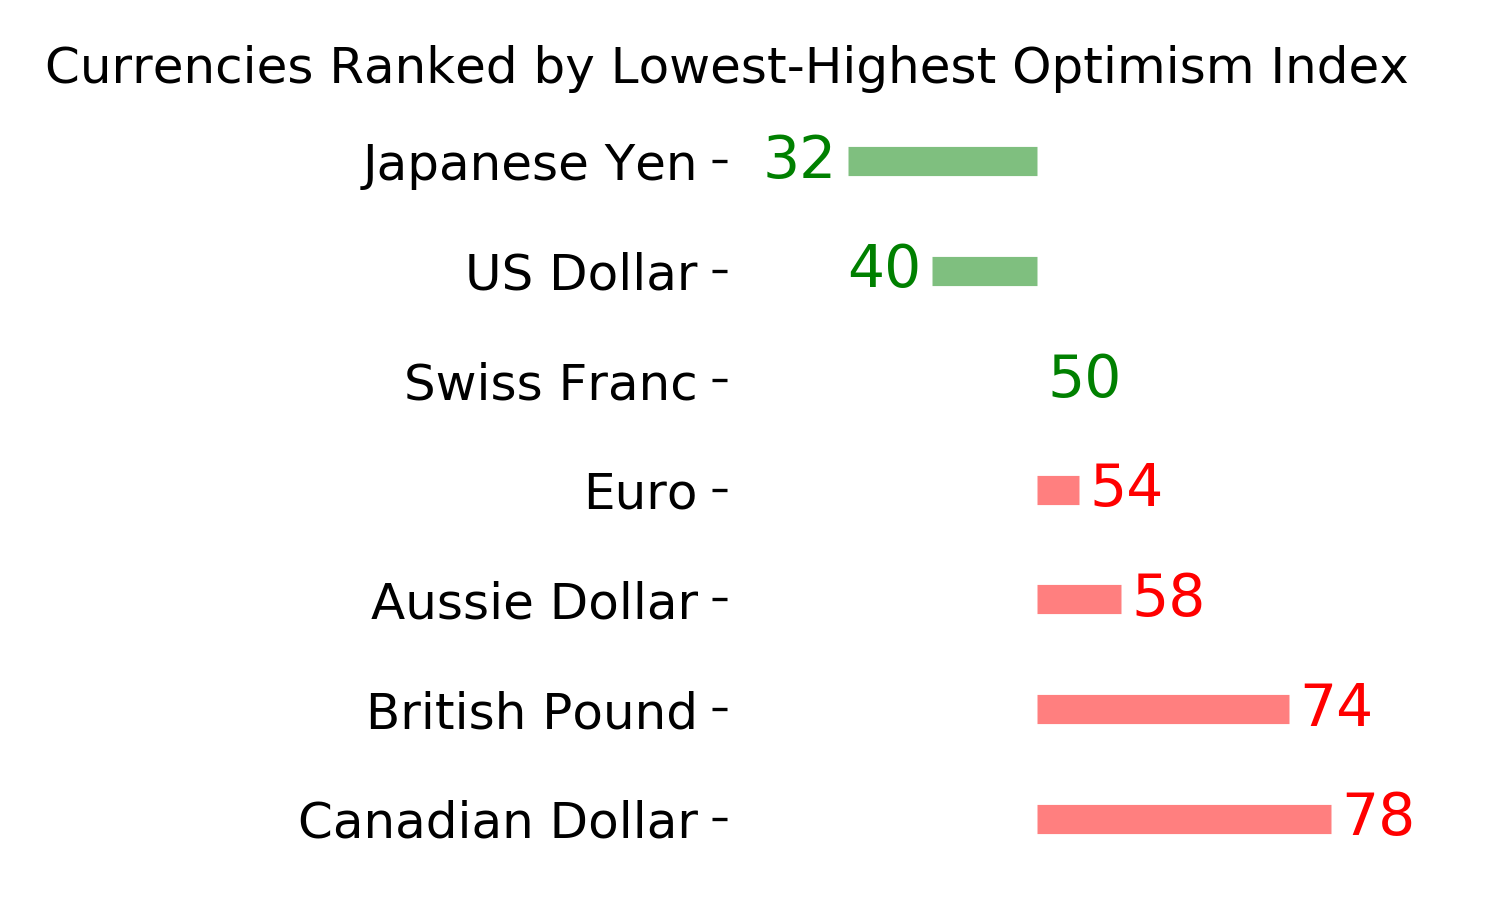
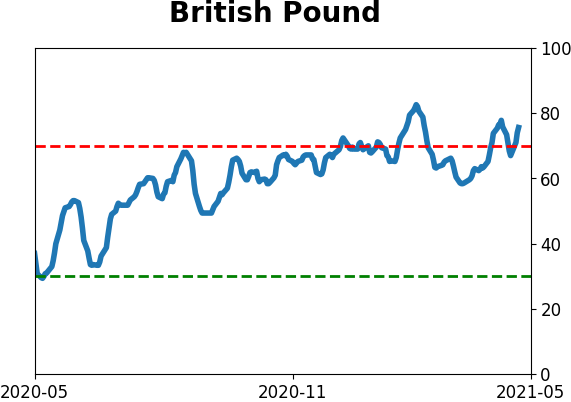
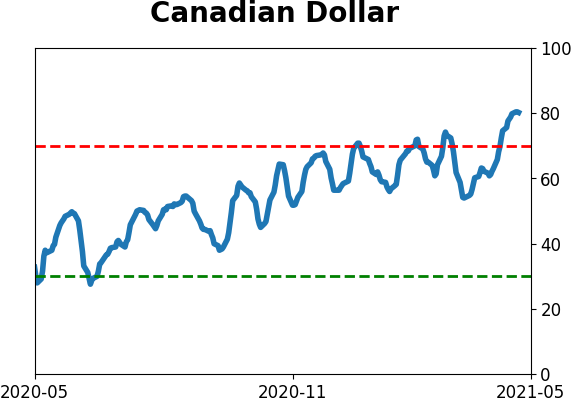
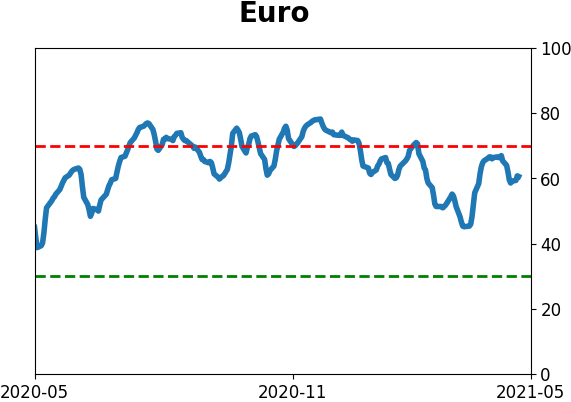
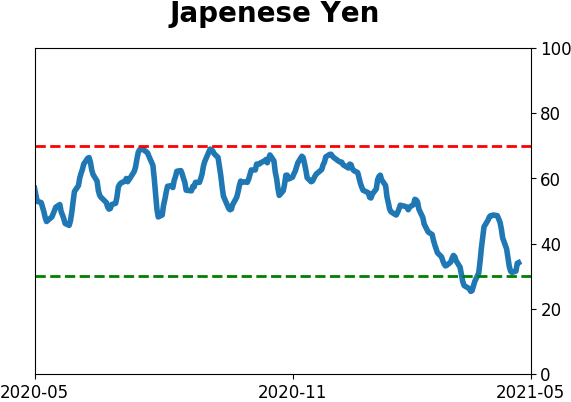
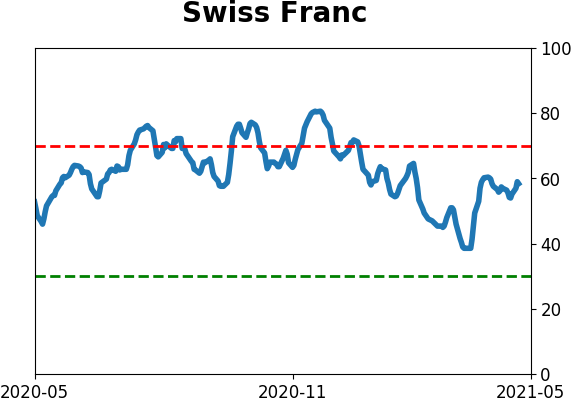
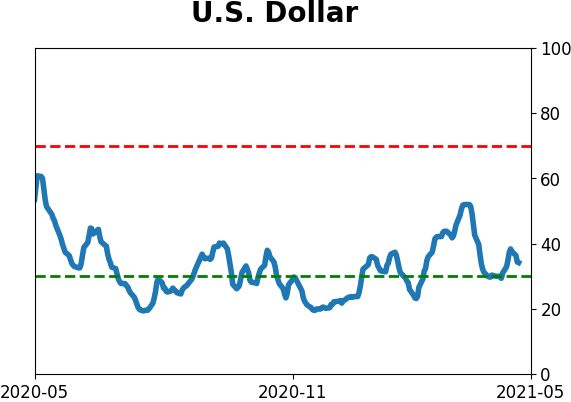
Currency ETF's - 5-Day Moving Average
|
|
|
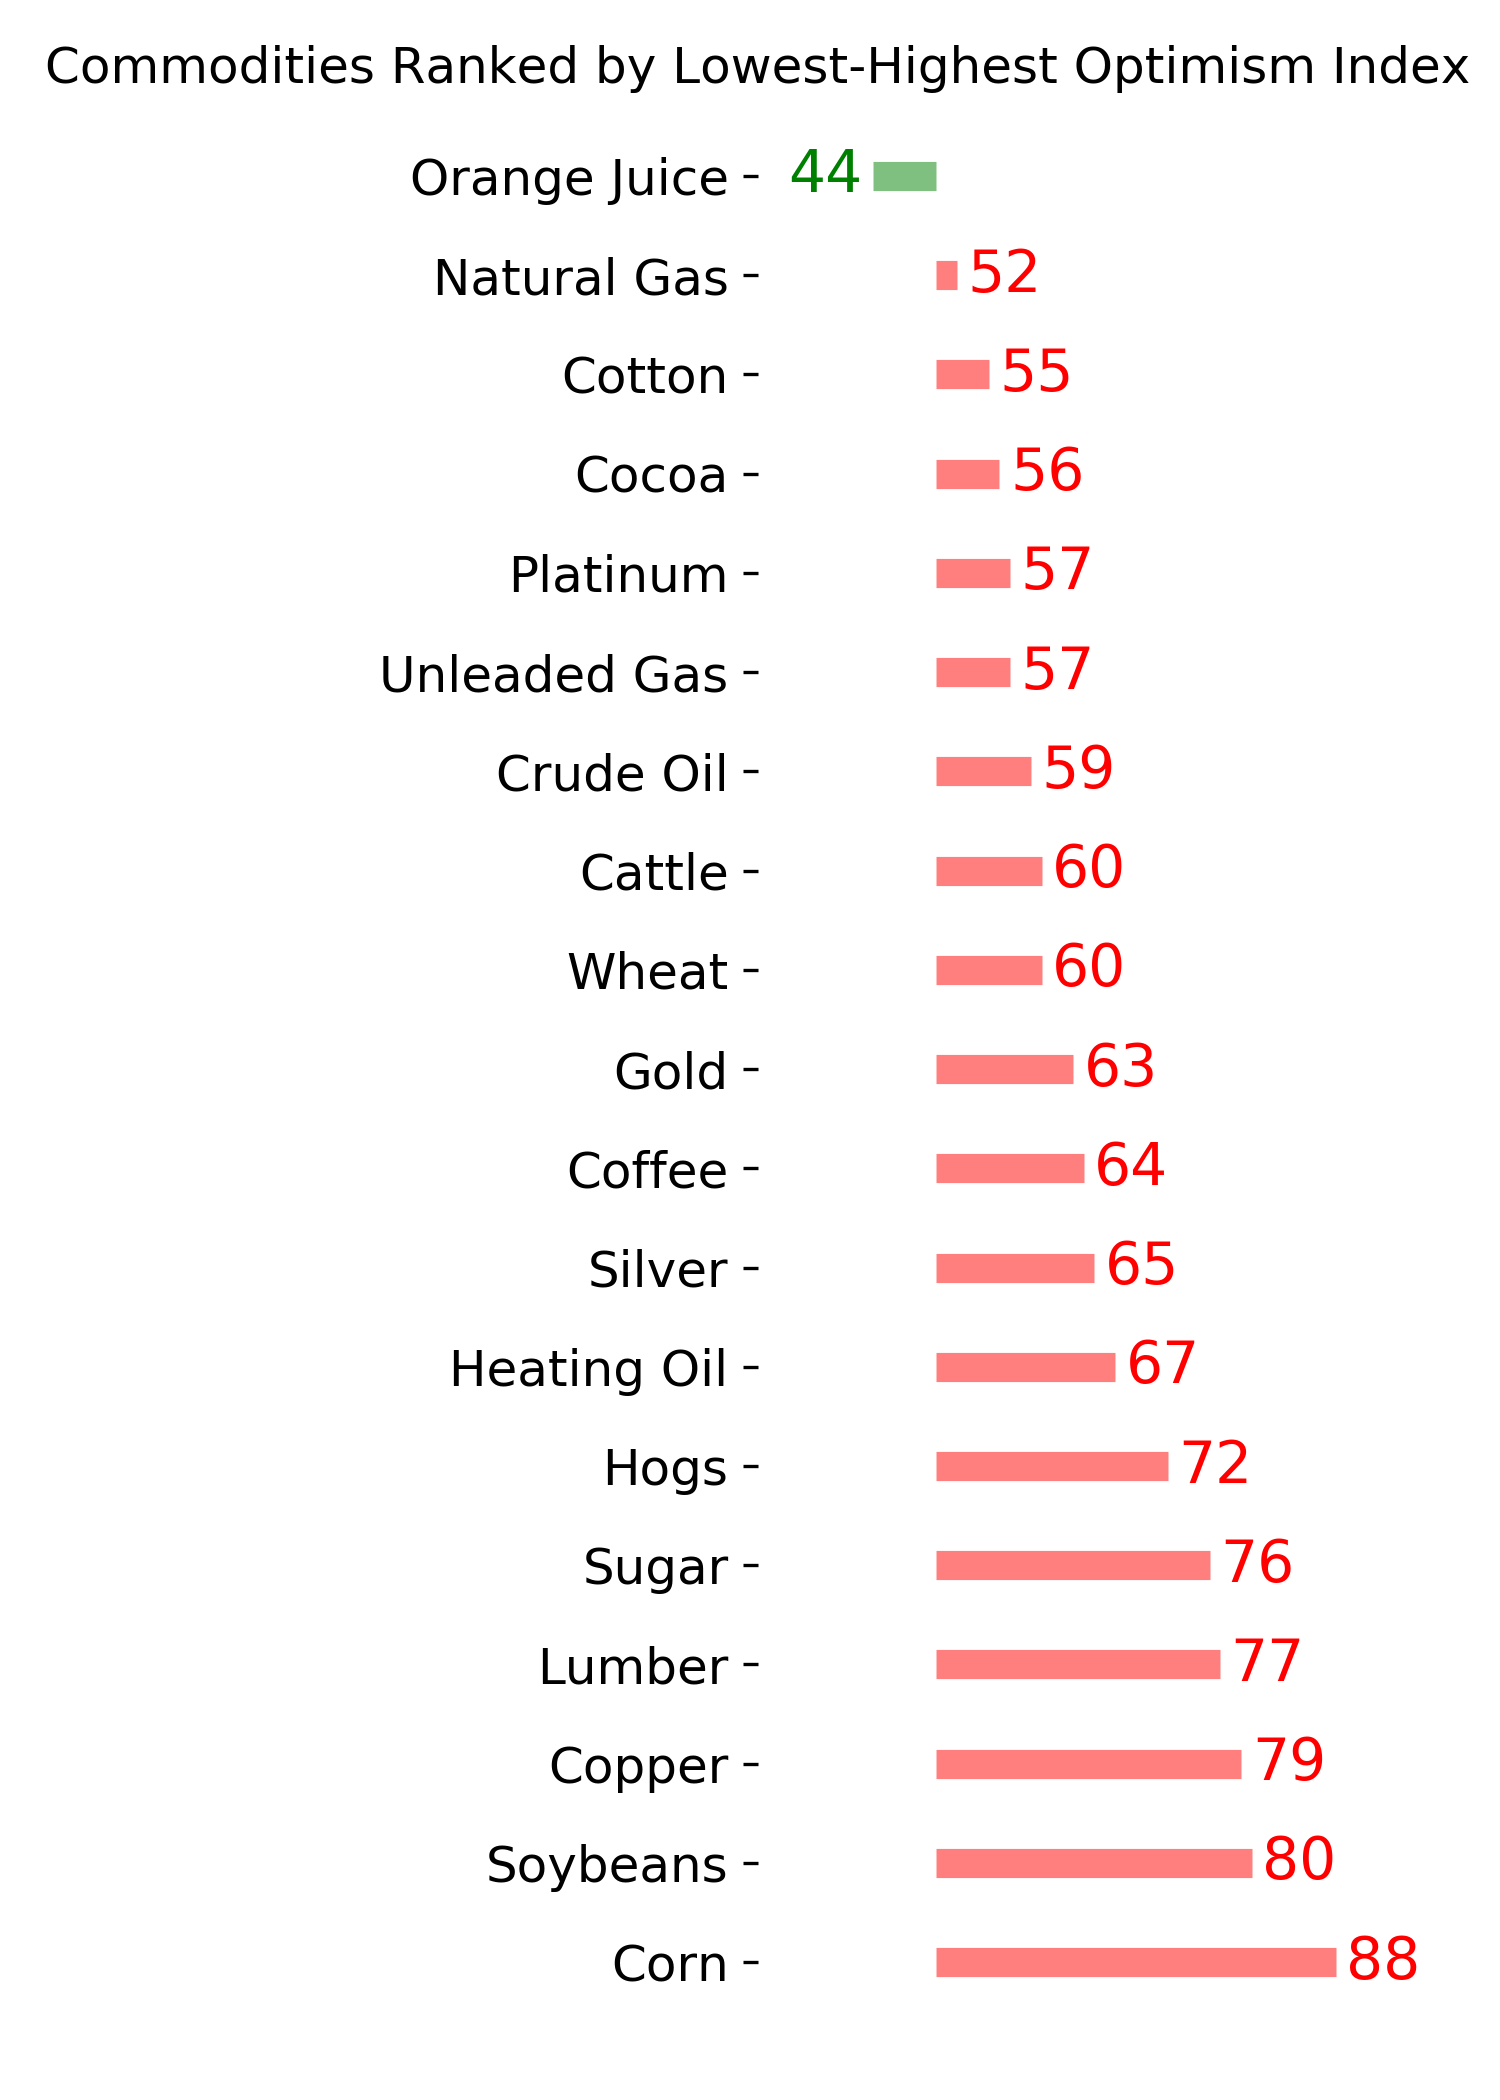
Commodity ETF's - 5-Day Moving Average
|
|