Headlines
|
|
Small Options Traders Are Storming Back:
The smallest of options traders picked up their speculative activity last week, increasing their call buying and reducing put buying. That moved the ROBO Put/Call Ratio to one of its lowest readings in the past year.
Bottom Line:
See the Outlook & Allocations page for more details on these summaries STOCKS: Hold
The speculative frenzy in February is wrung out. Internal dynamics have mostly held up, with some exceptions. Many of our studies still show a mixed to poor short-term view, with medium- and long-term ones turning more positive. BONDS: Hold
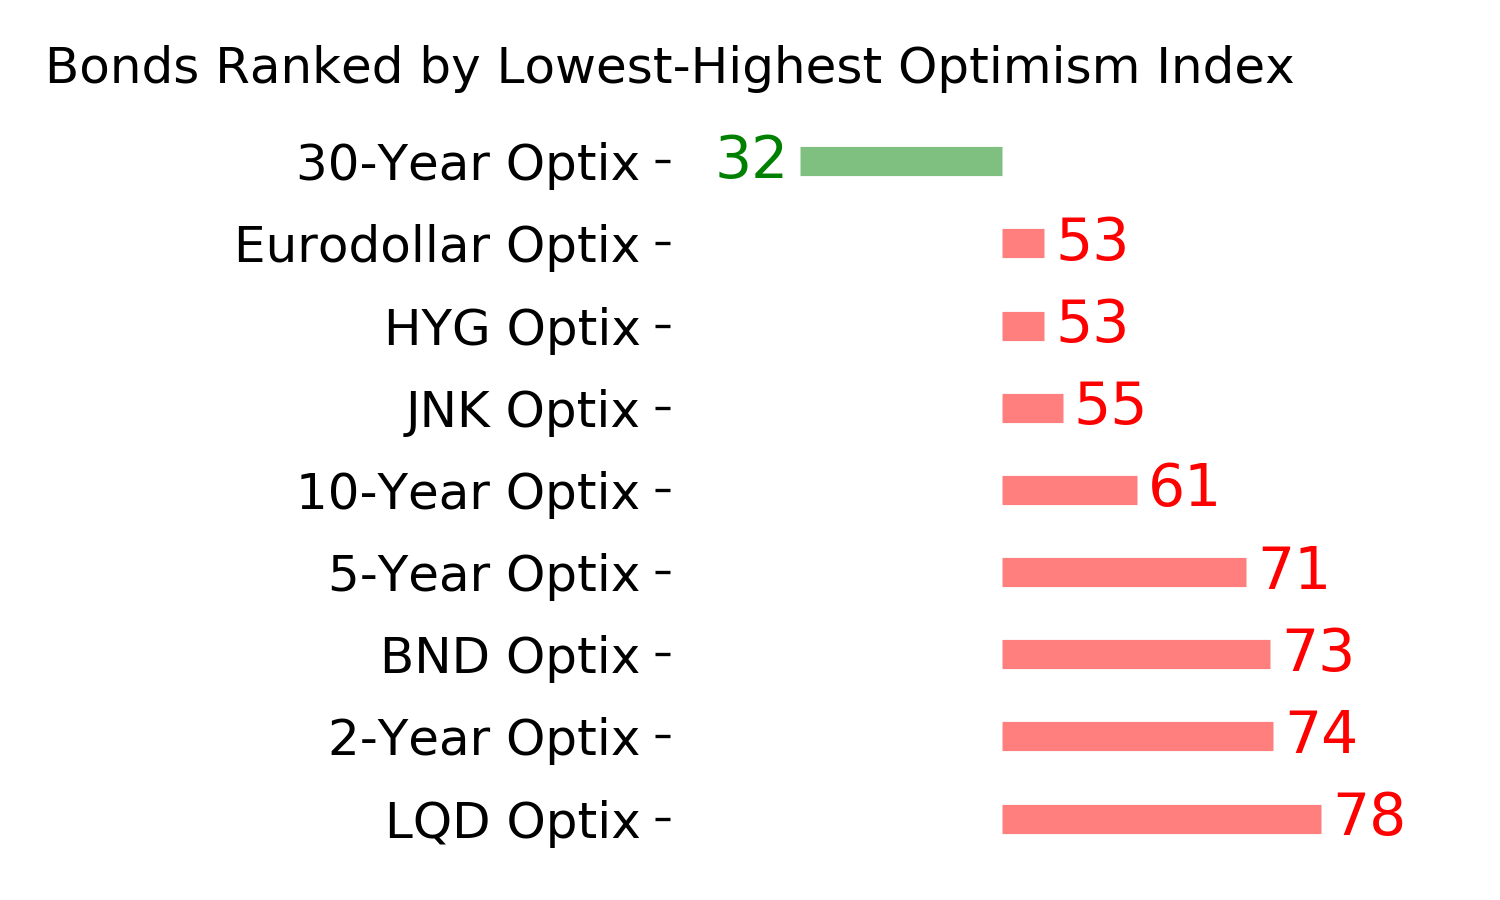
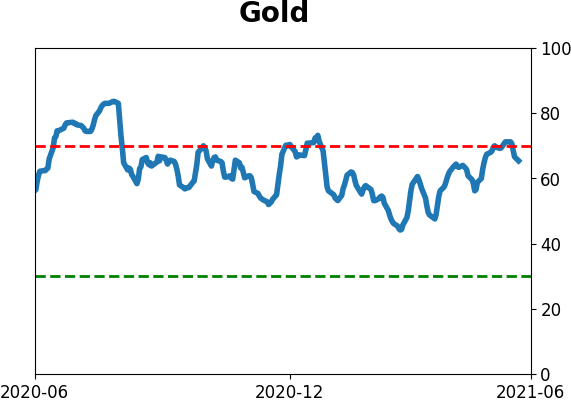
Various parts of the market got hit in March, with the lowest Bond Optimism Index we usually see during healthy environments. After a shaky couple of weeks, the broad bond market has modestly recovered. Not a big edge here either way. GOLD: Hold
Gold and miners have done very well, recovering above long-term trend lines. The issue is that both have tended to perform poorly after similar situations - will have to wait and see how it plays out.
|
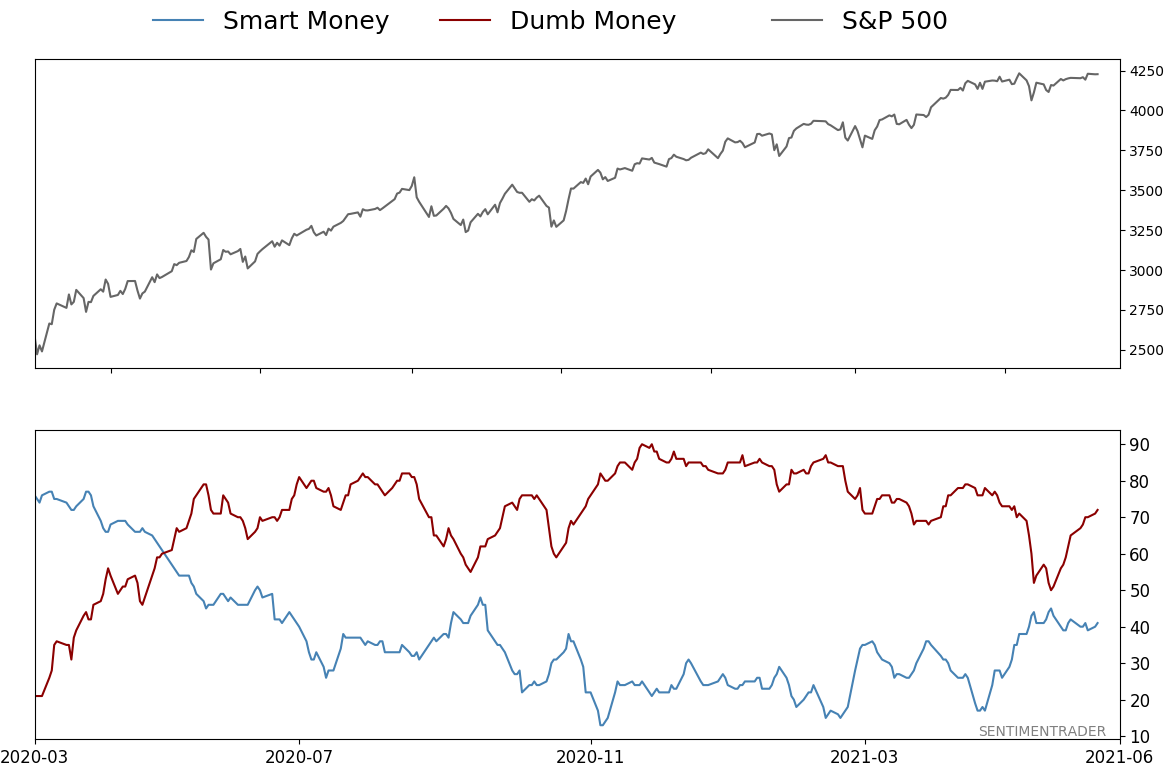
Smart / Dumb Money Confidence
|
Smart Money Confidence: 41%
Dumb Money Confidence: 72%
|
|
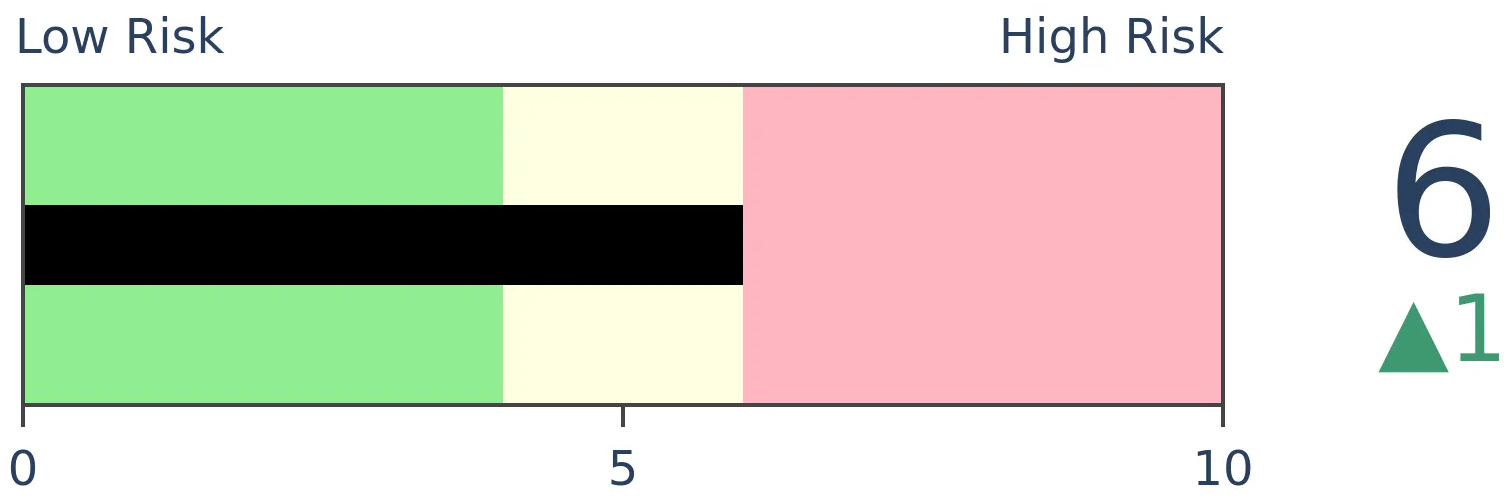
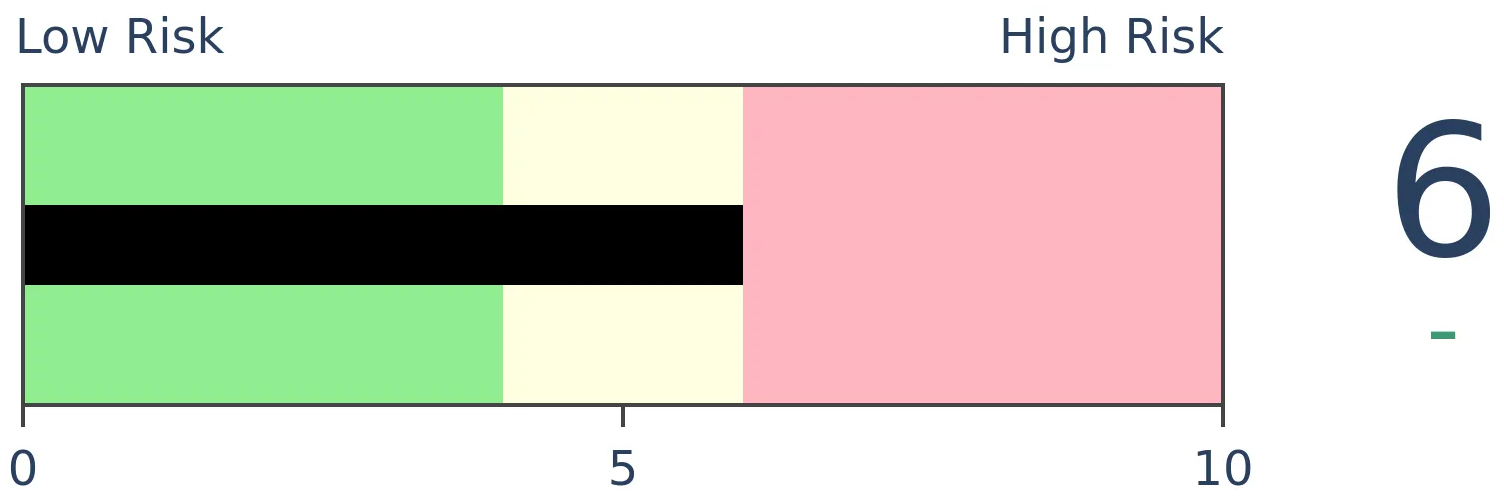
Risk Levels
Stocks Short-Term
|
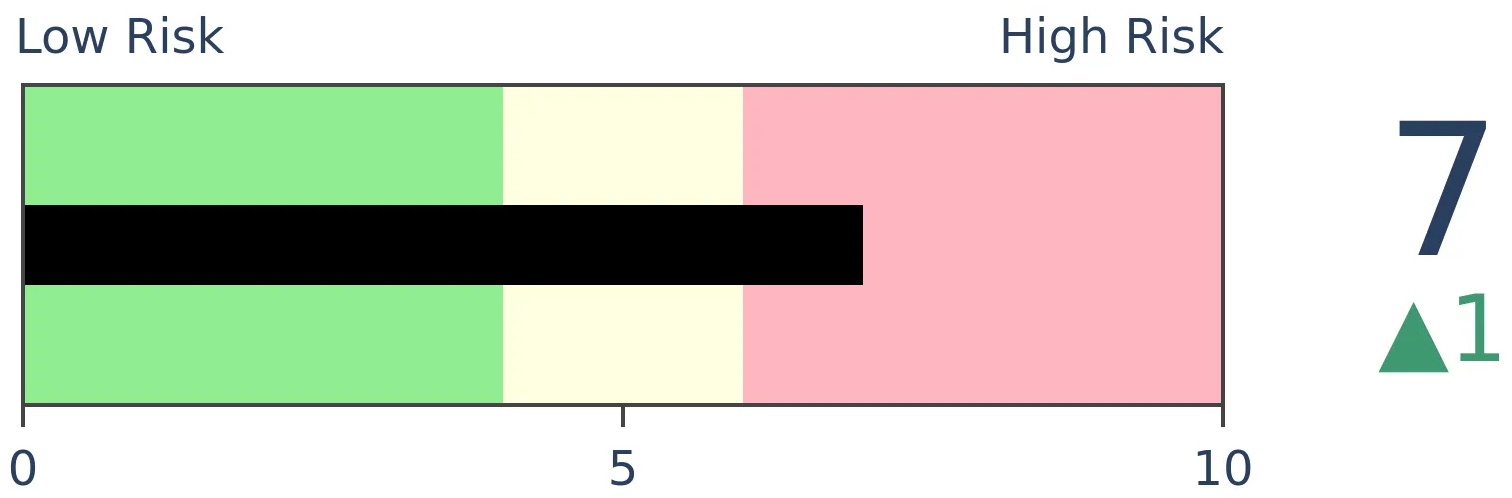
Stocks Medium-Term
|
|
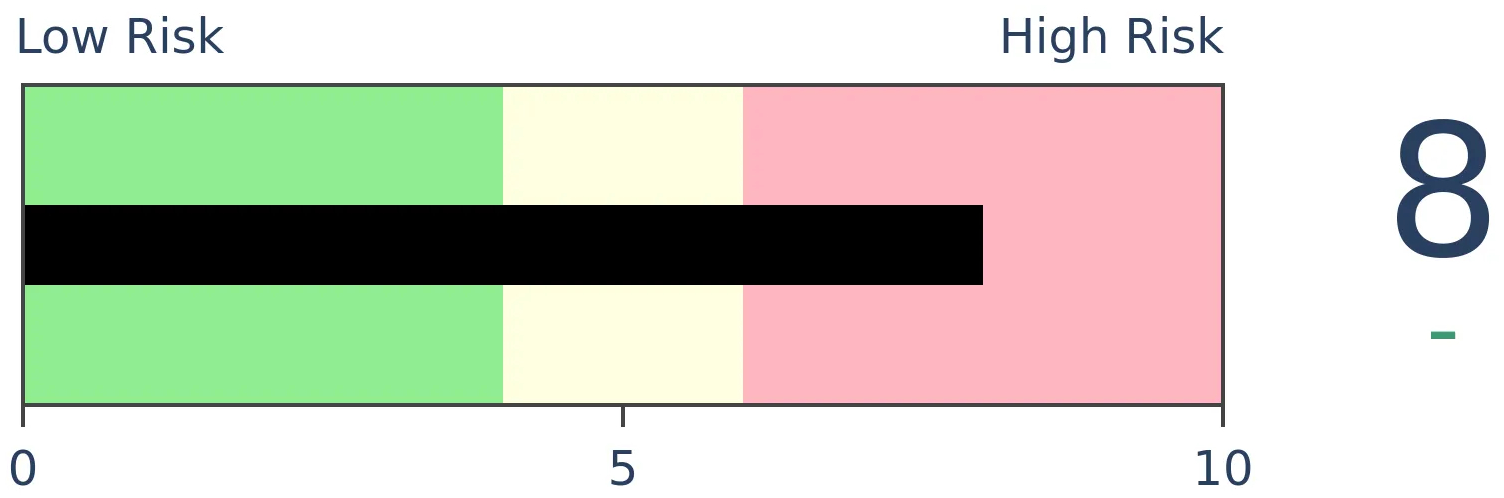
Bonds
|
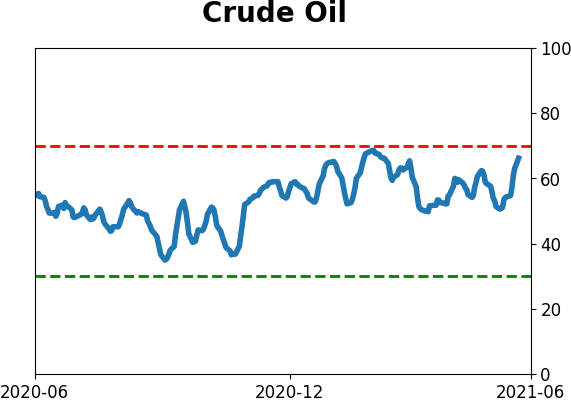
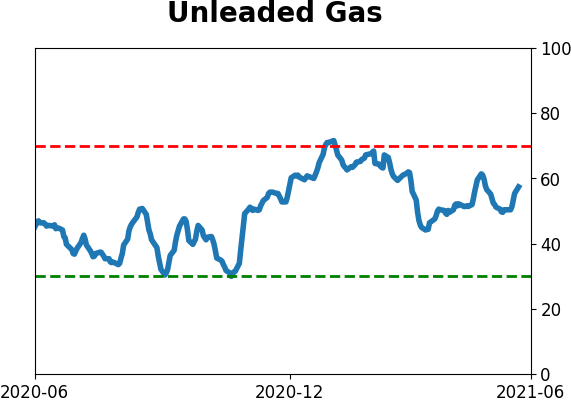
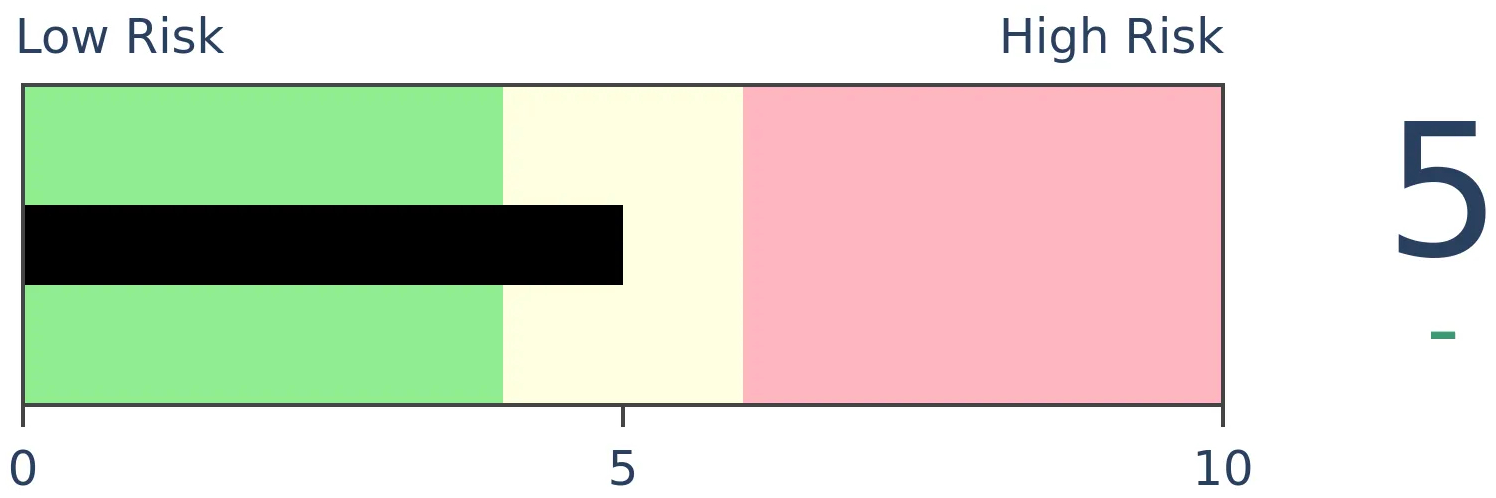
Crude Oil
|
|
Gold

|
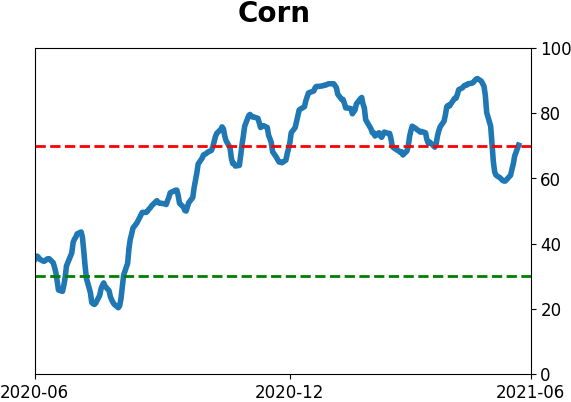
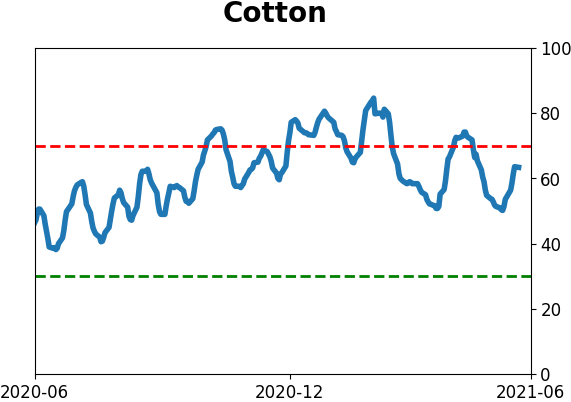
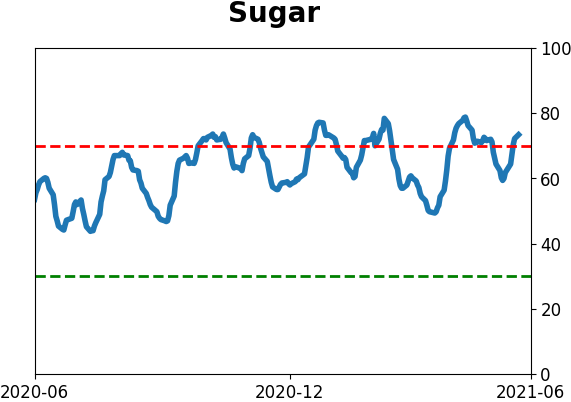
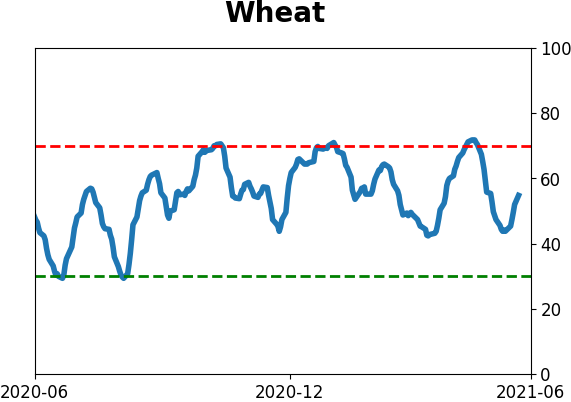
Agriculture
|
|
Research
BOTTOM LINE
The smallest of options traders picked up their speculative activity last week, increasing their call buying and reducing put buying. That moved the ROBO Put/Call Ratio to one of its lowest readings in the past year.
FORECAST / TIMEFRAME
None
|
With renewed interest in meme stocks and leveraged bets, the smallest of options traders are coming back.
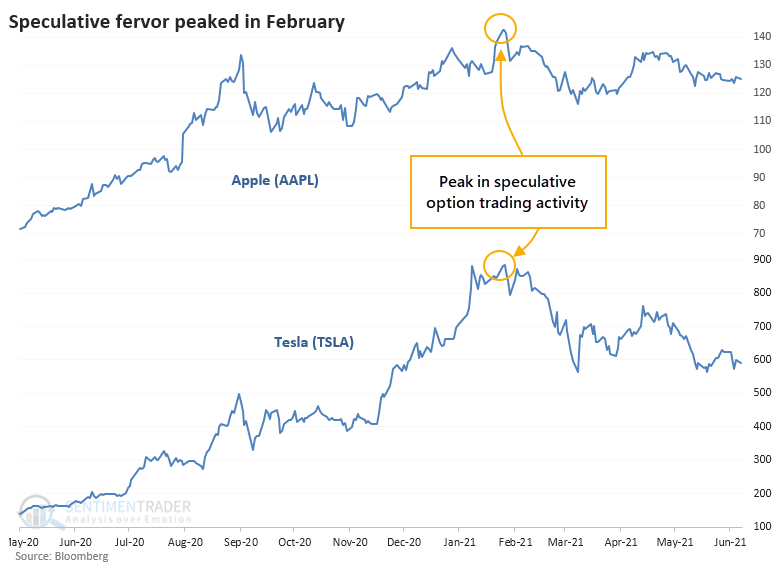
After a record orgy of speculative excess in February, many of these traders lost significant sums, or at least it can be safely assumed they did. Most of their buying activity was in nearer-term expiration months, and the two stocks most consistently at or near the top of the most active list have done nothing but drop since then.
All those call options likely expired worthless.
PREMIUMS ARE COMING DOWN
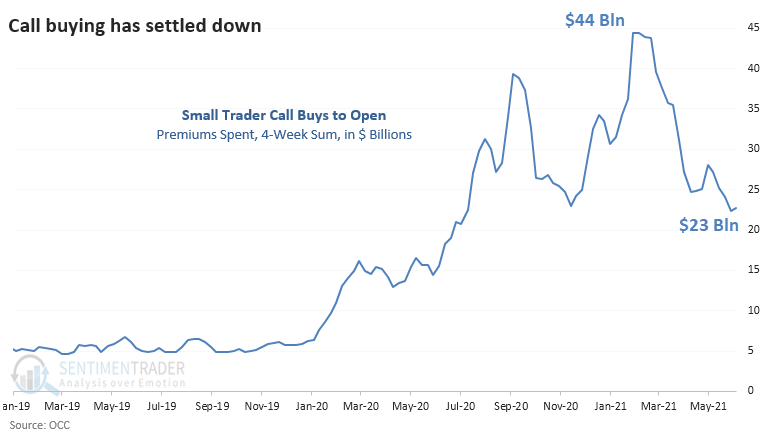
As noted in February, small traders had spent $44 billion on call premiums over the prior four weeks. Thanks to lower implied volatility and declining demand, premiums are down by more than half as of last week. Granted, that's still way above any prior extreme in the 20 years leading up to 2020, but at least it's the lowest since mid-November of last year.
Much of that drop in enthusiasm can be blamed on Apple and Tesla and a few other former highflyers, along with a general malaise in stocks.
INTEREST IS COMING BACK INTO EQUITY OPTIONS
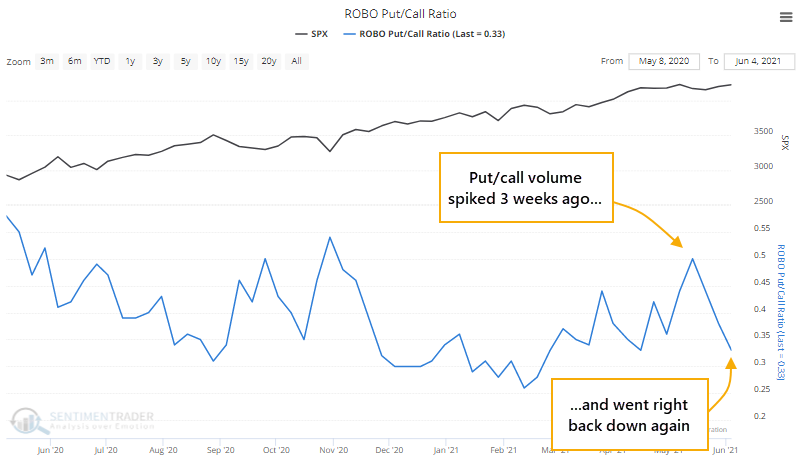
But last week, there was a jump in small trader call buying and a drop in put buying. That means the ROBO Put/Call Ratio plunged near its lows once again. The ratio compares volume in put buying to open from the smallest of traders to the volume of their call buying. The lower the ratio, the less hedging activity is happening.
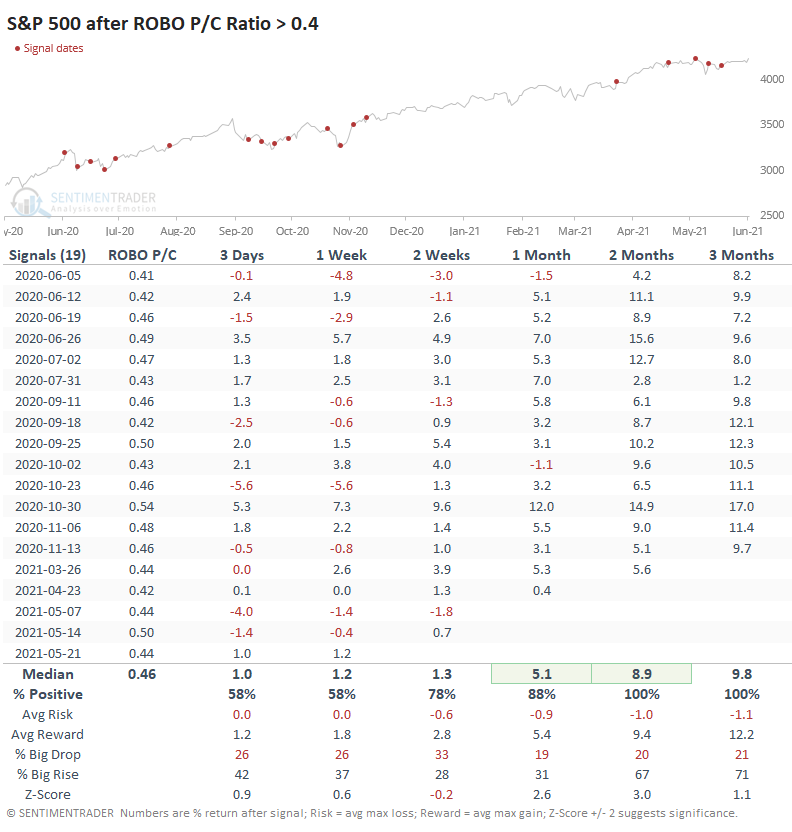
If we focus just on this past year, then any after any week when the ratio was above 0.4, the S&P performed very well going forward.
We're now a couple of weeks past that last "extreme," and the ratio has dropped toward its lower boundary. And after those weeks, returns were significantly worse.
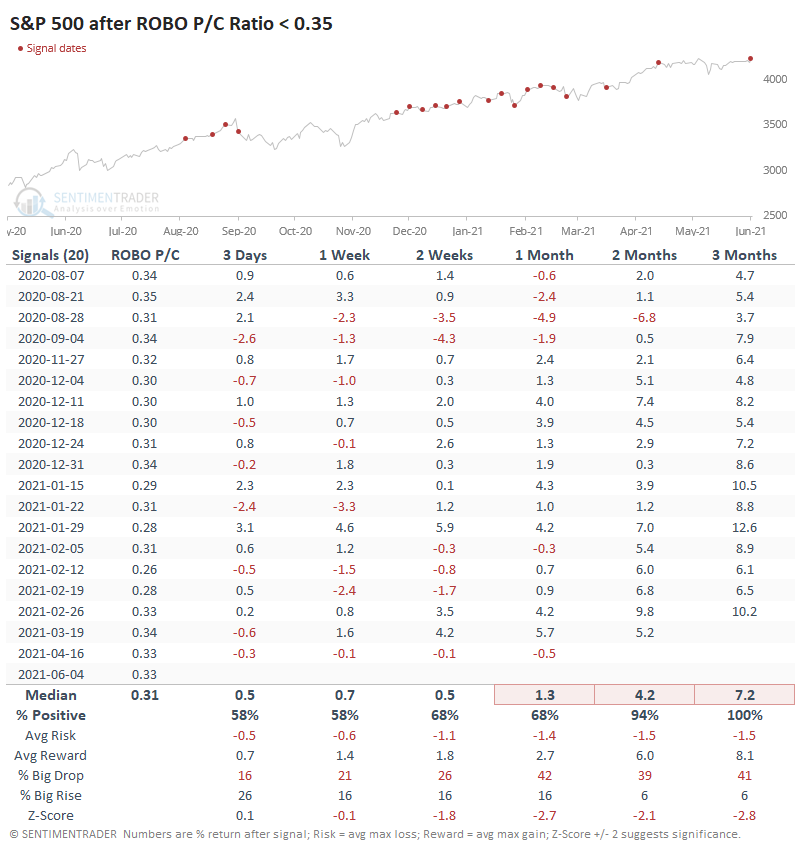
The average returns in the S&P after those weeks were still positive but were mostly well below a random return during the year. For example, the S&P averaged only +1.3% during the next month versus +5.1% after those weeks when the ratio was near its upper boundary.
STILL SOME INTEREST IN INDEX HEDGING
It's interesting that even though small traders are rushing back into call options on individual stocks, total open interest on two benchmark vehicles is still skewed toward the put side.
The Put/Call Open Interest Ratio for both the S&P 500 index and the SPY ETF is above 1.9, meaning nearly two put options are outstanding for every call.
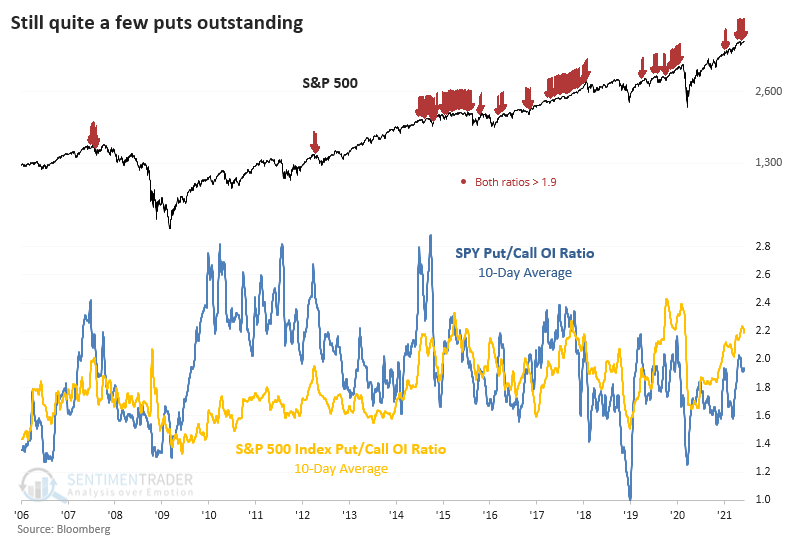
Open interest on indexes is typically best interpreted as a non-contrary indicator. The more puts there are outstanding relative to calls, the worse the S&P tends to perform going forward. It's not like it's an outright sell signal - that would have failed miserably in 2017 - it's more of a general warning that future gains tend to be limited and prone to reversals.
Historically, all of the option data is still showing extreme enthusiasm in individual stocks. If you blocked out the past year and looked at last week's reading compared to anything from the prior 20 years, we'd be pounding the table about speculative excess. So, while activity is down significantly from the February peak, it's still high compared to any other time period, and last week shows that traders are still willing to jump on the leveraged bandwagon yet again, even after what were likely some devastating losses in February and March. That isn't enough to suggest a sell signal here, but it is enough to be suspicious about the idea of sustained breakaway gains.
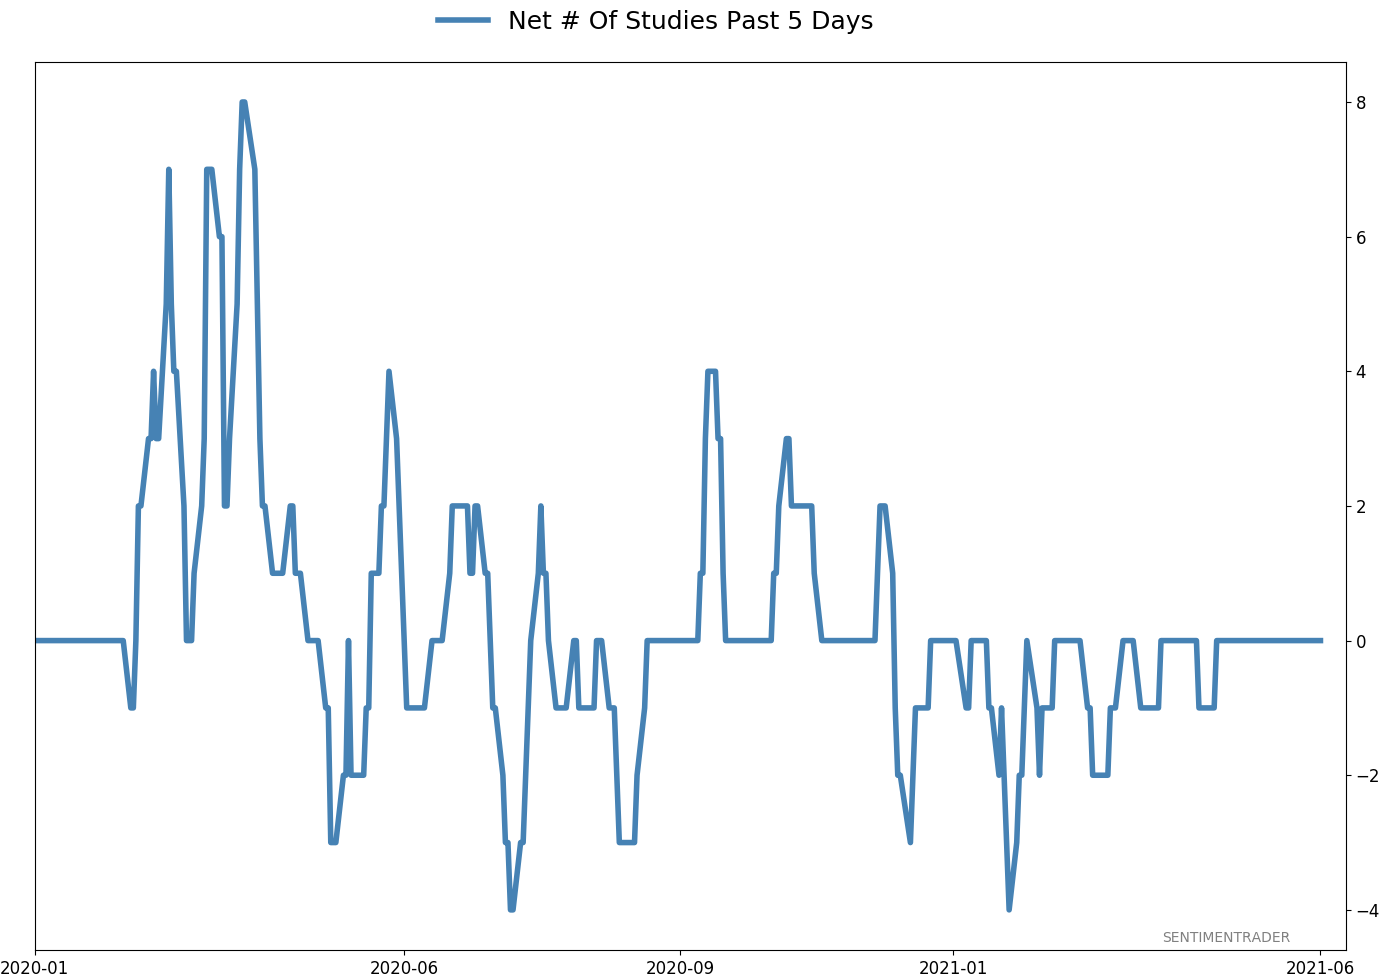
Active Studies
| Time Frame | Bullish | Bearish | | Short-Term | 0 | 0 | | Medium-Term | 1 | 11 | | Long-Term | 11 | 5 |
|
Indicators at Extremes
Portfolio
| Position | Description | Weight % | Added / Reduced | Date | | Stocks | RSP | 4.1 | Added 4.1% | 2021-05-19 | | Bonds | 23.9% BND, 6.9% SCHP | 30.7 | Reduced 7.1% | 2021-05-19 | | Commodities | GCC | 2.6 | Reduced 2.1%
| 2020-09-04 | | Precious Metals | GDX | 5.6 | Reduced 4.2% | 2021-05-19 | | Special Situations | 4.3% XLE, 2.2% PSCE | 7.6 | Reduced 5.6% | 2021-04-22 | | Cash | | 49.4 | | |
|
Updates (Changes made today are underlined)
Much of our momentum and trend work has remained positive for several months, with some scattered exceptions. Almost all sentiment-related work has shown a poor risk/reward ratio for stocks, especially as speculation drove to record highs in exuberance in February. Much of that has worn off, and most of our models are back toward neutral levels. There isn't much to be excited about here. The same goes for bonds and even gold. Gold has been performing well lately and is back above long-term trend lines. The issue is that it has a poor record of holding onto gains when attempting a long-term trend change like this, so we'll take a wait-and-see approach. RETURN YTD: 10.1% 2020: 8.1%, 2019: 12.6%, 2018: 0.6%, 2017: 3.8%, 2016: 17.1%, 2015: 9.2%, 2014: 14.5%, 2013: 2.2%, 2012: 10.8%, 2011: 16.5%, 2010: 15.3%, 2009: 23.9%, 2008: 16.2%, 2007: 7.8%
|
|
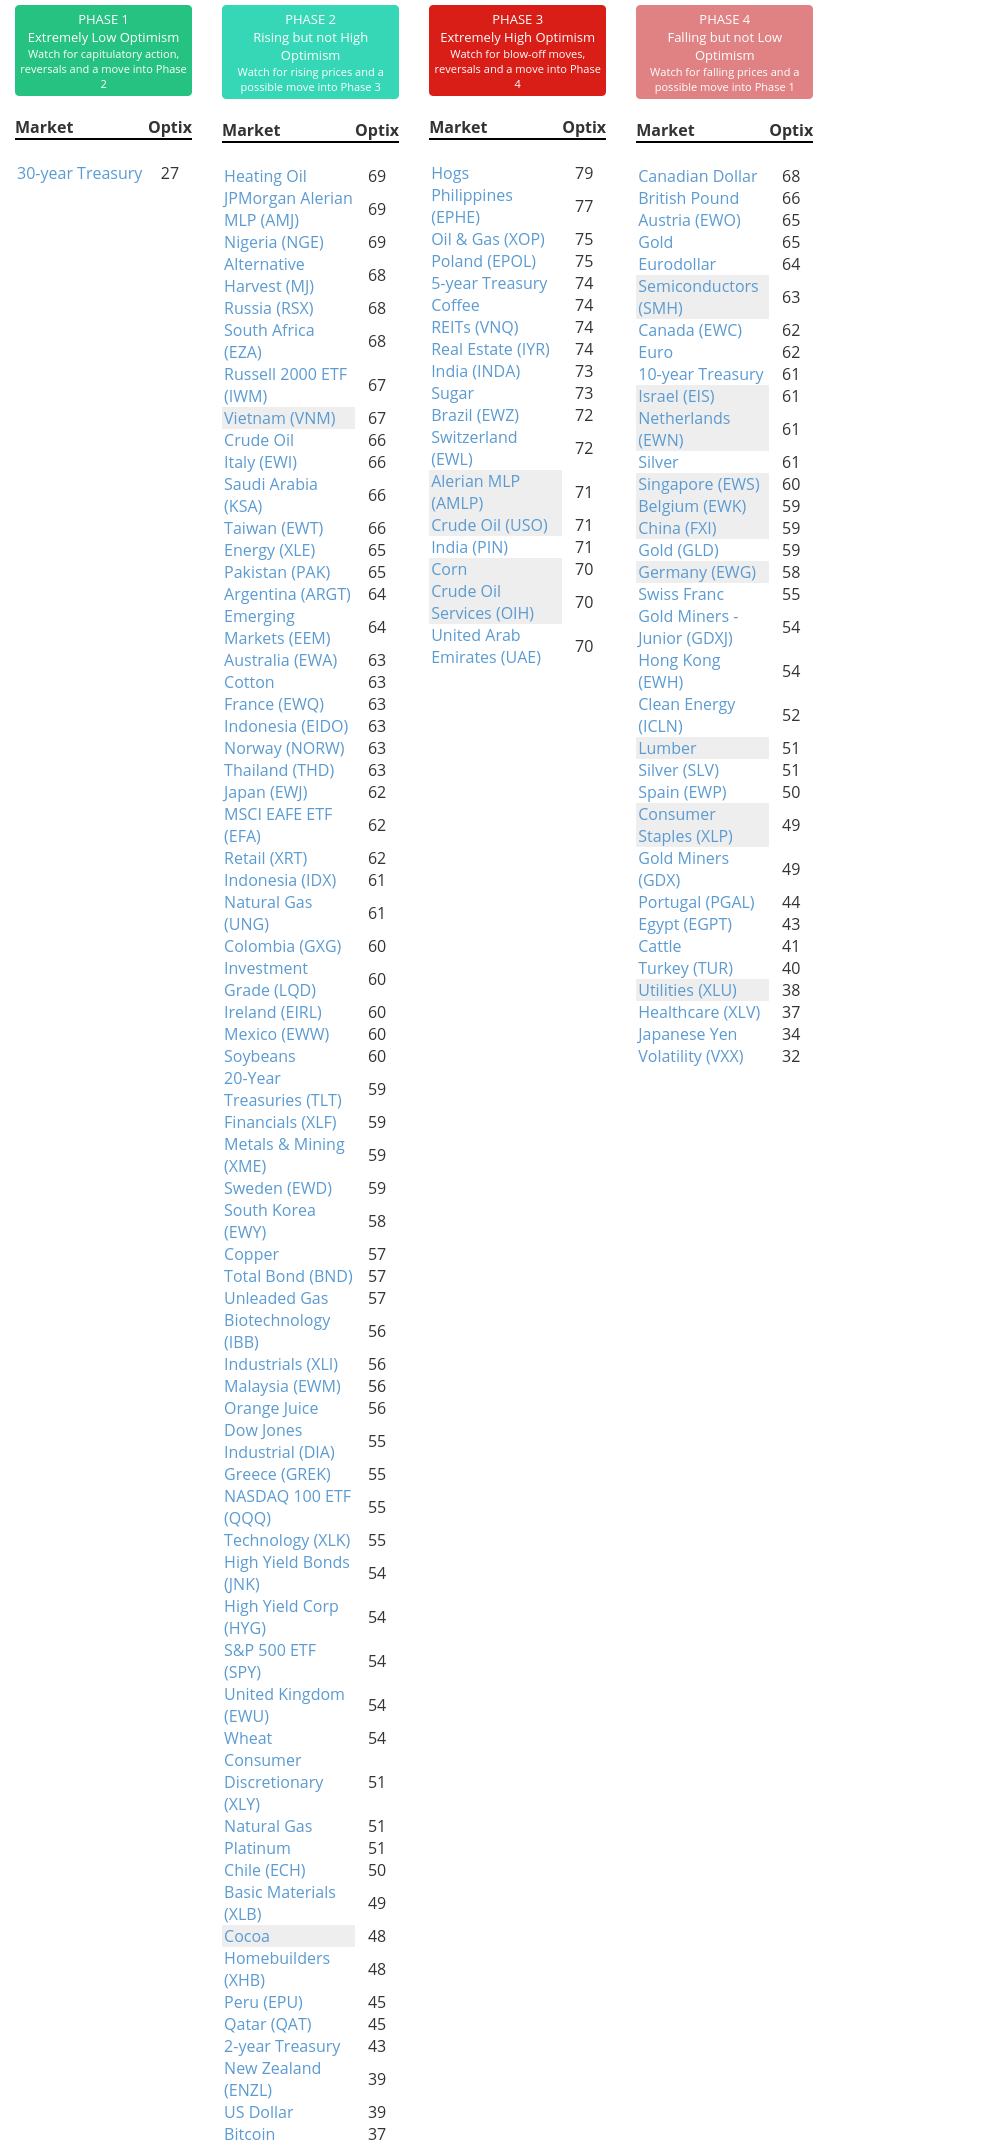
Phase Table
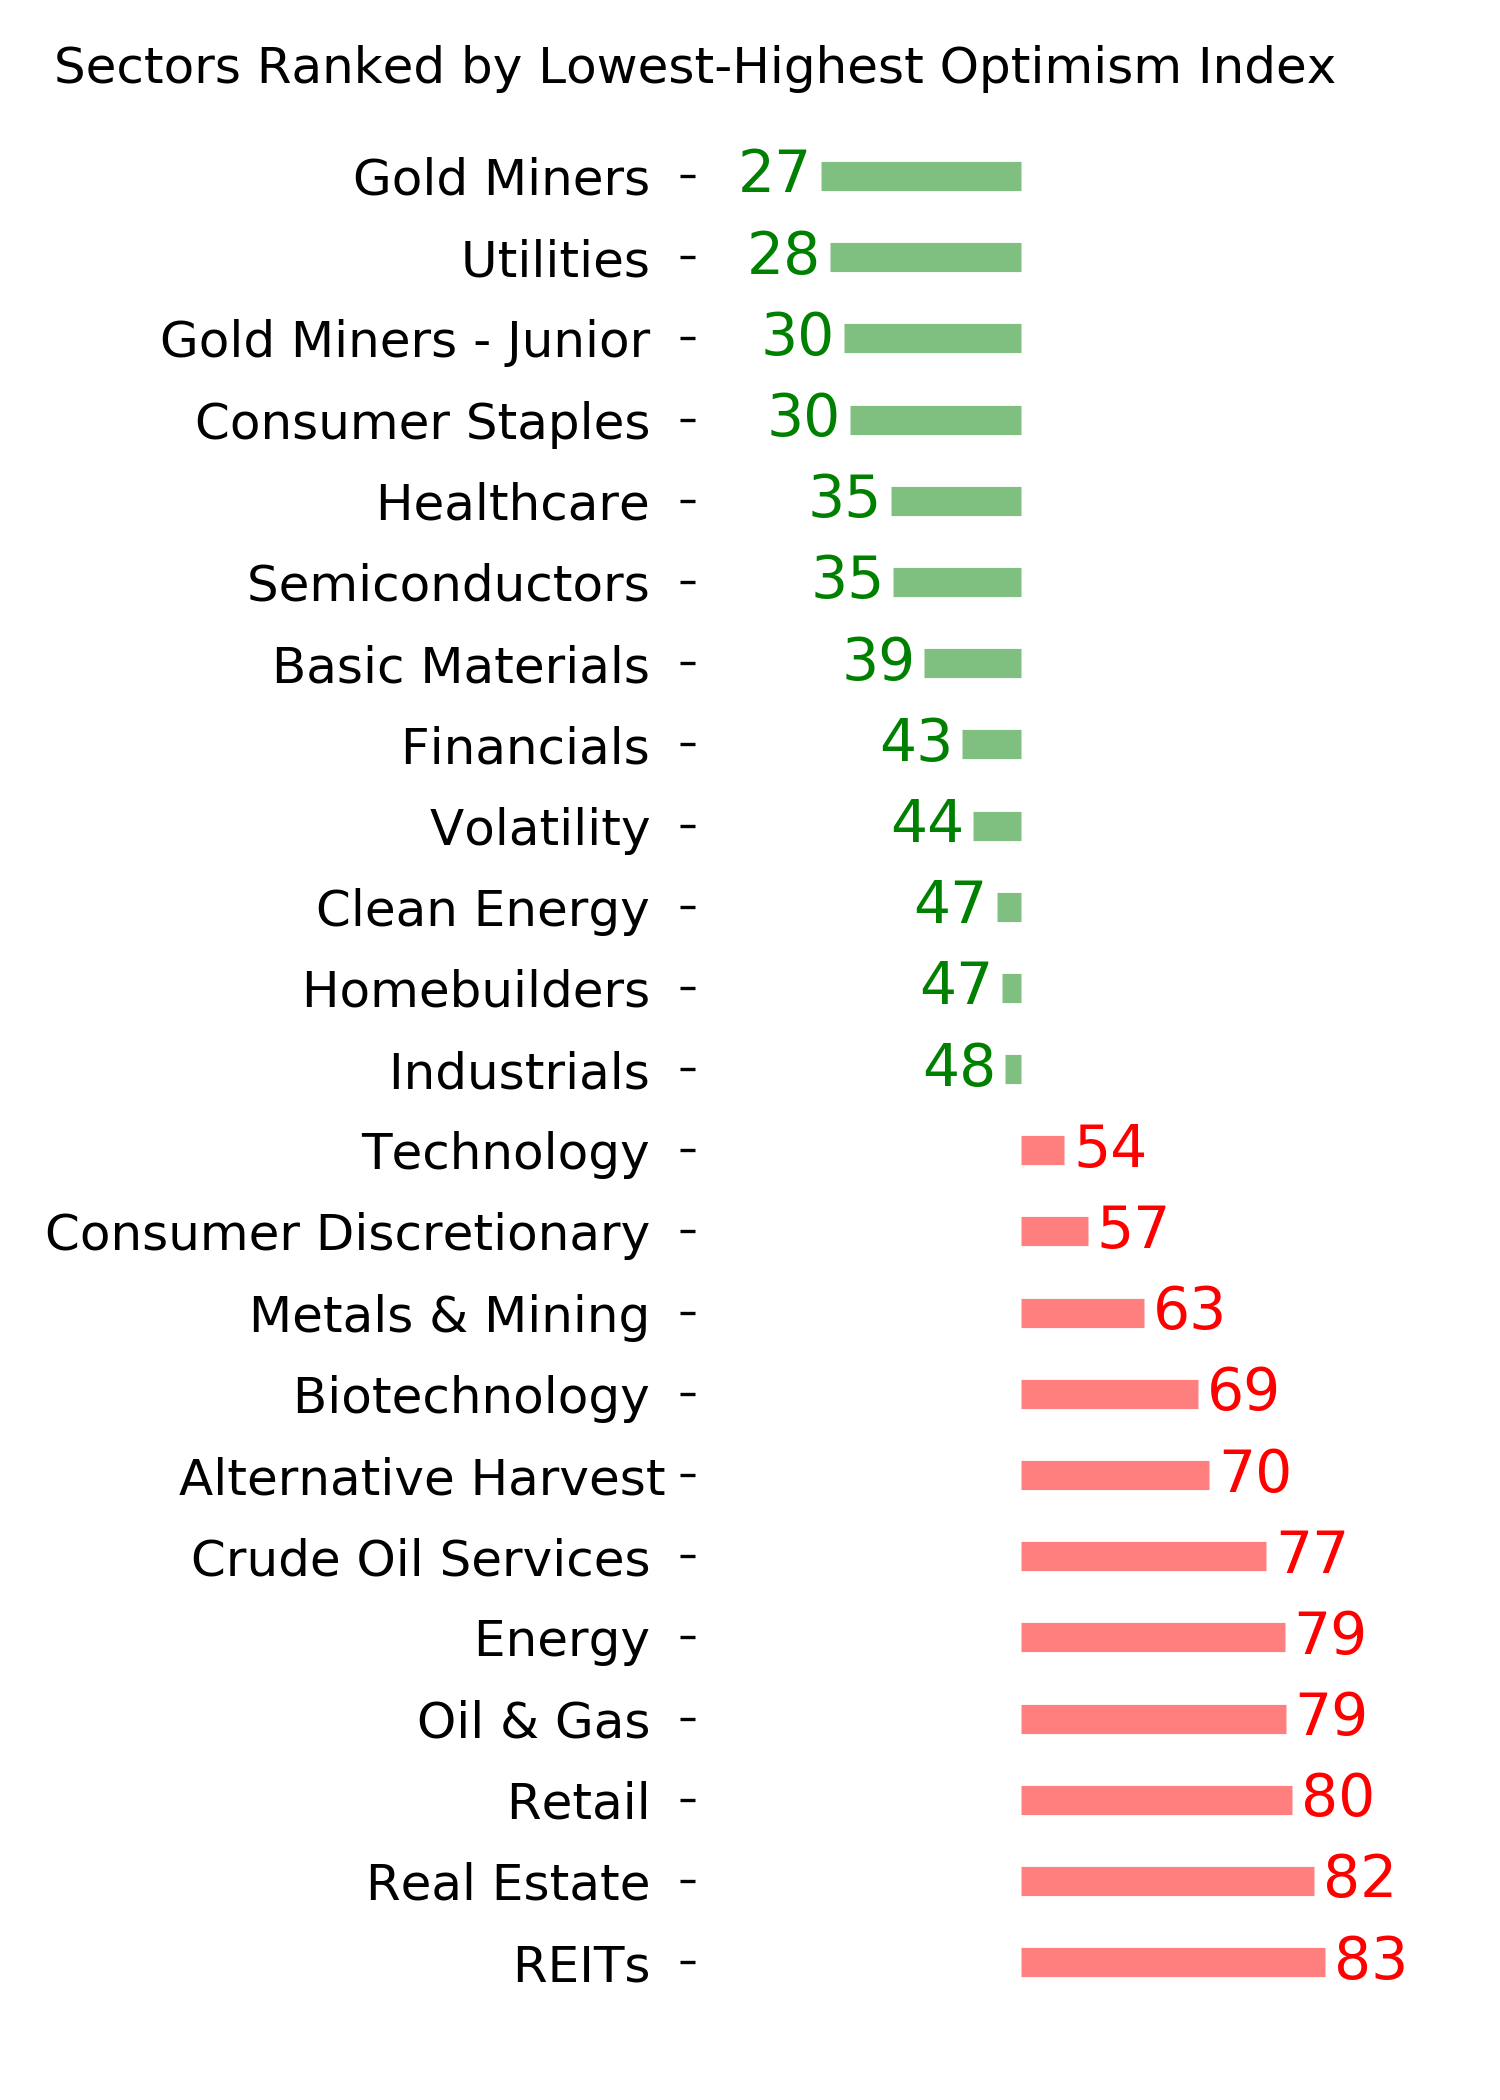
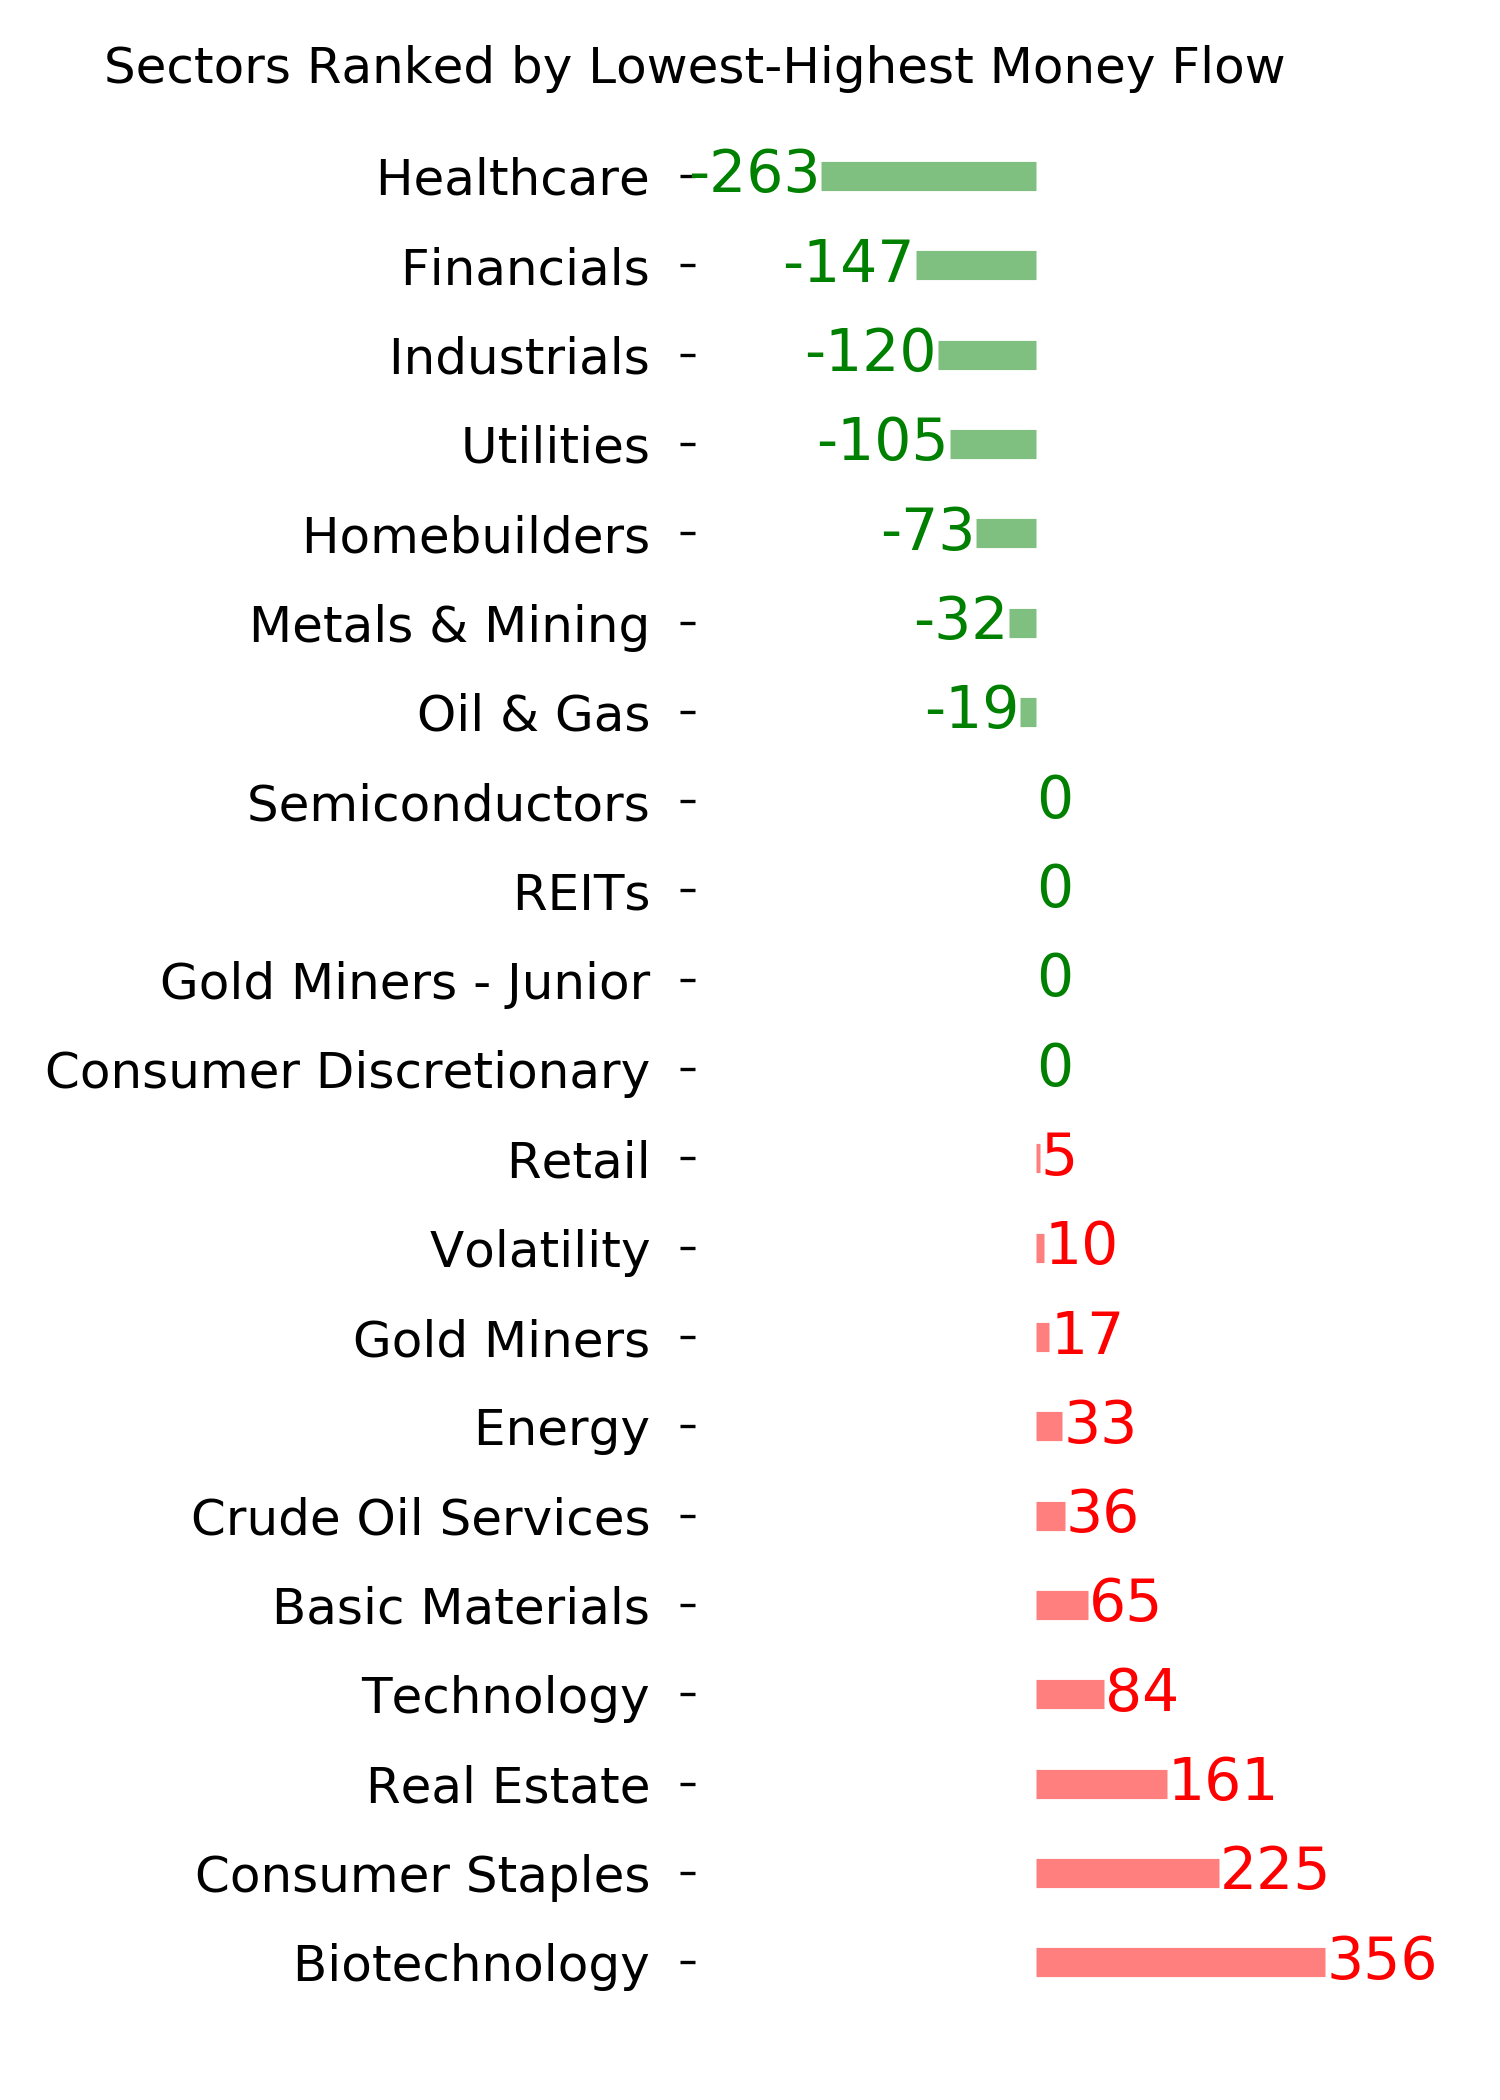
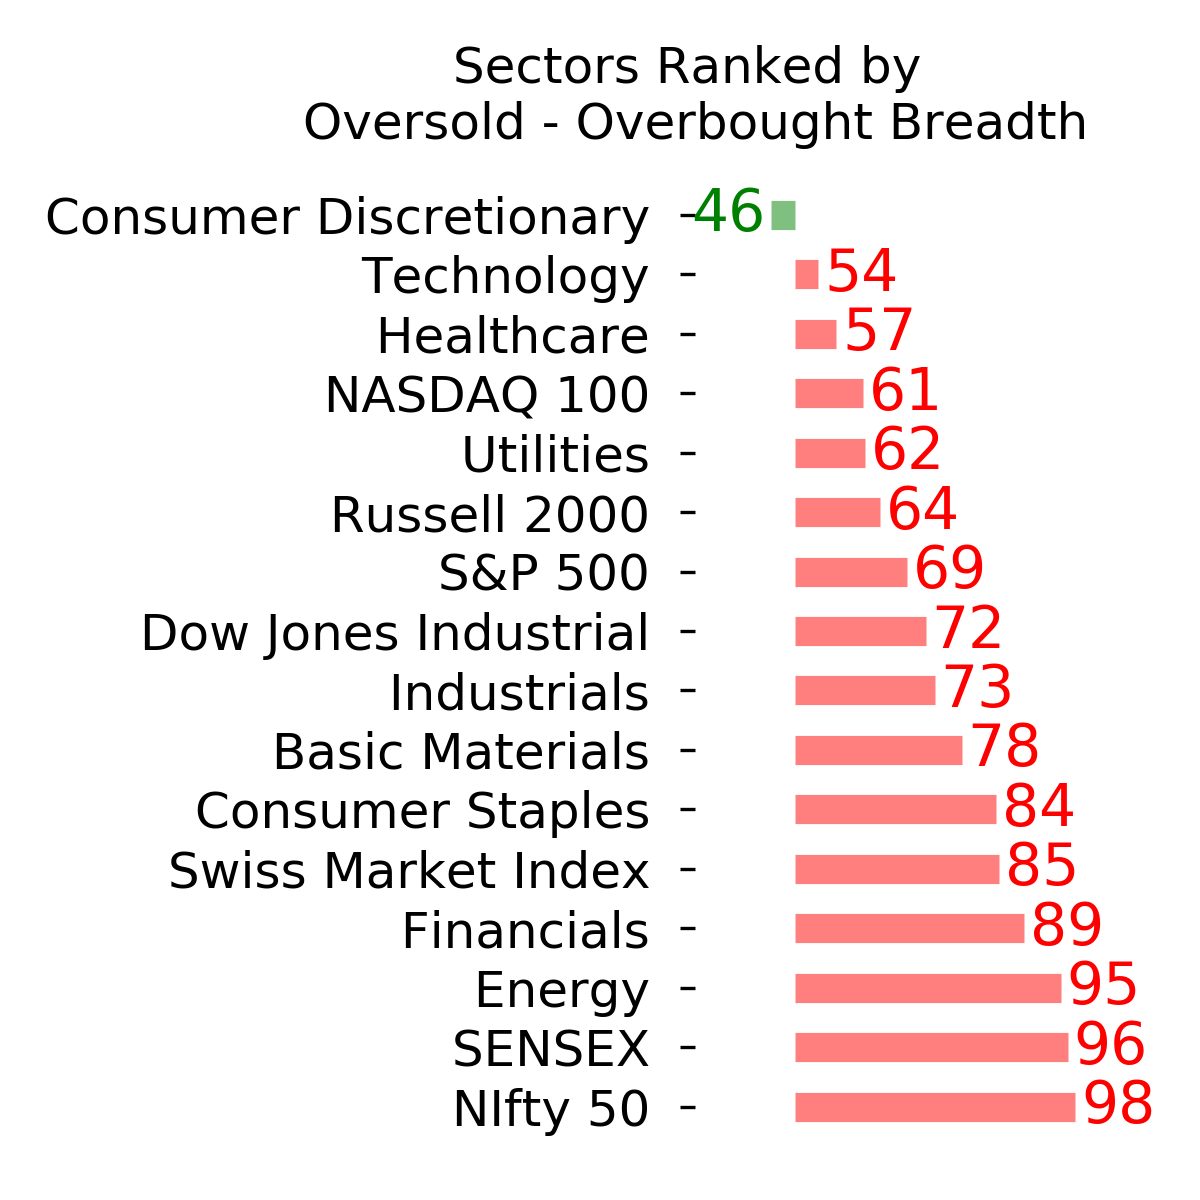
Ranks
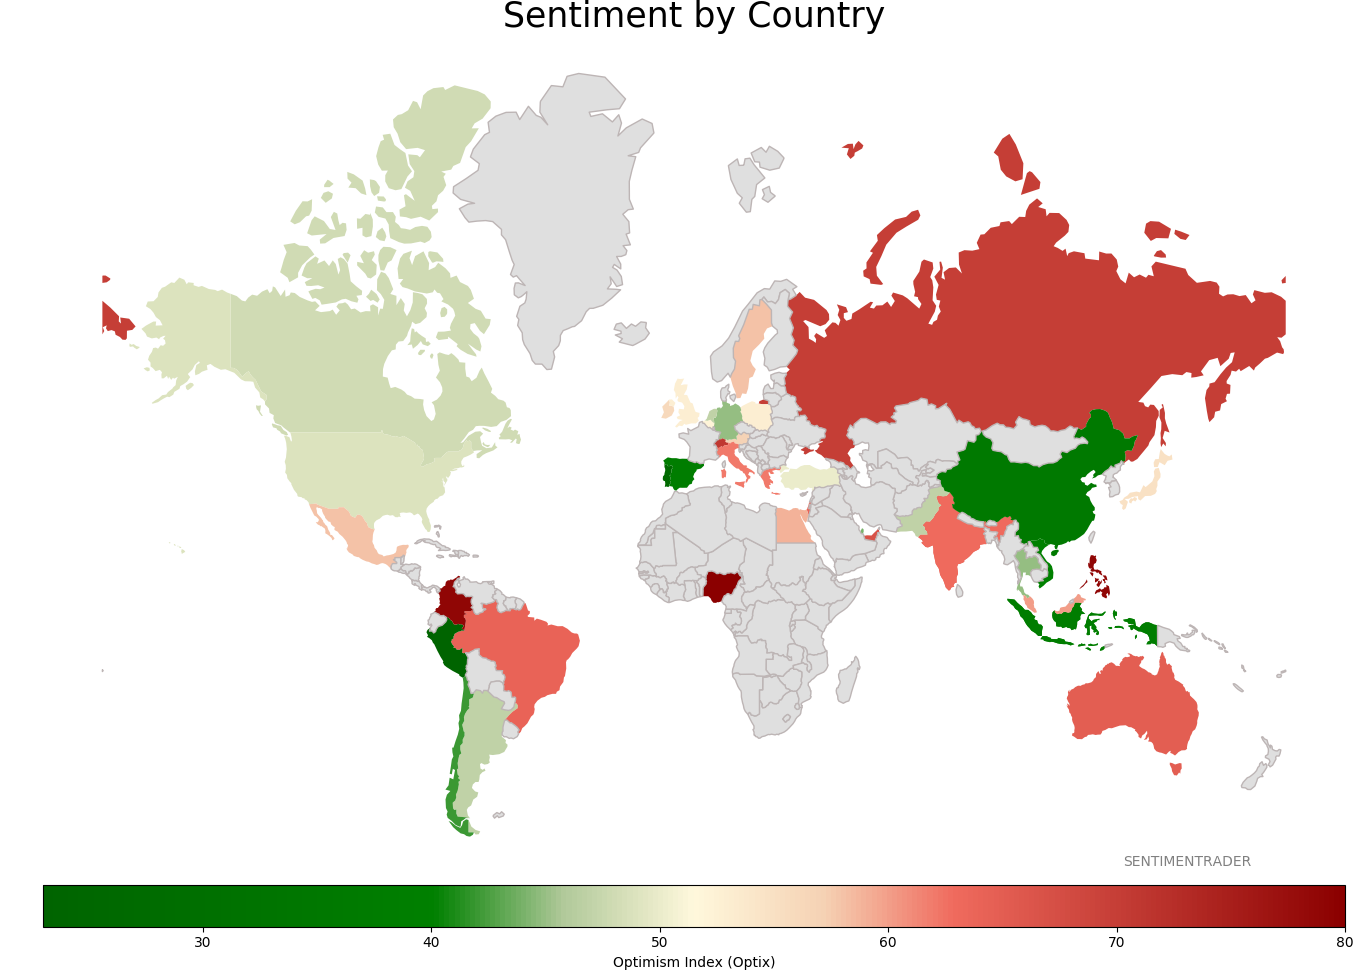
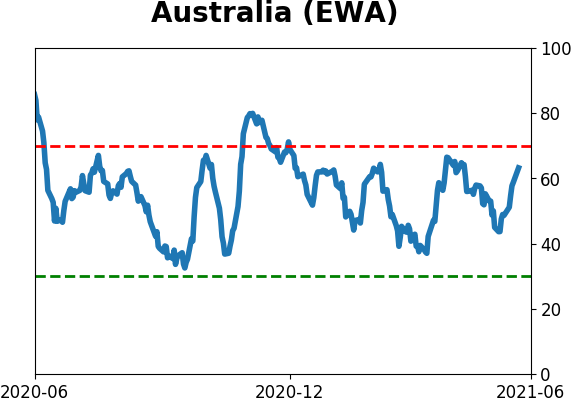
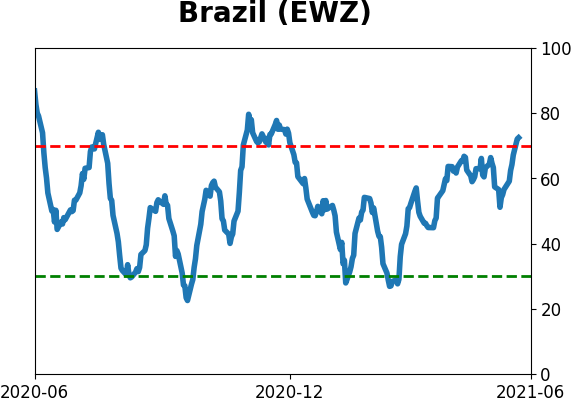
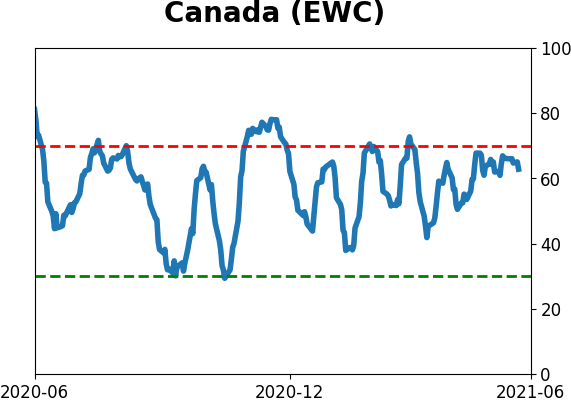
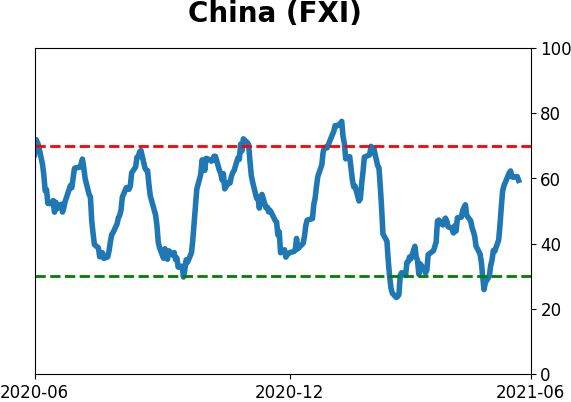
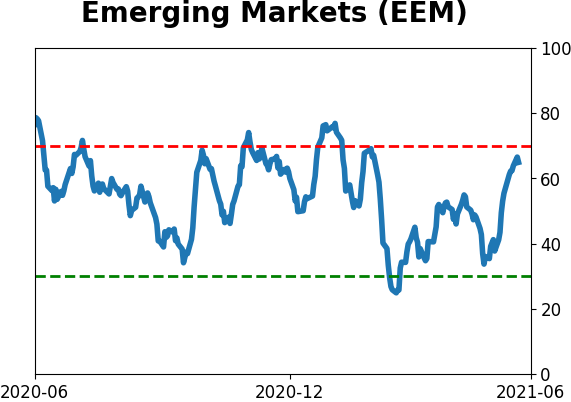
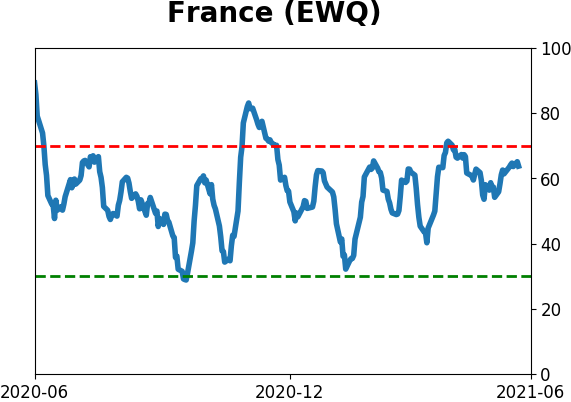
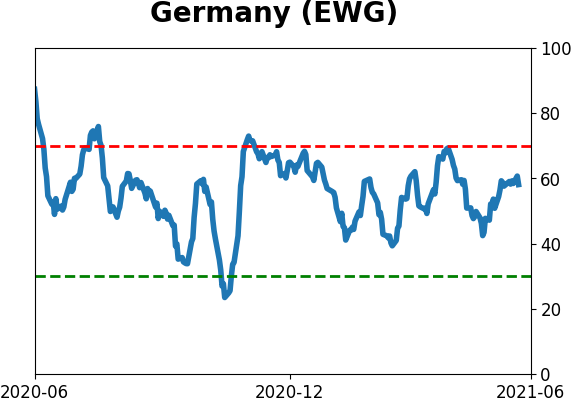
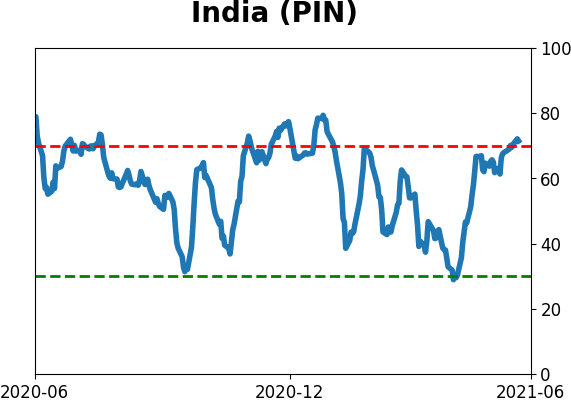
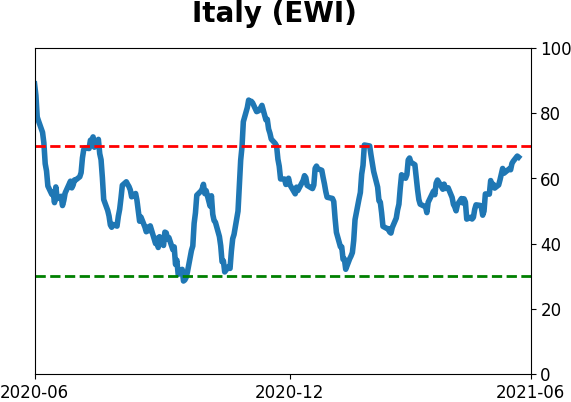
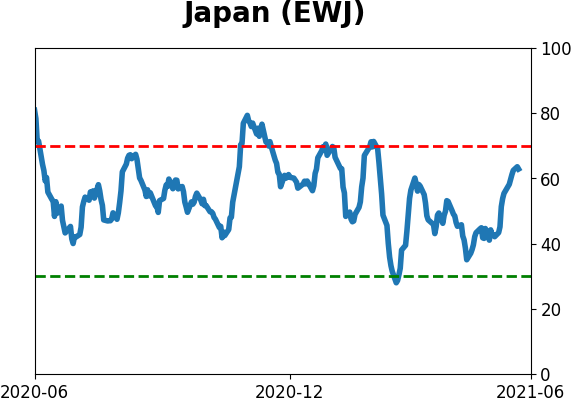
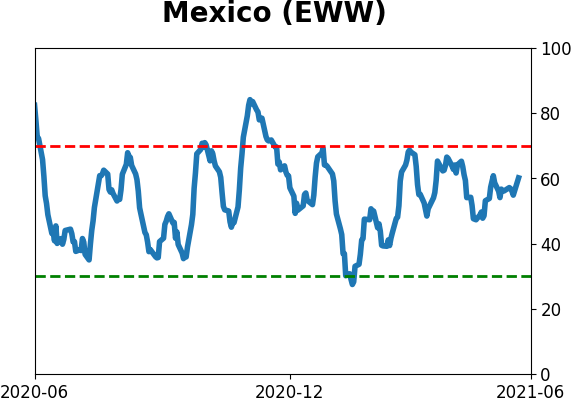
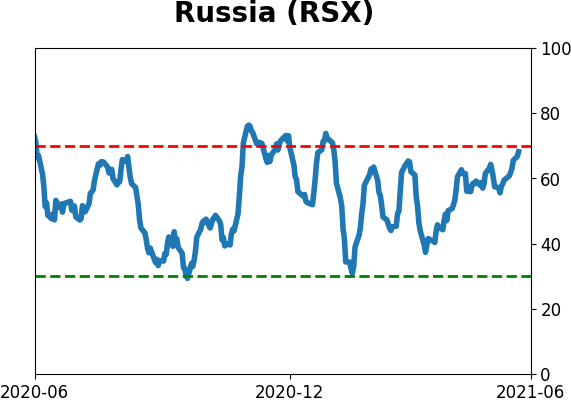
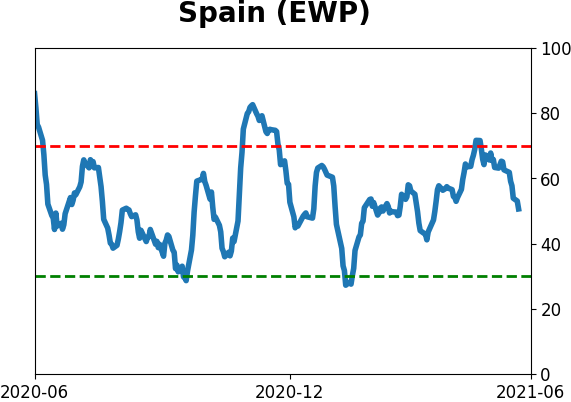
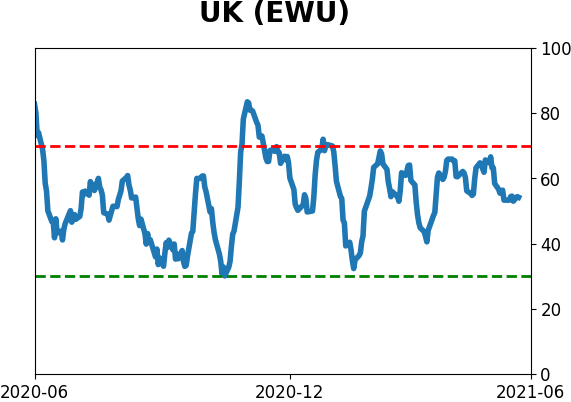
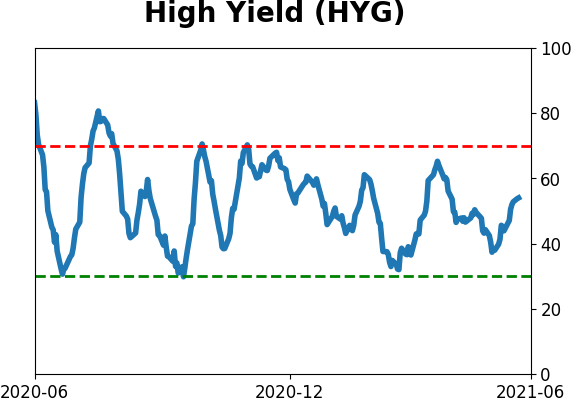
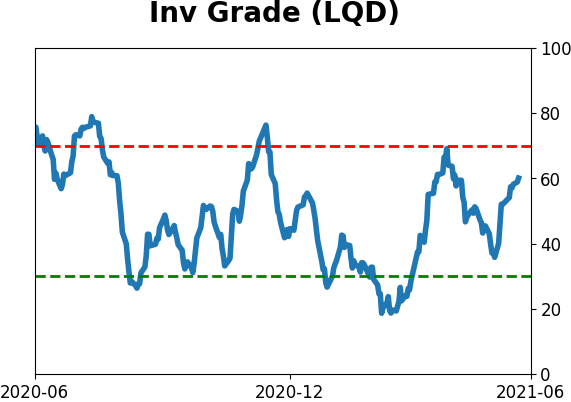
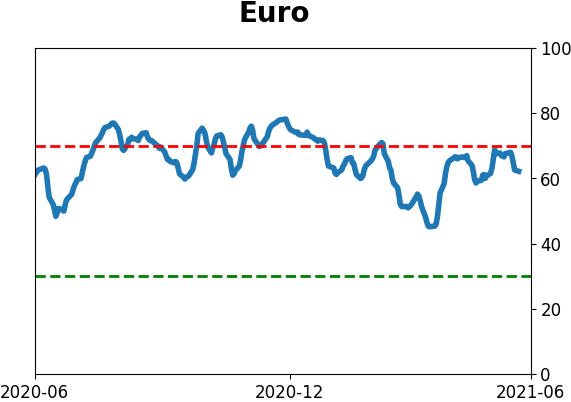
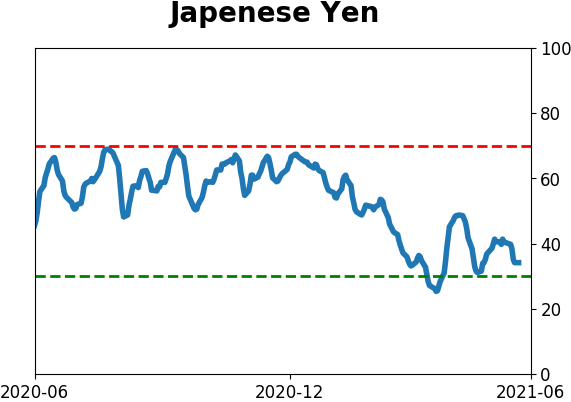
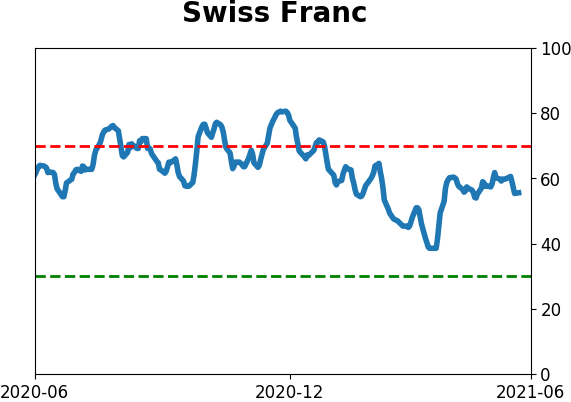
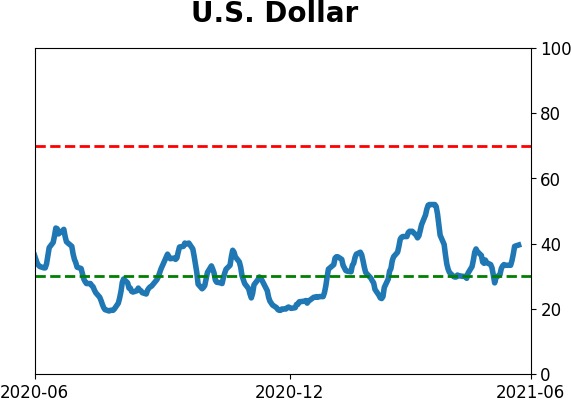
Sentiment Around The World
Optimism Index Thumbnails
|
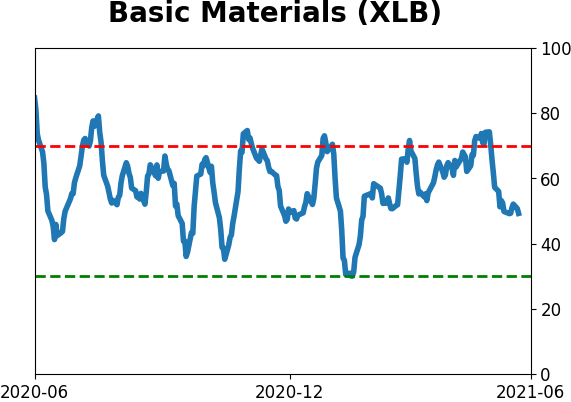
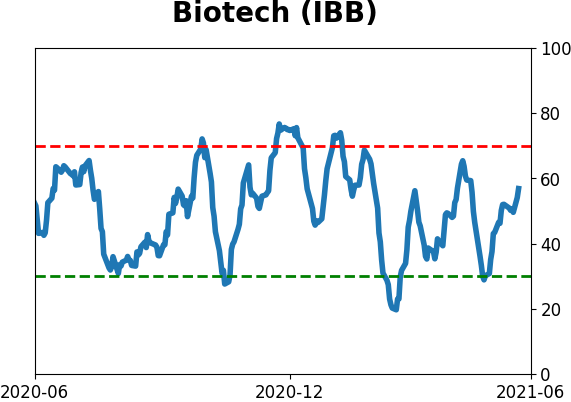
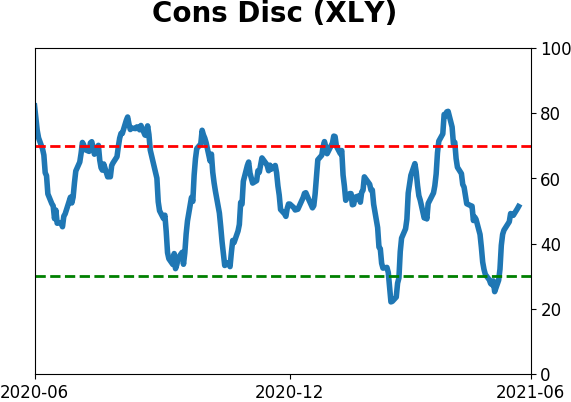
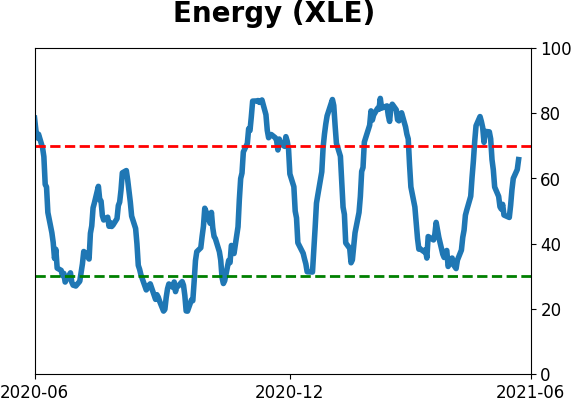
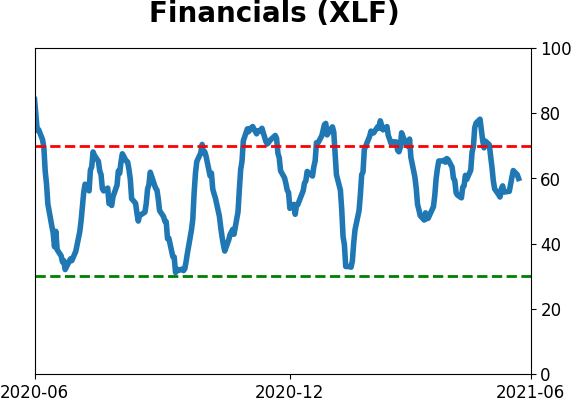
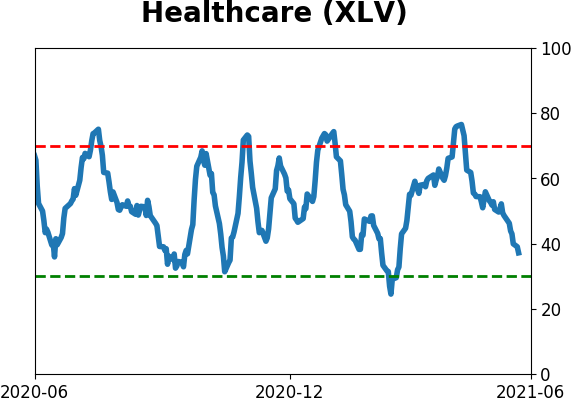
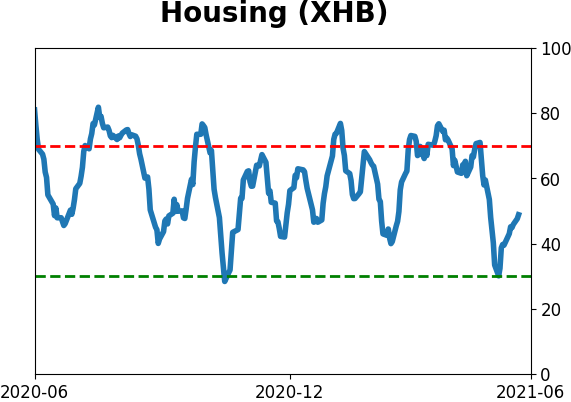
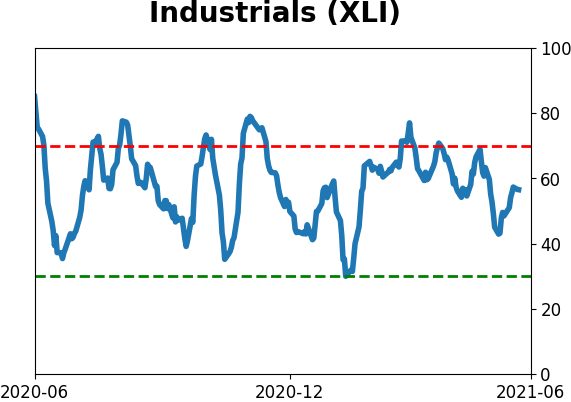
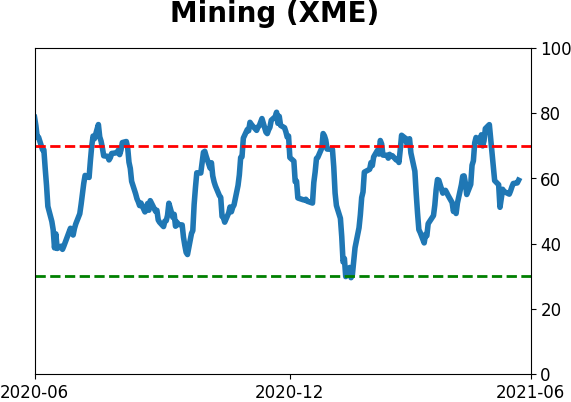
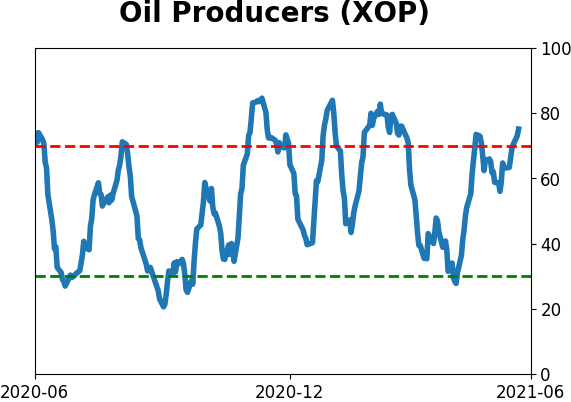
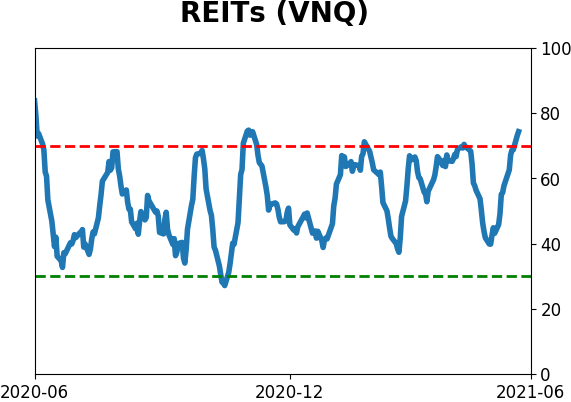
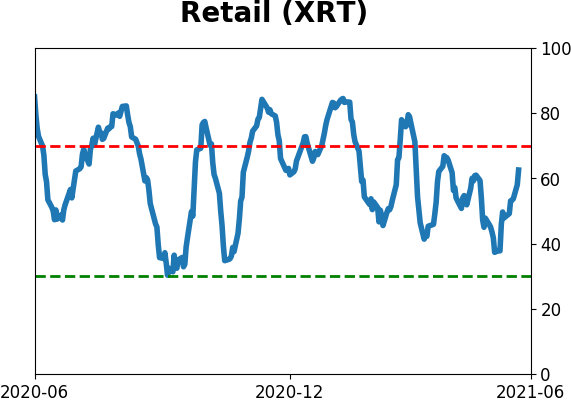
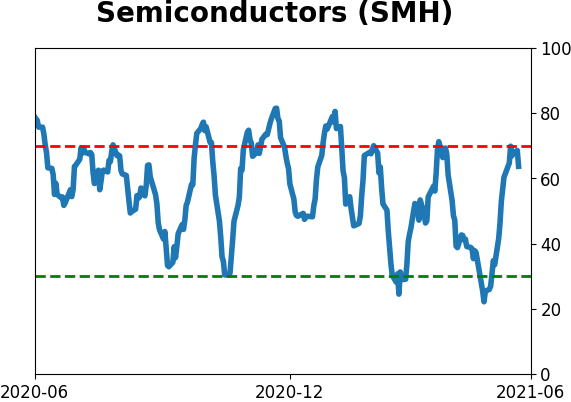
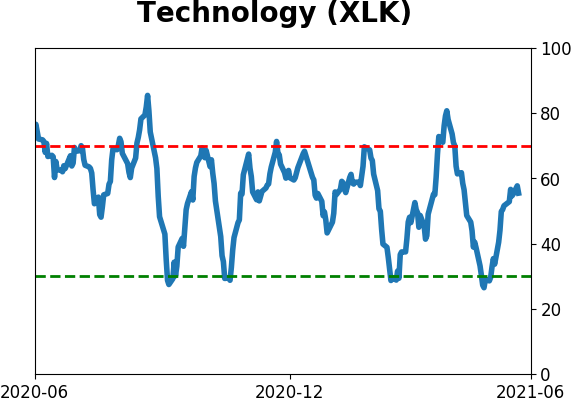
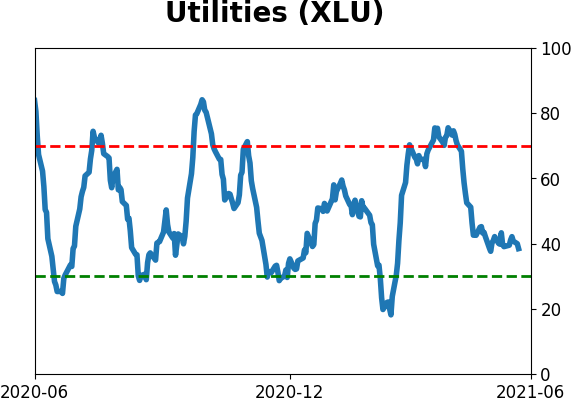
Sector ETF's - 10-Day Moving Average
|
|
|
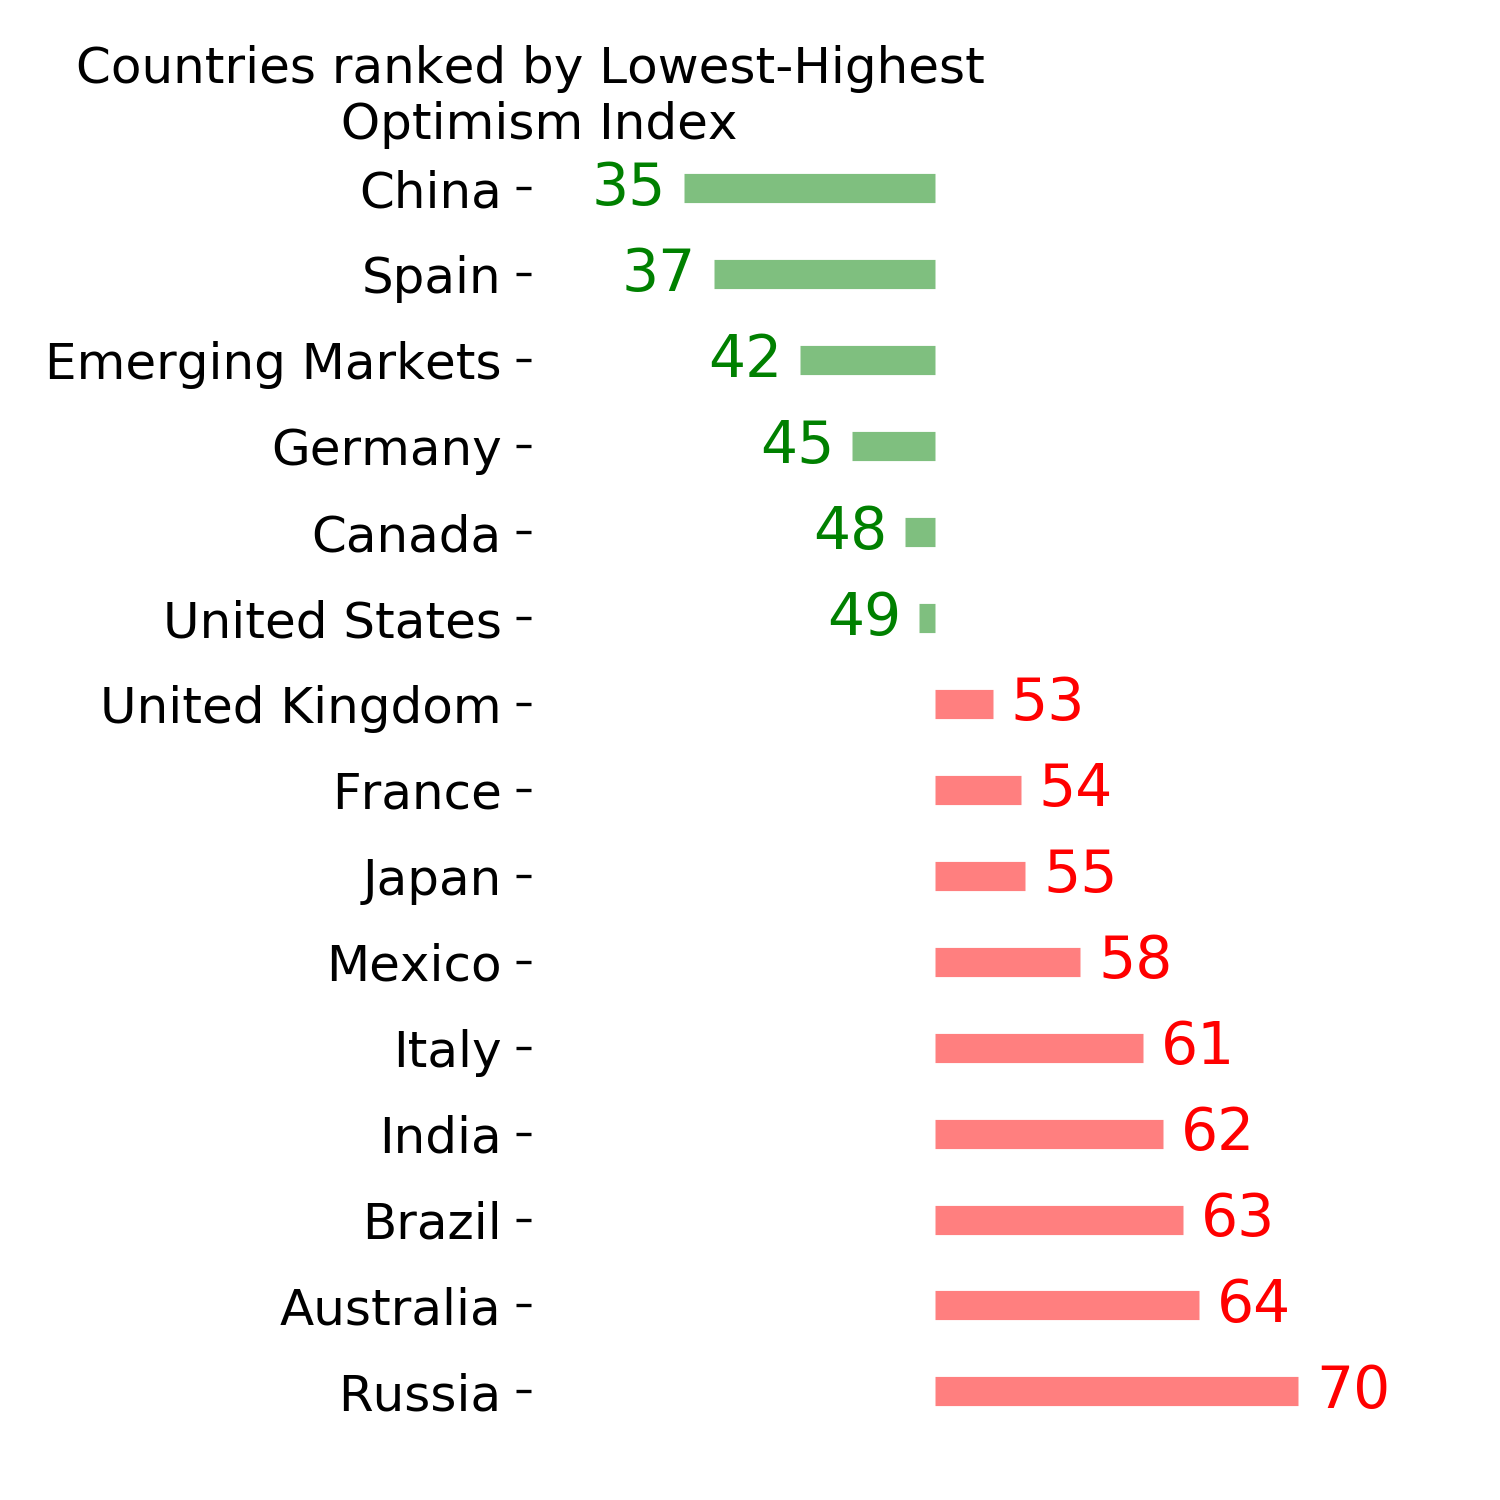
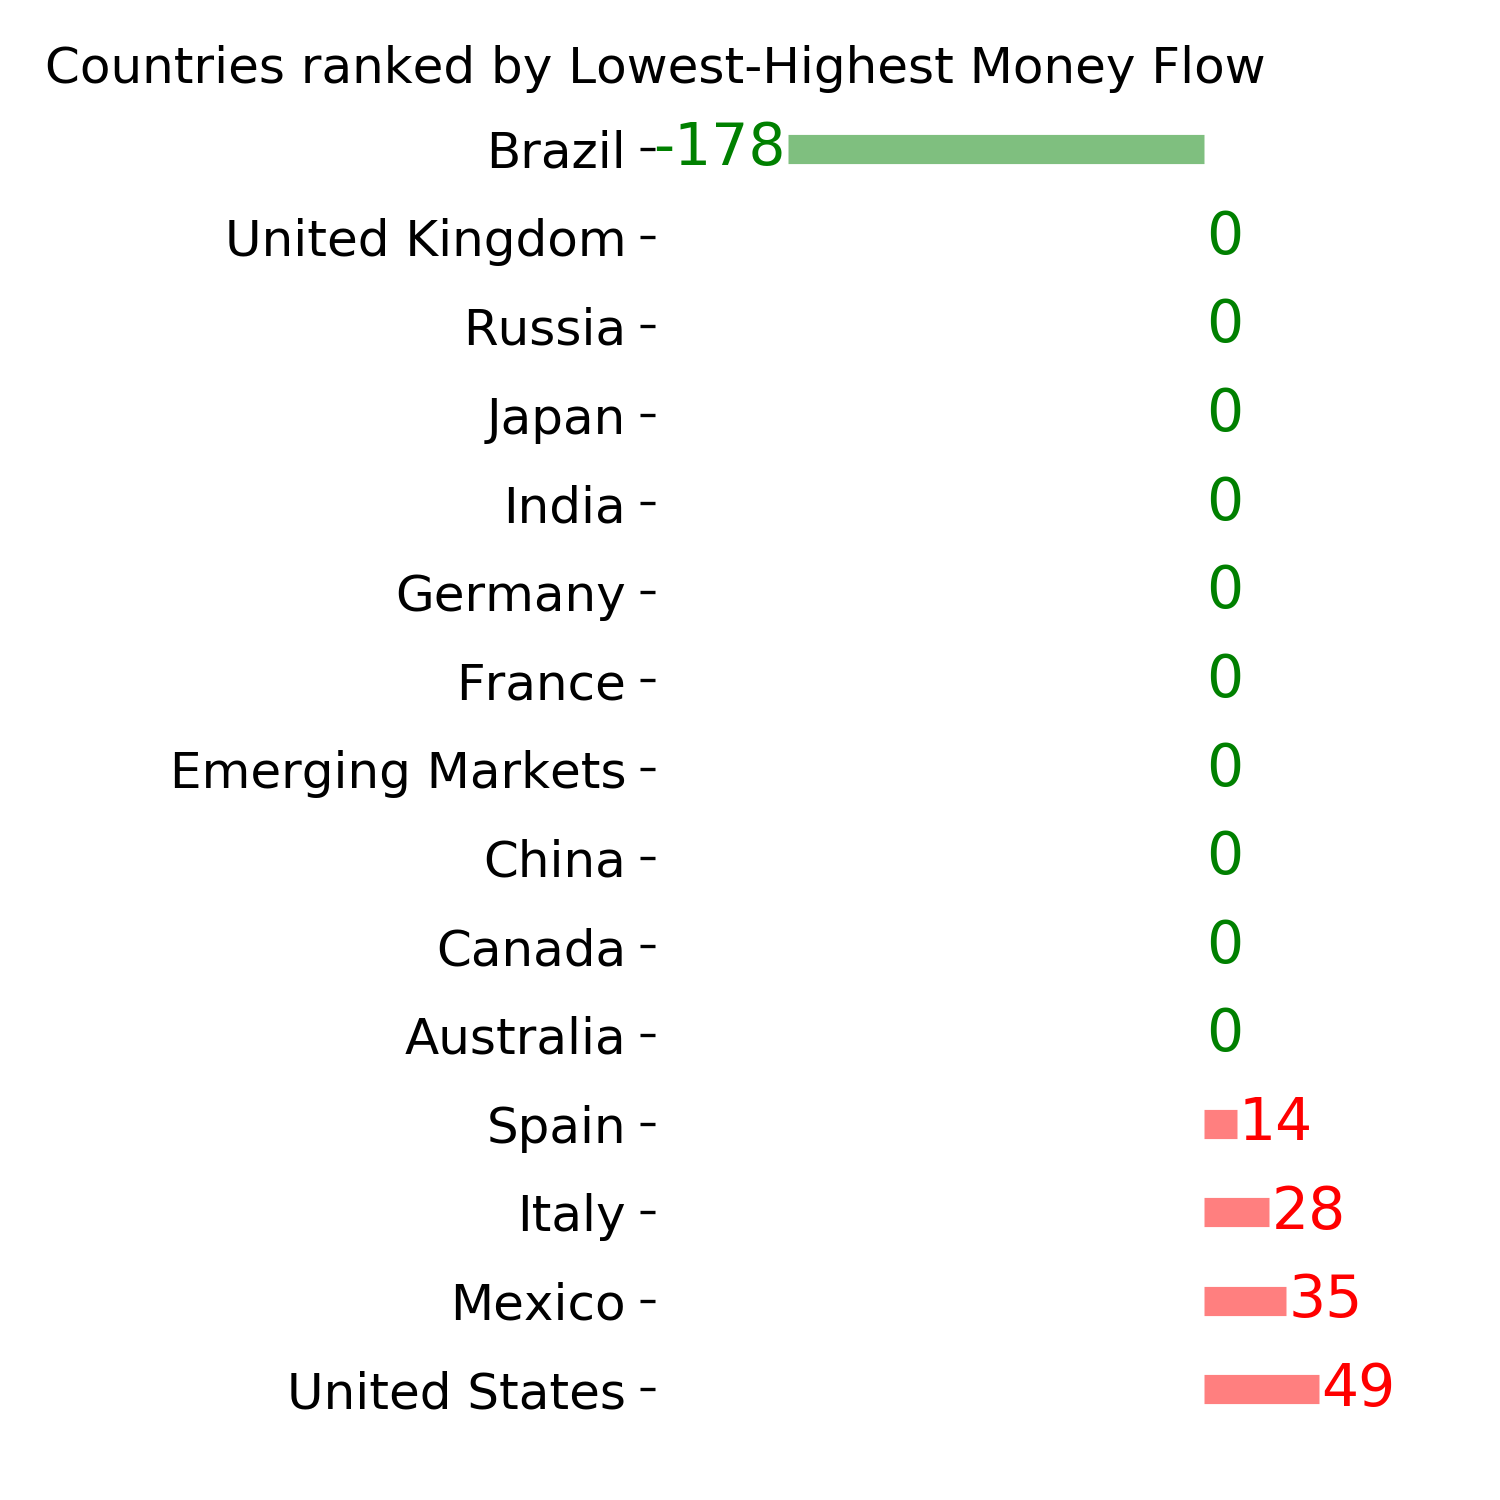
Country ETF's - 10-Day Moving Average
|
|
|
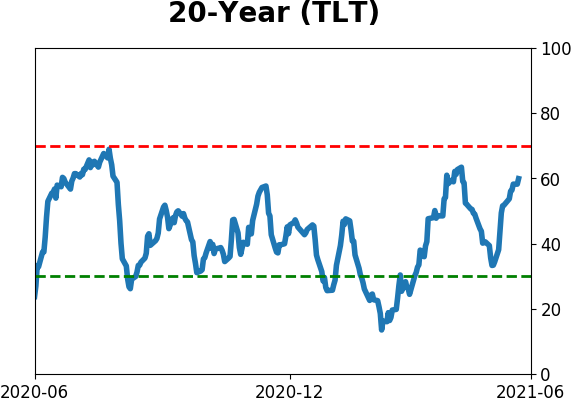
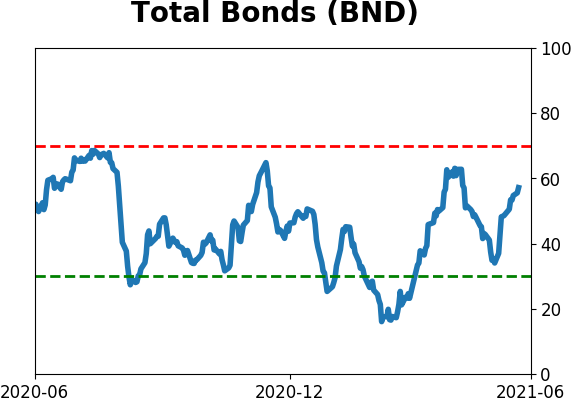
Bond ETF's - 10-Day Moving Average
|
|
|
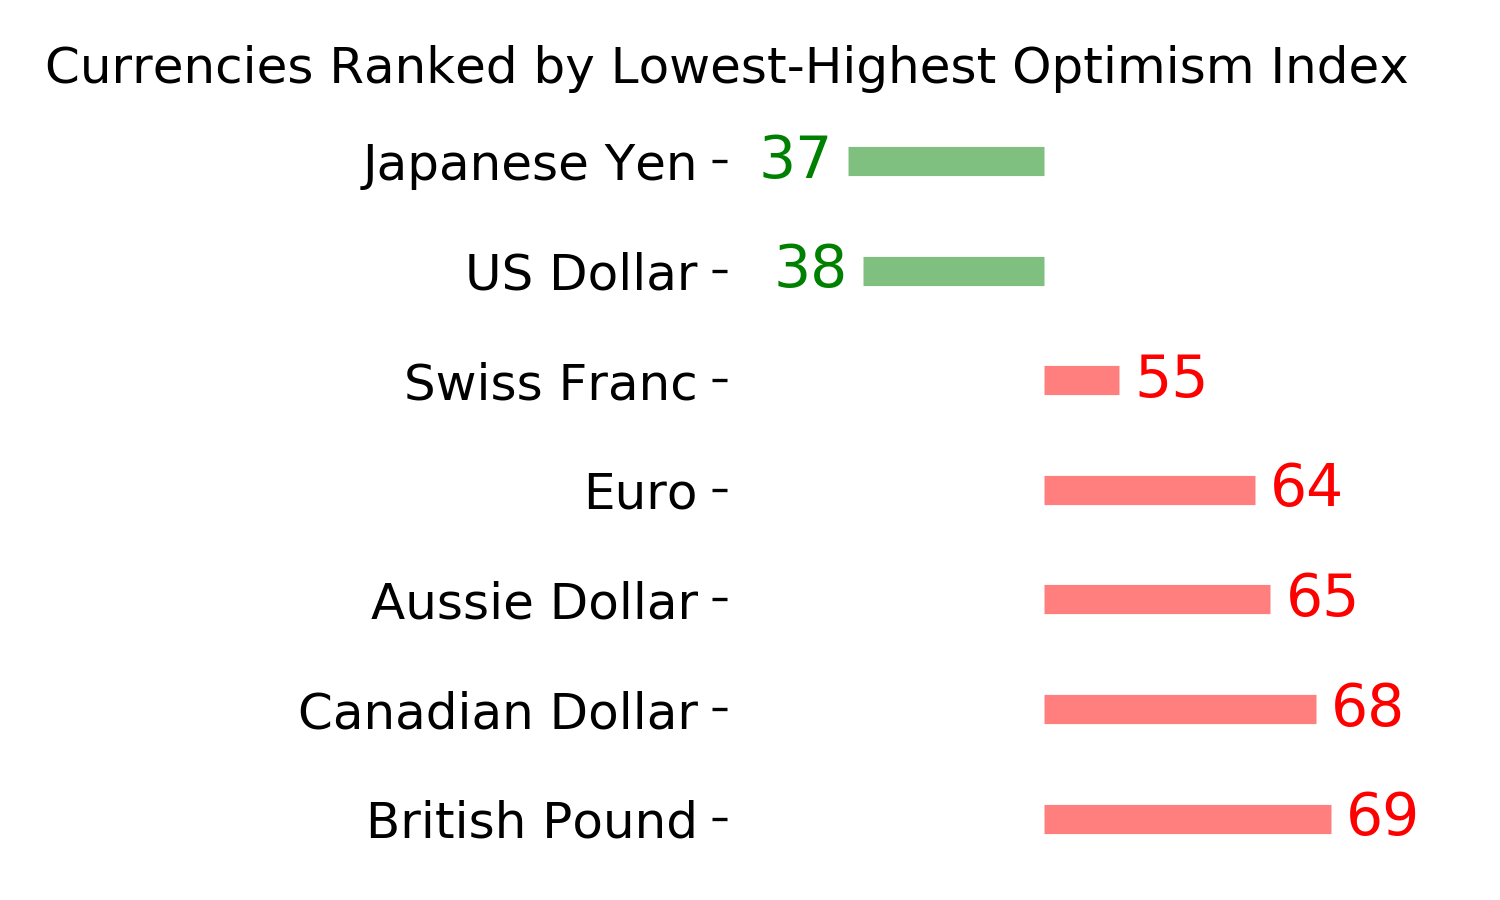
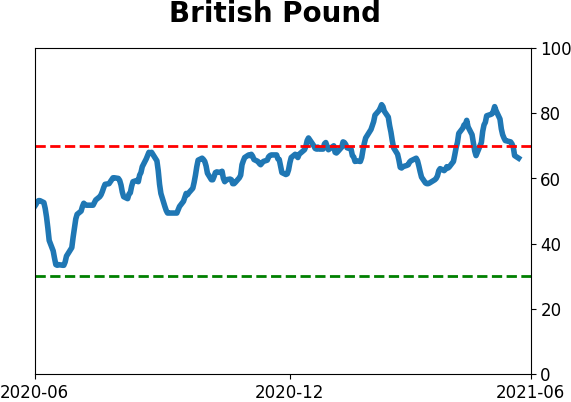
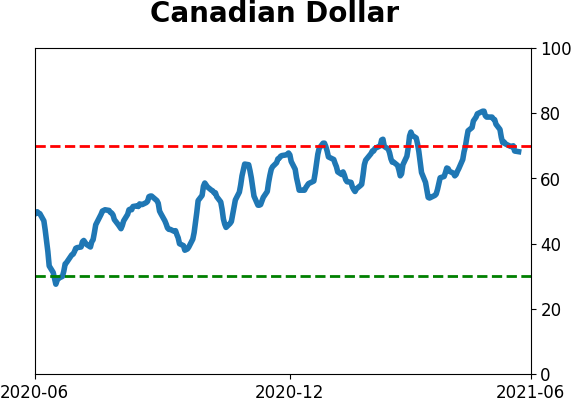
Currency ETF's - 5-Day Moving Average
|
|
|
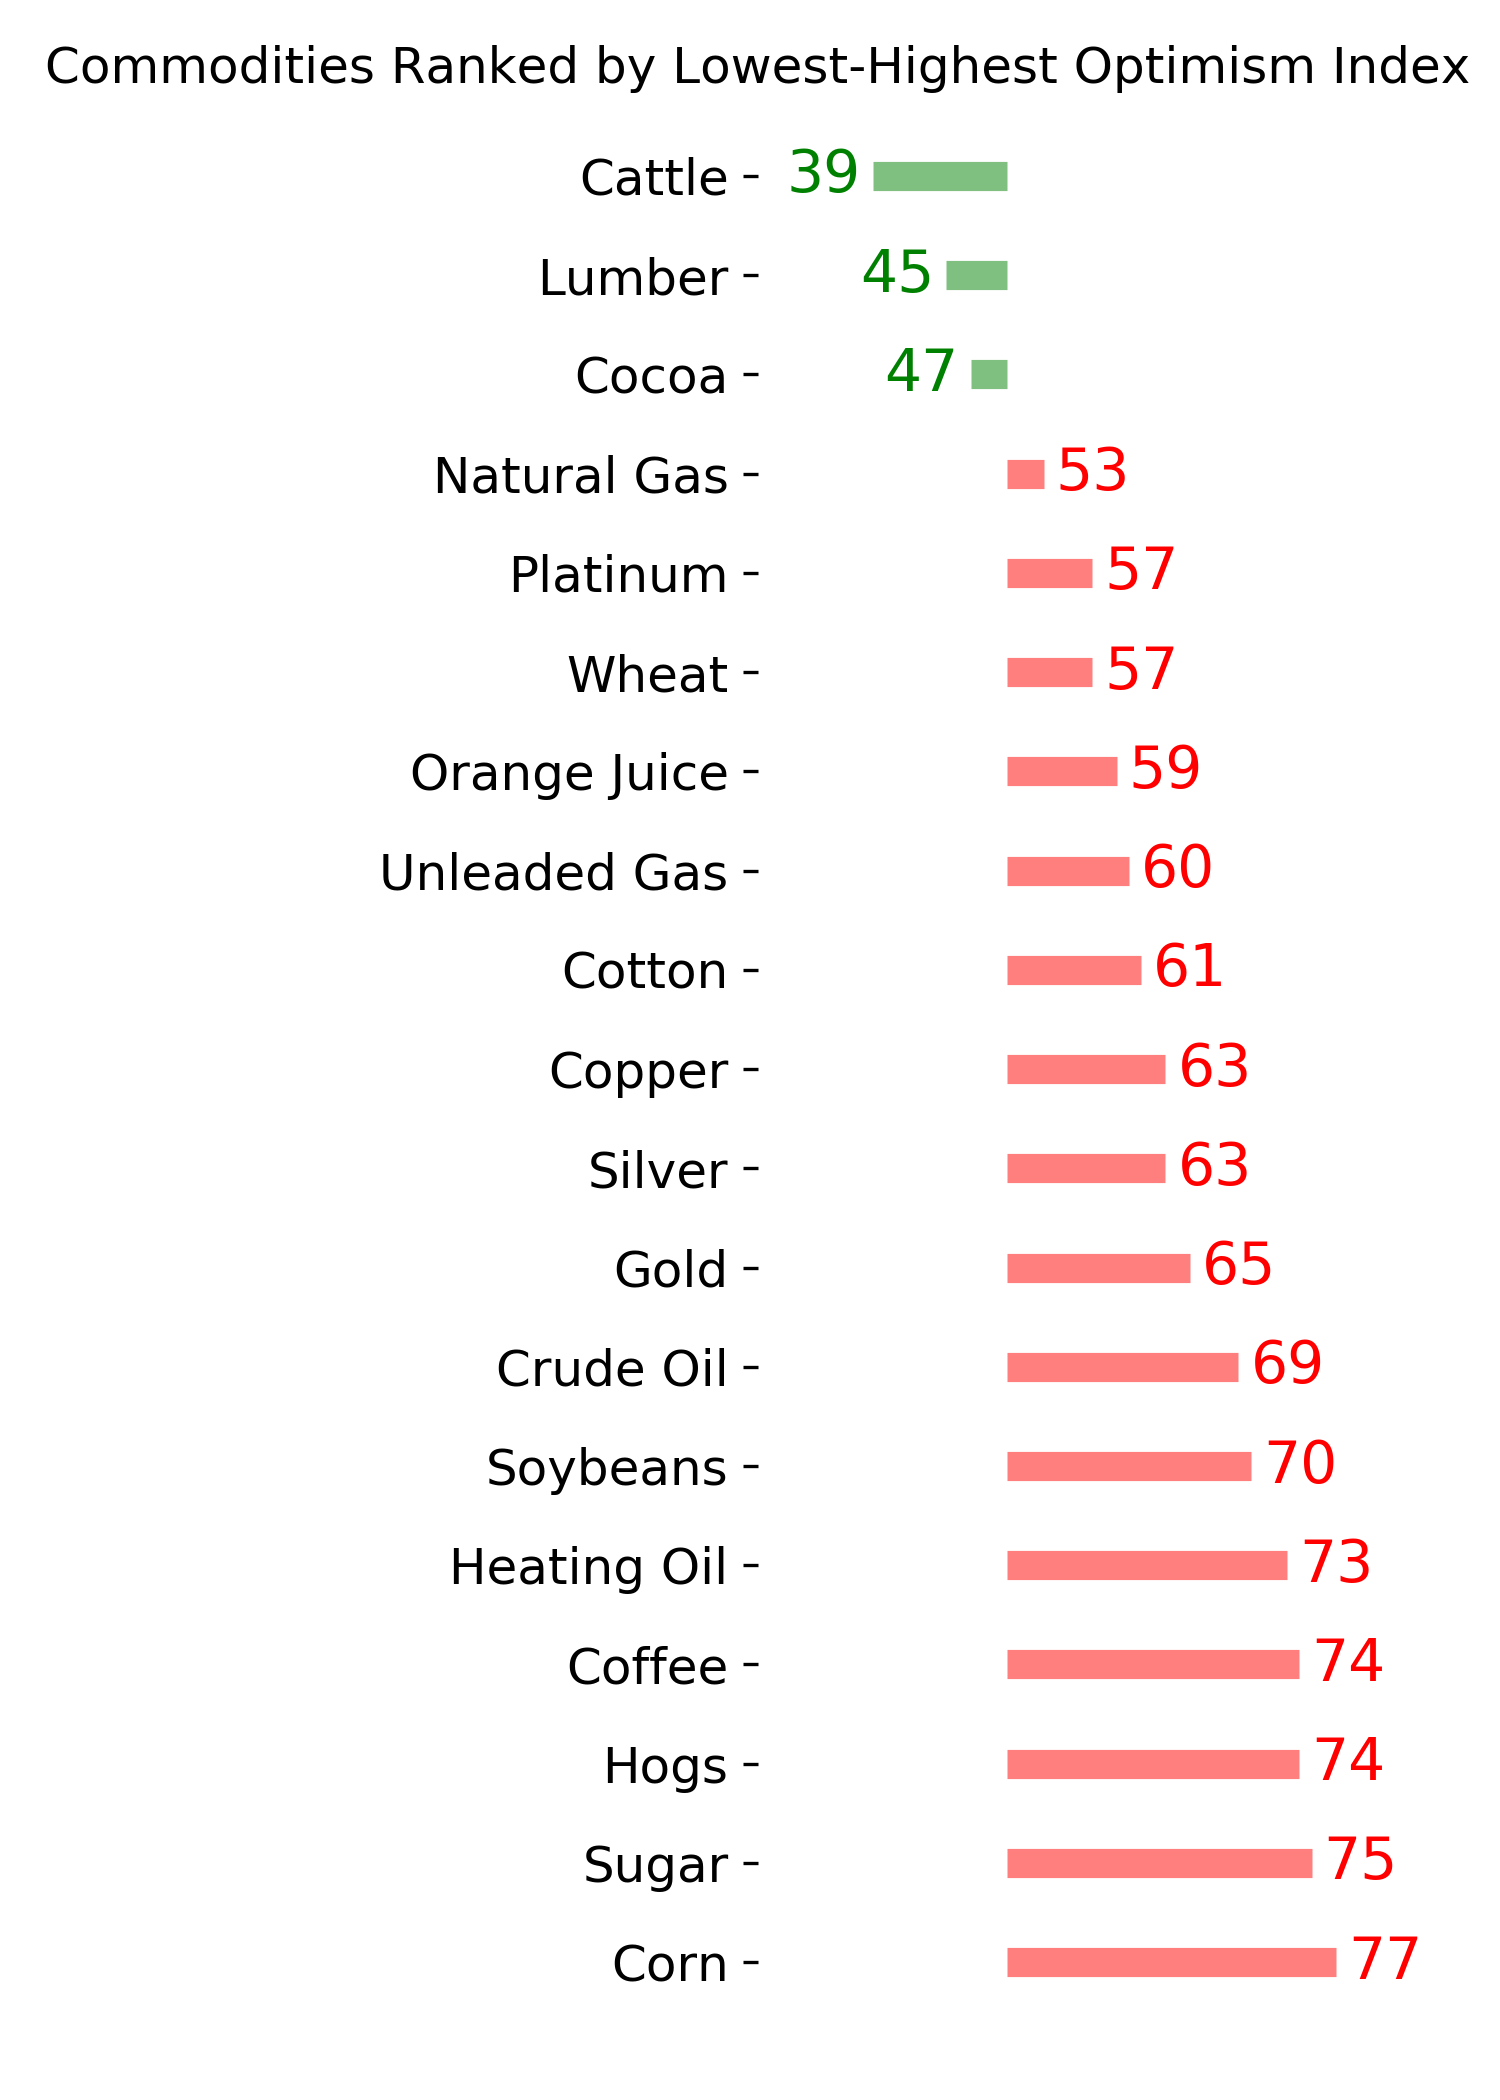
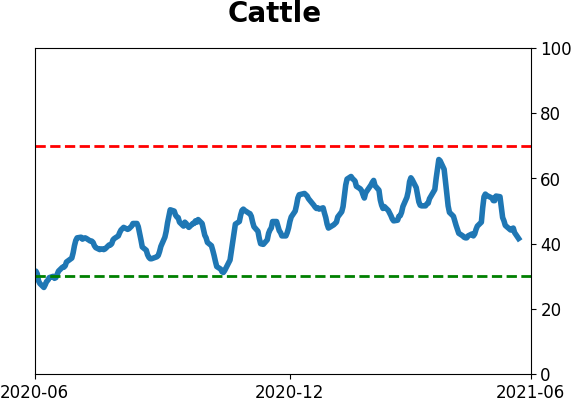
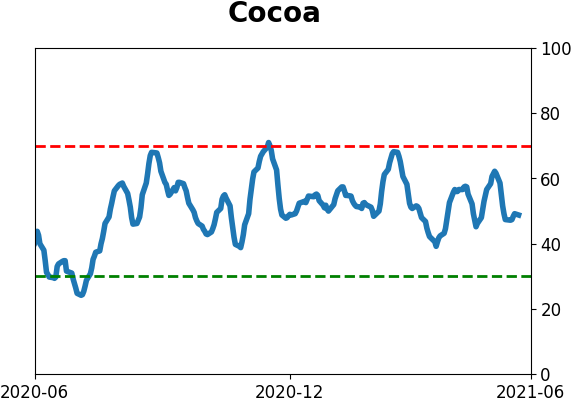
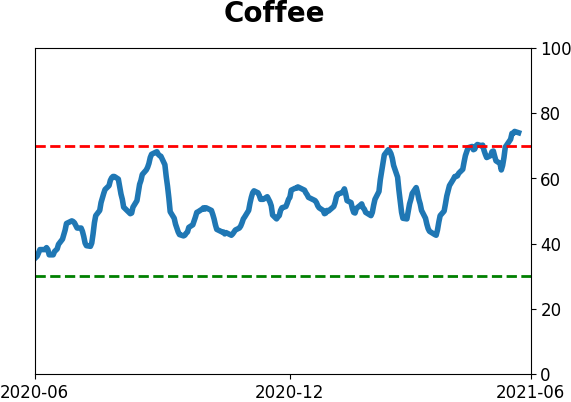
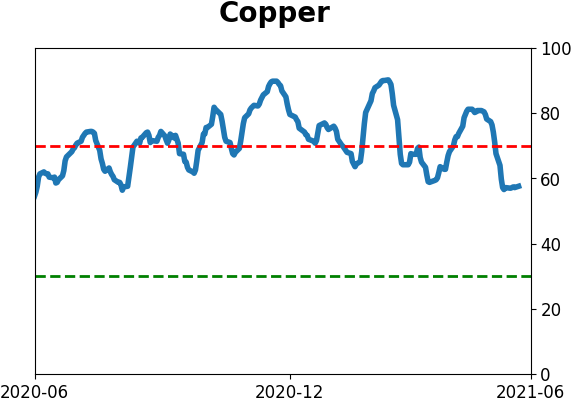
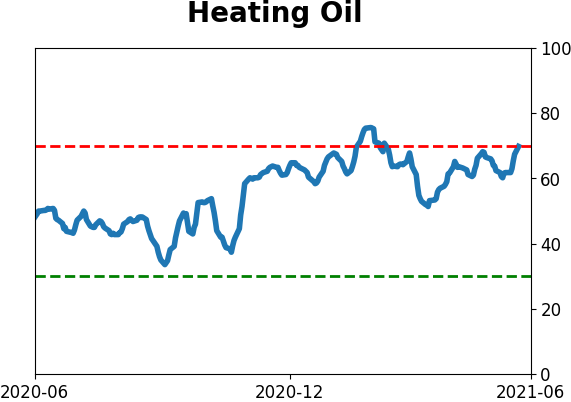
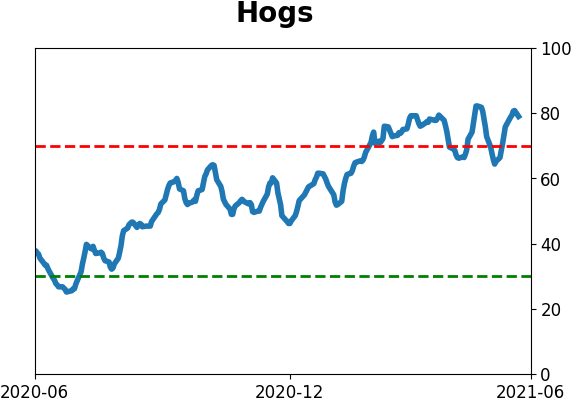
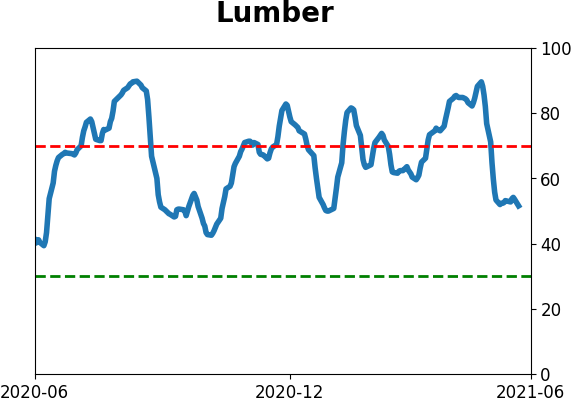
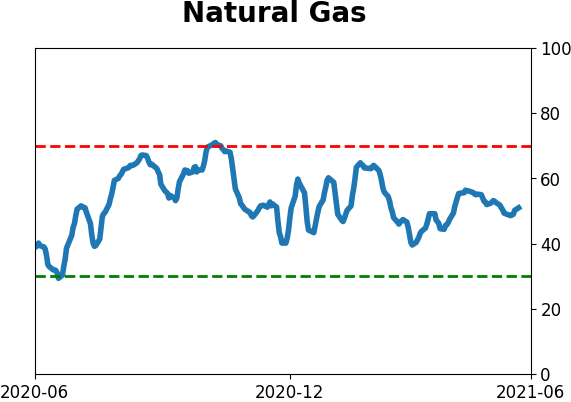
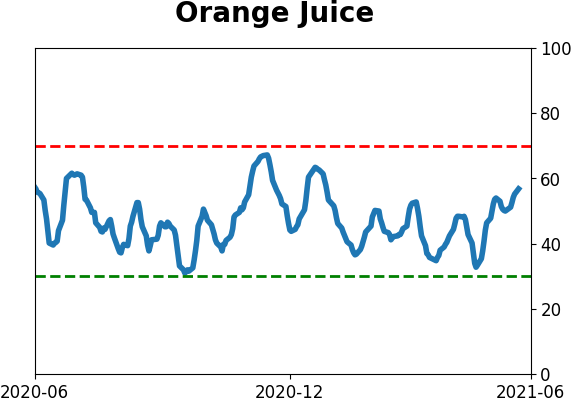
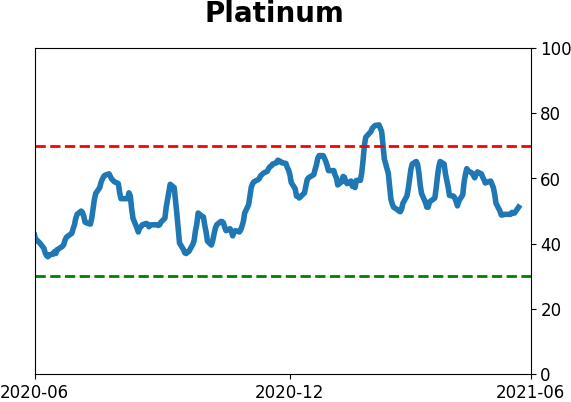
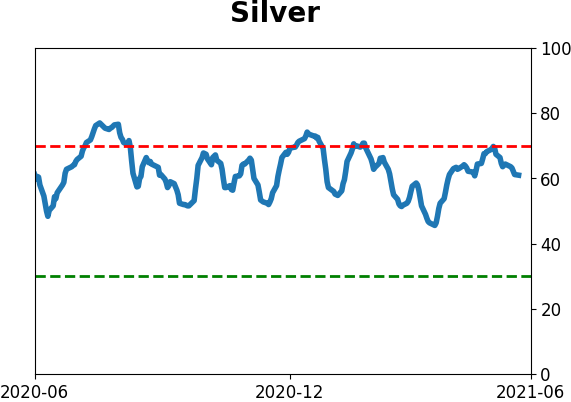
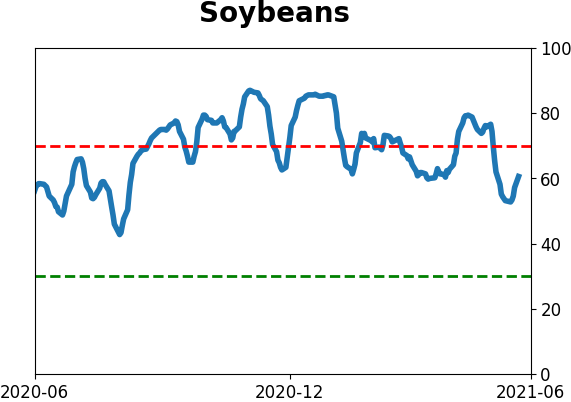
Commodity ETF's - 5-Day Moving Average
|
|