Headlines
|
|
Investors Are Rotating Out of S&P Stocks Into Small Caps and Tech:
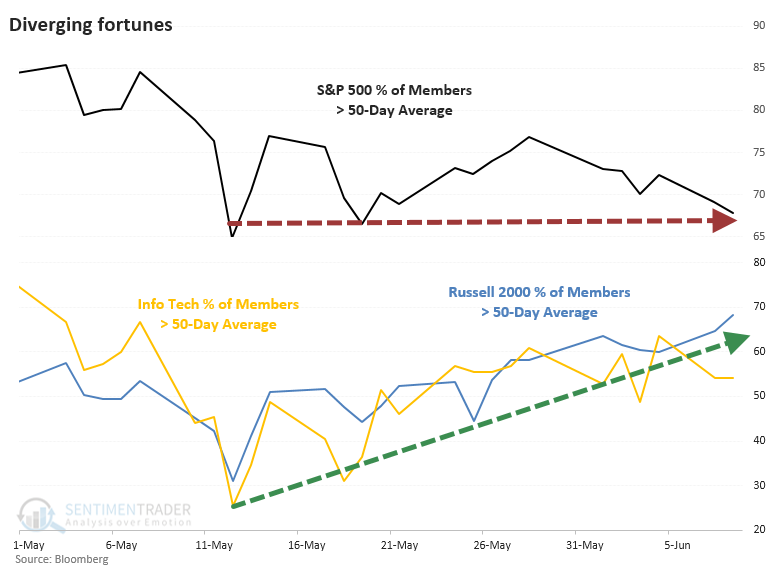
Over the past few weeks, the percentage of members in the S&P 500 above their 50-day moving averages has stagnated. At the same time, stocks in the Russell 2000 and Technology sectors have soared, triggering a positive internal divergence in those indexes.
Bottom Line:
See the Outlook & Allocations page for more details on these summaries STOCKS: Hold
The speculative frenzy in February is wrung out. Internal dynamics have mostly held up, with some exceptions. Many of our studies still show a mixed to poor short-term view, with medium- and long-term ones turning more positive. BONDS: Hold
Various parts of the market got hit in March, with the lowest Bond Optimism Index we usually see during healthy environments. After a shaky couple of weeks, the broad bond market has modestly recovered. Not a big edge here either way. GOLD: Hold
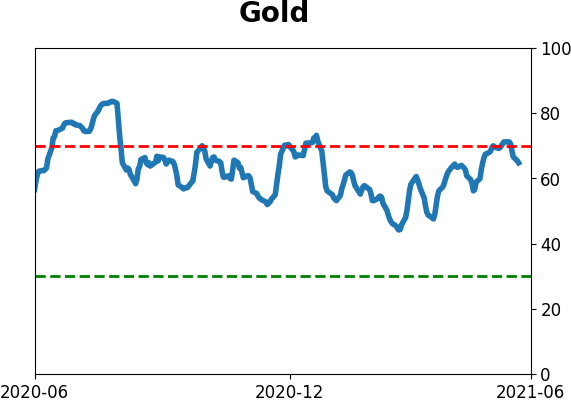
Gold and miners have done very well, recovering above long-term trend lines. The issue is that both have tended to perform poorly after similar situations - will have to wait and see how it plays out.
|
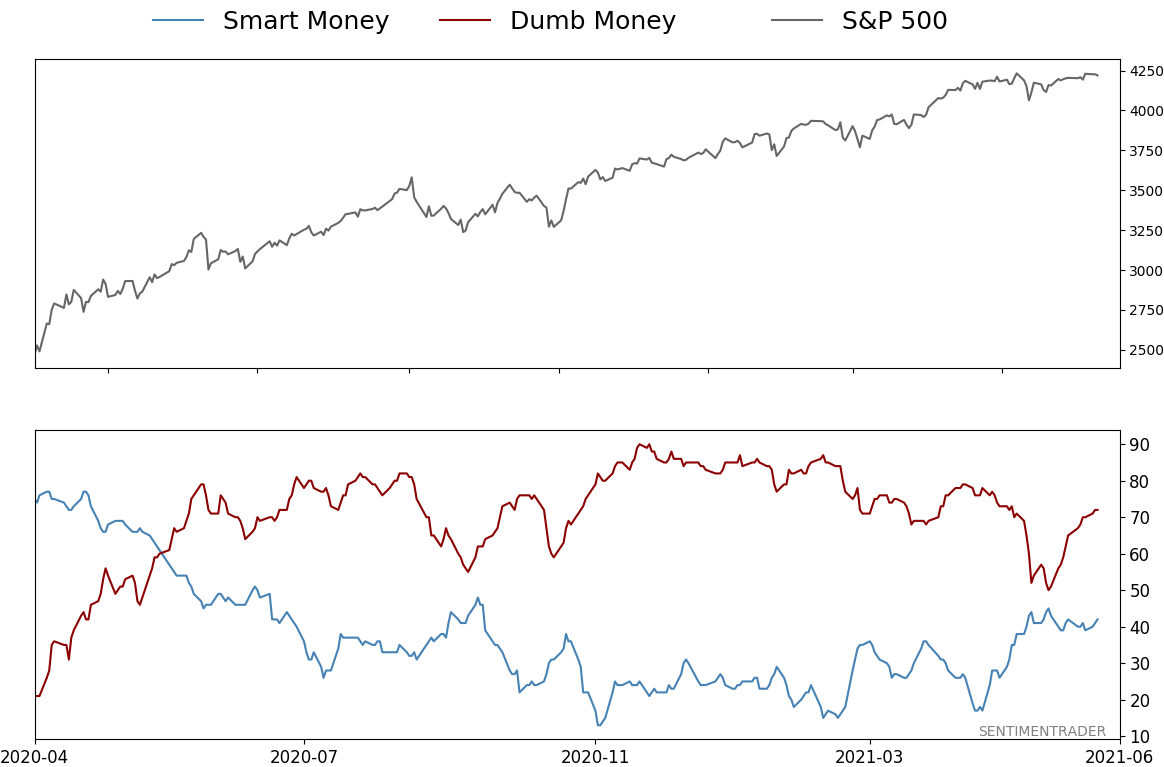
Smart / Dumb Money Confidence
|
Smart Money Confidence: 42%
Dumb Money Confidence: 72%
|
|
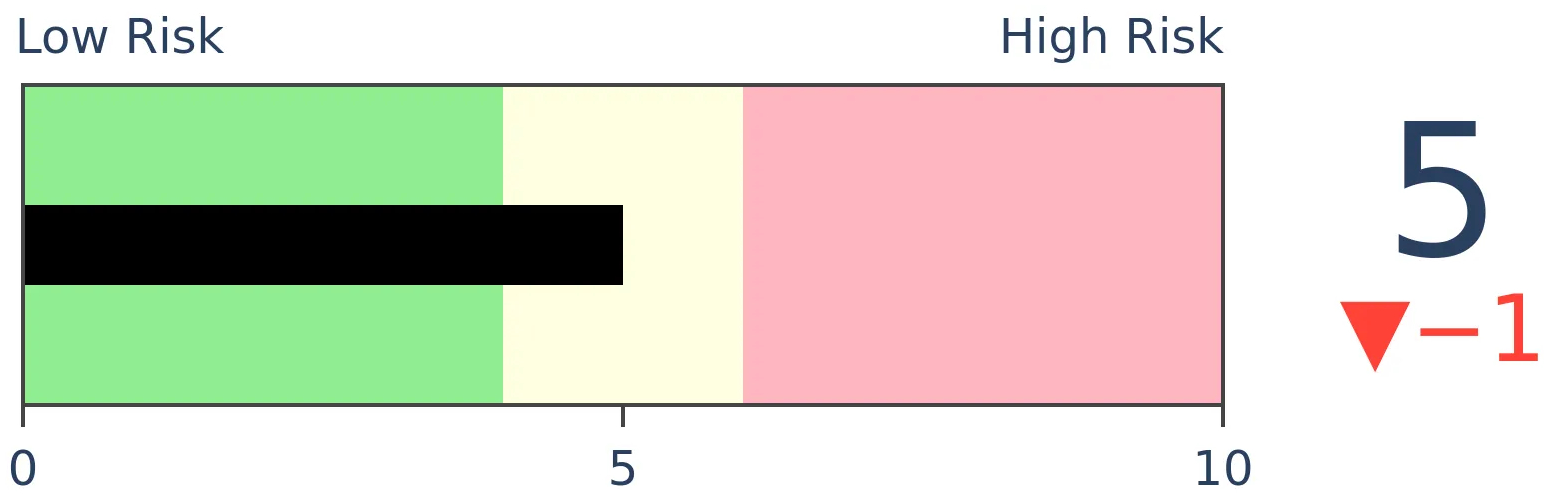
Risk Levels
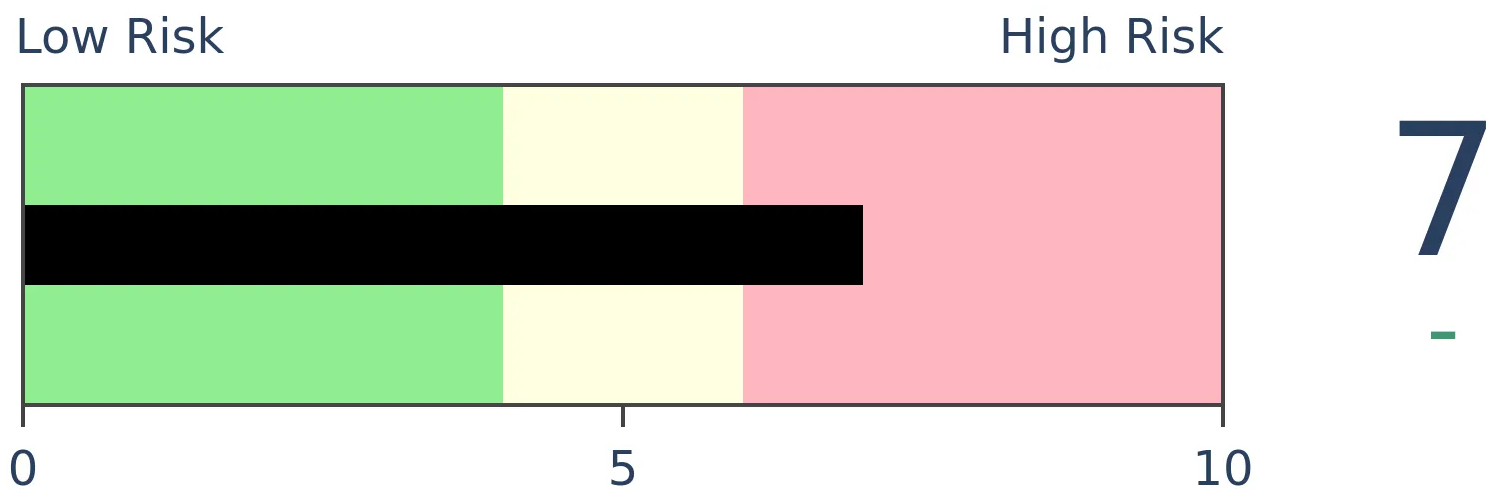
Stocks Short-Term
|
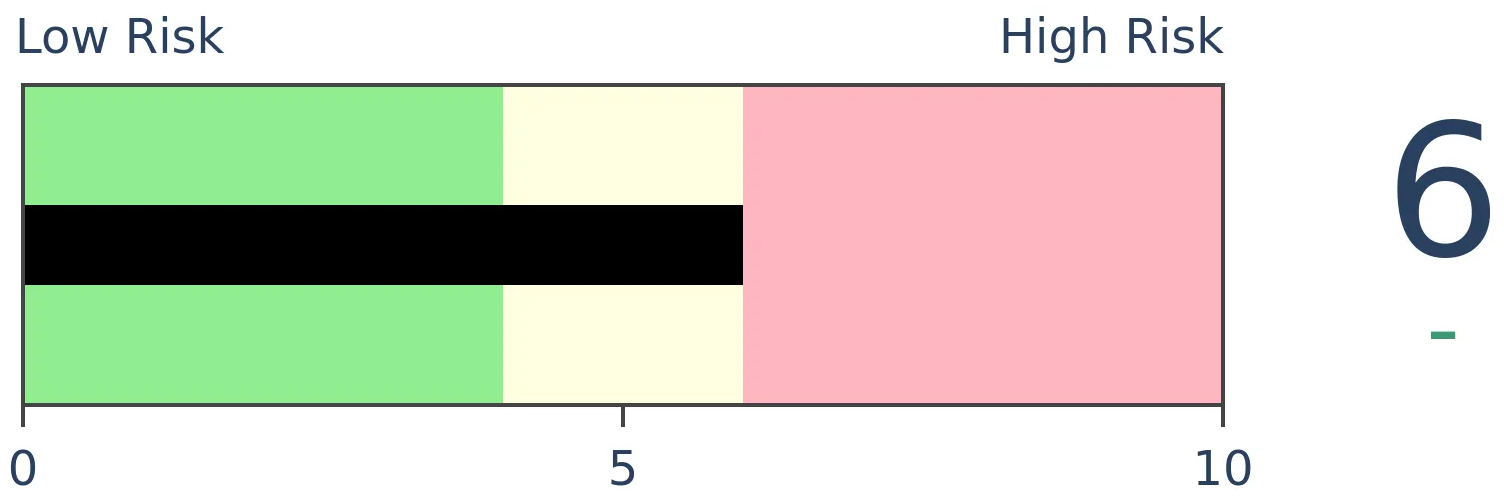
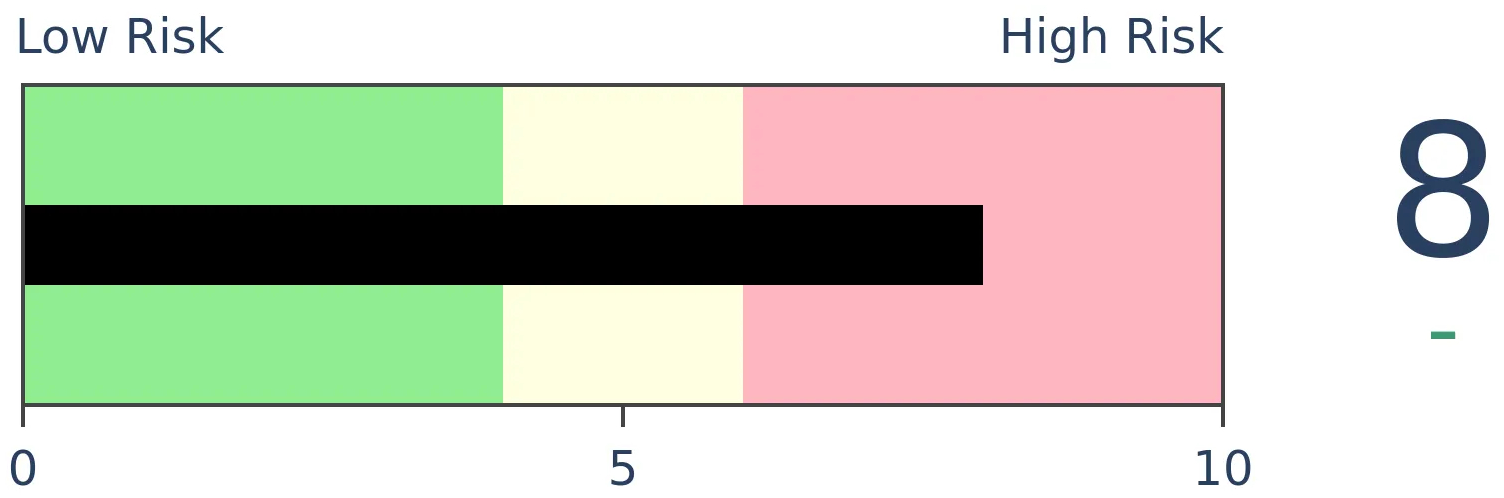
Stocks Medium-Term
|
|
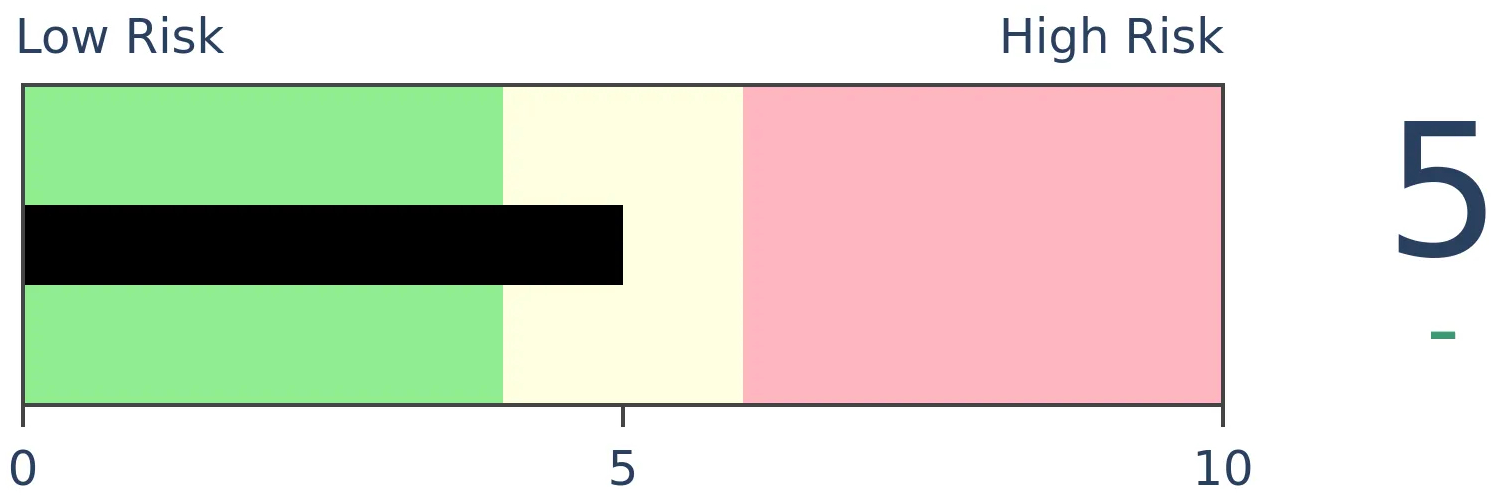
Bonds
|
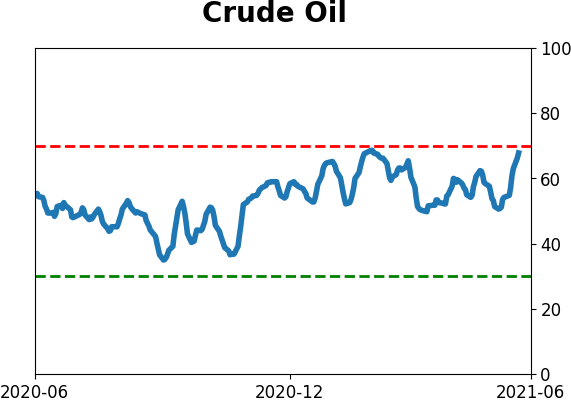
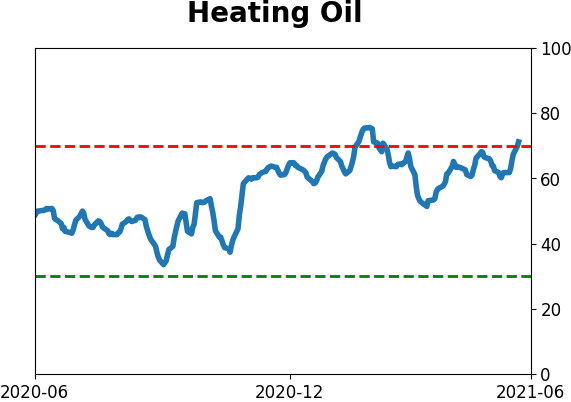
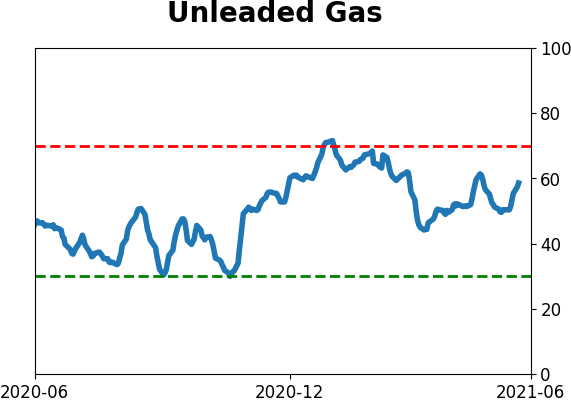
Crude Oil
|
|
Gold
|
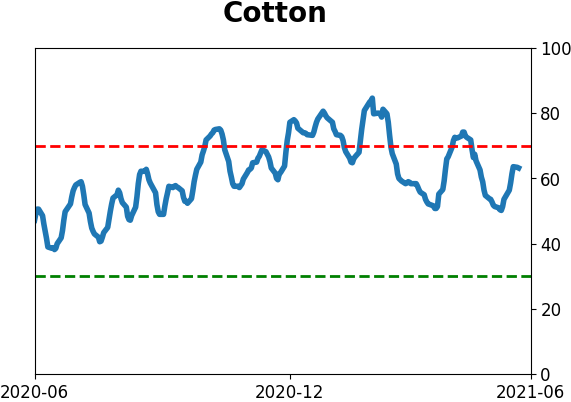
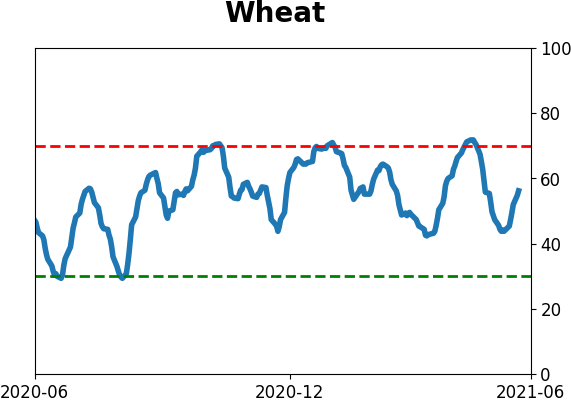
Agriculture

|
|
Research
BOTTOM LINE
Over the past few weeks, the percentage of members in the S&P 500 above their 50-day moving averages has stagnated. At the same time, stocks in the Russell 2000 and Technology sectors have soared, triggering a positive internal divergence in those indexes.
FORECAST / TIMEFRAME
SPY -- Down, Medium-Term
|
Over the past few weeks, there has been a remarkable rotation under the surface.
Since some riskier stocks took a mini-tumble into early May, many of them have stormed back. On May 12, only 31% of stocks in the Russell 2000 were holding above their 50-day moving averages. In the Info Tech sector, only 25% of stocks were above their averages. Both have seen participation more than double since then, while the S&P 500 has stagnated internally, as pointed out by the esteemed Liz Ann Sonders.
A SEA OF RED FOR THE S&P
The big question, as always, is "so what?"
Bulls want to believe that the S&P 500 is just treading water and about to head higher, preceded by increasing risk appetite from investors moving into high-beta stocks. Bears will argue that stagnation is a sign of indecision and chop, something usually seen at peaks.
Looking at available history, bears have the more compelling evidence on their side, depending on the index and the time frame. The table below shows the S&P 500's future returns when its percentage of members above the 50-day average rises less than 12.5% over a multi-week period while the percentage of members above their averages in Small-Caps and Tech rises more than 25%.
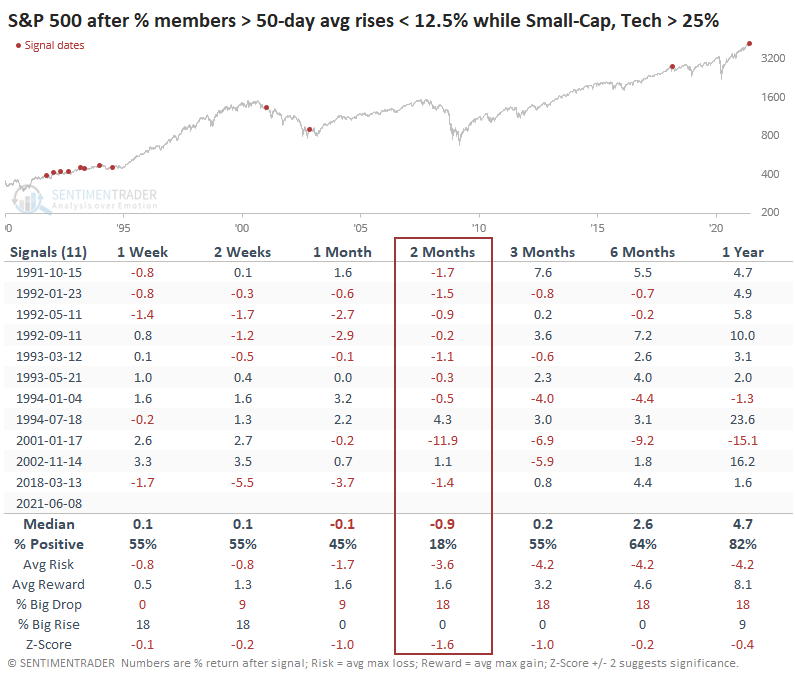
For the S&P, this was a horrible sign. Over the next two months, it managed to rally only twice out of eleven attempts, and both of those crapped out soon after. Weakness was mostly confined to the first couple of months after these signals; over the next 6-12 months, the S&P fared well except for 2001.
For the other two indexes, however, it wasn't as ominous.
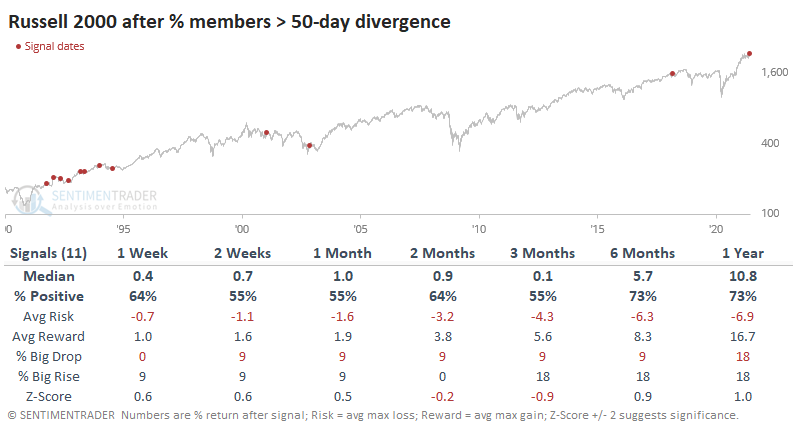
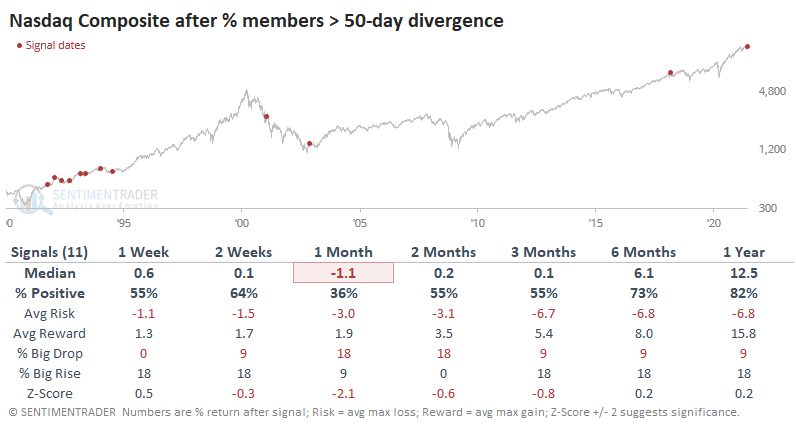
While its future returns weren't great, the Russell 2000 did rally most of the time. The Nasdaq showed poor performance during the next month, then mostly worked higher.
THE RATIOS ARE KEY
When we look at the ratios between indexes, that's where this turns interesting. Looking at future returns between the Russell 2000 versus the S&P 500, there was a clear bias toward Small-Caps.
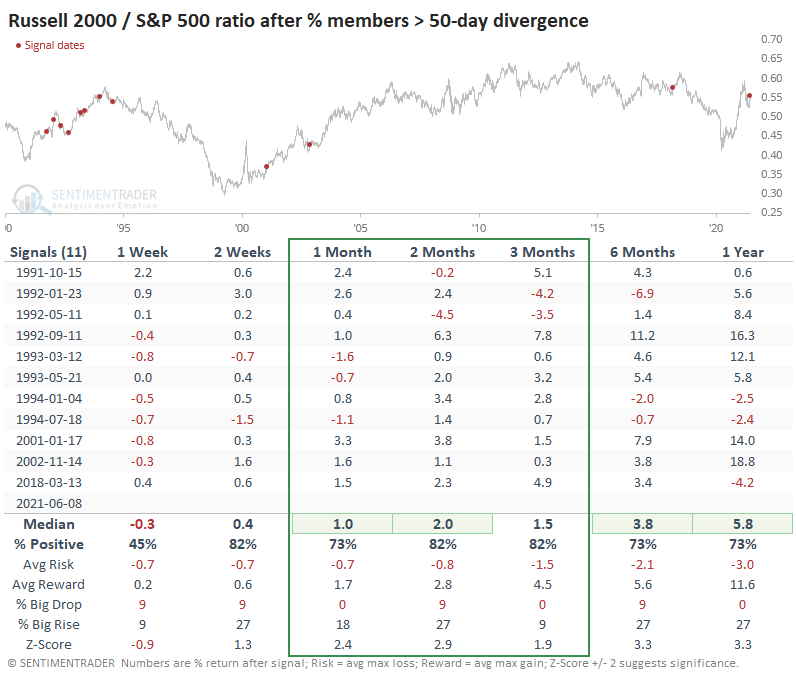
The ratio between the two indexes consistently - and significantly - rose over the medium- to long-term. The Russell showed impressive outperformance over almost all time frames and nearly without exception.
The Nasdaq Composite showed some shorter-term weakness but improved longer-term.
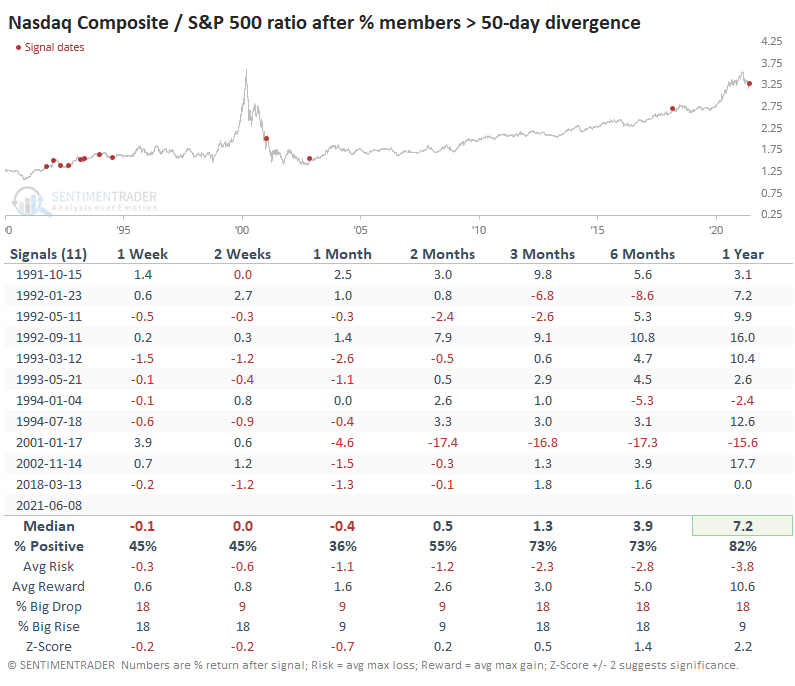
The biggest oops was when this scenario popped up early in 2001. The post-bubble puke wasn't yet finished, and anyone relying on this positive divergence in breadth between indexes would have suffered terrible losses, absolutely and relatively.
Overall, though, the suggestion is clear that this kind of internal divergence between the types of stocks within each of the three indexes favors recent trends. That suggests that while it is a negative sign for the broader market, investors may find some relative solace in the very stocks that have been holding up best, particularly Small-Caps.
Active Studies
| Time Frame | Bullish | Bearish | | Short-Term | 0 | 0 | | Medium-Term | 2 | 12 | | Long-Term | 11 | 5 |
|
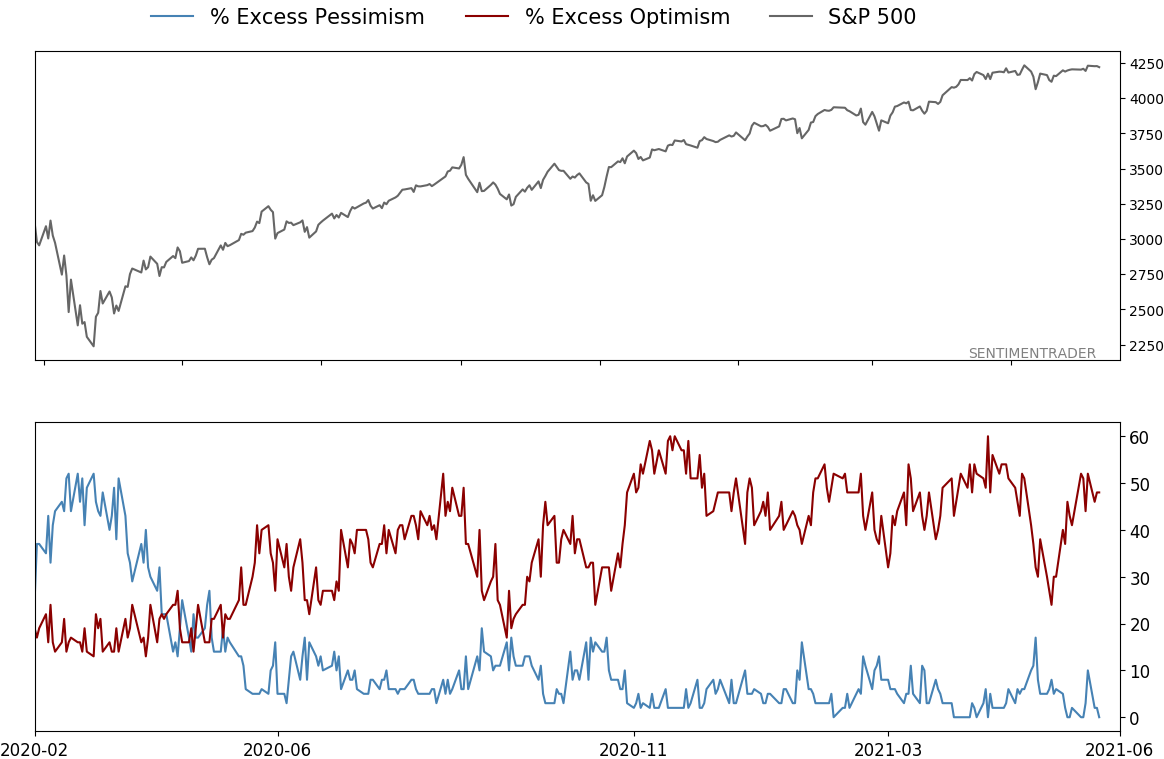
Indicators at Extremes
|
% Showing Pessimism: 0%
Bullish for Stocks
|
|
Portfolio
| Position | Description | Weight % | Added / Reduced | Date | | Stocks | RSP | 4.1 | Added 4.1% | 2021-05-19 | | Bonds | 23.9% BND, 6.9% SCHP | 30.7 | Reduced 7.1% | 2021-05-19 | | Commodities | GCC | 2.6 | Reduced 2.1%
| 2020-09-04 | | Precious Metals | GDX | 5.6 | Reduced 4.2% | 2021-05-19 | | Special Situations | 4.3% XLE, 2.2% PSCE | 7.6 | Reduced 5.6% | 2021-04-22 | | Cash | | 49.4 | | |
|
Updates (Changes made today are underlined)
Much of our momentum and trend work has remained positive for several months, with some scattered exceptions. Almost all sentiment-related work has shown a poor risk/reward ratio for stocks, especially as speculation drove to record highs in exuberance in February. Much of that has worn off, and most of our models are back toward neutral levels. There isn't much to be excited about here. The same goes for bonds and even gold. Gold has been performing well lately and is back above long-term trend lines. The issue is that it has a poor record of holding onto gains when attempting a long-term trend change like this, so we'll take a wait-and-see approach. RETURN YTD: 10.1% 2020: 8.1%, 2019: 12.6%, 2018: 0.6%, 2017: 3.8%, 2016: 17.1%, 2015: 9.2%, 2014: 14.5%, 2013: 2.2%, 2012: 10.8%, 2011: 16.5%, 2010: 15.3%, 2009: 23.9%, 2008: 16.2%, 2007: 7.8%
|
|
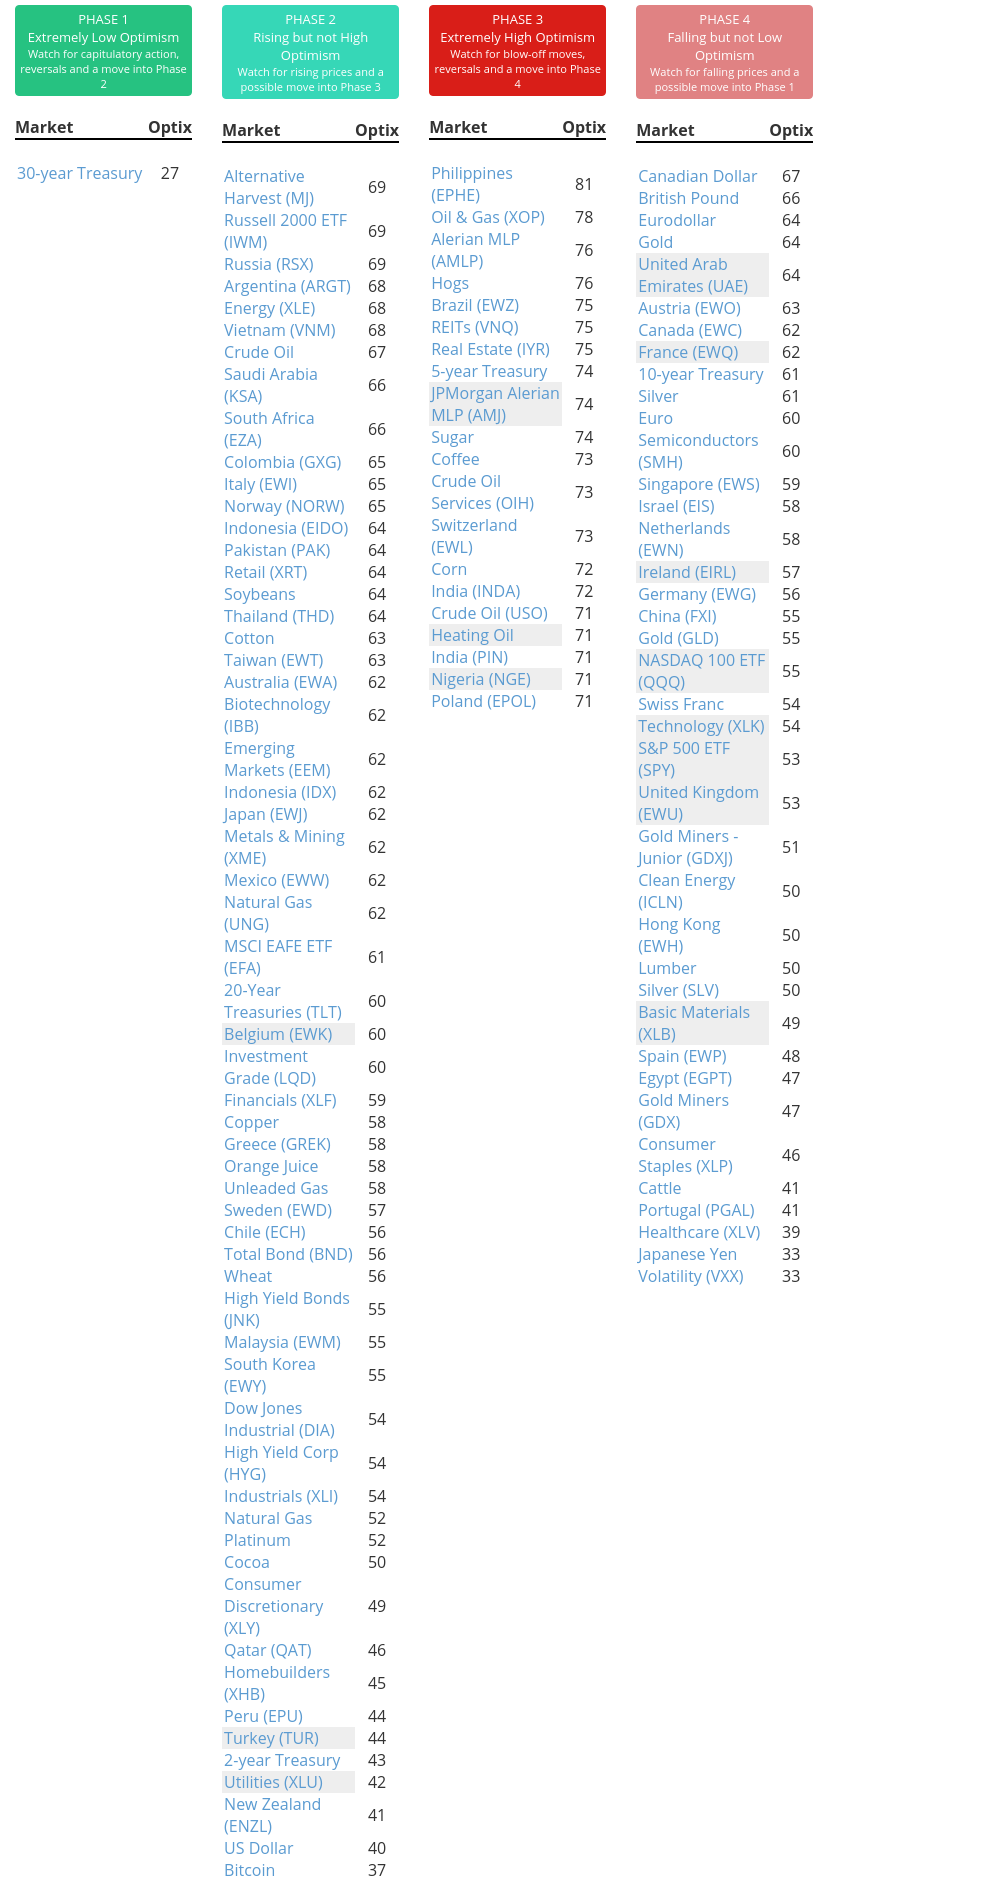
Phase Table
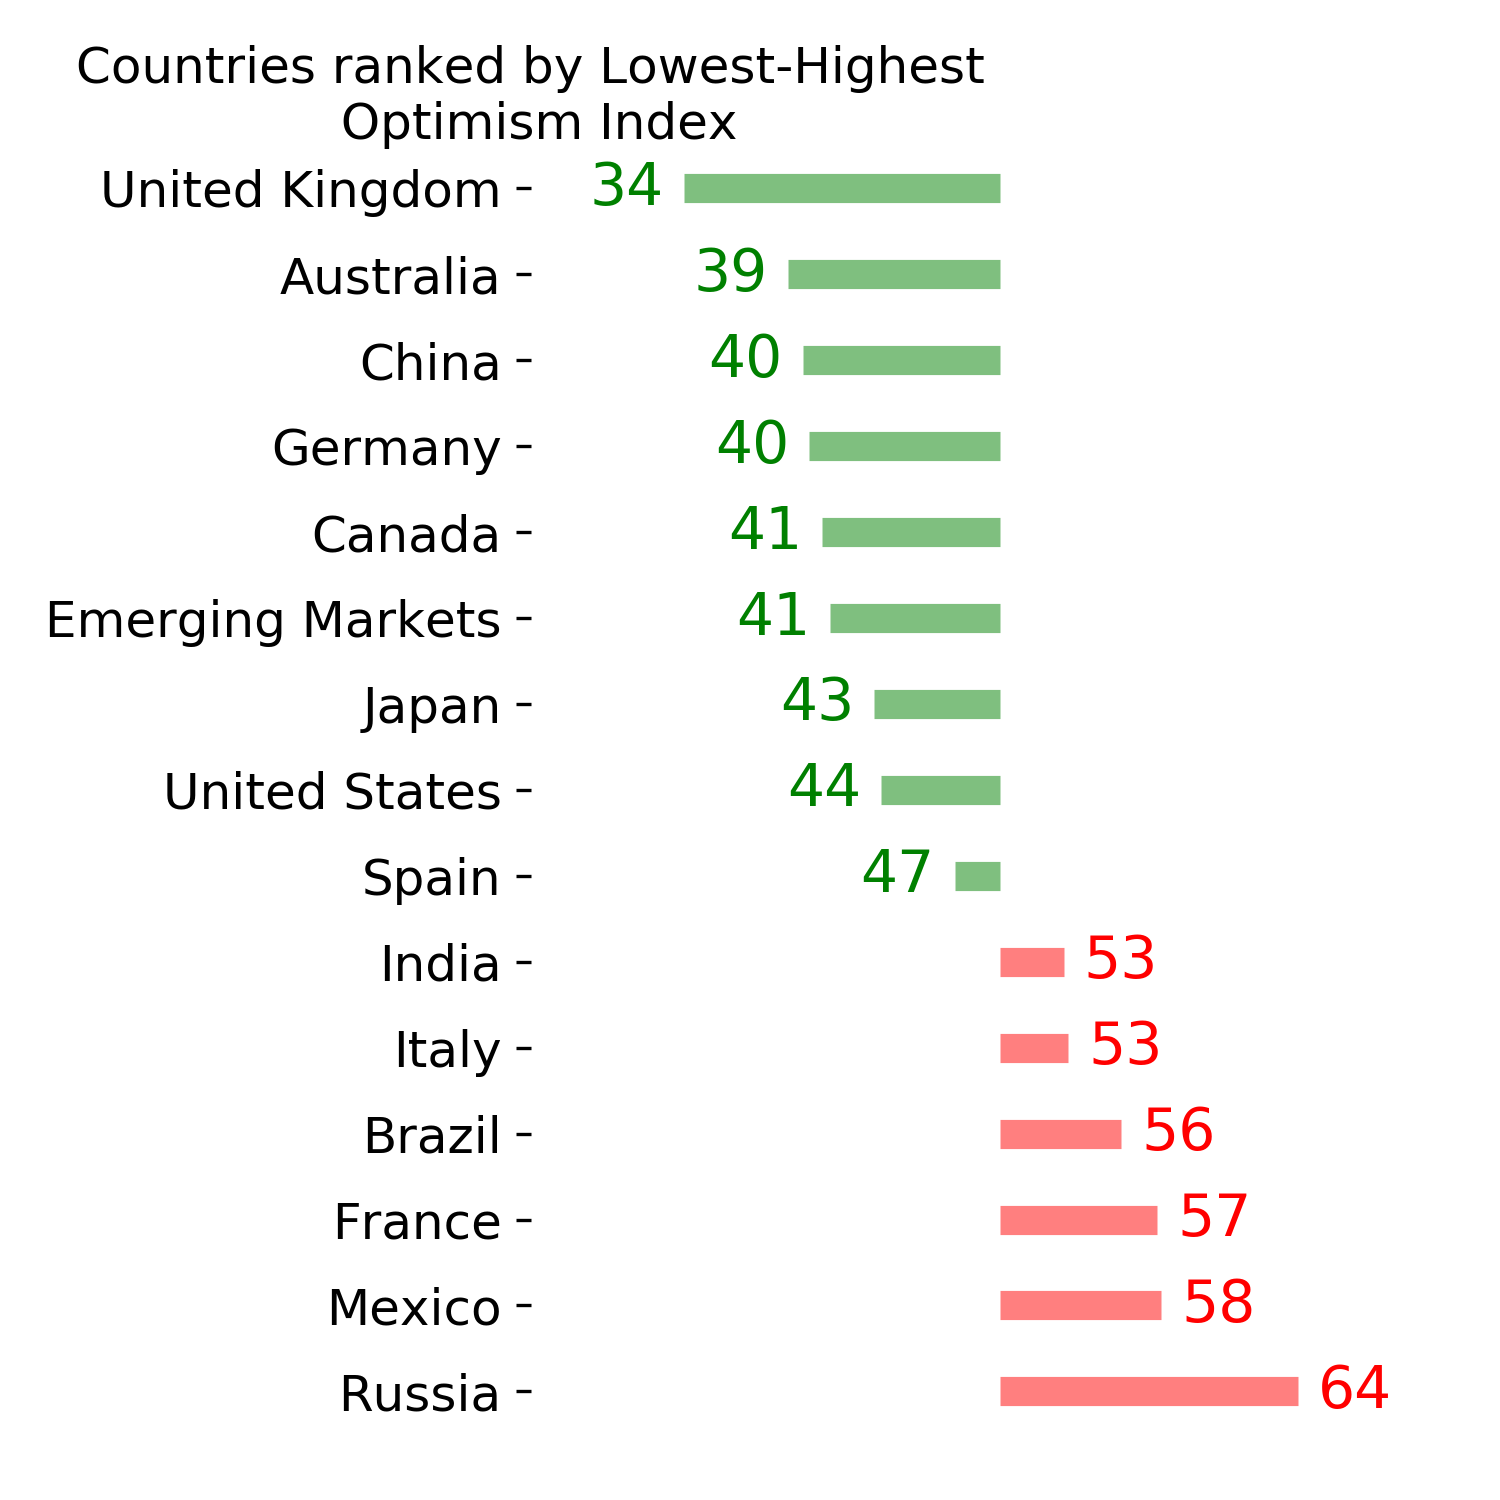
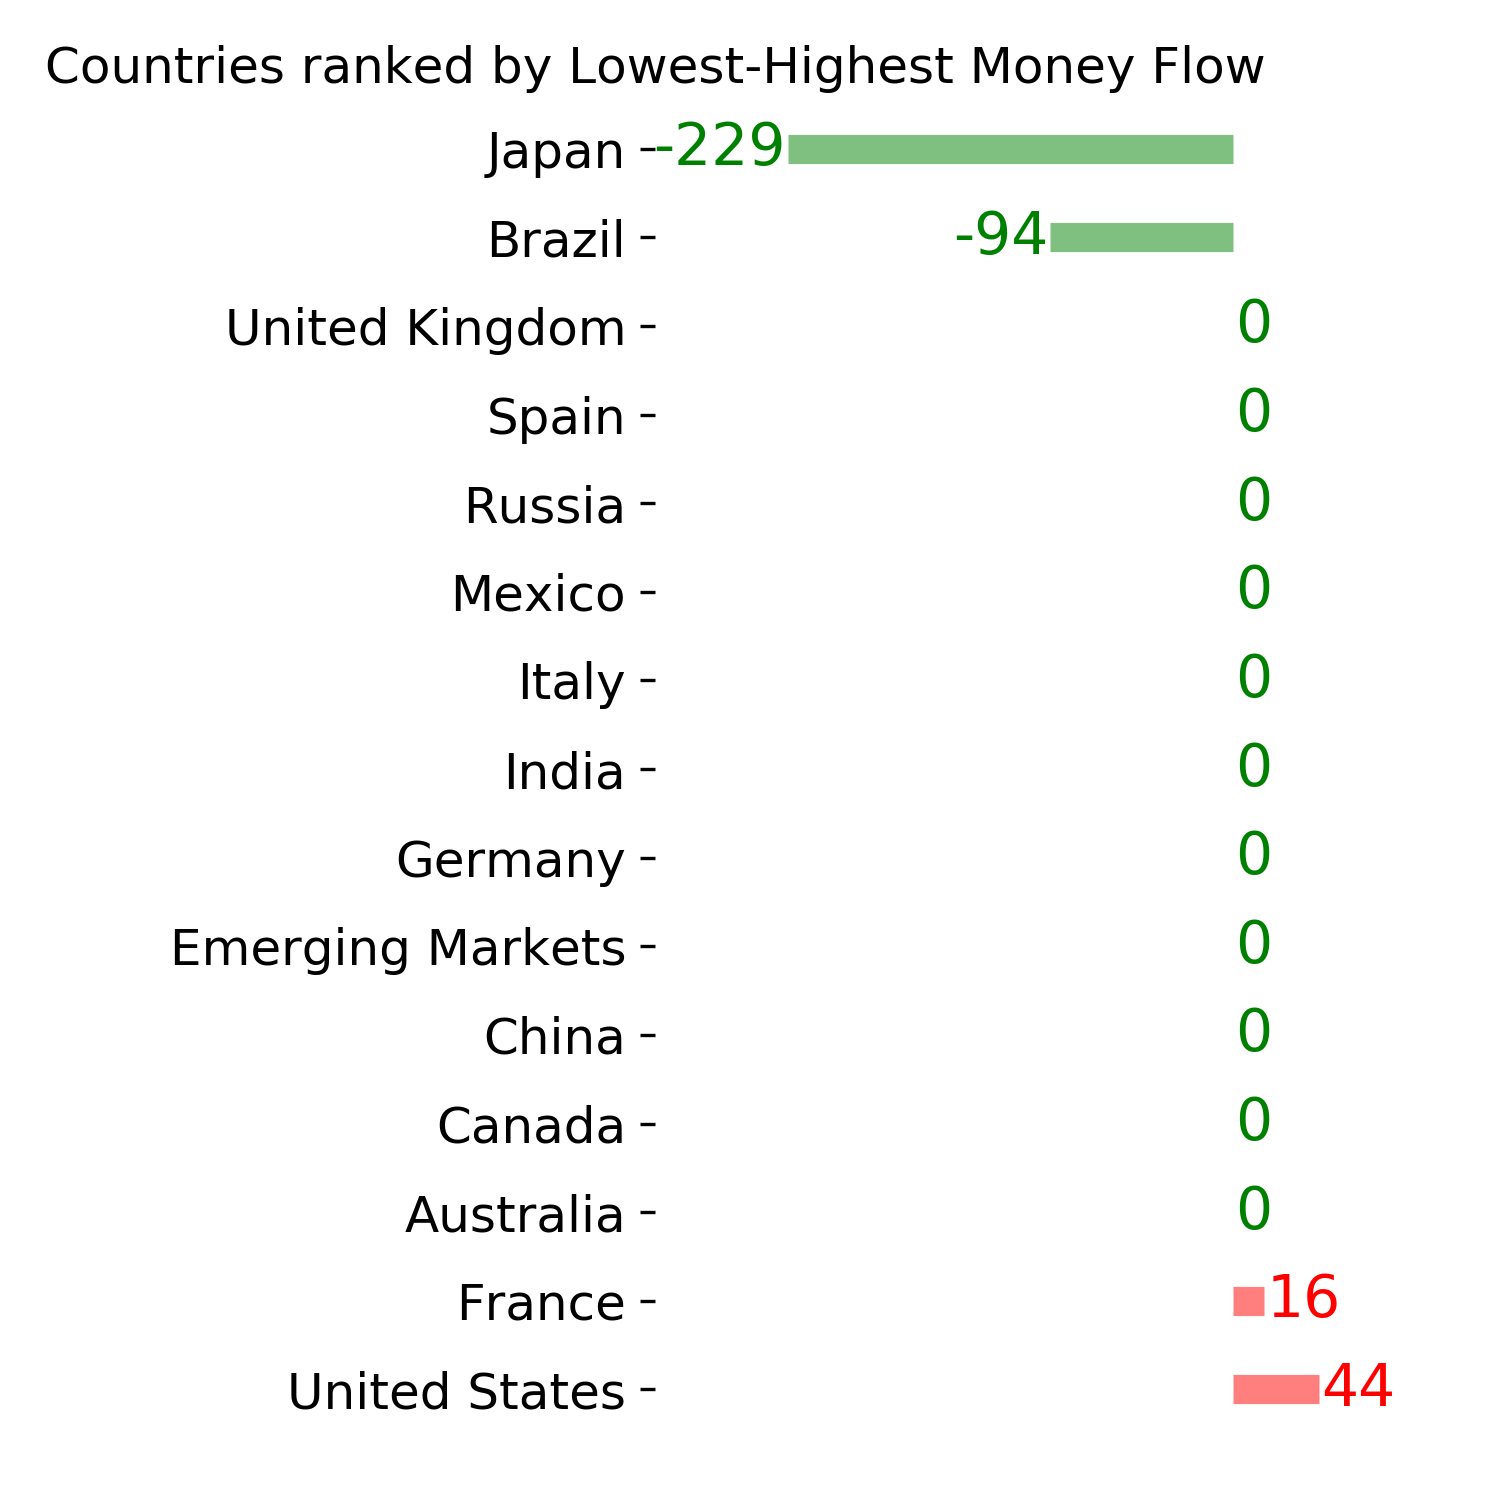
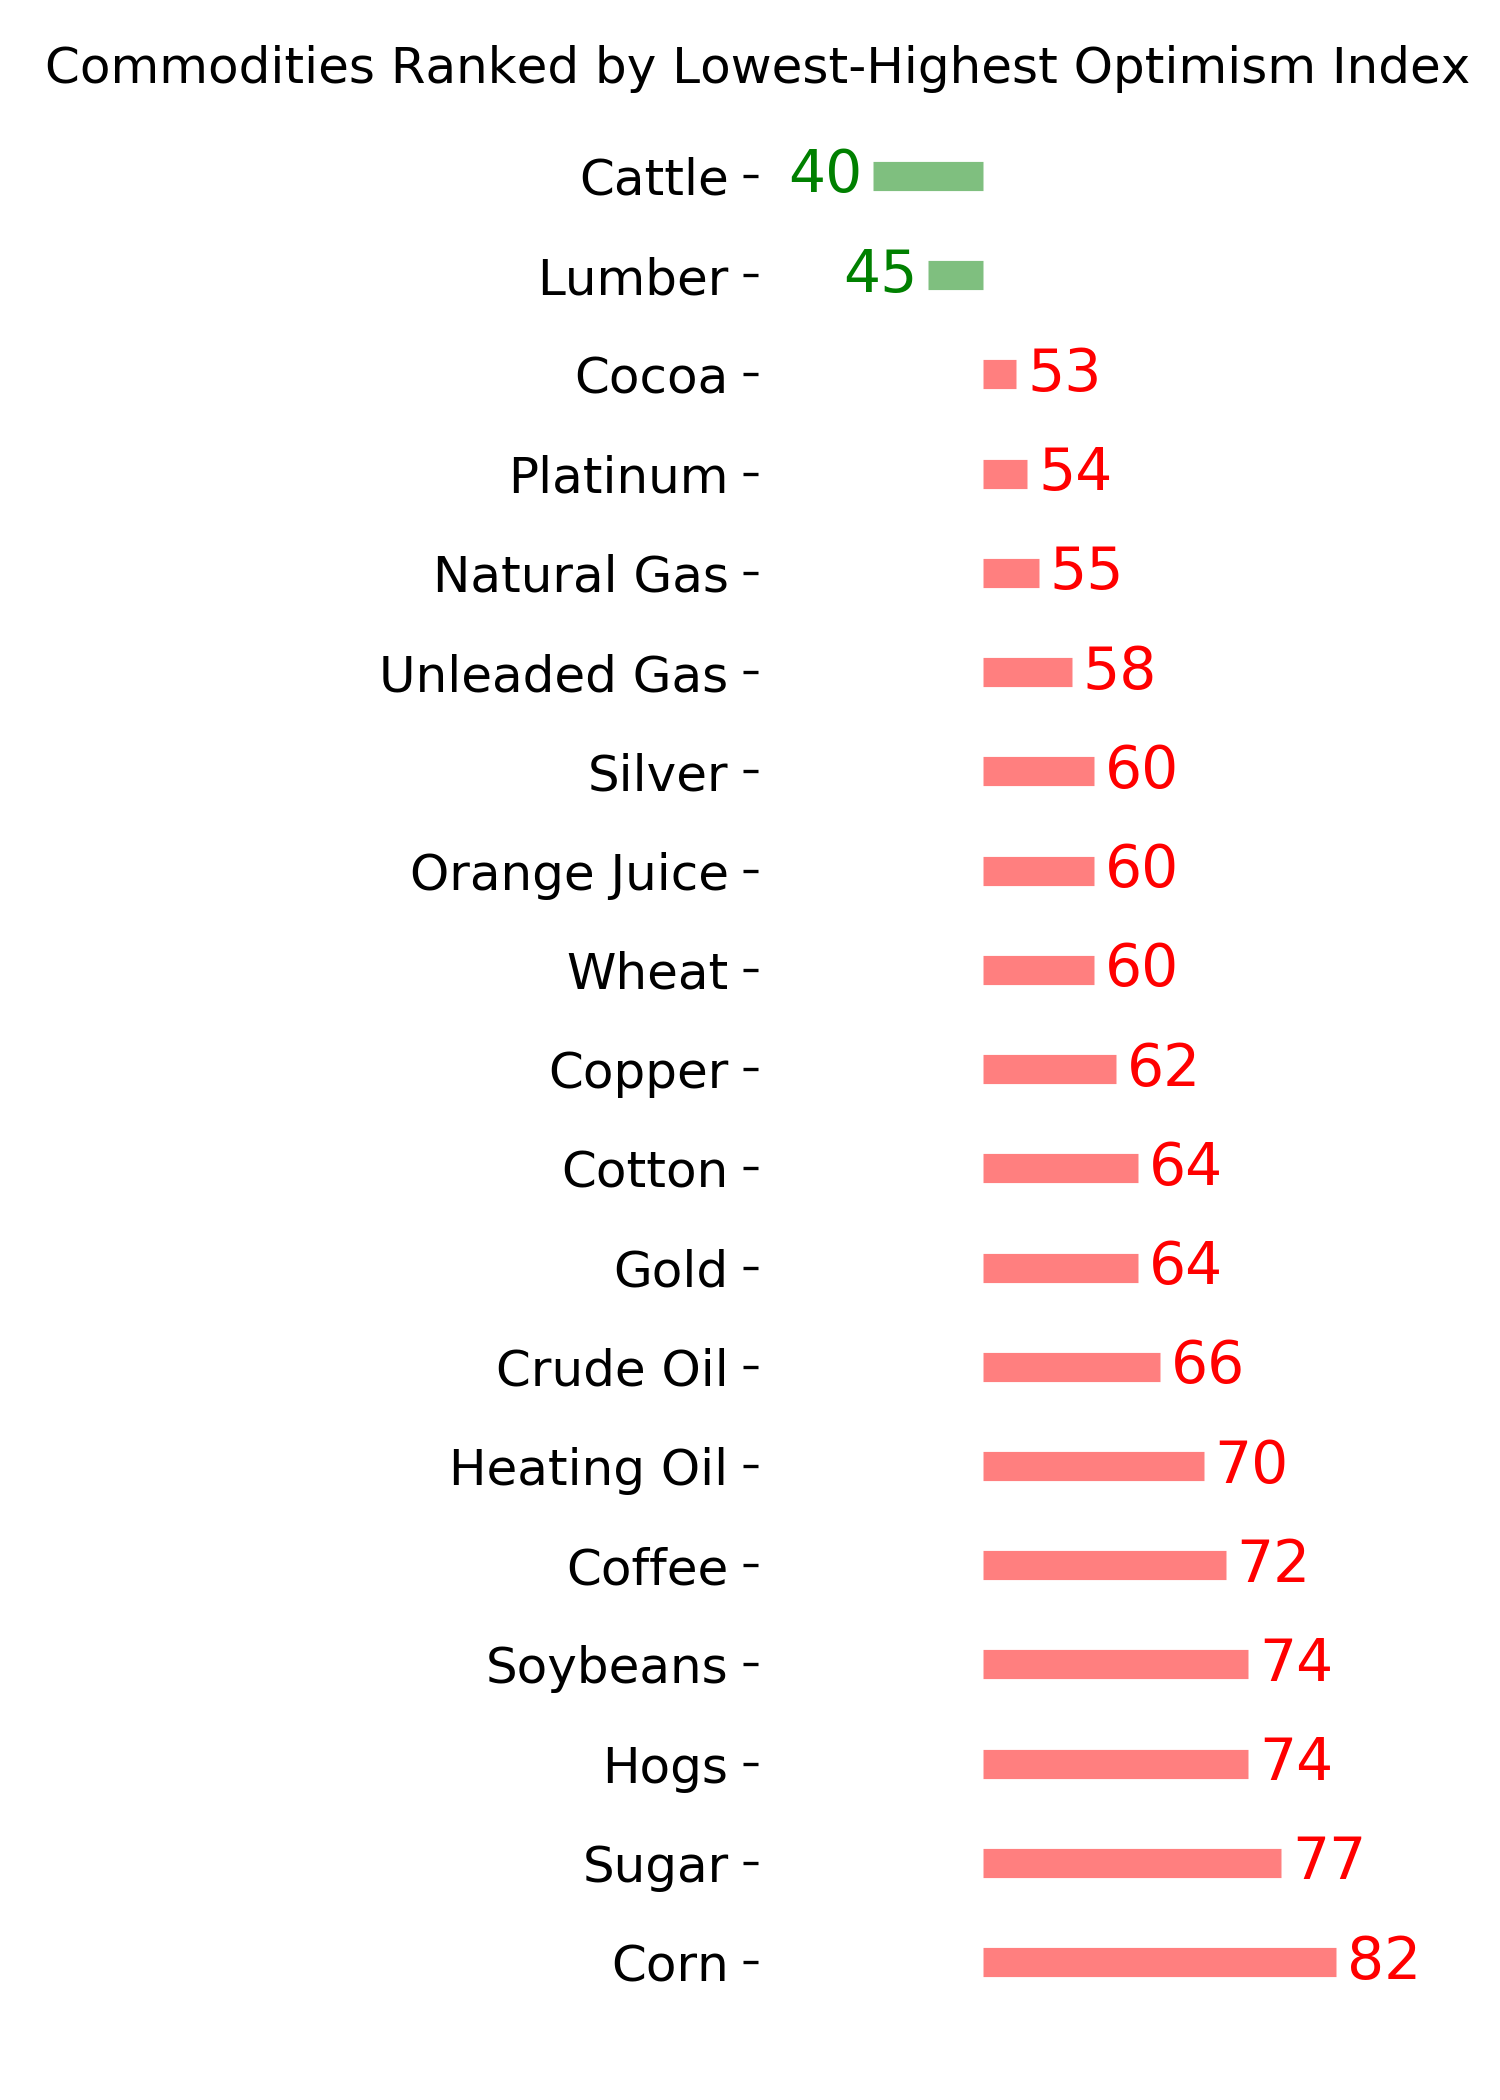
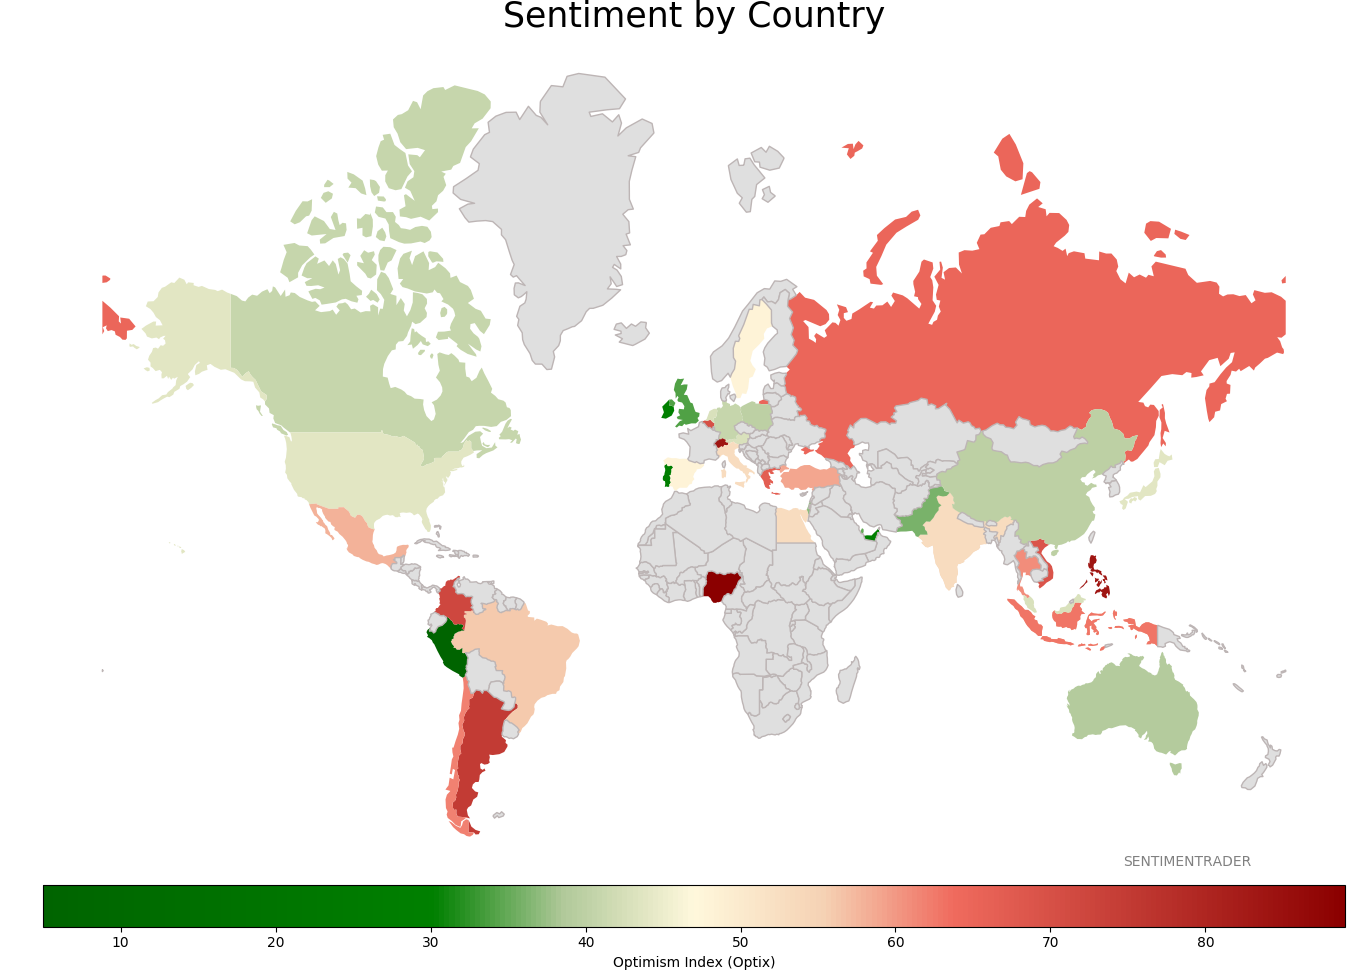
Ranks
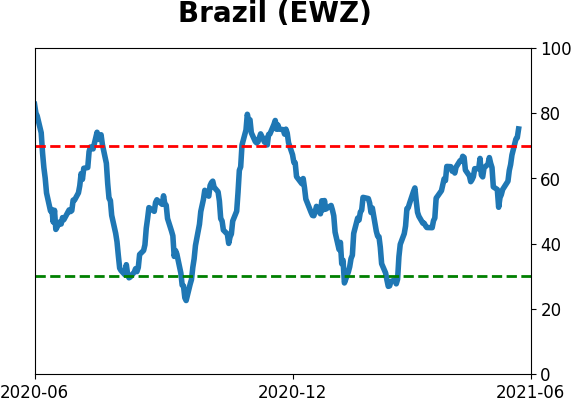
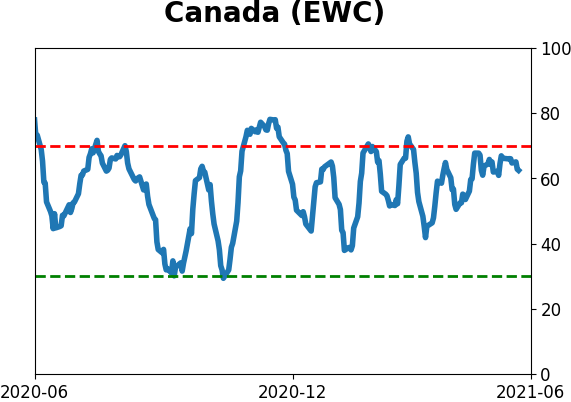
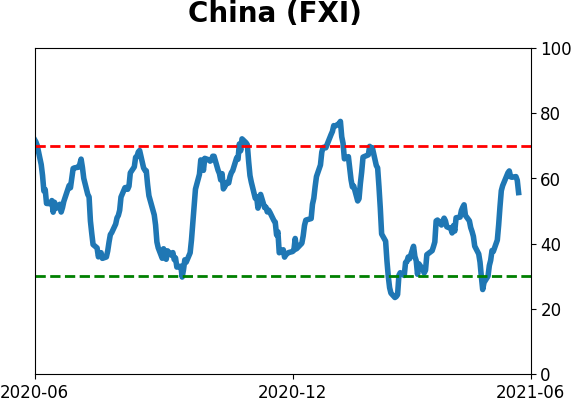
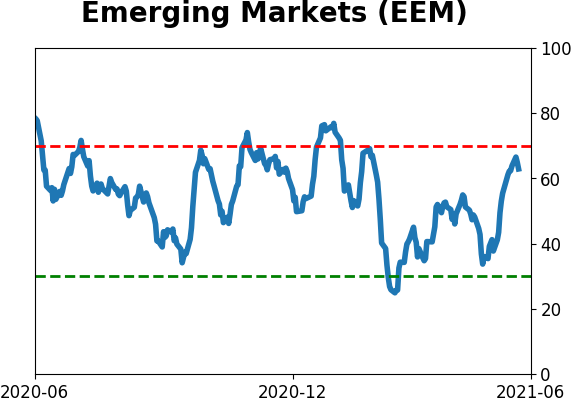
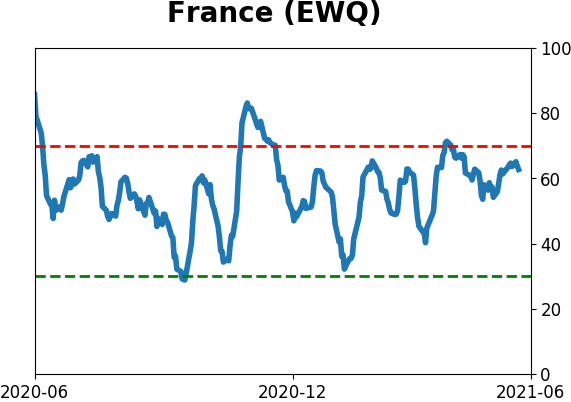
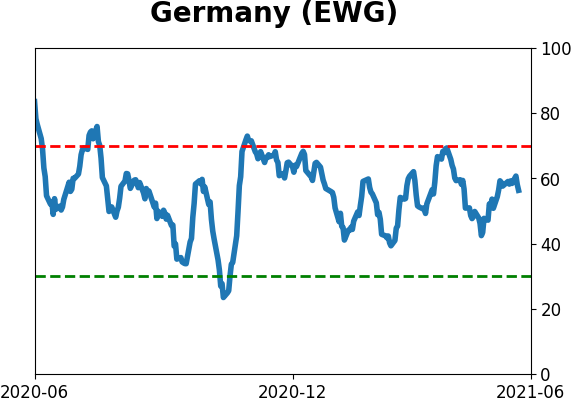
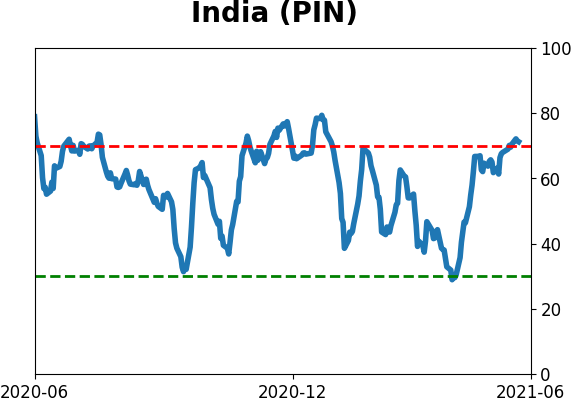
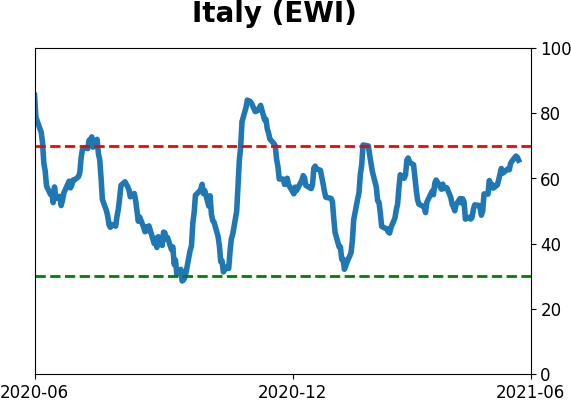
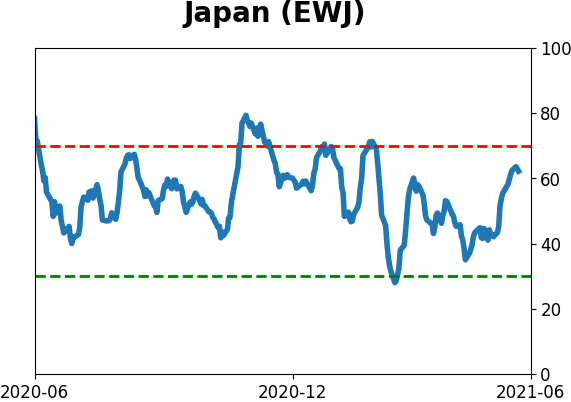
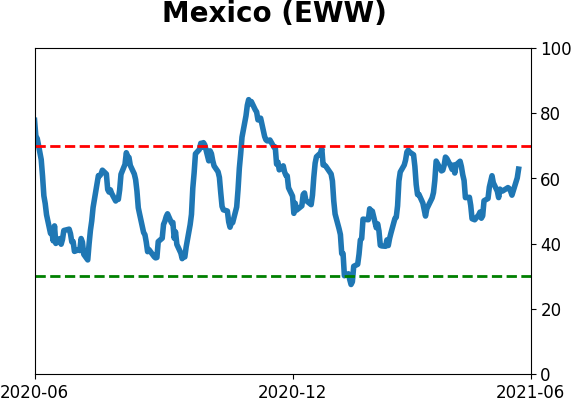
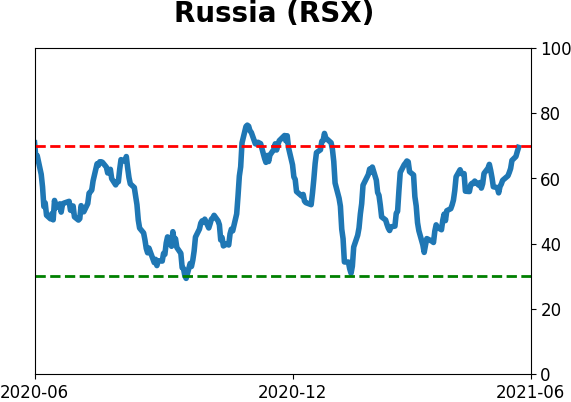
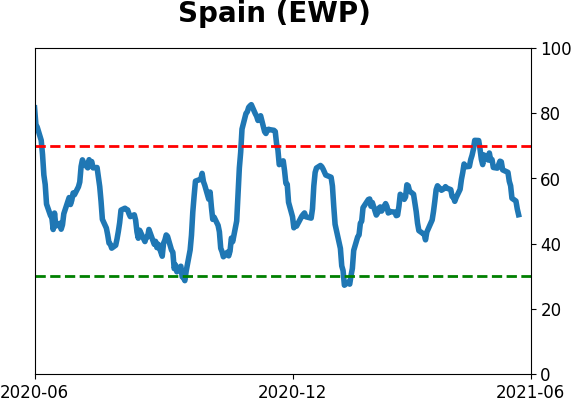
Sentiment Around The World
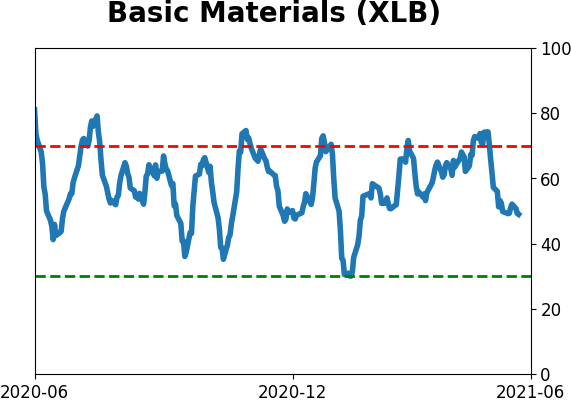
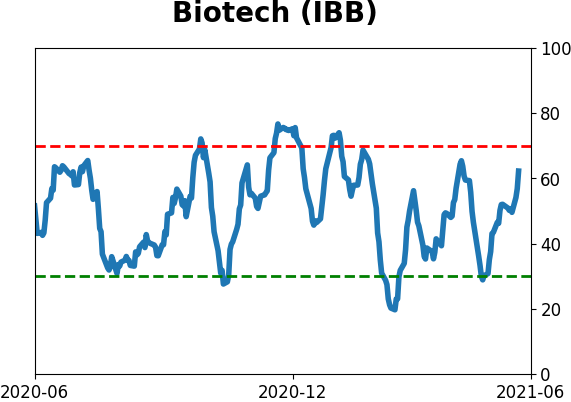
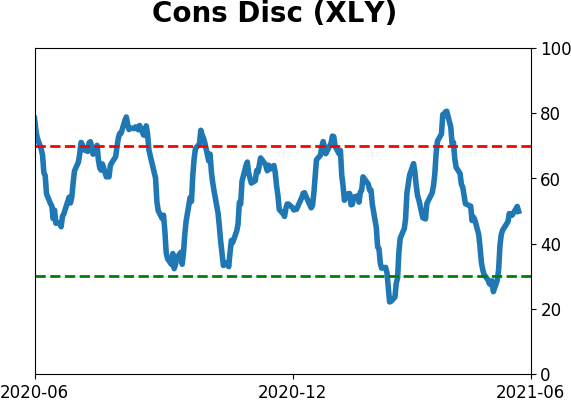
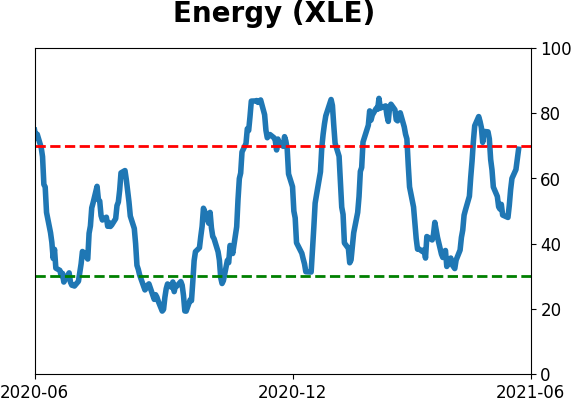
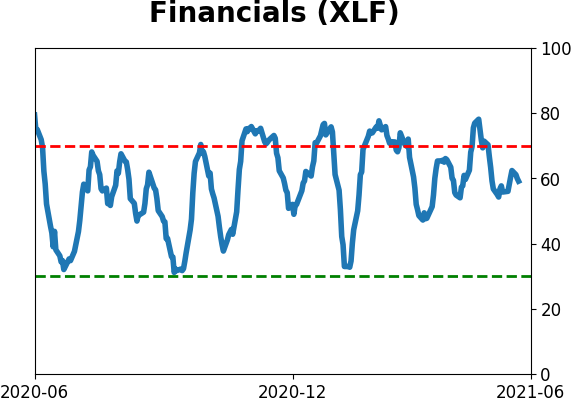
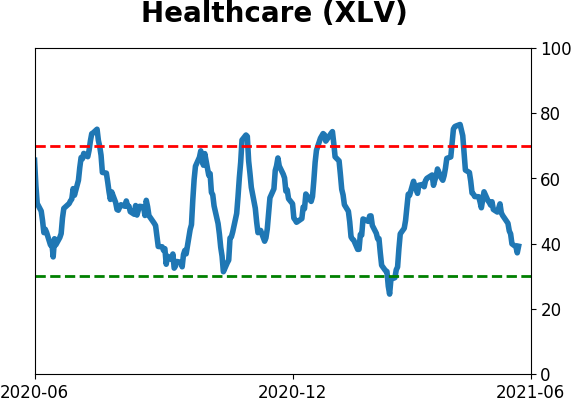
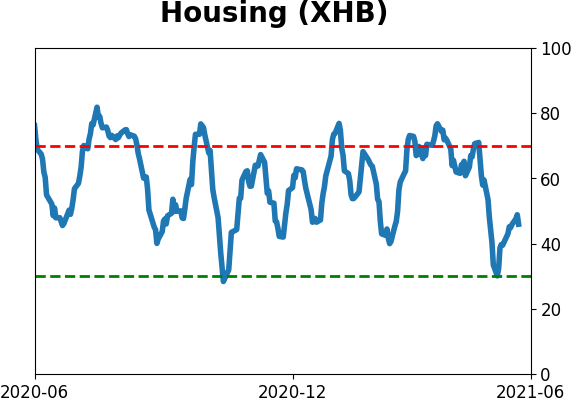
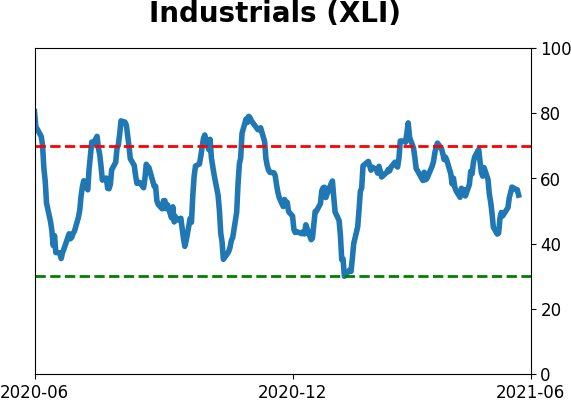
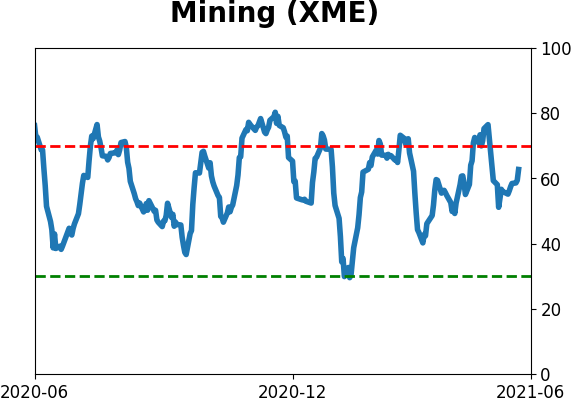
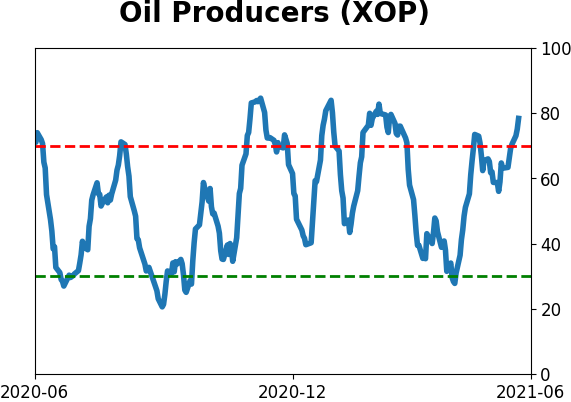
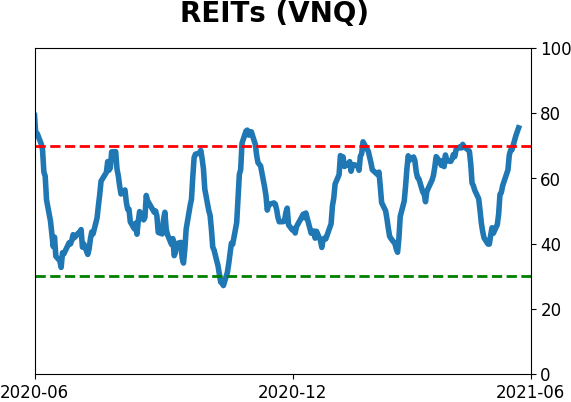
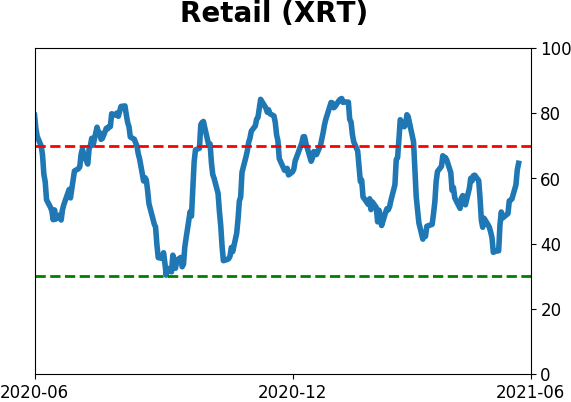
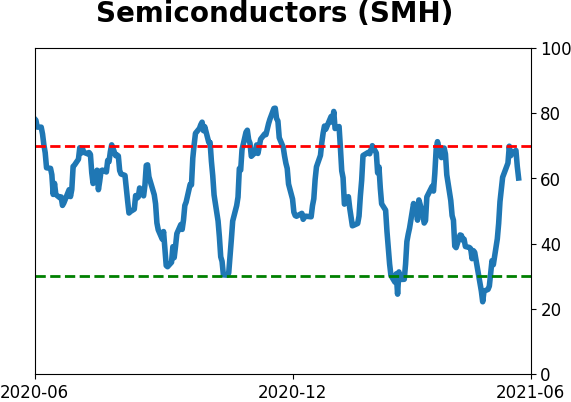
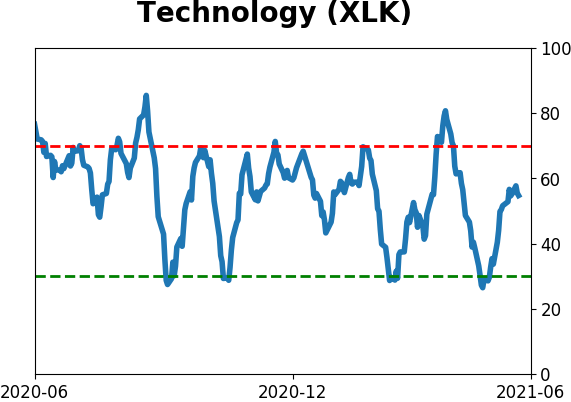
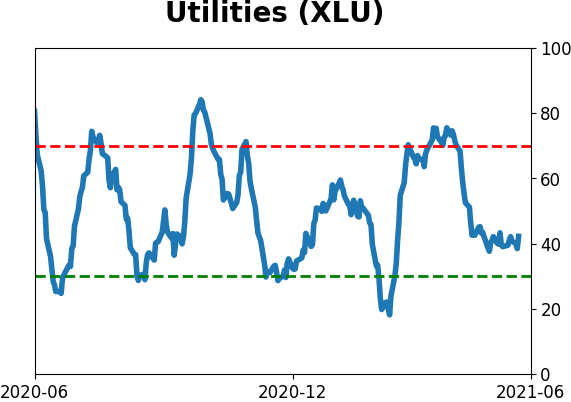
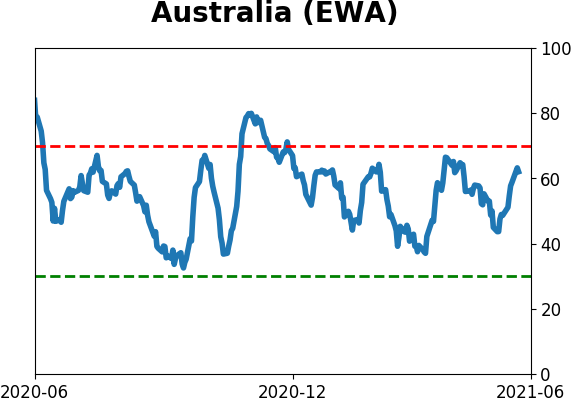
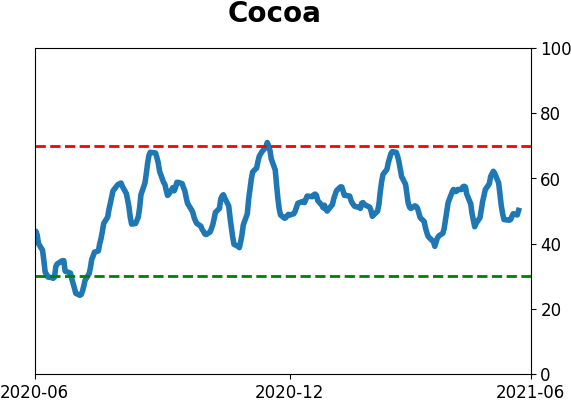
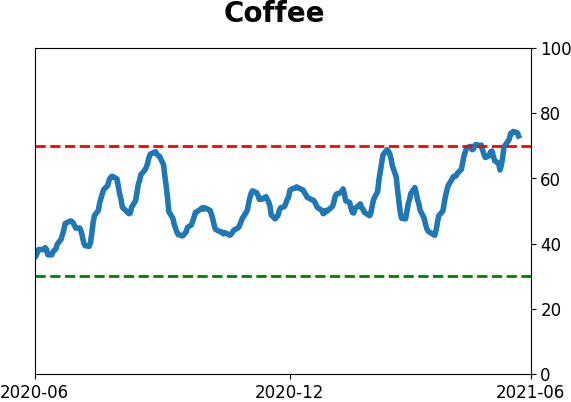
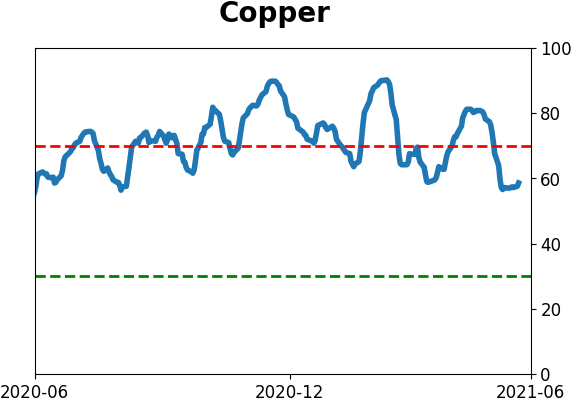
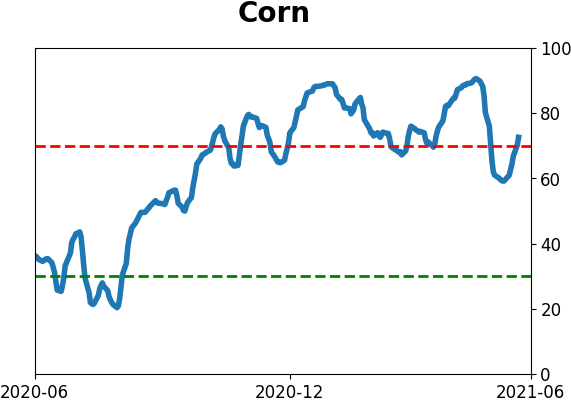
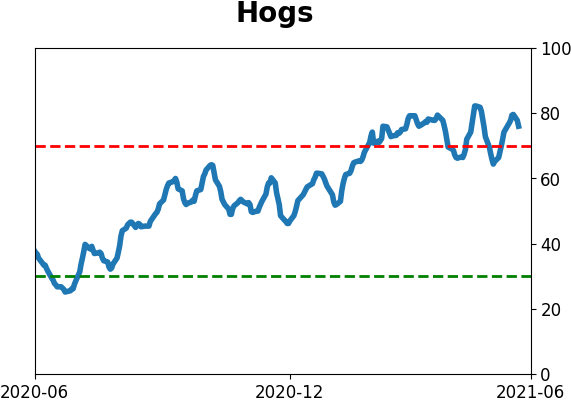
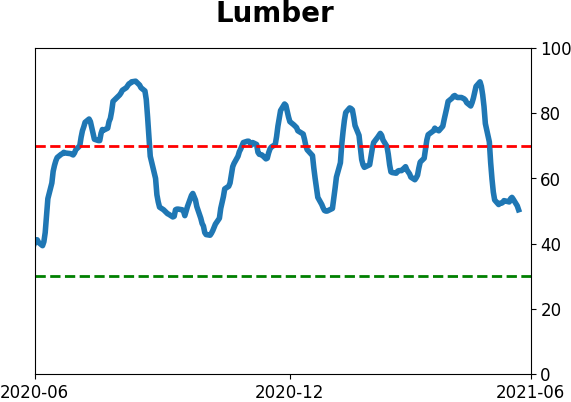
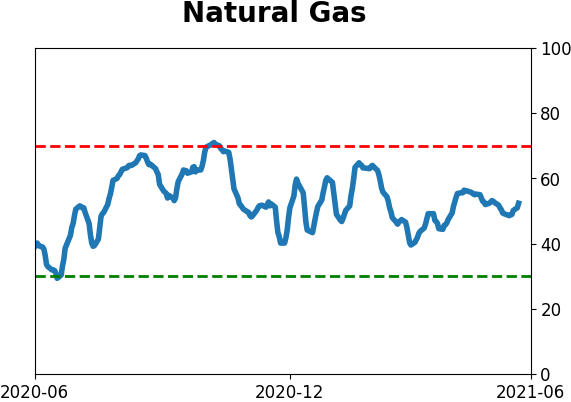
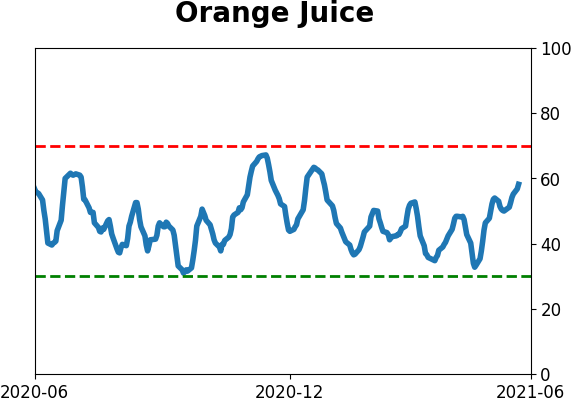
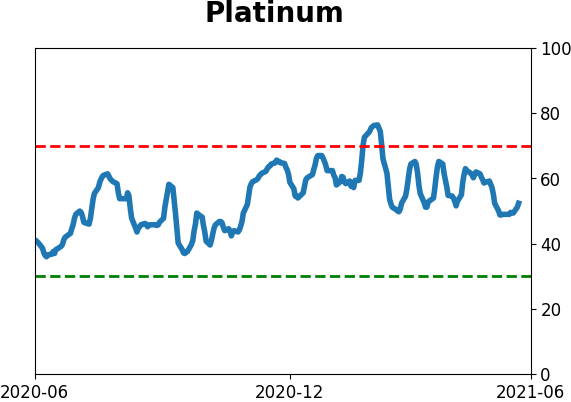
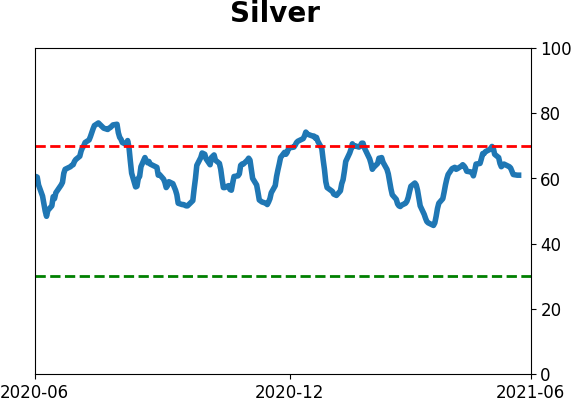
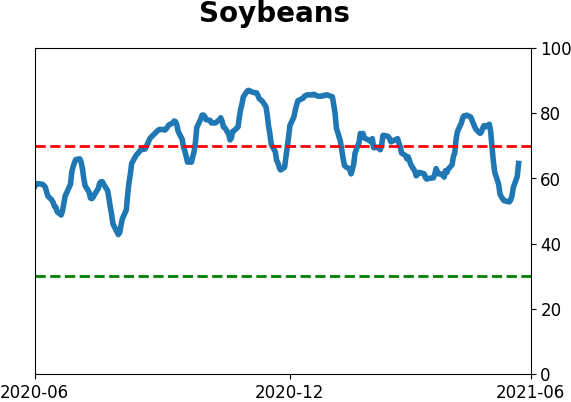
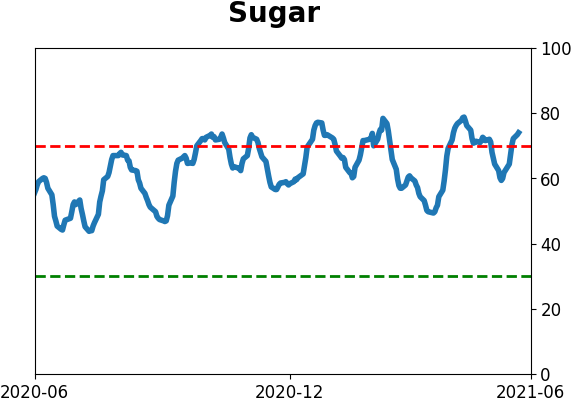
Optimism Index Thumbnails
|
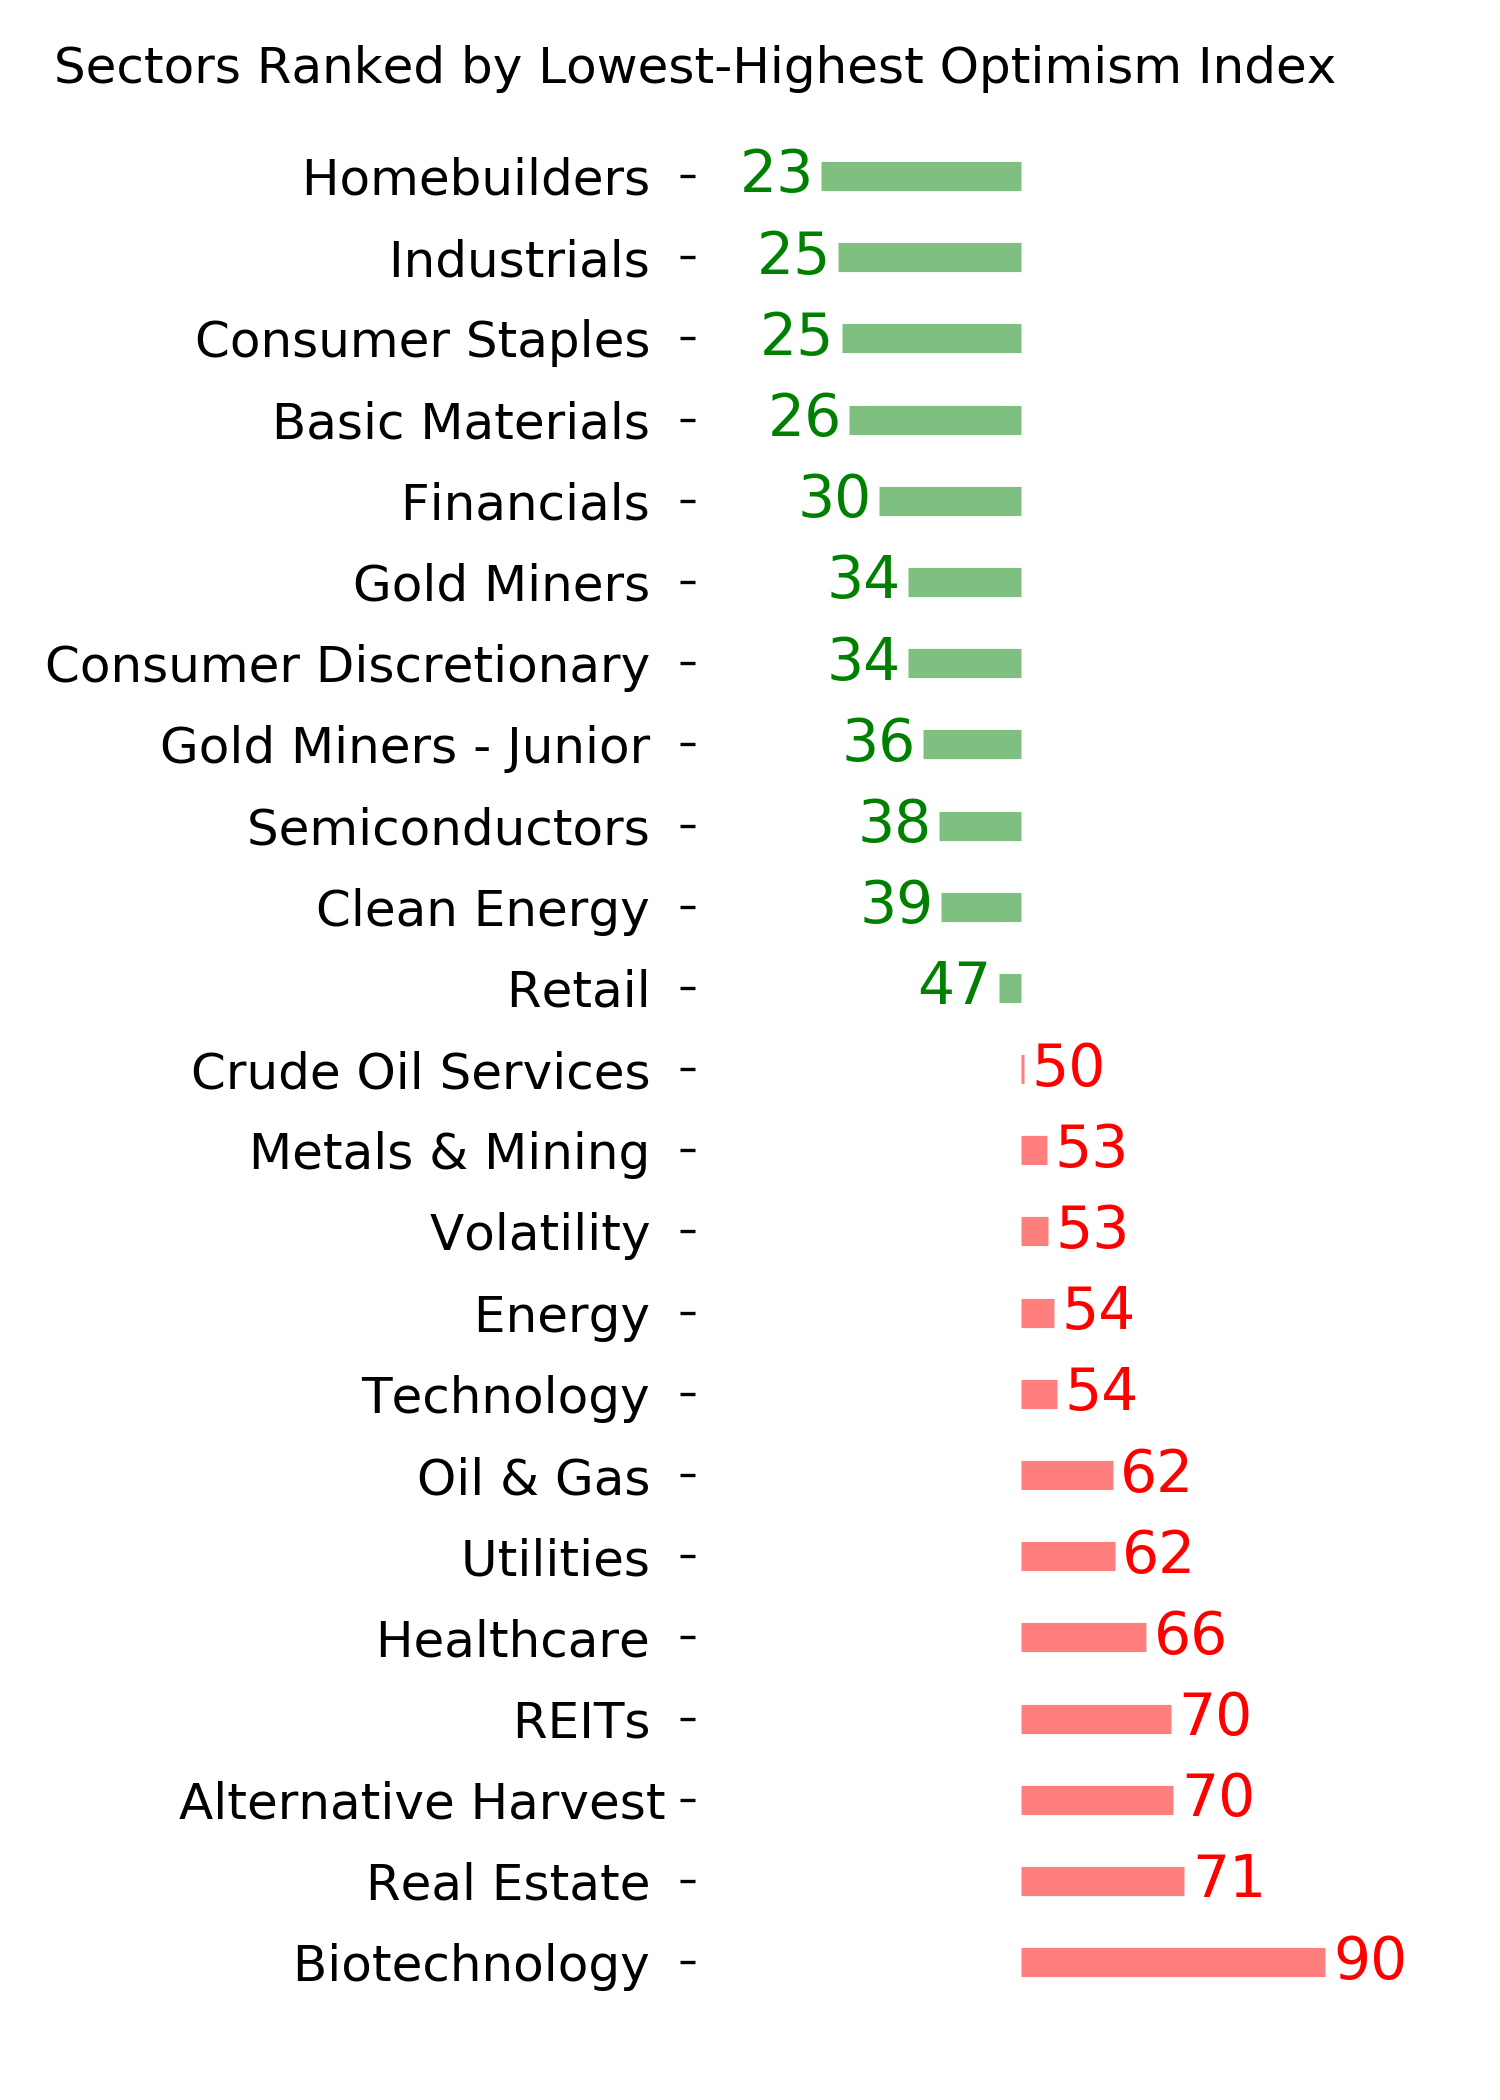
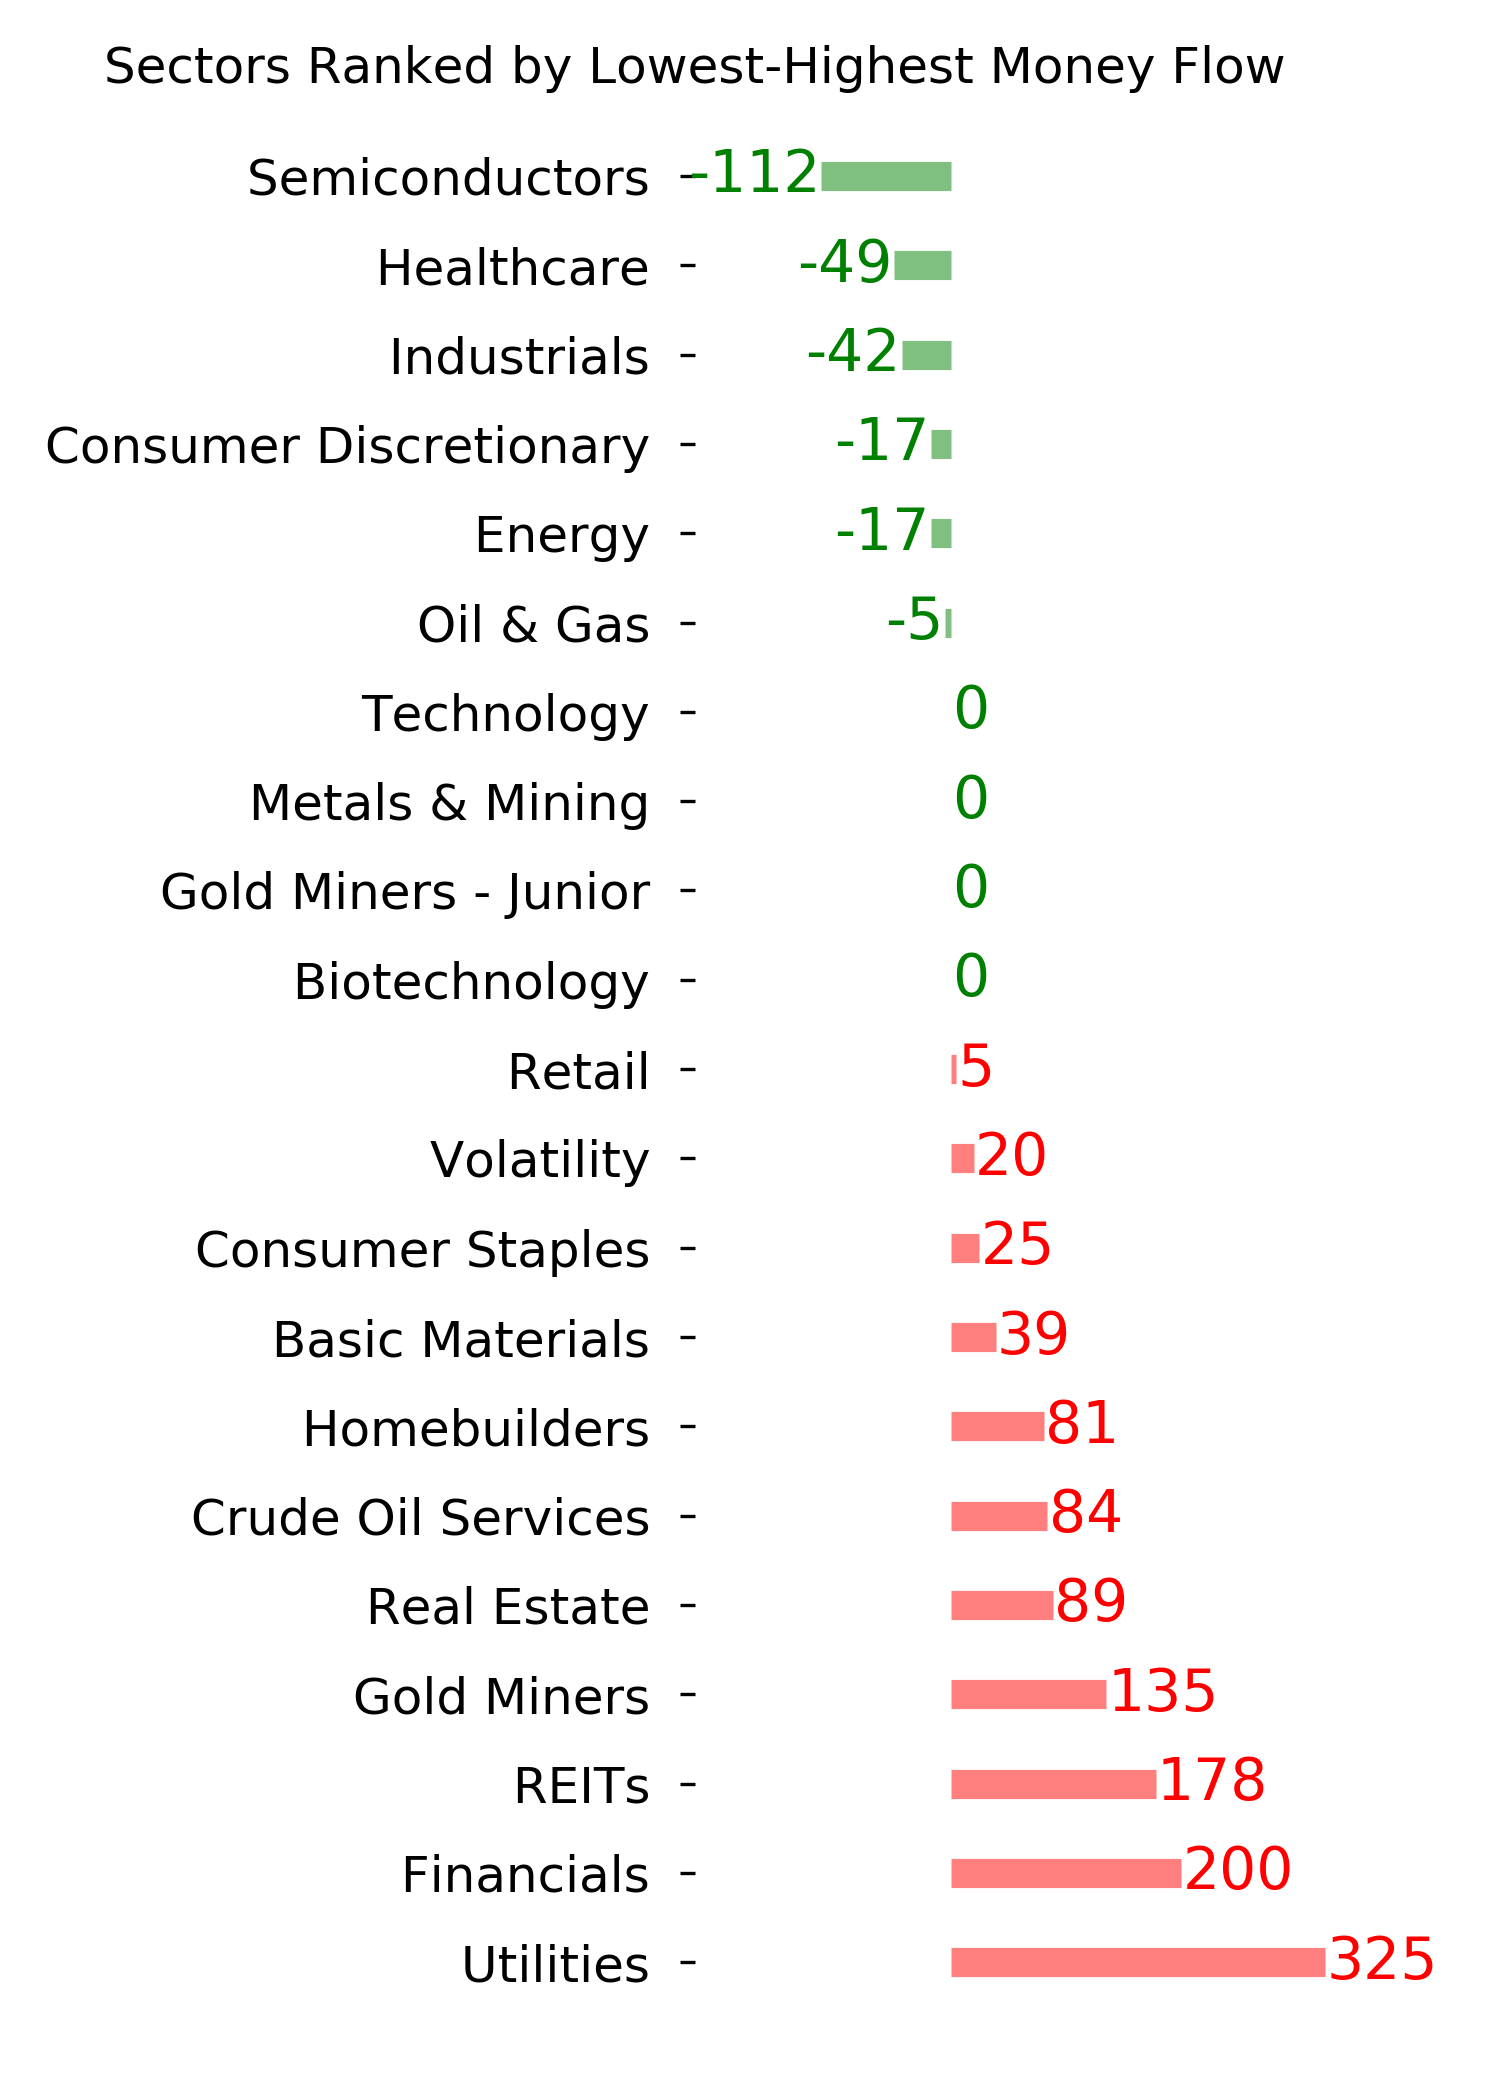
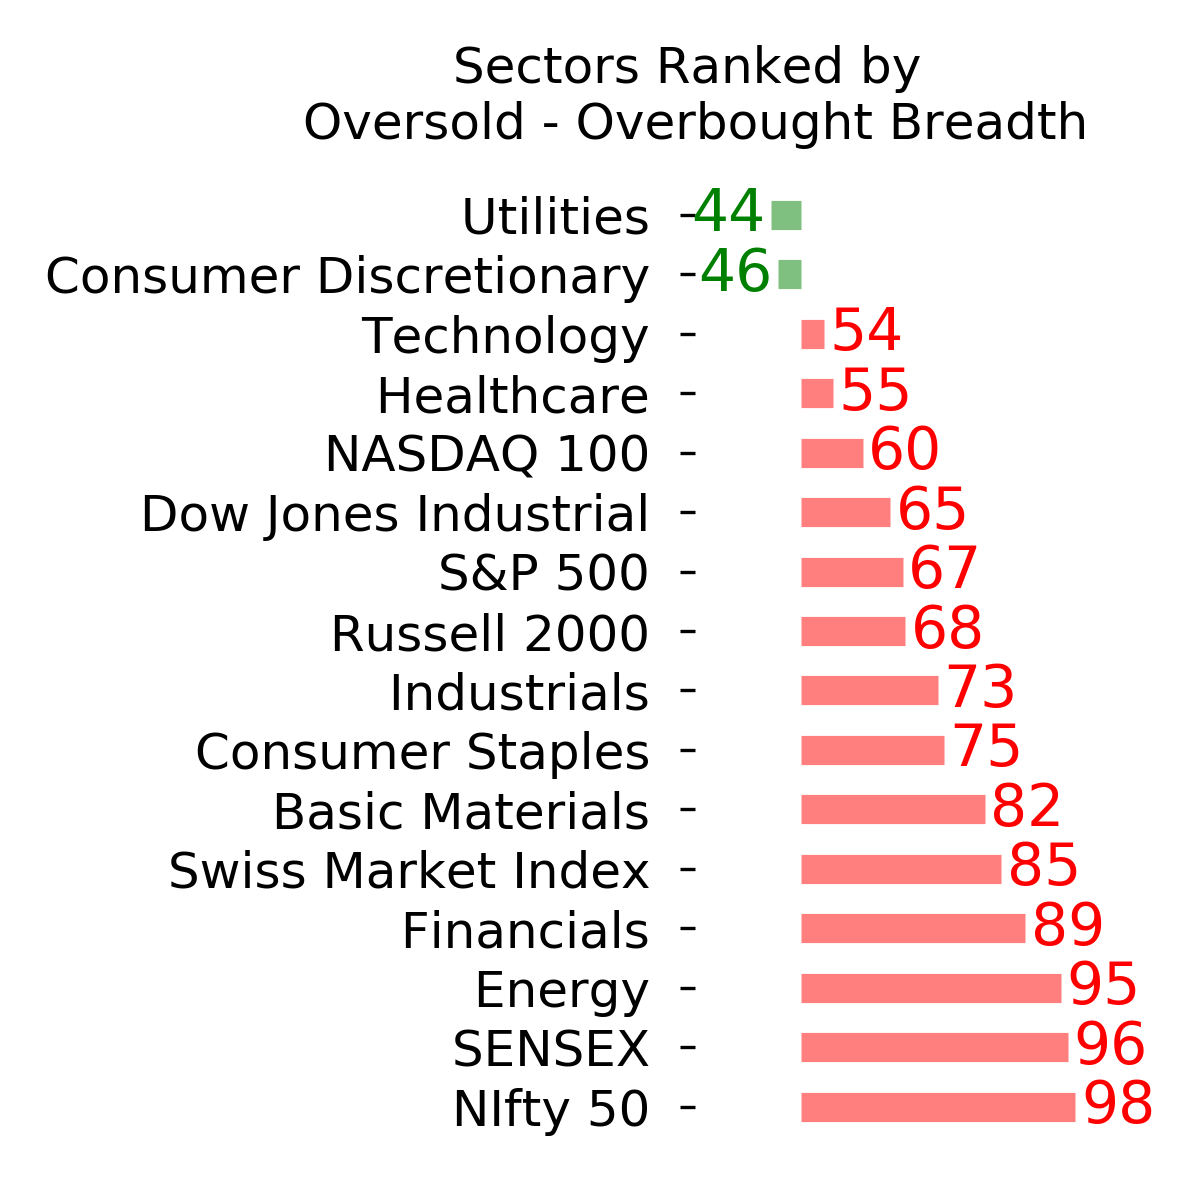
Sector ETF's - 10-Day Moving Average
|
|
|
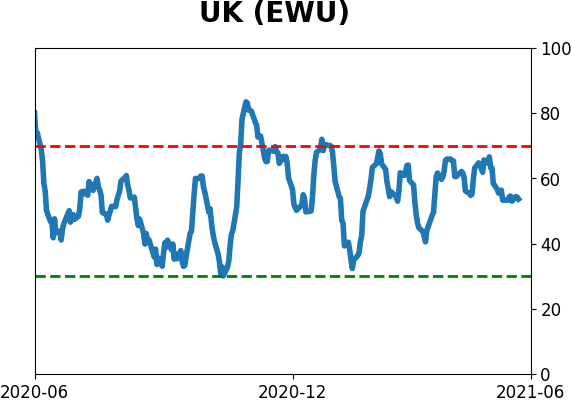
Country ETF's - 10-Day Moving Average
|
|
|
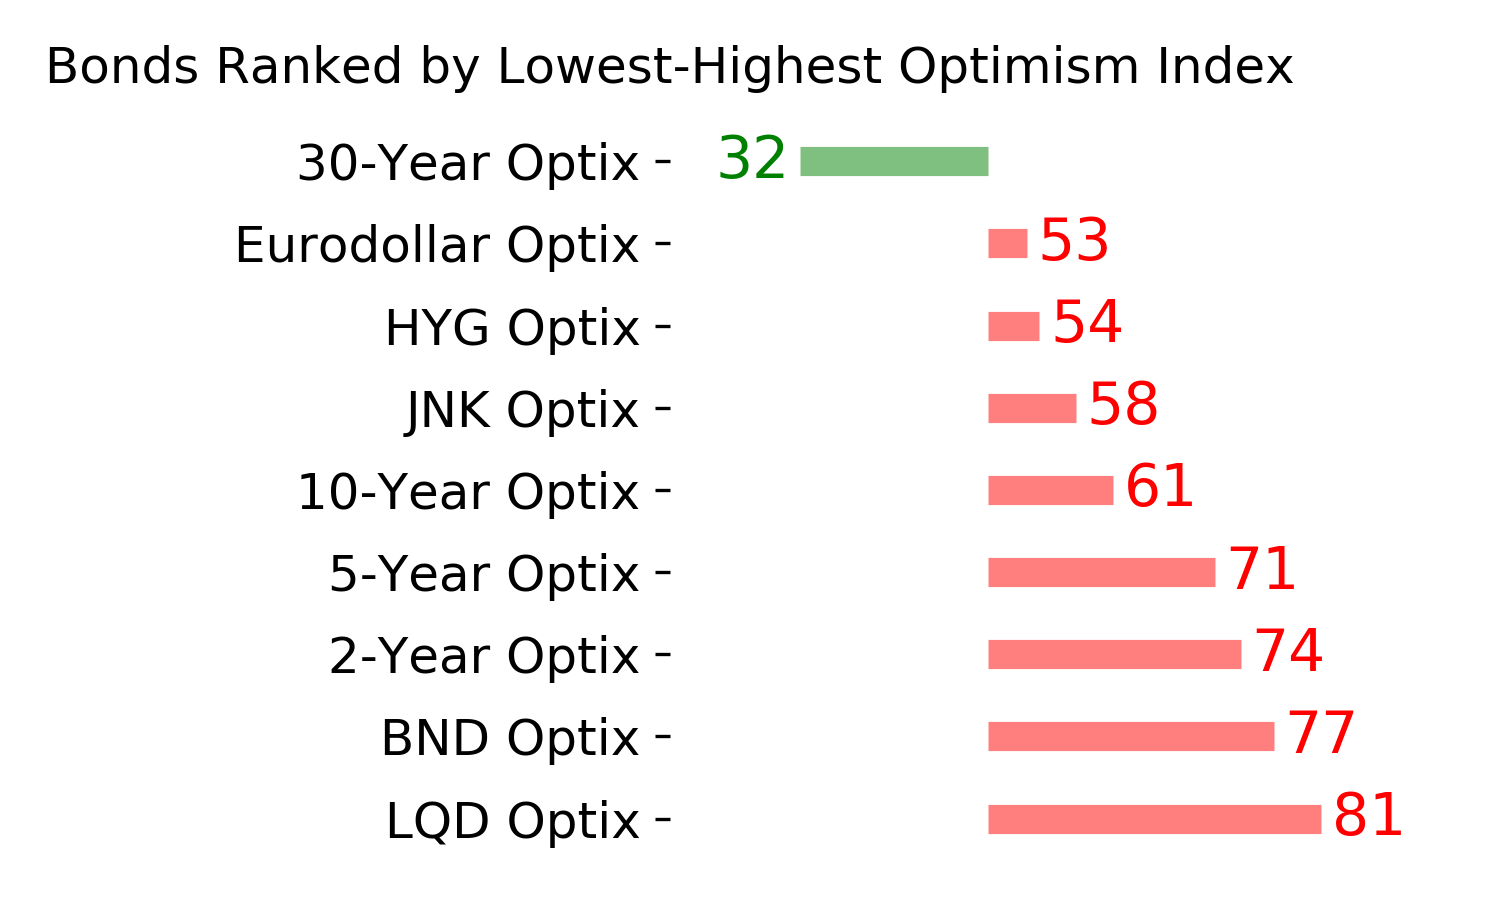
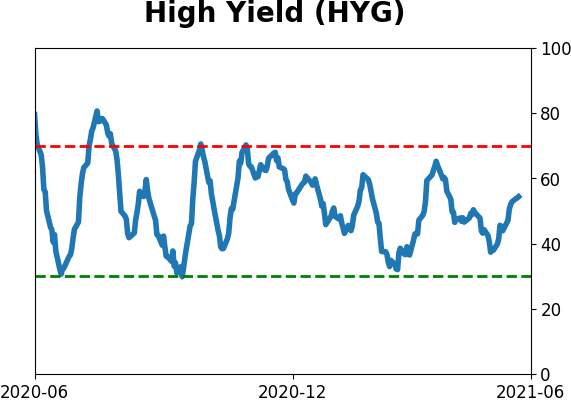
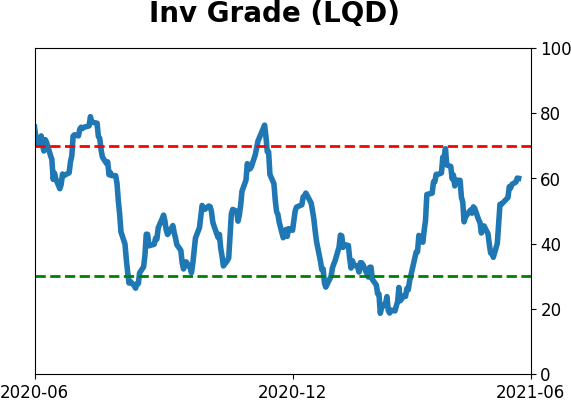
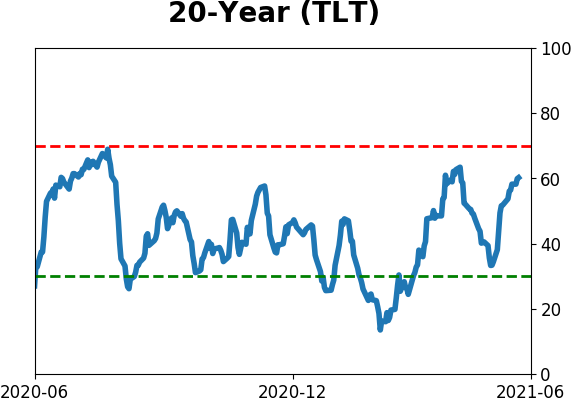
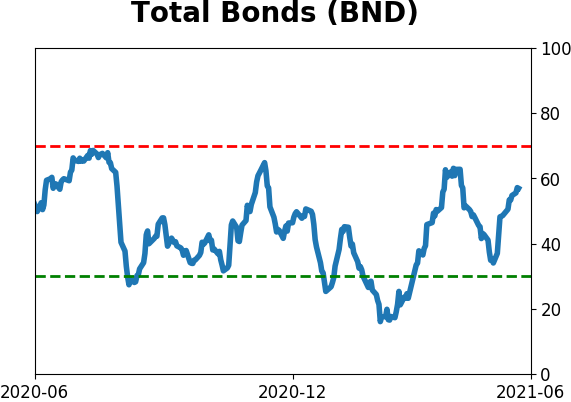
Bond ETF's - 10-Day Moving Average
|
|
|
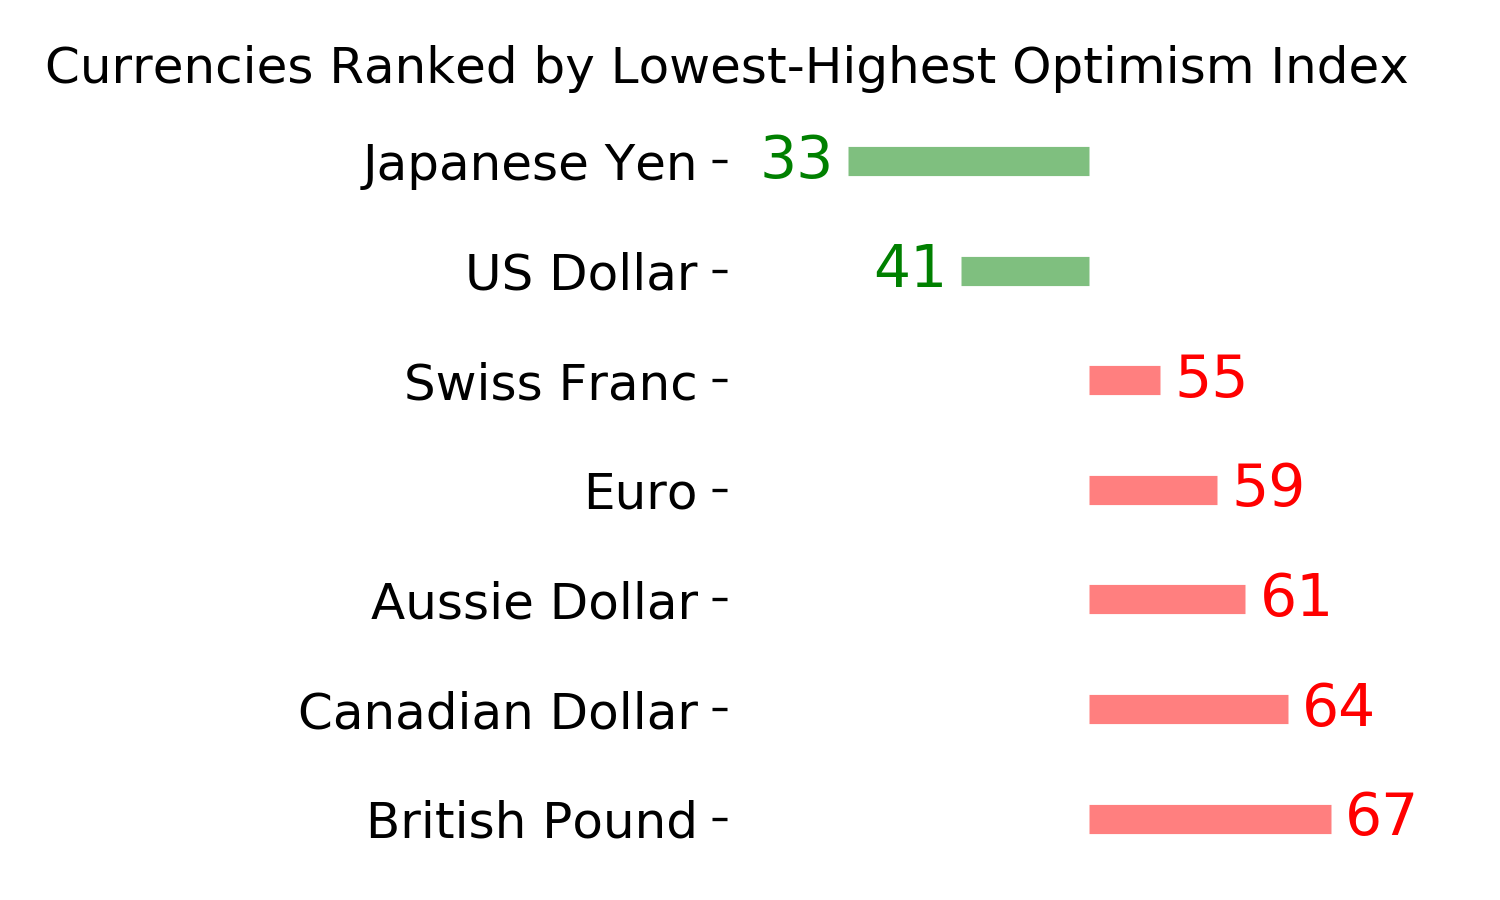
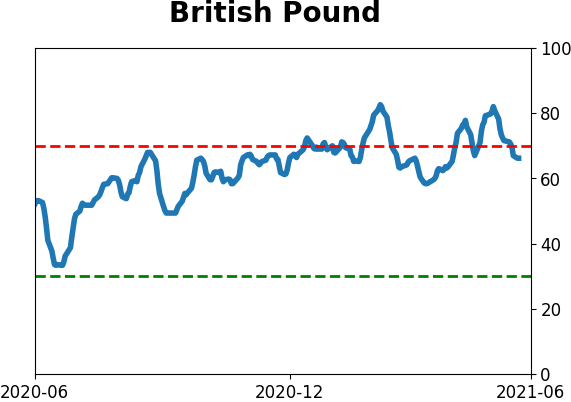
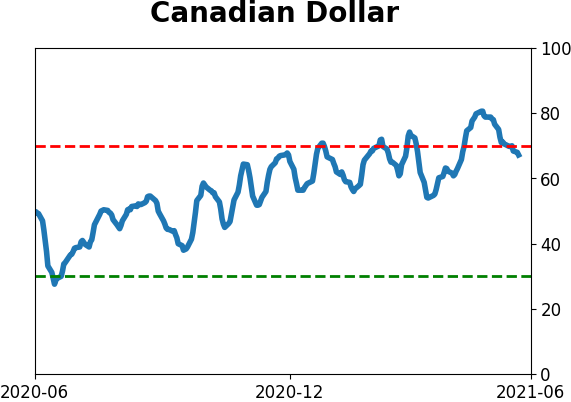
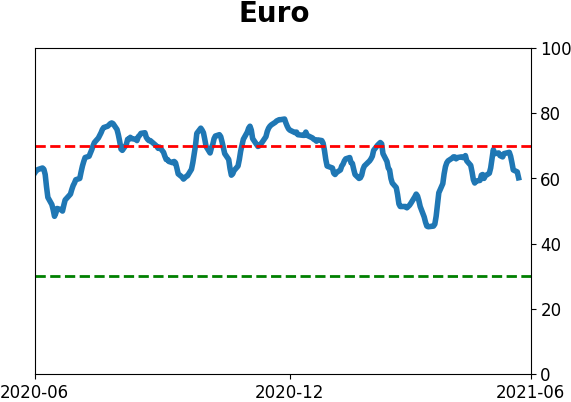
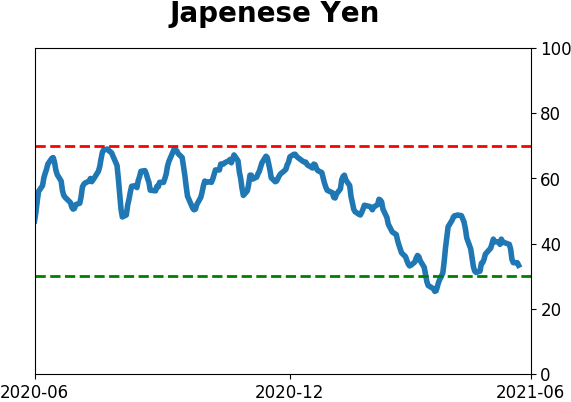
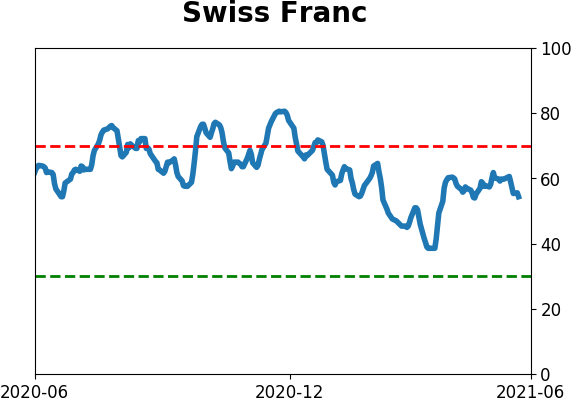
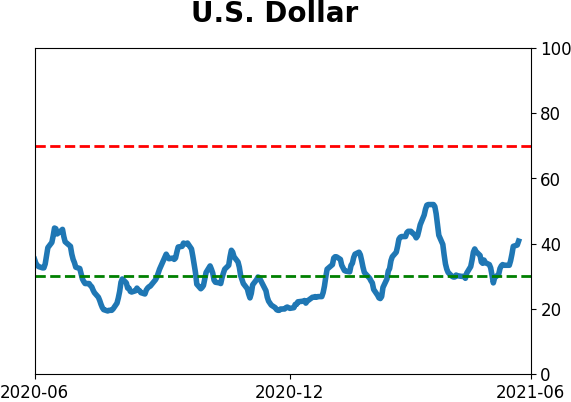
Currency ETF's - 5-Day Moving Average
|
|
|
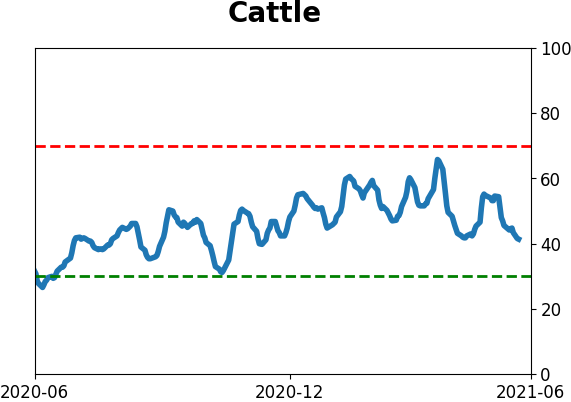
Commodity ETF's - 5-Day Moving Average
|
|