Headlines
|
|
A Reversal Signal With a Perfect Record:
After heavy selling on Monday, buyers more than made up for it with buying pressure on Tuesday. That triggered a back-to-back reversal in the Up Volume Ratio, which has been a very good sign for future returns.
Bottom Line:
See the Outlook & Allocations page for more details on these summaries STOCKS: Hold
The speculative frenzy in February is wrung out. Internal dynamics have mostly held up, with some exceptions. Many of our studies still show a mixed to poor short-term view, with medium- and long-term ones turning more positive. BONDS: Hold
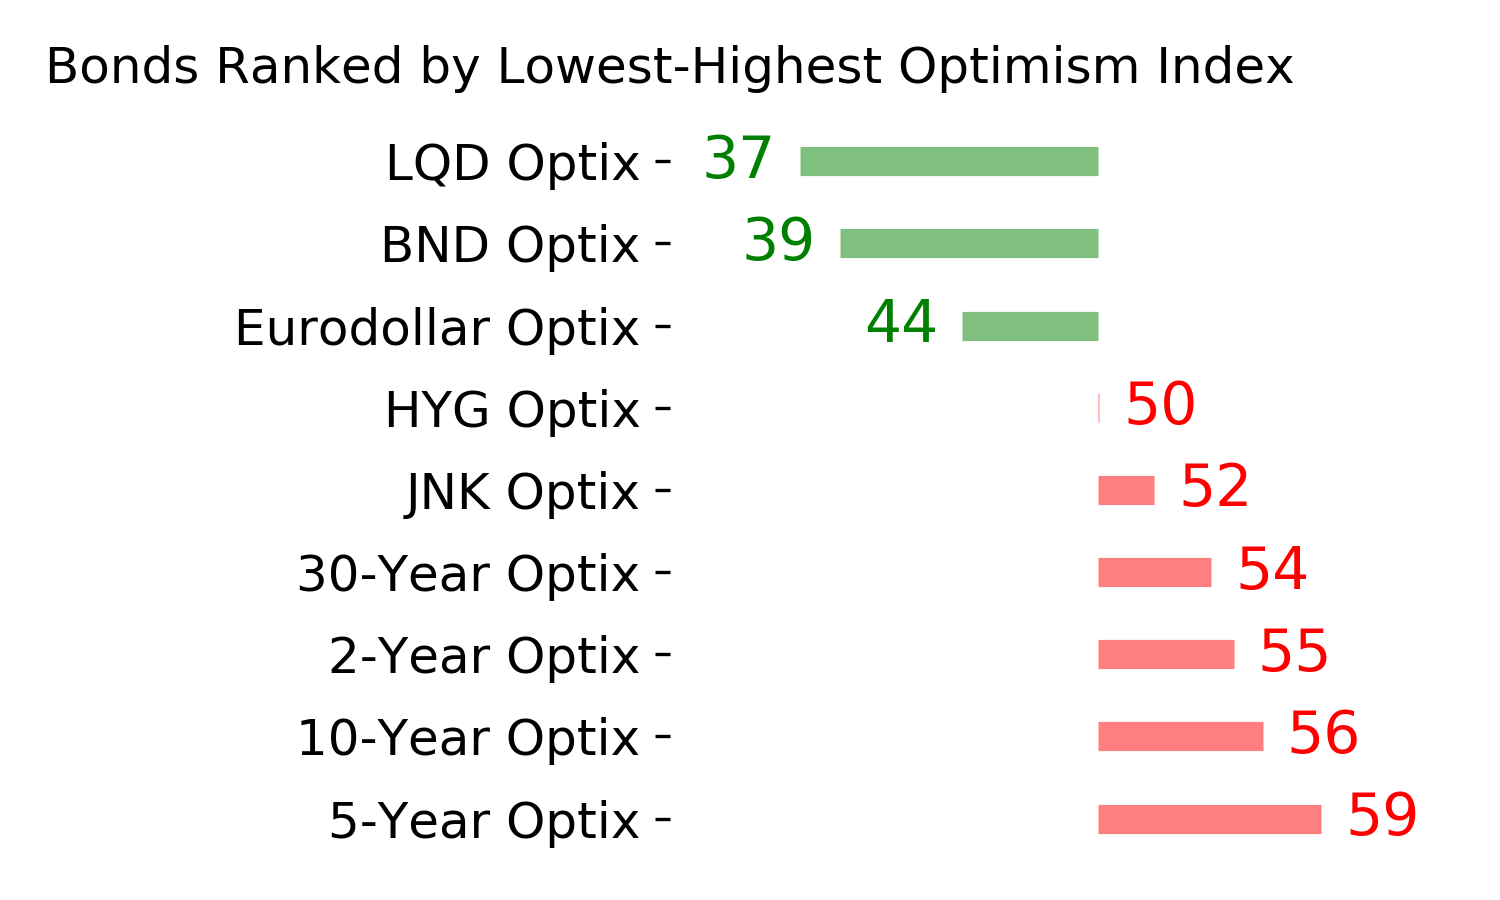
Various parts of the market got hit in March, with the lowest Bond Optimism Index we usually see during healthy environments. After a shaky couple of weeks, the broad bond market has modestly recovered. Not a big edge here either way. GOLD: Hold
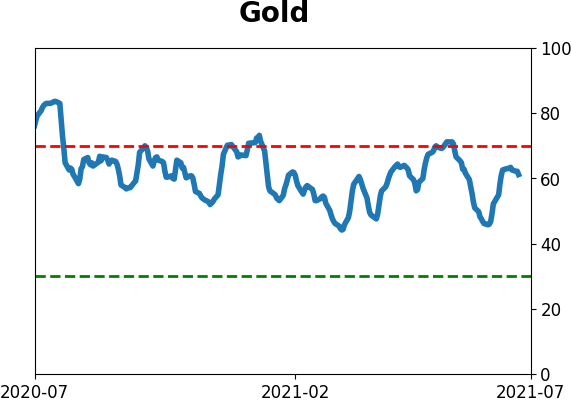
Gold and miners have done very well, recovering above long-term trend lines. The issue is that both have tended to perform poorly after similar situations - will have to wait and see how it plays out.
|
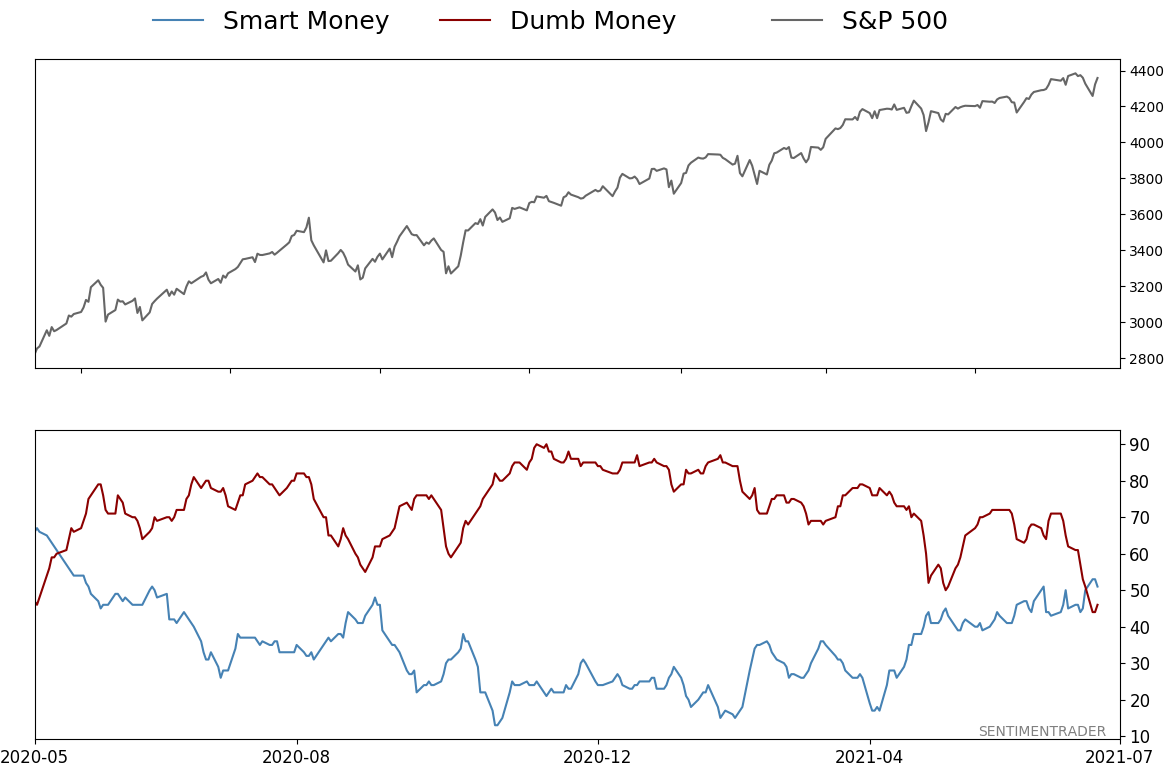
Smart / Dumb Money Confidence
|
Smart Money Confidence: 51%
Dumb Money Confidence: 46%
|
|
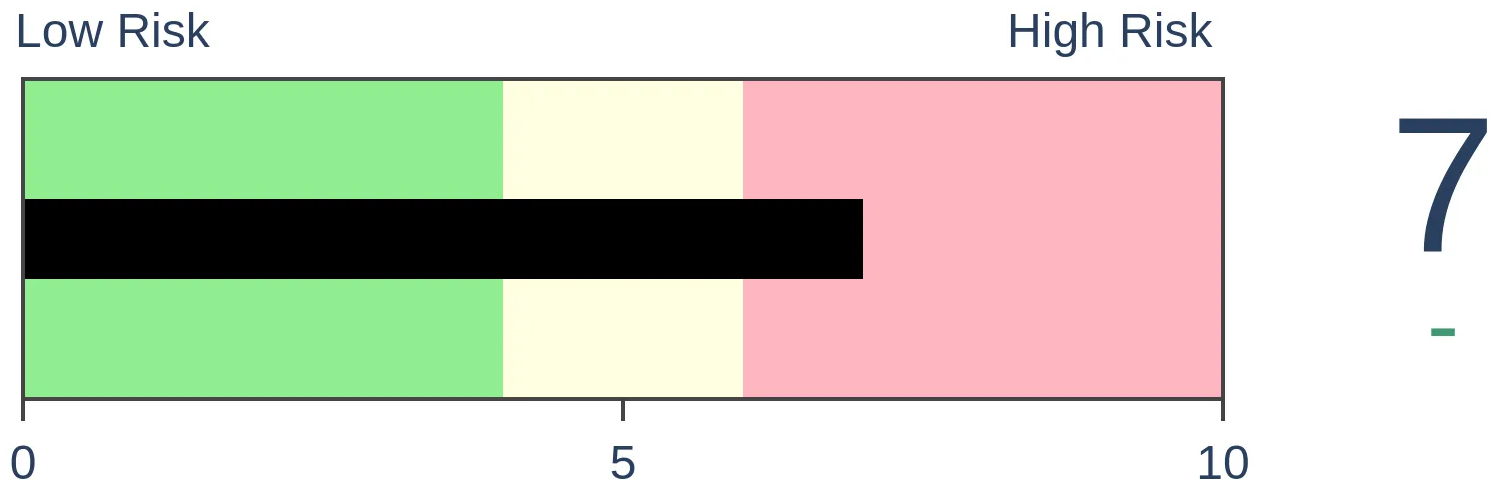
Risk Levels
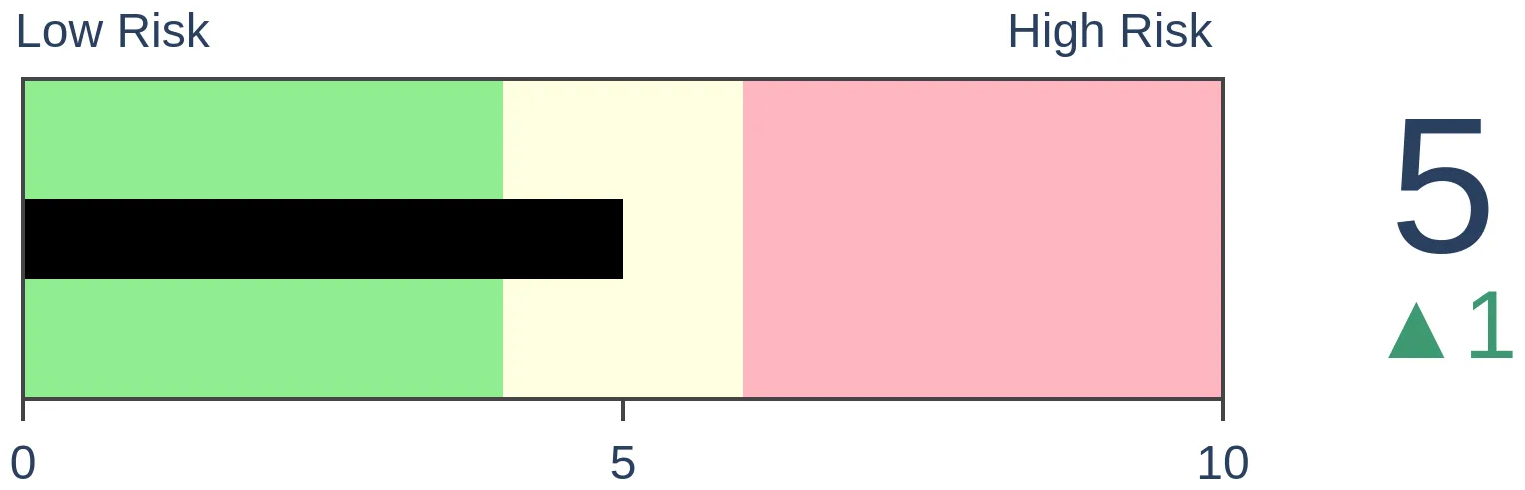
Stocks Short-Term
|
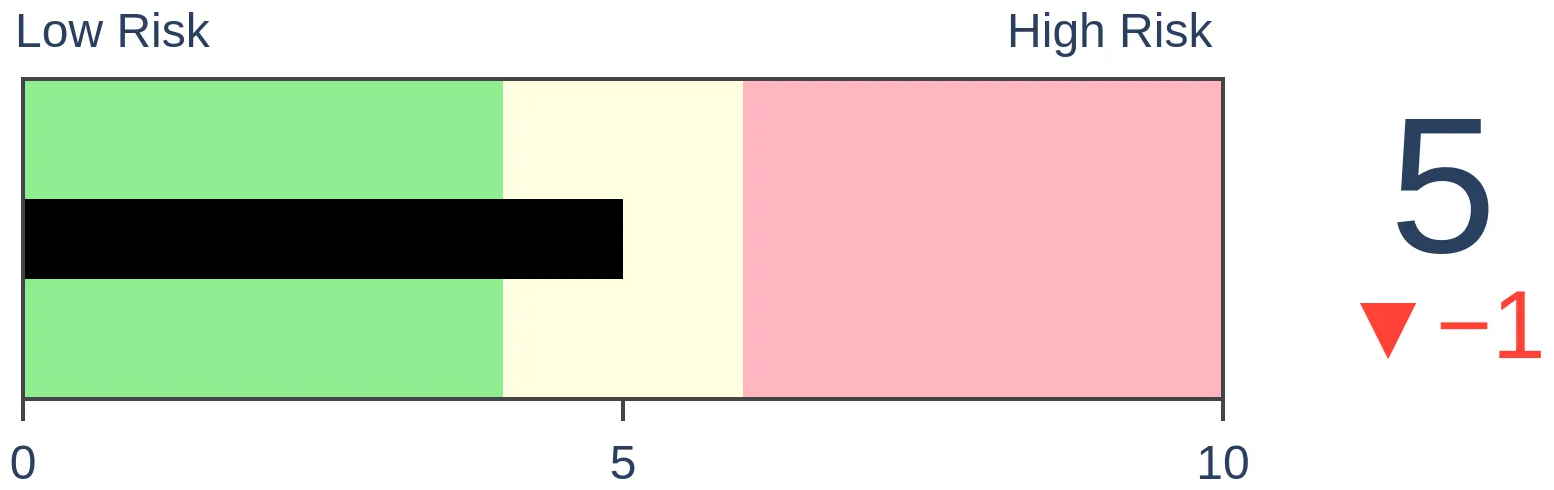
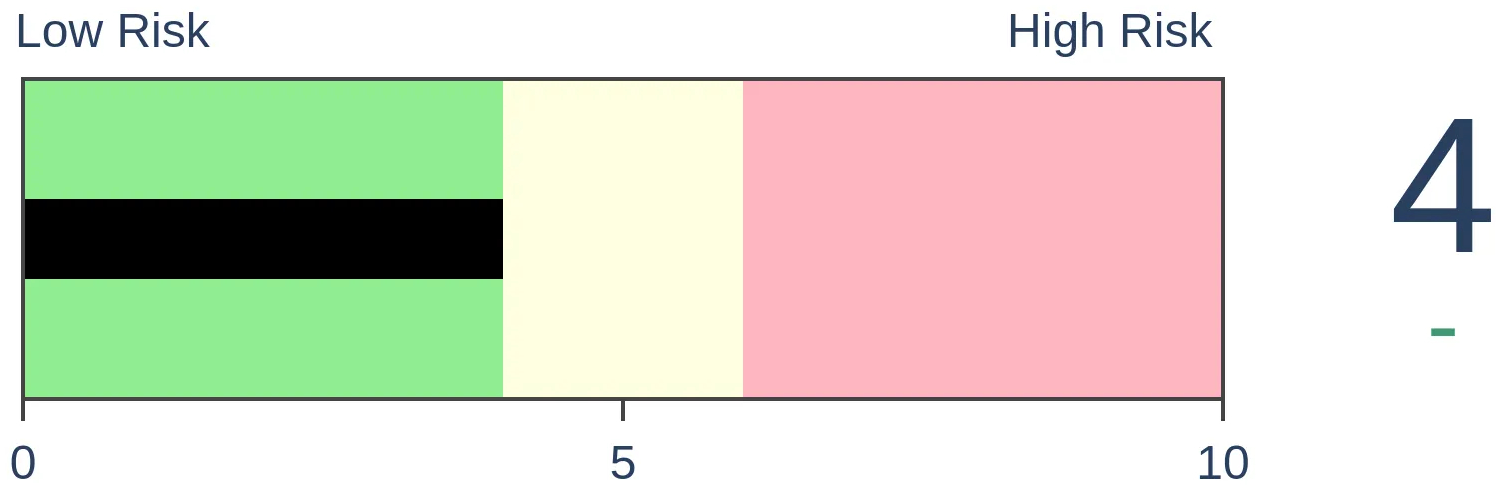
Stocks Medium-Term

|
|
Bonds
|
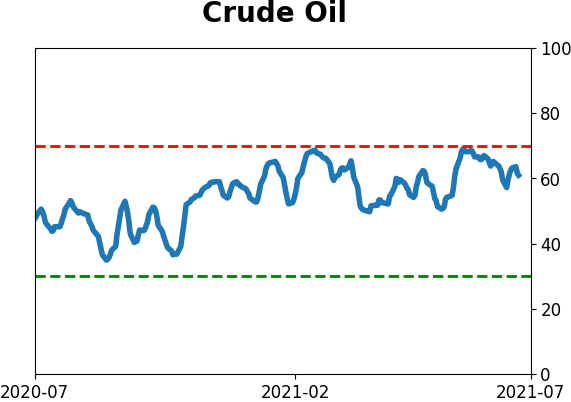
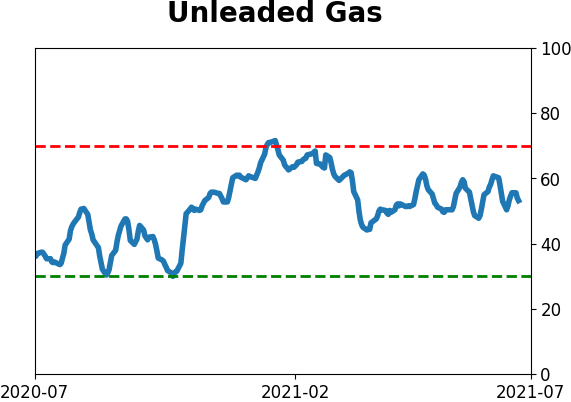
Crude Oil
|
|
Gold

|
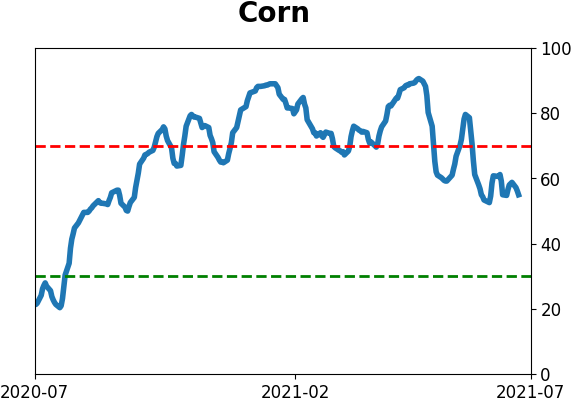
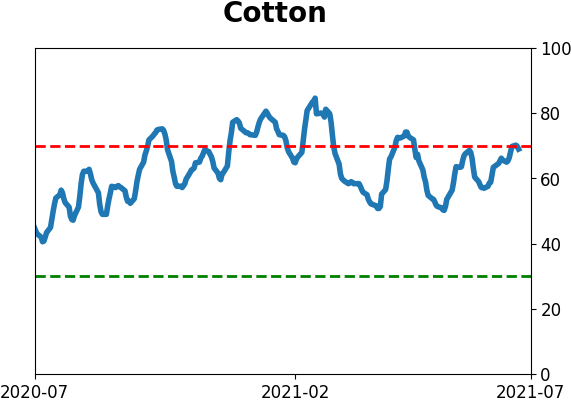
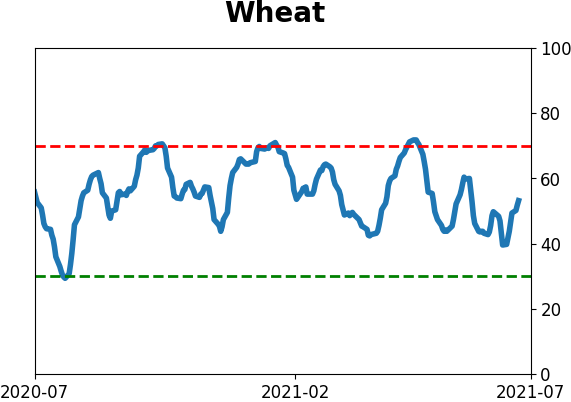
Agriculture
|
|
Research
By Jason Goepfert
BOTTOM LINE
After heavy selling on Monday, buyers more than made up for it with buying pressure on Tuesday. That triggered a back-to-back reversal in the Up Volume Ratio, which has been a very good sign for future returns.
FORECAST / TIMEFRAME
SPY -- Up, Medium-Term
|
Some selling pressure to start the week made sense. There were ample and increasing signs of deterioration under the surface of the indexes, and it finally caught up to them.
In yet another concerted effort to buy every dip, though, that weakness lasted all of about one day. The buying stampede on Tuesday was remarkable, and it more than reversed the selling pressure from the day before.
The Up Volume Ratio cycled from below 15% to above 85% in back-to-back sessions on the NYSE.
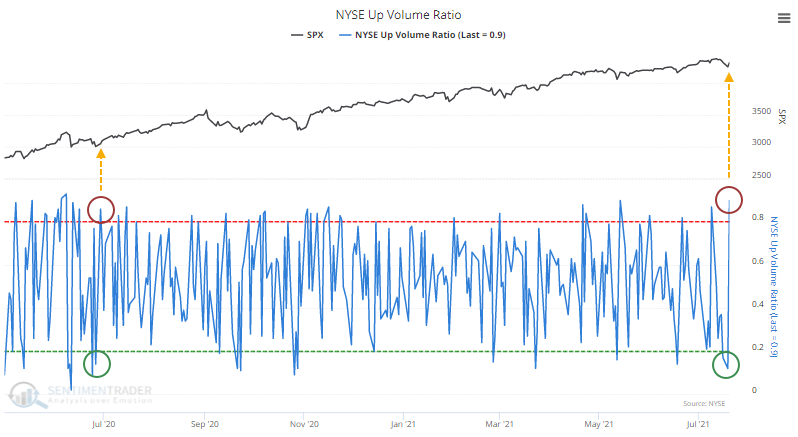
This triggered last June, and it marked the end of that little pullback, kicking off an impressive run over the next few months. That was much more the rule than the exception after a back-to-back reversal in Up Volume while the S&P 500 was within 10% of a 52-week high.
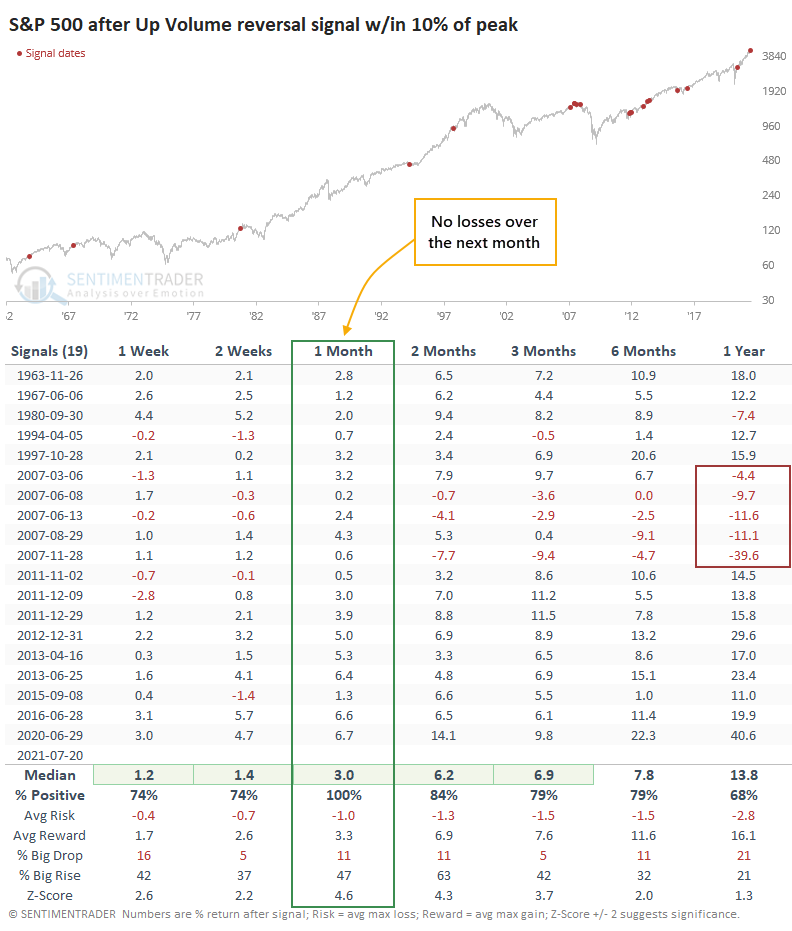
Since 1962, the S&P 500 never showed a loss in the month following similar signals. These mostly occurred during momentum markets, and buyers followed through to avoid missing out on the next bull run. A few of them did end up leading to blow-off peaks, but not until month(s) later.
This contrasts with signals triggered when the S&P was more than 10% below its high.
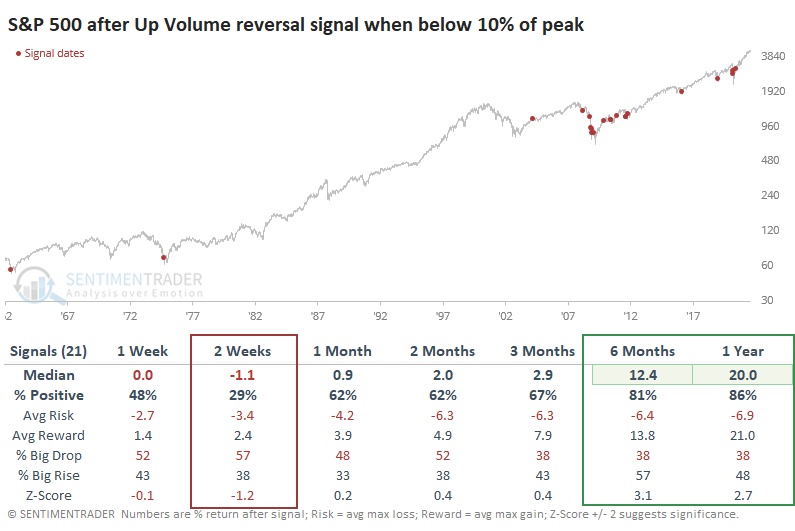
While most of these triggered in the aftermath of a severe decline, with impressive long-term returns, there was much more of a tendency to see stocks fall back in the next couple of weeks.
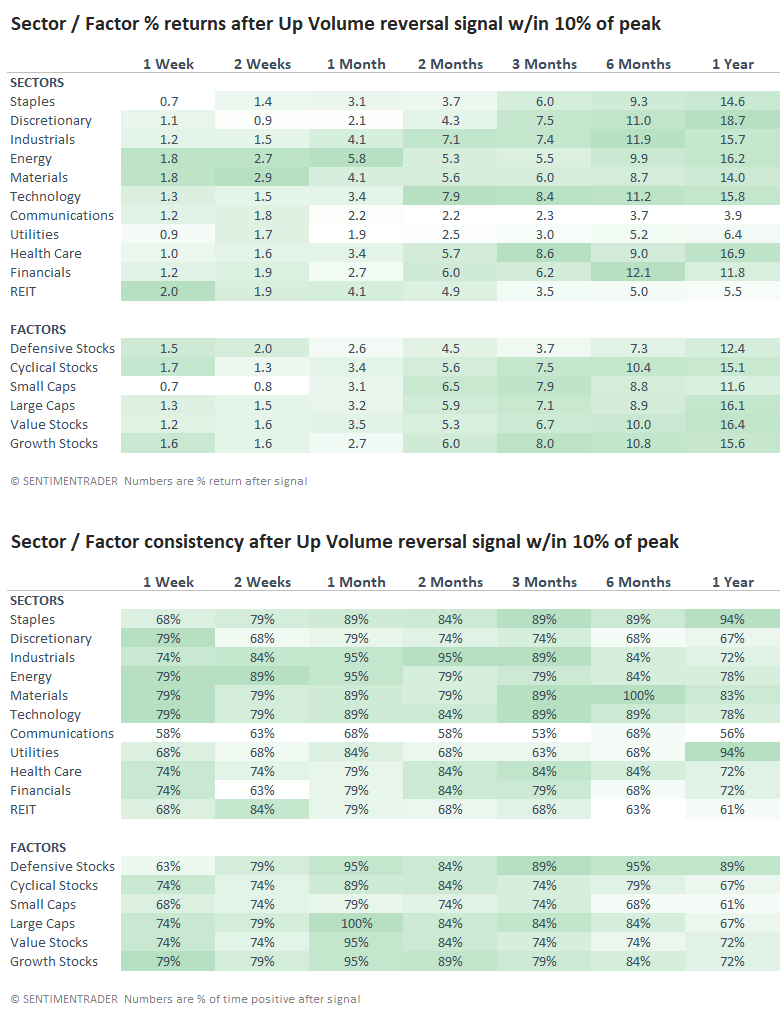
For sectors and factors, these volume reversals preceded a sea of green.
The selling on Monday was "comfortable" in that it made sense given the pressures that had been building under the surface. While some specific sectors showed some decent oversold signals, for the market as a whole, most of what we looked at suggested that it would be more likely to see further selling pressure in the weeks ahead. More and more risk-off signals were triggering, and those have a good history of preceding weak markets.
It's iffy to put a ton of weight on a single session, and Tuesday didn't make up for all the worries that have been building. At the same time, it's tough to ignore the implications of similar back-to-back volume reversals. It seemed like things were finally starting to move in bears' favor, but after Tuesday, it's hard to have much faith in that, either.
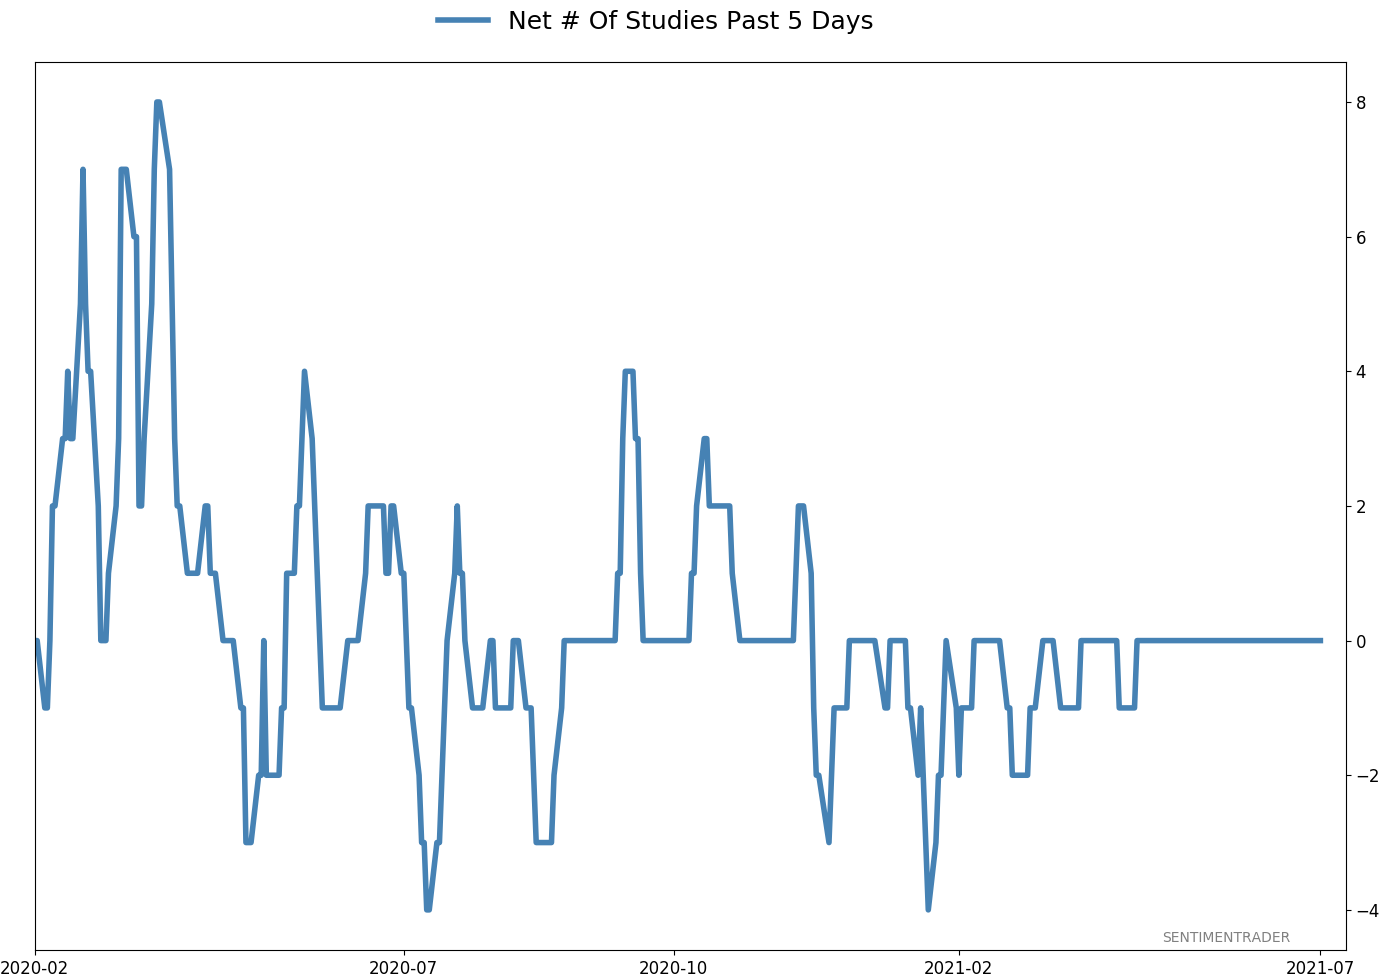
Active Studies
| Time Frame | Bullish | Bearish | | Short-Term | 0 | 4 | | Medium-Term | 3 | 3 | | Long-Term | 10 | 5 |
|
Indicators at Extremes
Portfolio
| Position | Description | Weight % | Added / Reduced | Date | | Stocks | RSP | 4.1 | Added 4.1% | 2021-05-19 | | Bonds | 23.9% BND, 6.9% SCHP | 30.7 | Reduced 7.1% | 2021-05-19 | | Commodities | GCC | 2.6 | Reduced 2.1%
| 2020-09-04 | | Precious Metals | GDX | 5.6 | Reduced 4.2% | 2021-05-19 | | Special Situations | 4.3% XLE, 2.2% PSCE | 7.6 | Reduced 5.6% | 2021-04-22 | | Cash | | 49.4 | | |
|
Updates (Changes made today are underlined)
Much of our momentum and trend work has remained positive for several months, with some scattered exceptions. Almost all sentiment-related work has shown a poor risk/reward ratio for stocks, especially as speculation drove to record highs in exuberance in February. Much of that has worn off, and most of our models are back toward neutral levels. There isn't much to be excited about here. The same goes for bonds and even gold. Gold has been performing well lately and is back above long-term trend lines. The issue is that it has a poor record of holding onto gains when attempting a long-term trend change like this, so we'll take a wait-and-see approach. RETURN YTD: 9.1% 2020: 8.1%, 2019: 12.6%, 2018: 0.6%, 2017: 3.8%, 2016: 17.1%, 2015: 9.2%, 2014: 14.5%, 2013: 2.2%, 2012: 10.8%, 2011: 16.5%, 2010: 15.3%, 2009: 23.9%, 2008: 16.2%, 2007: 7.8%
|
|
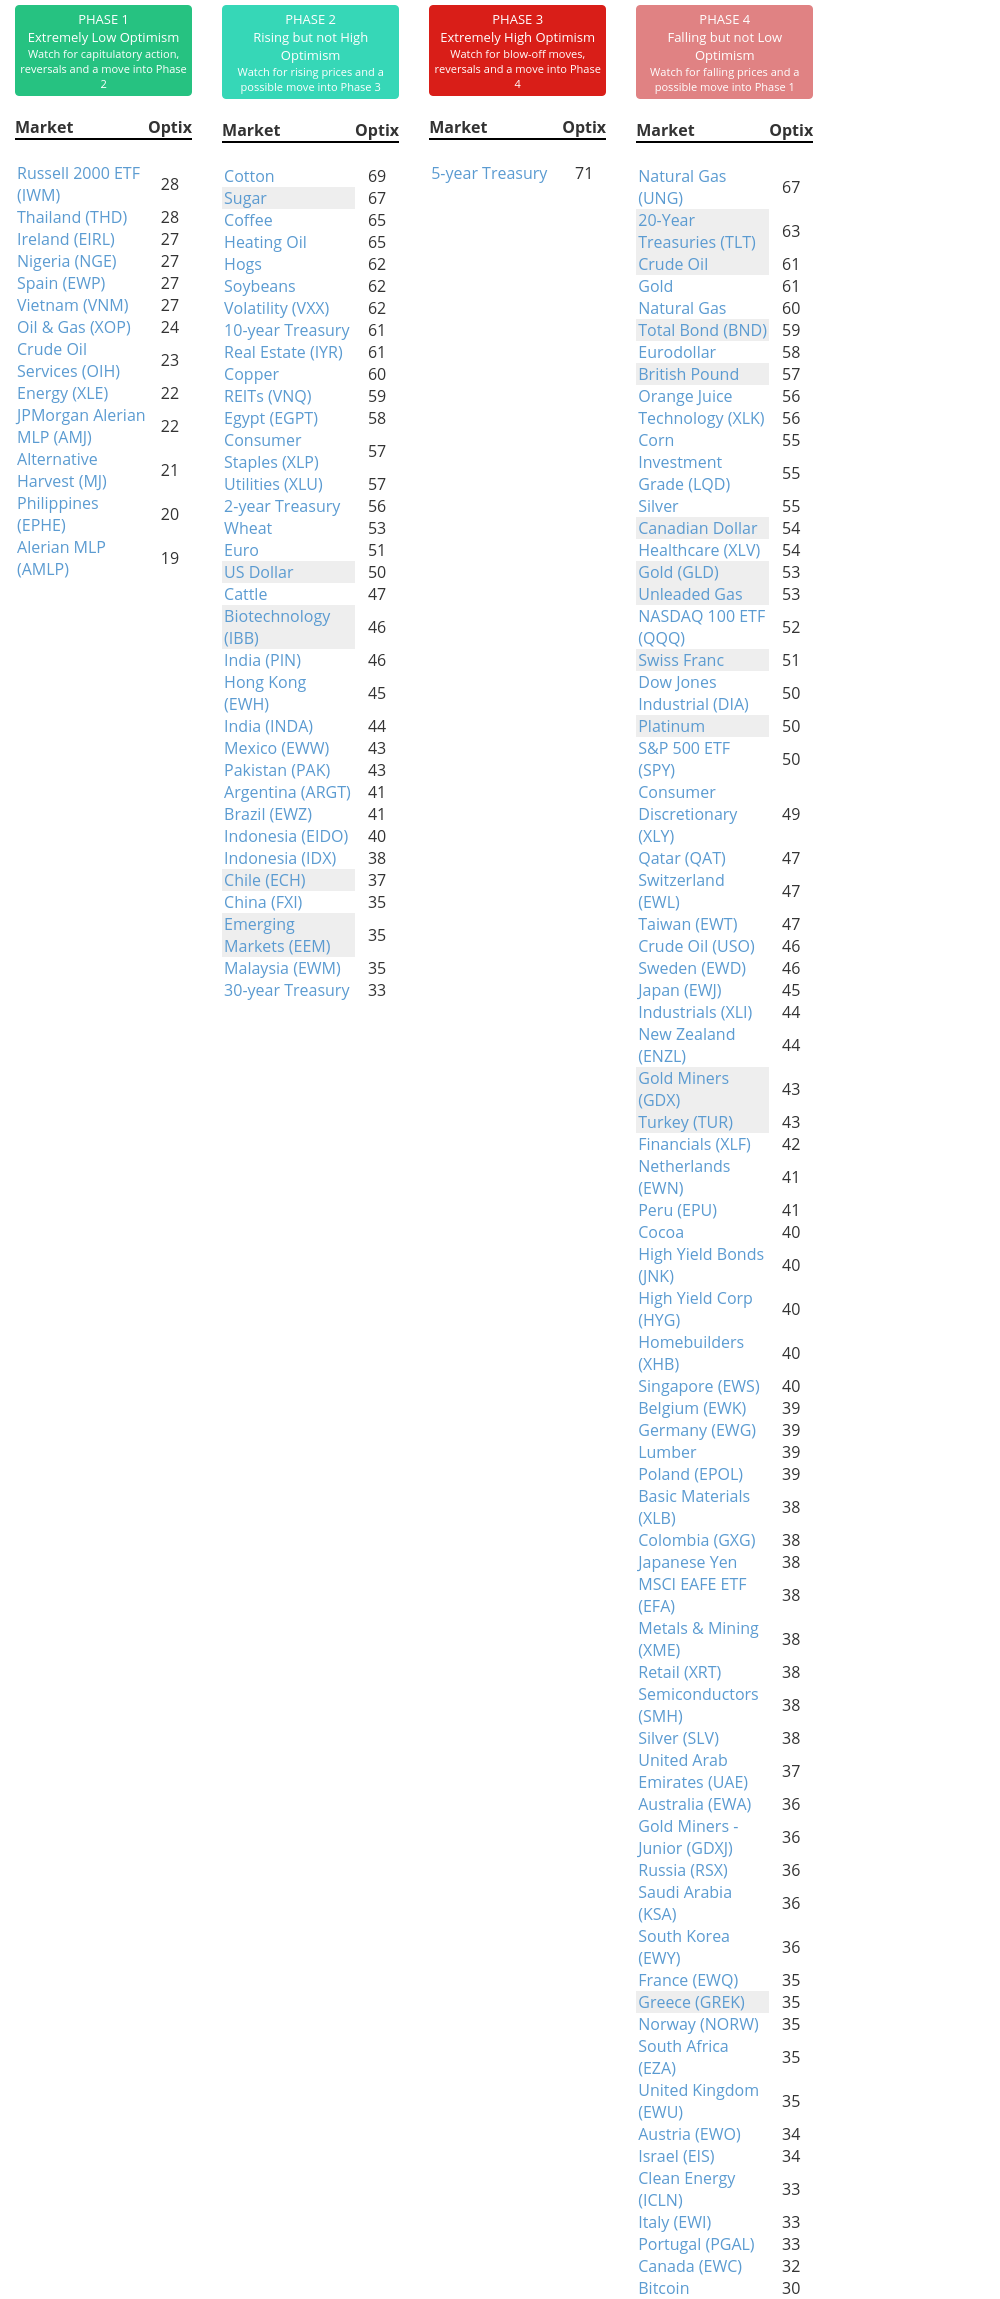
Phase Table
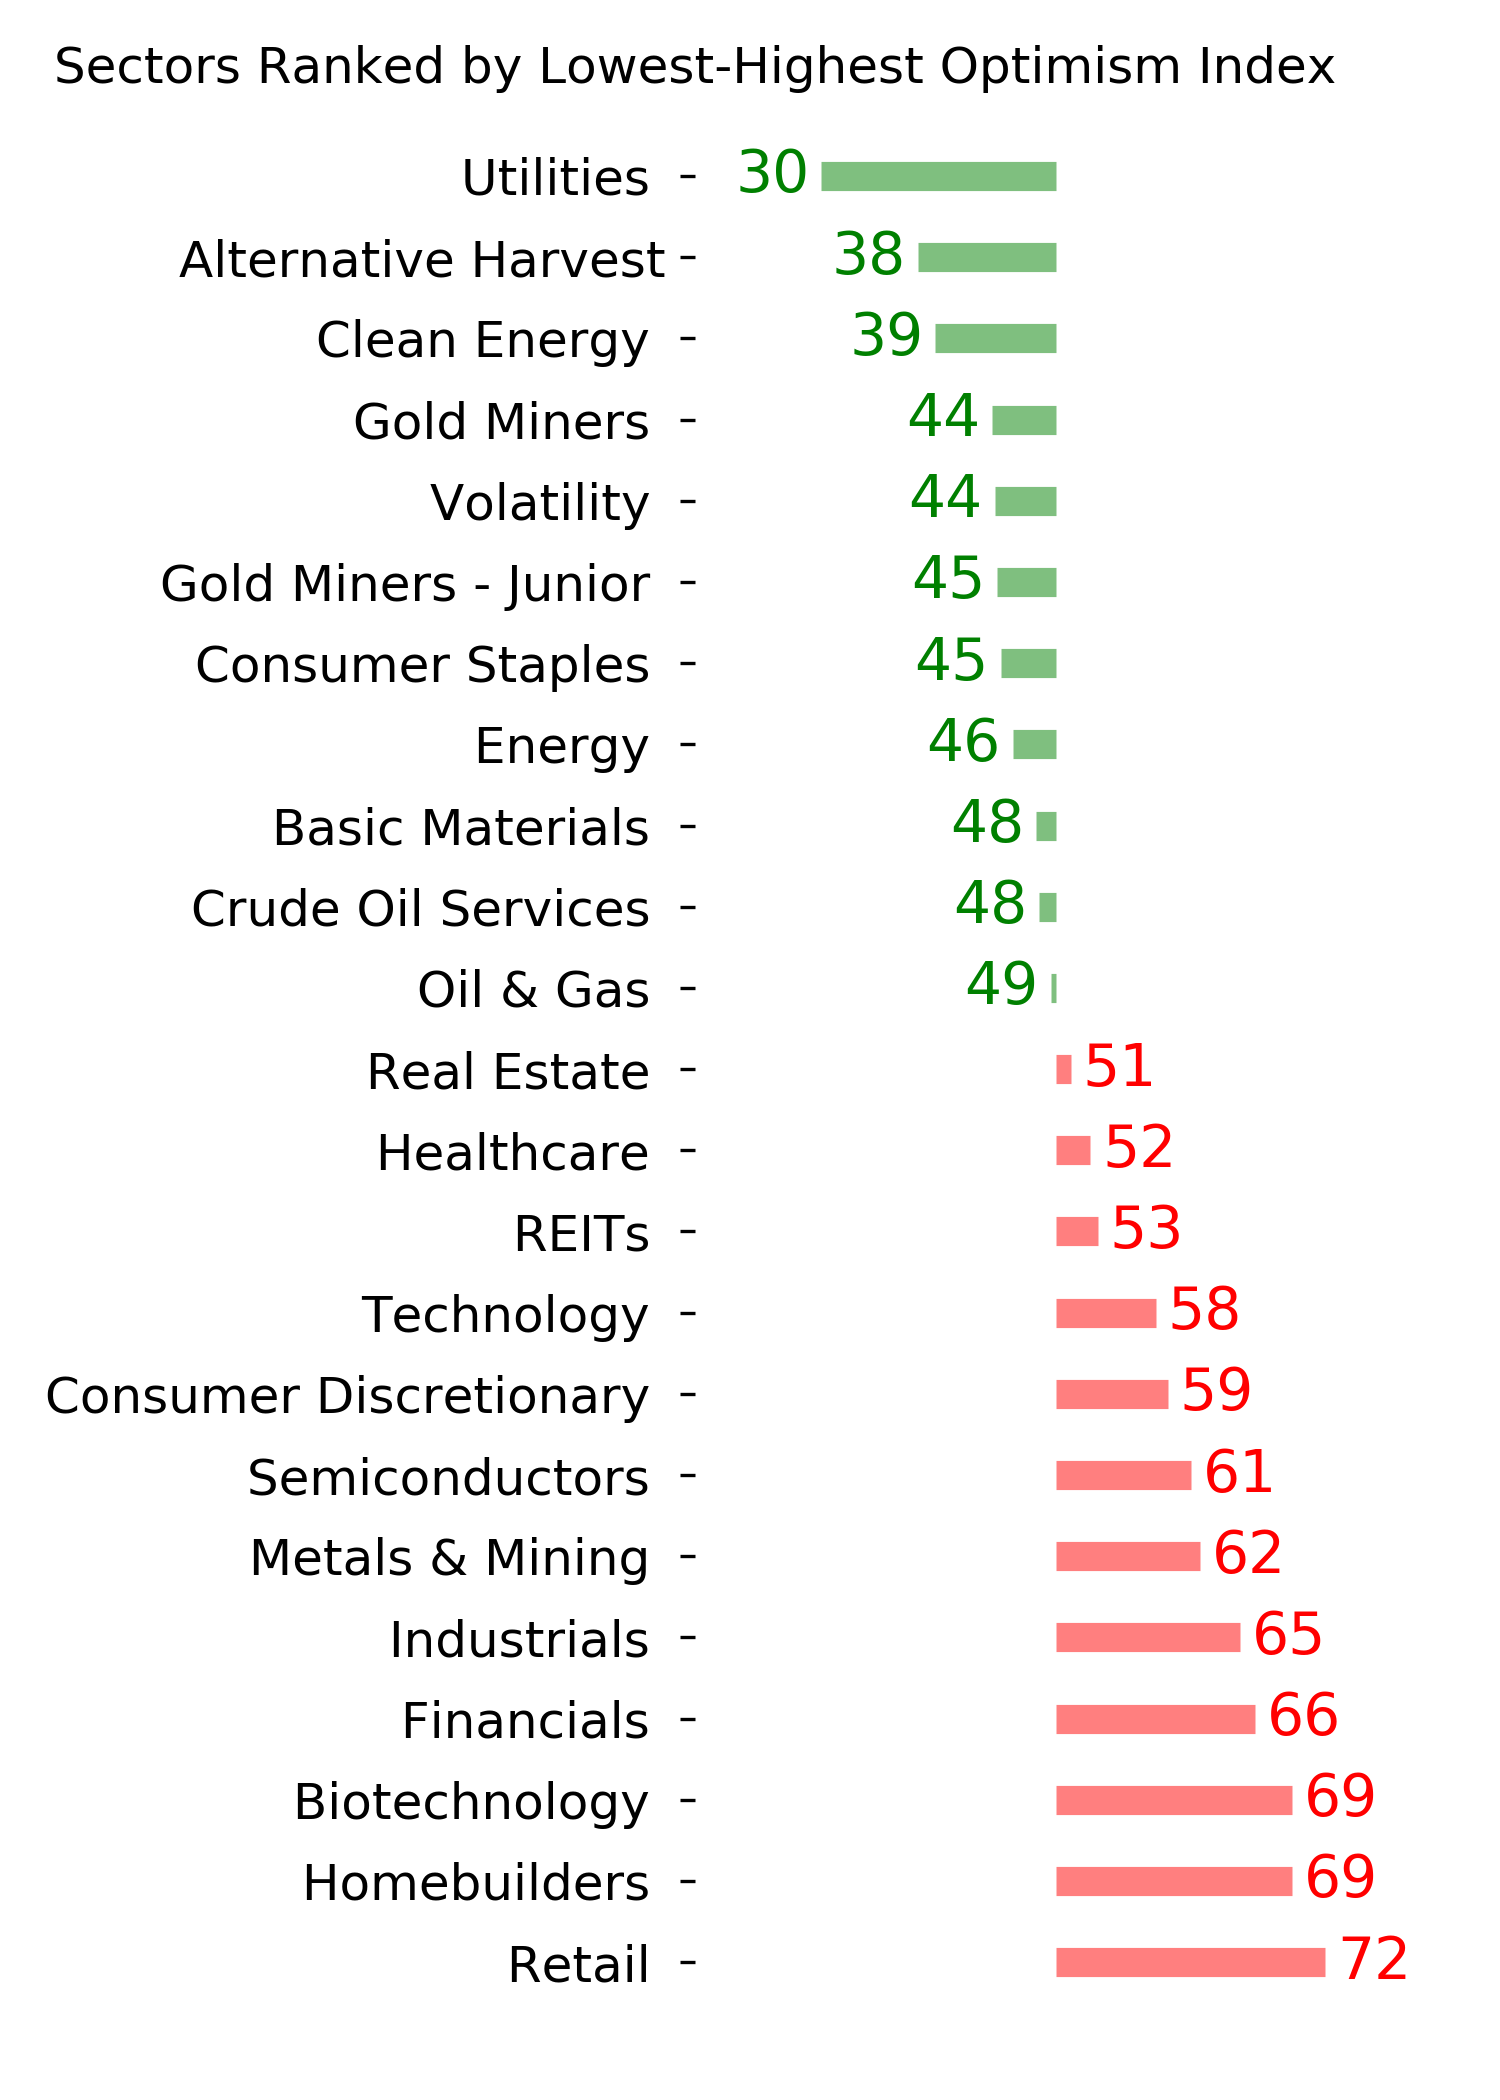
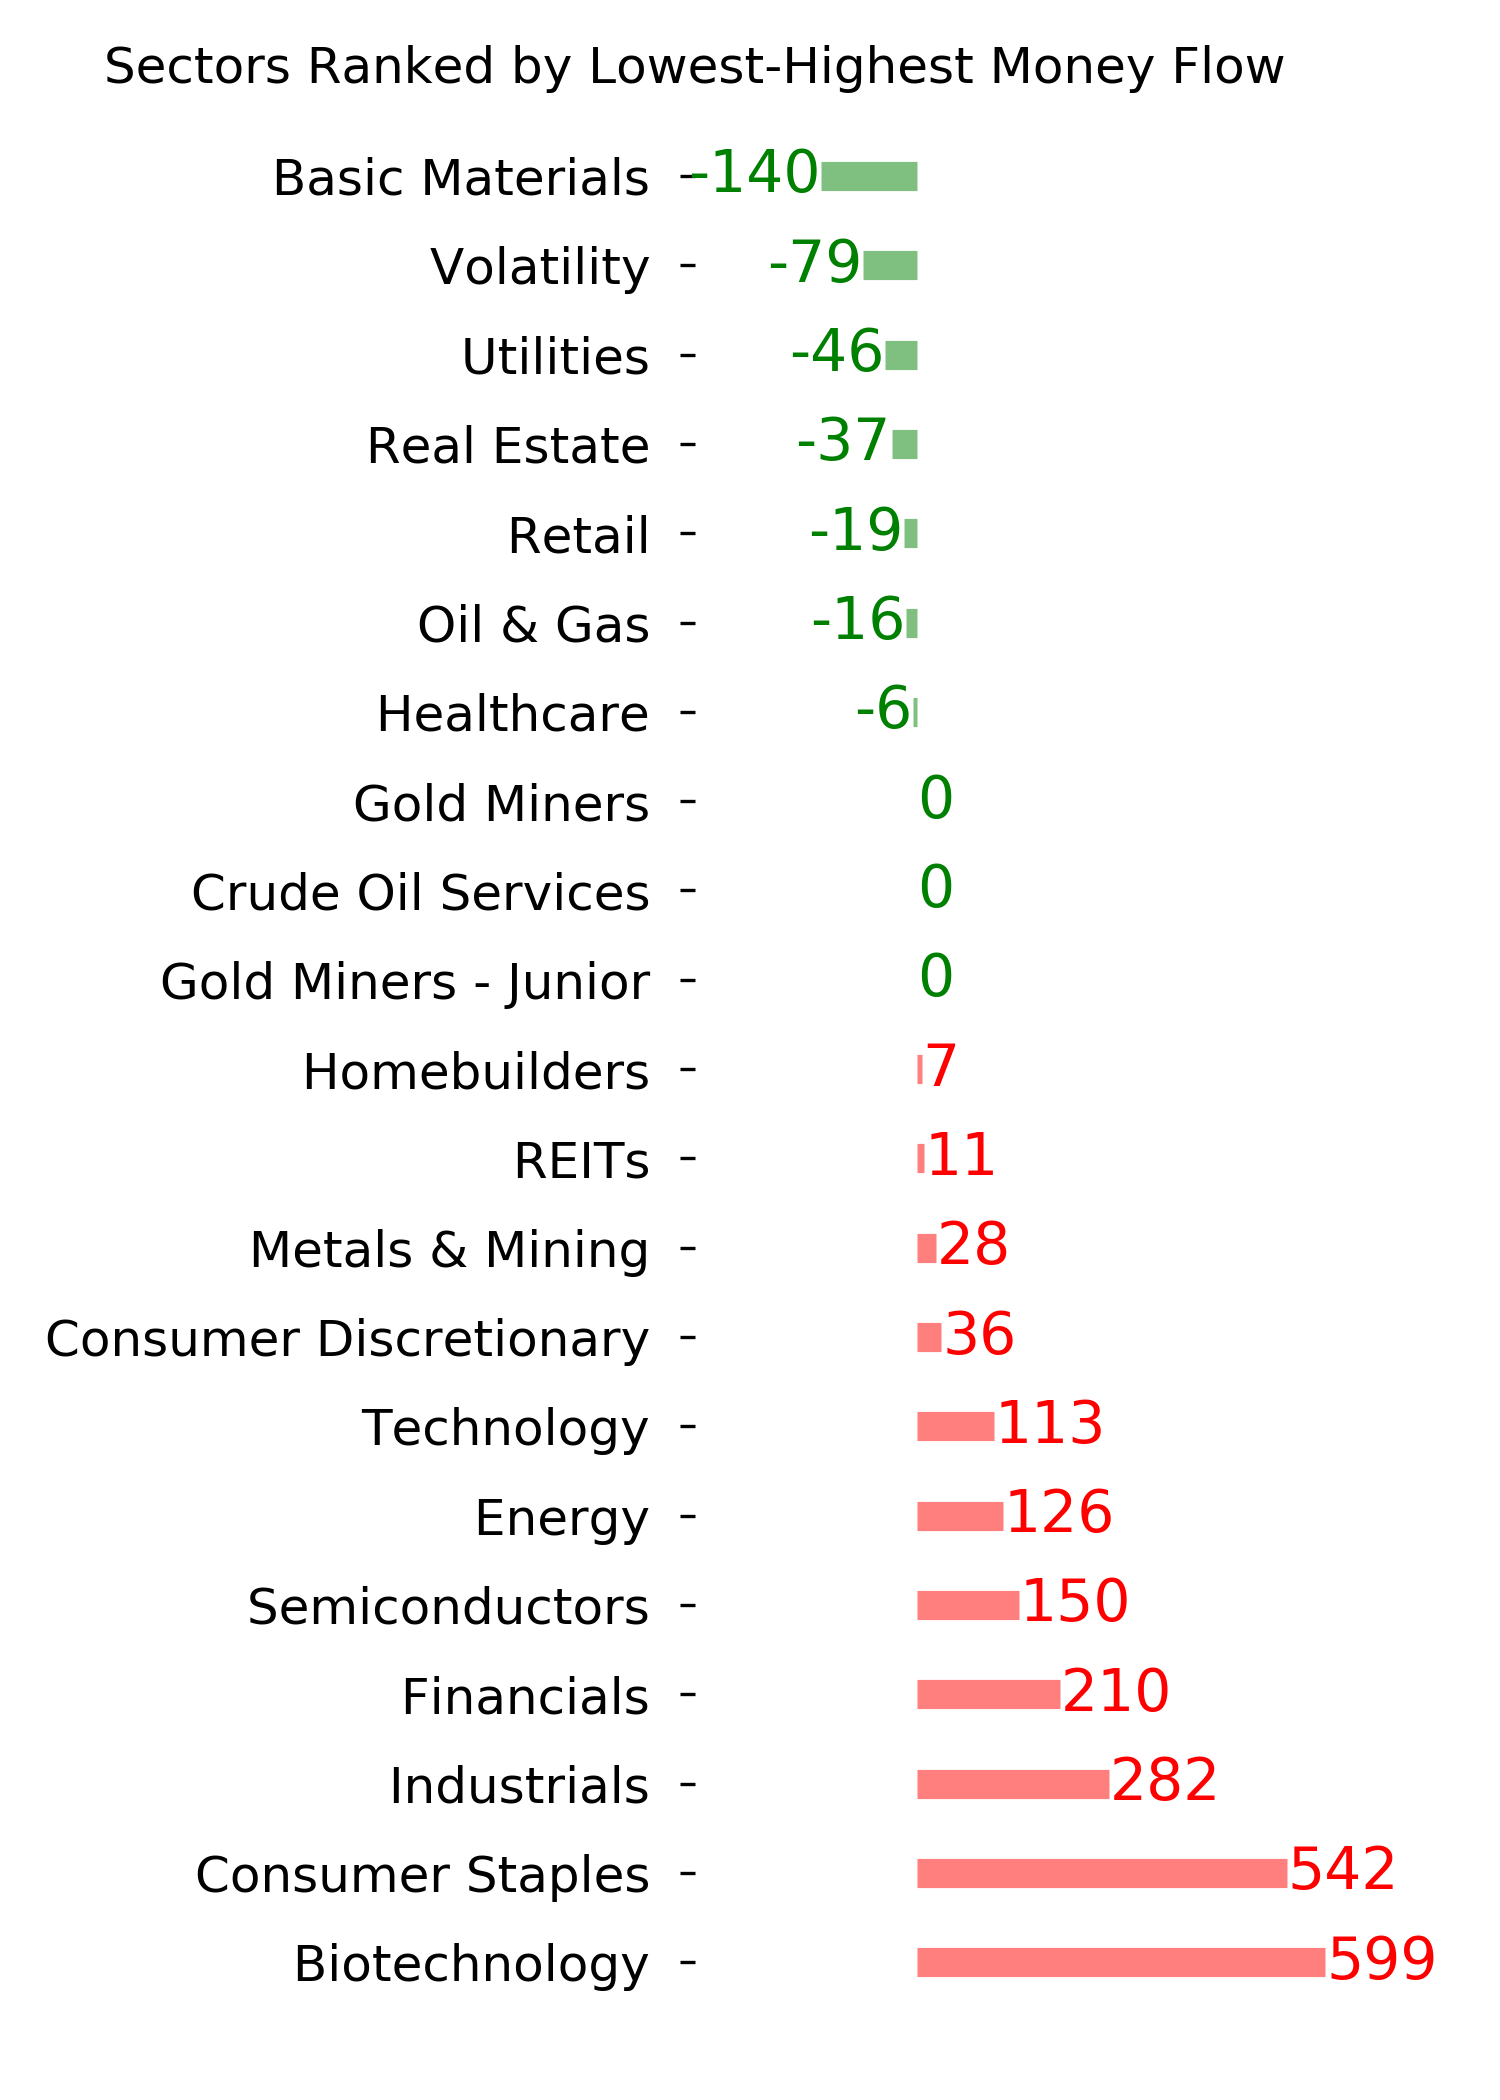
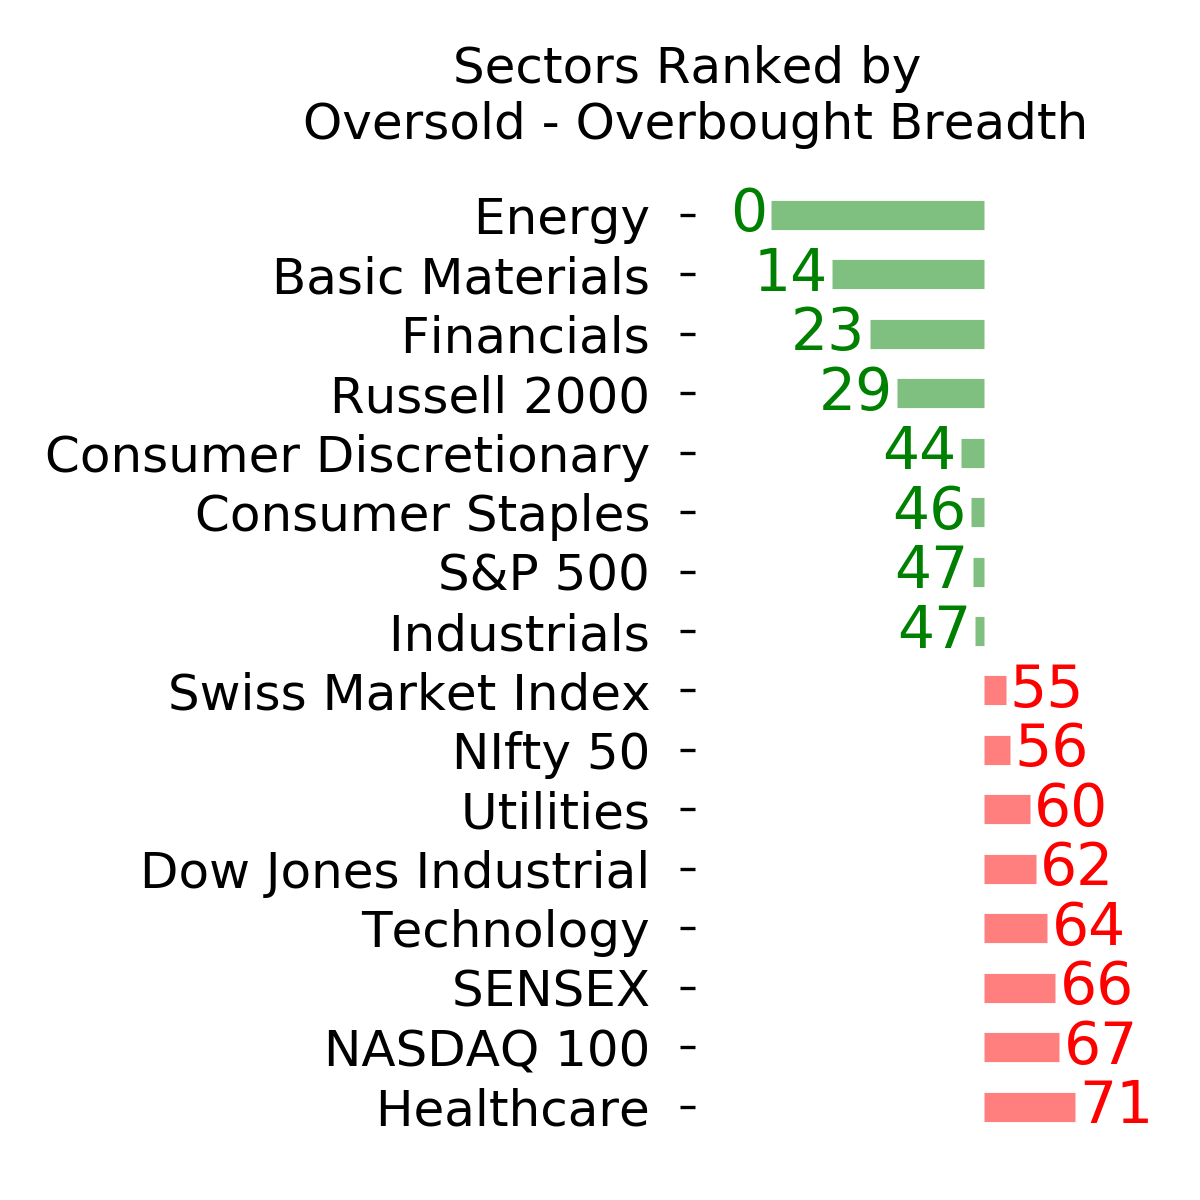
Ranks
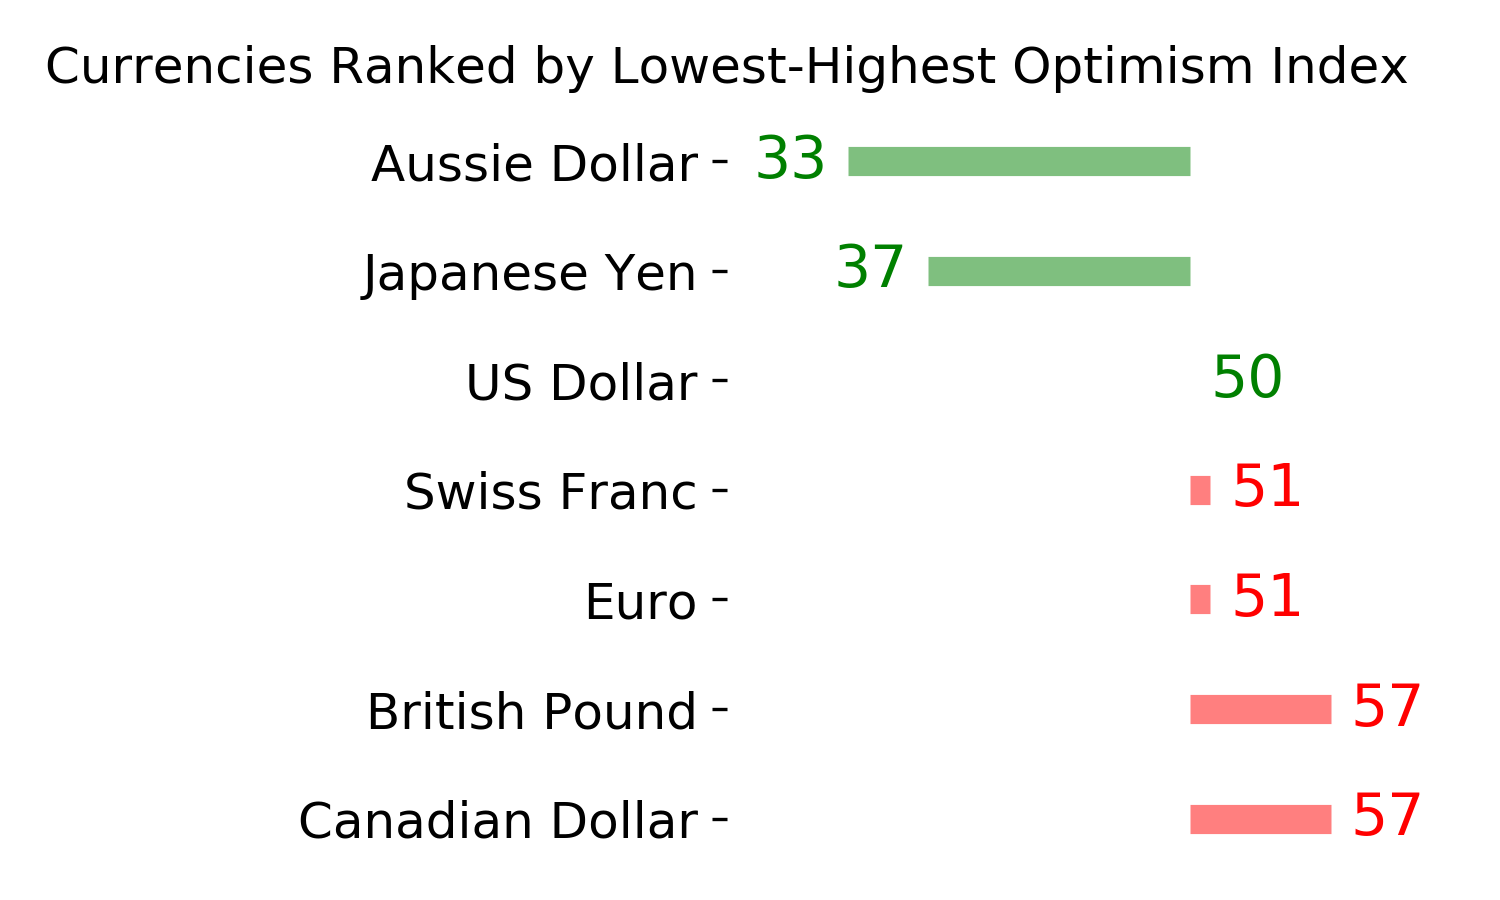
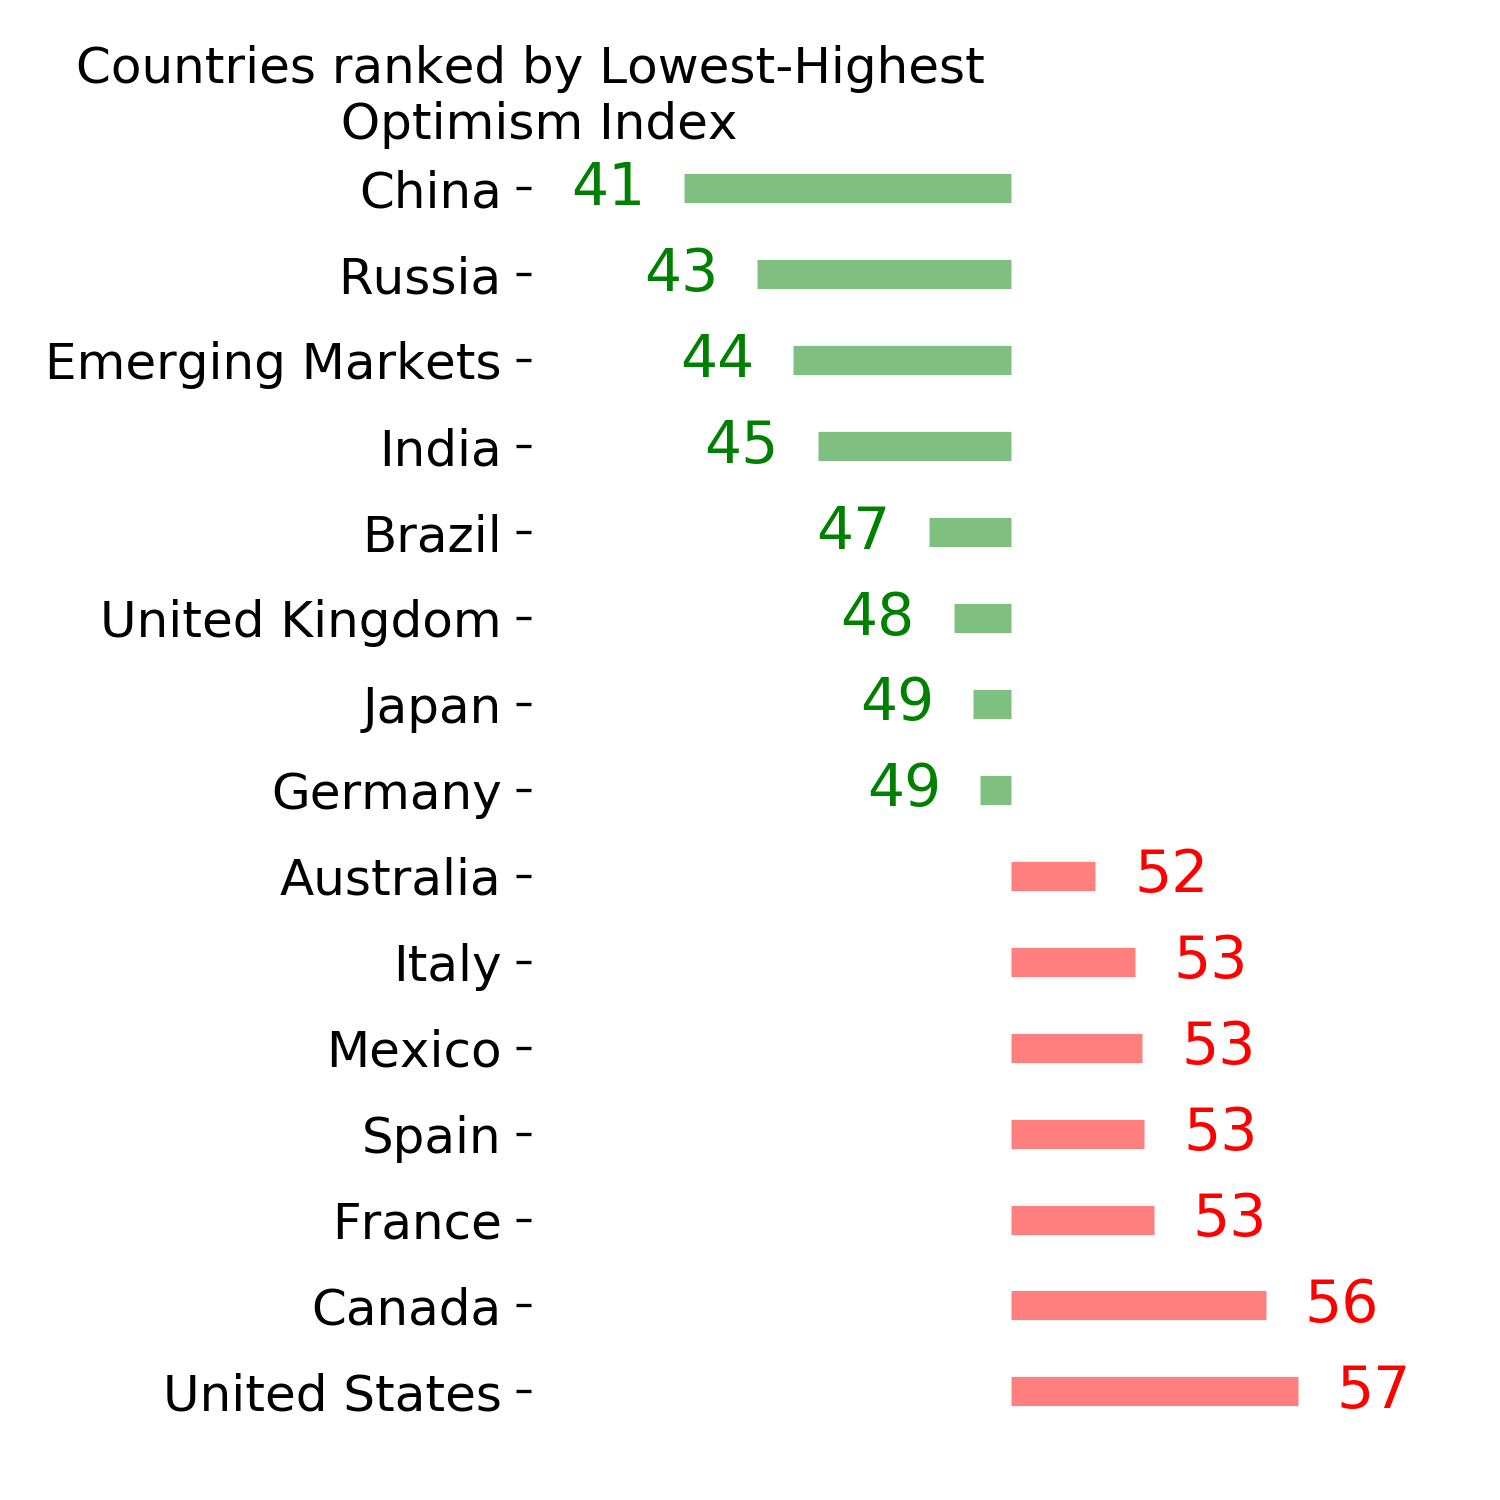
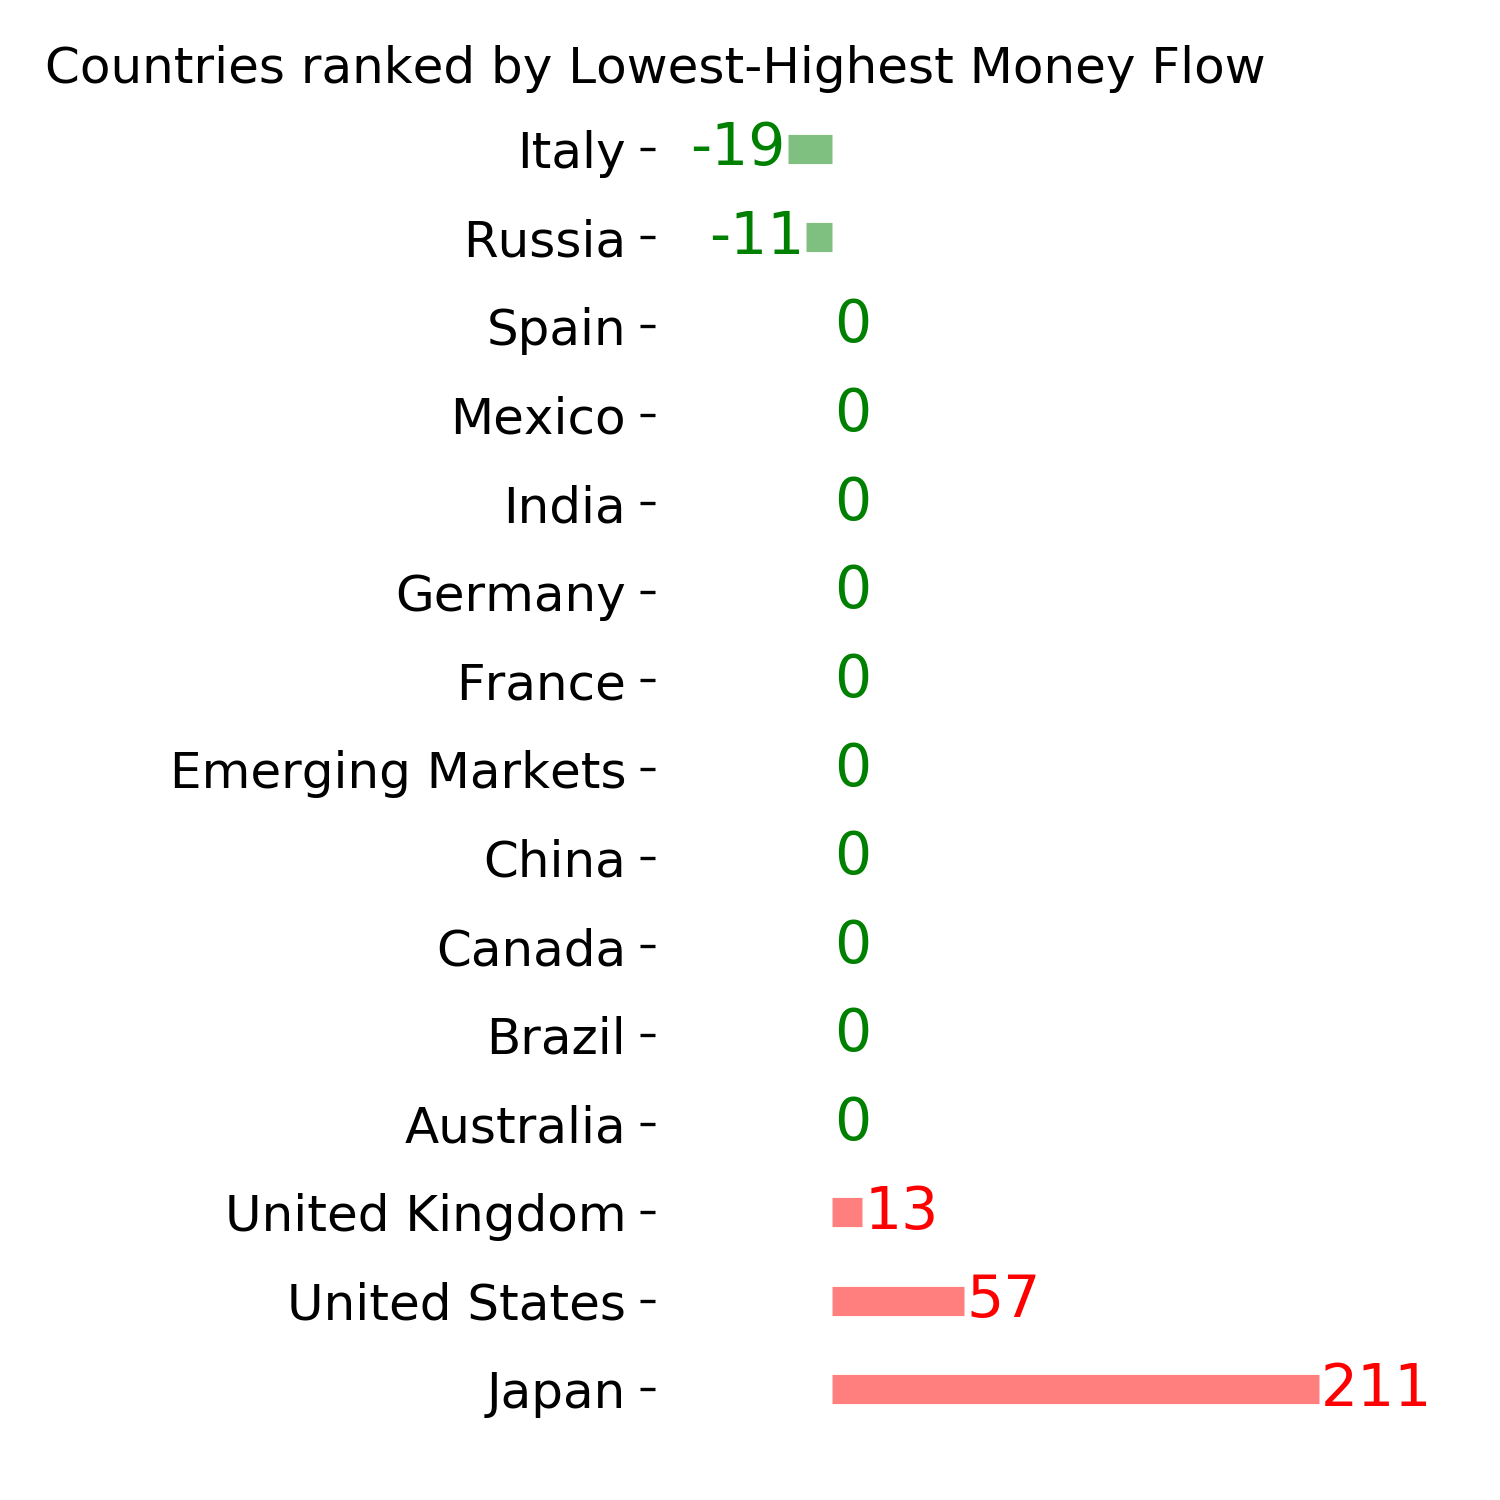
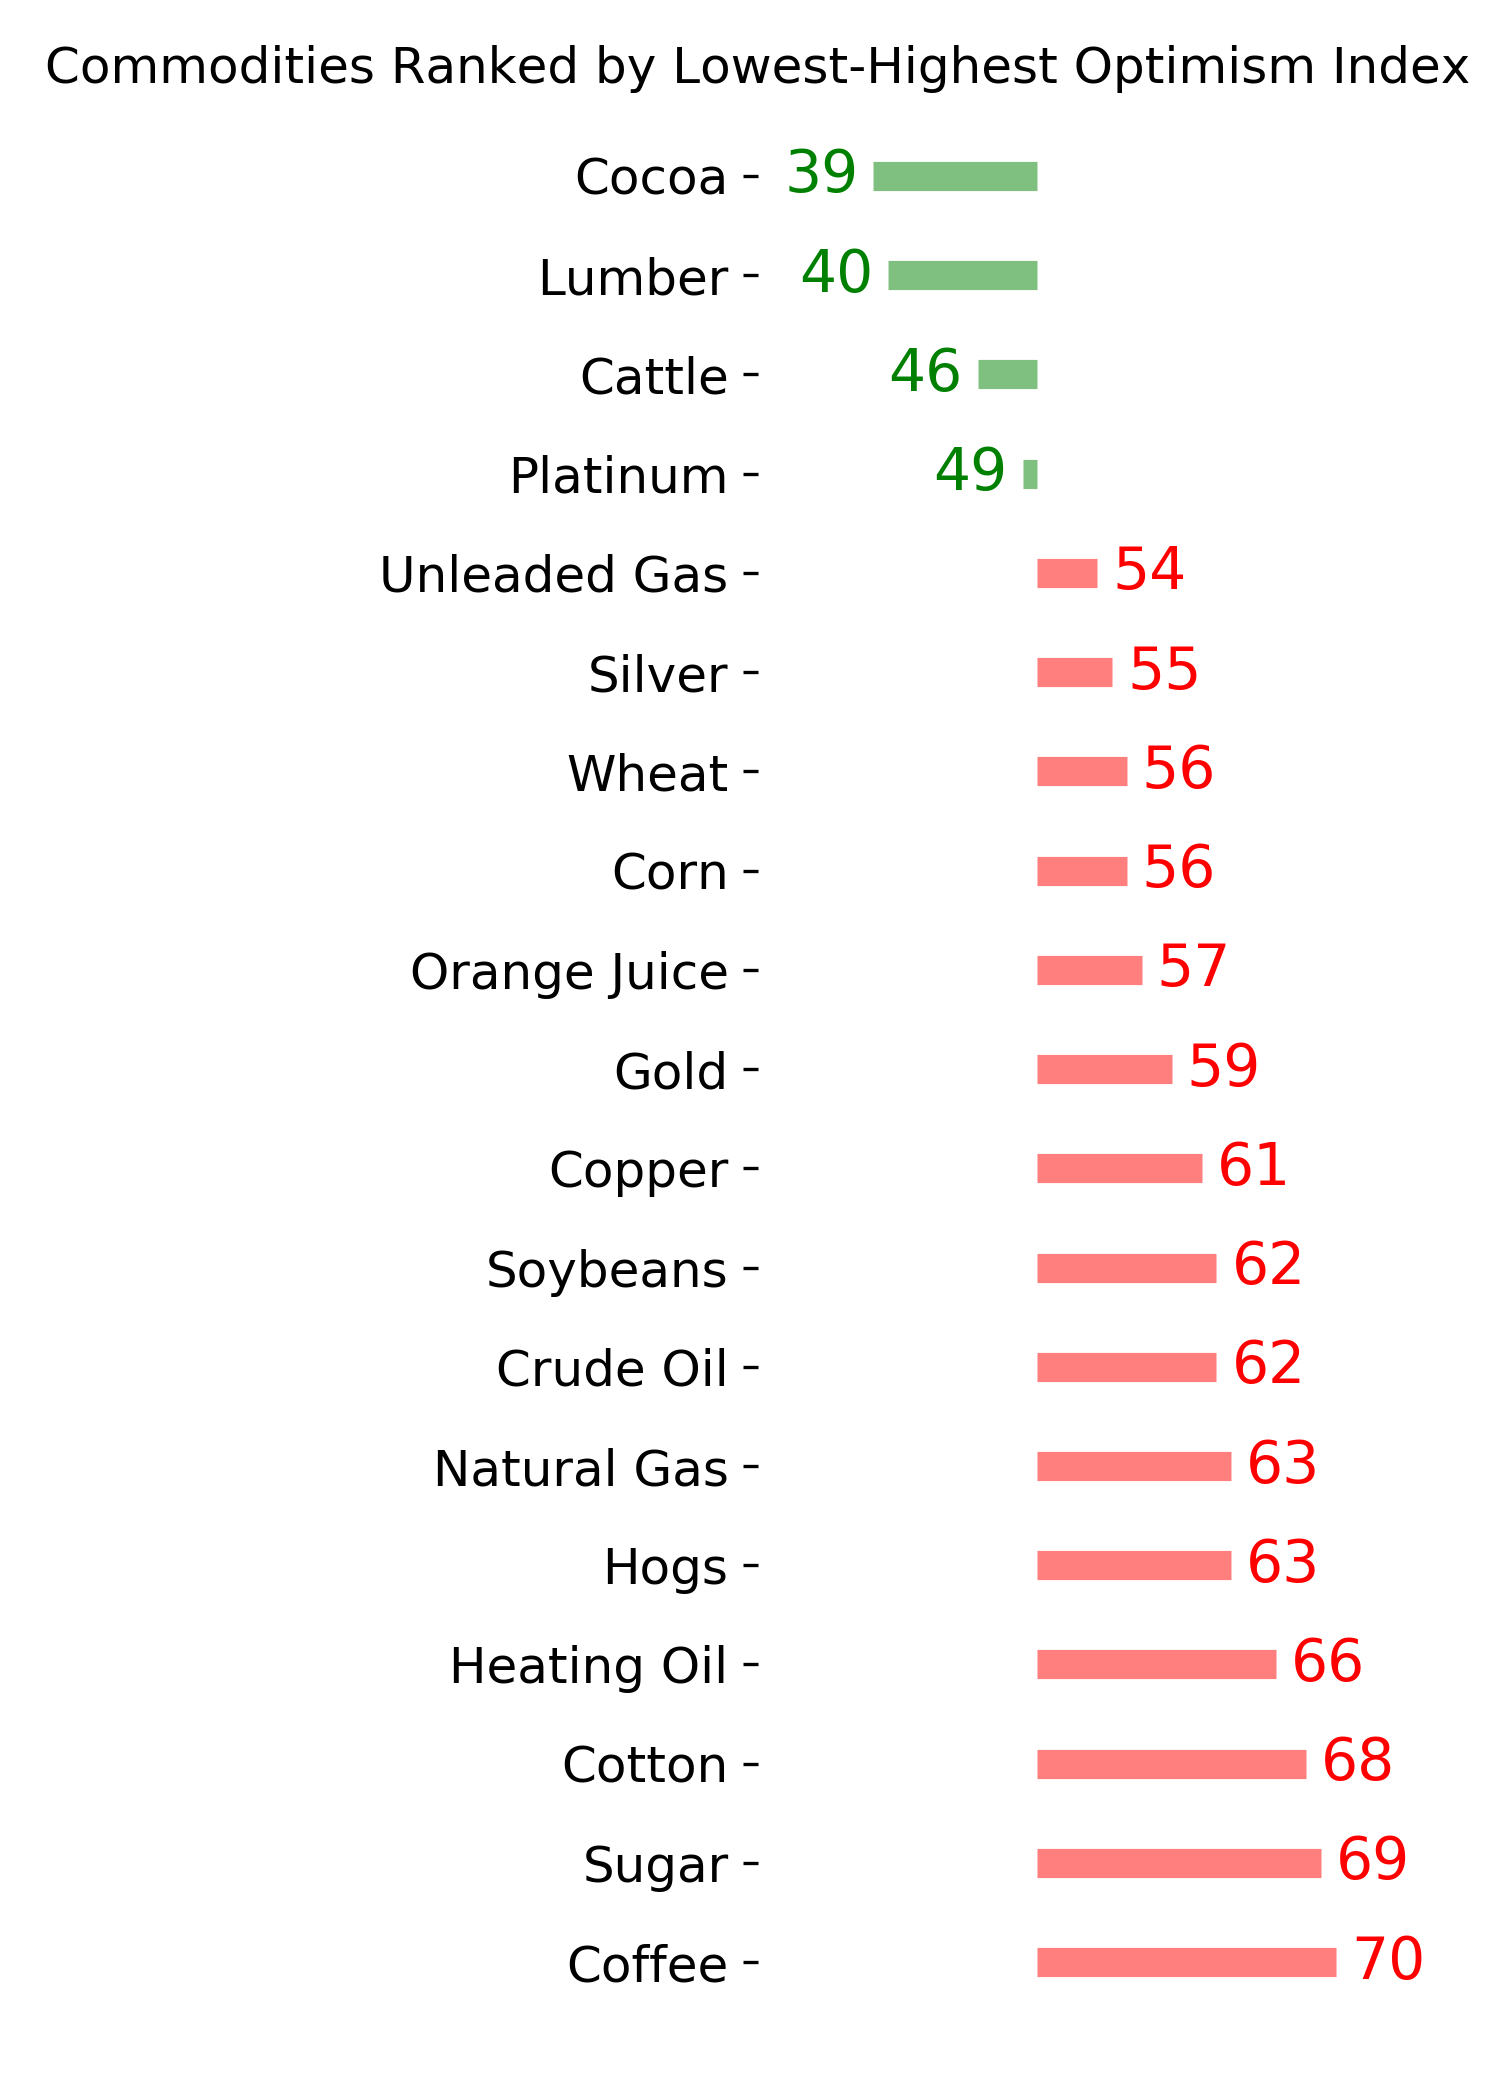
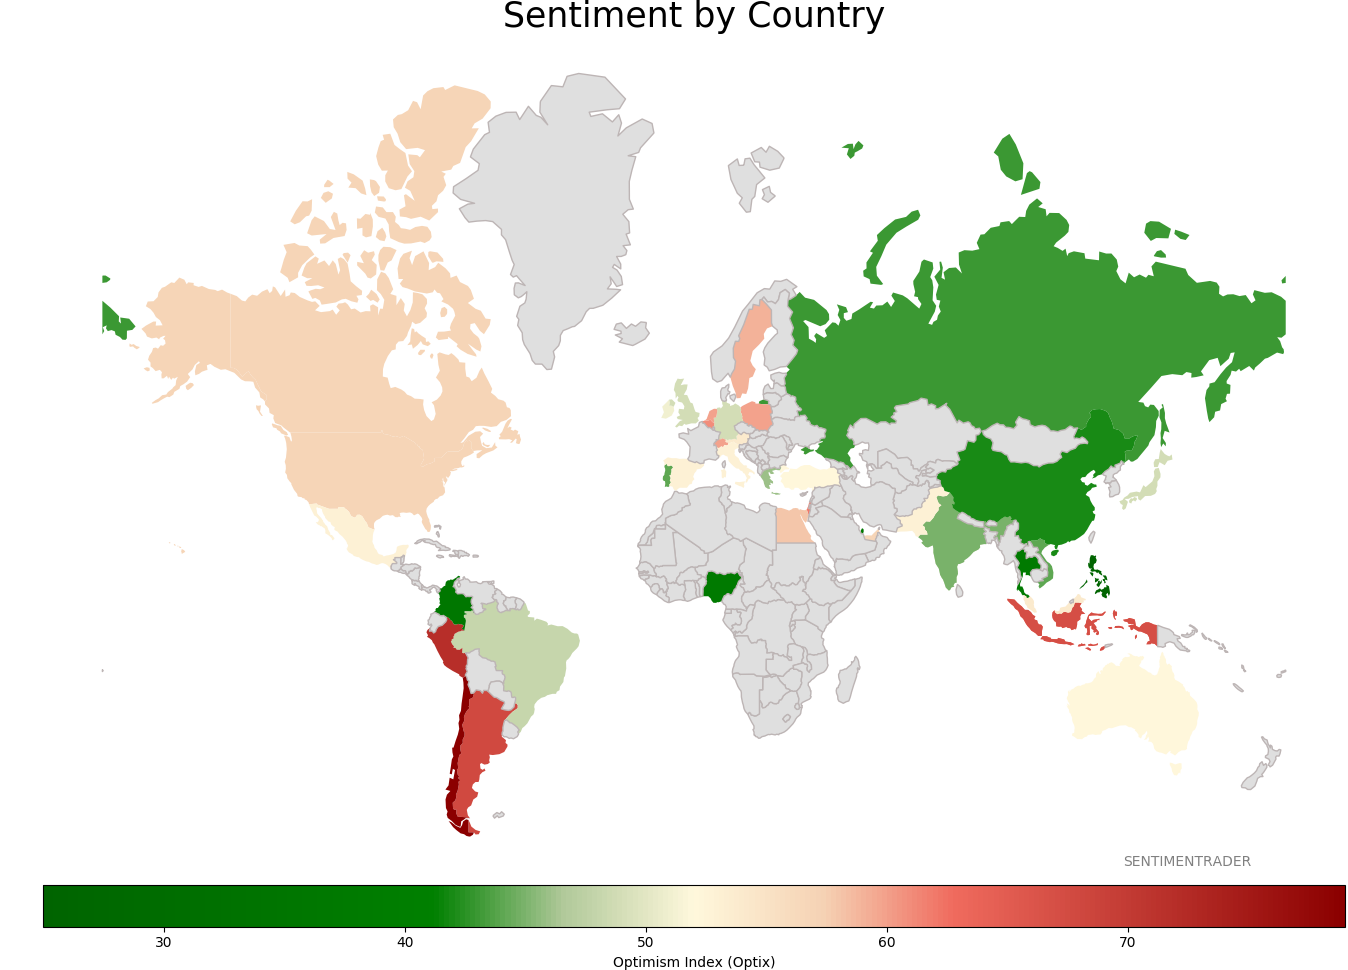
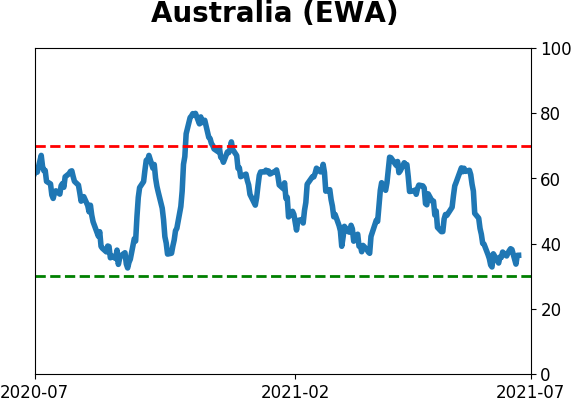
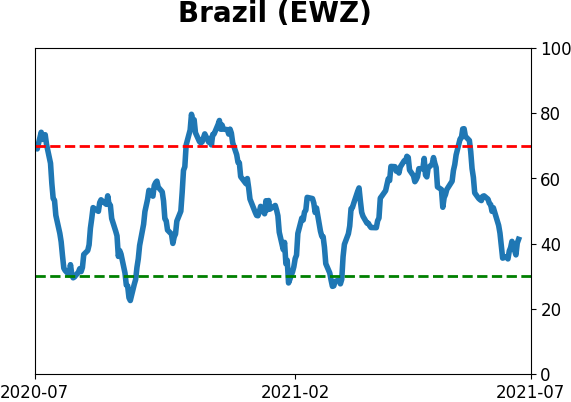
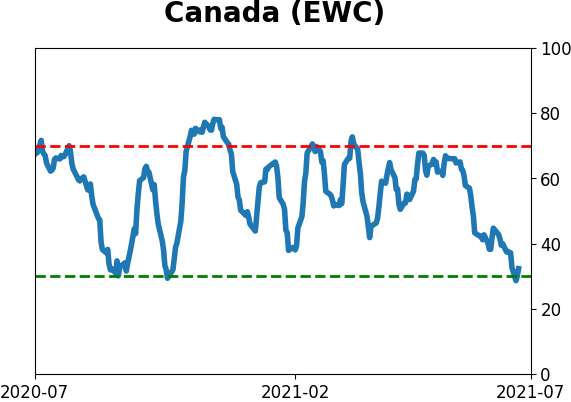
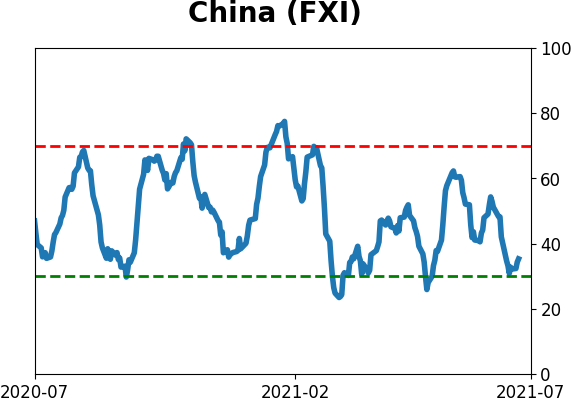
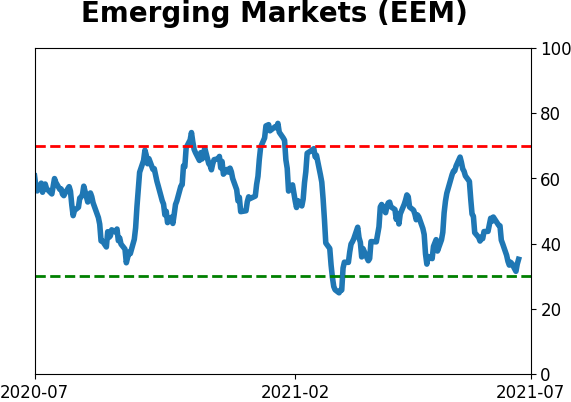
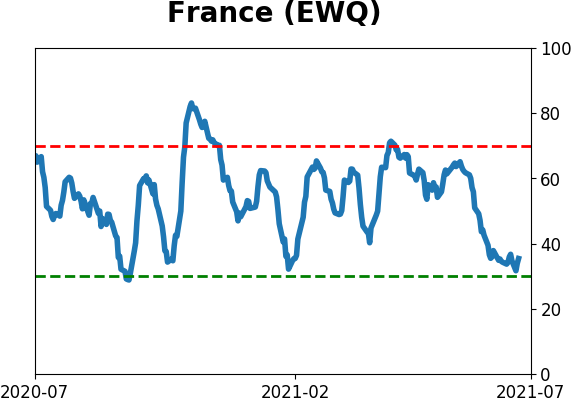
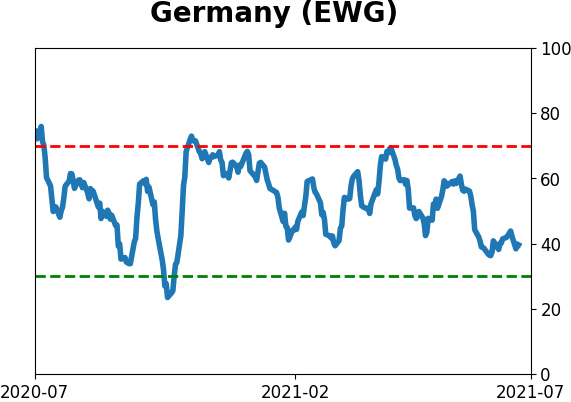
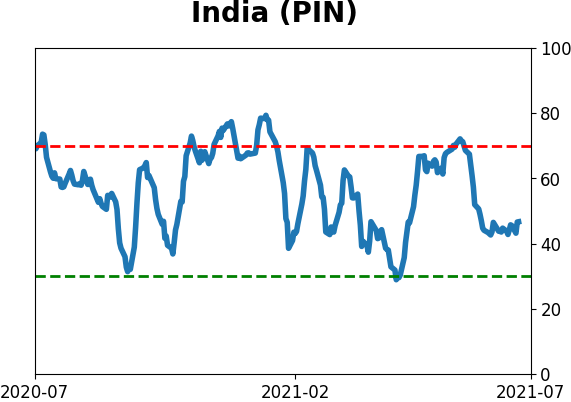
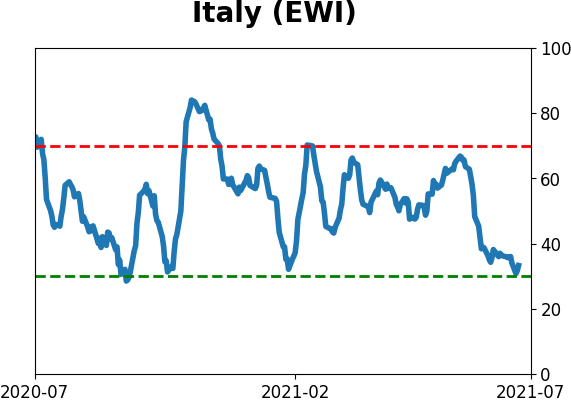
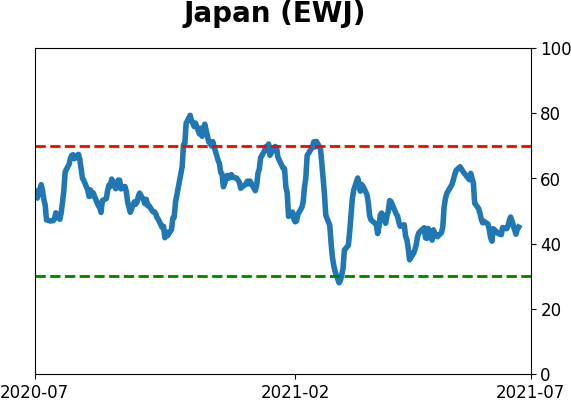
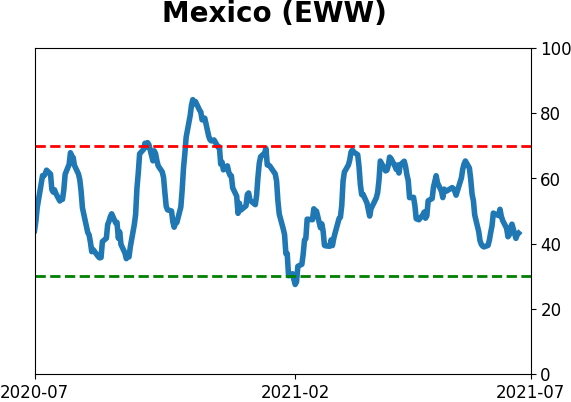
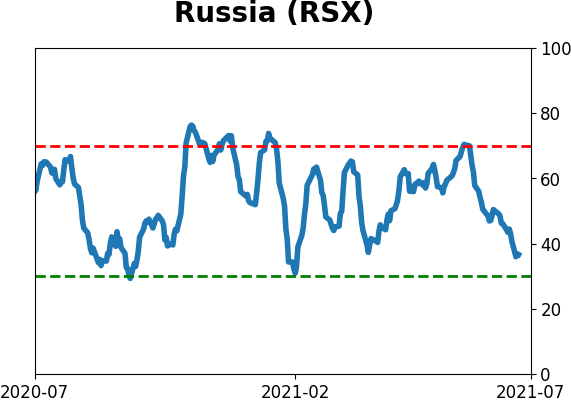
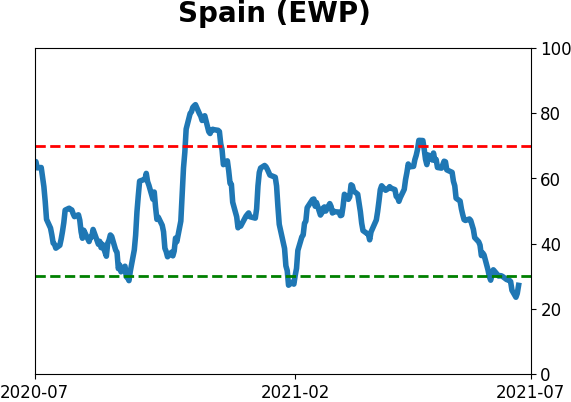
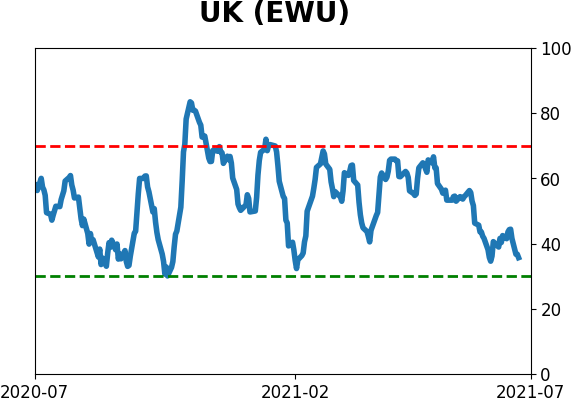
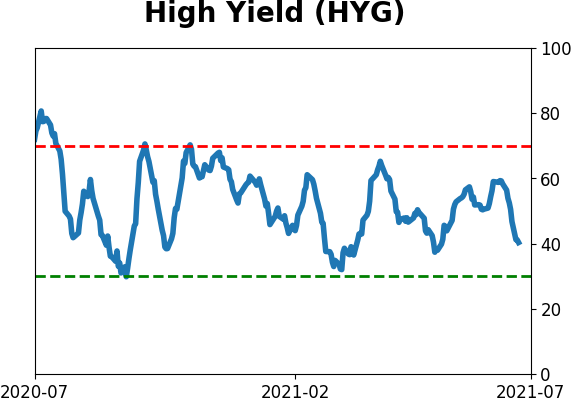
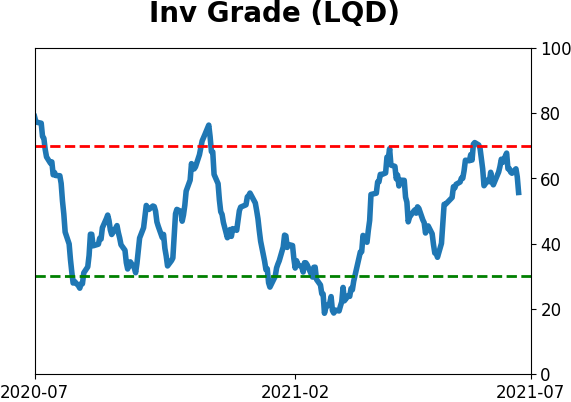
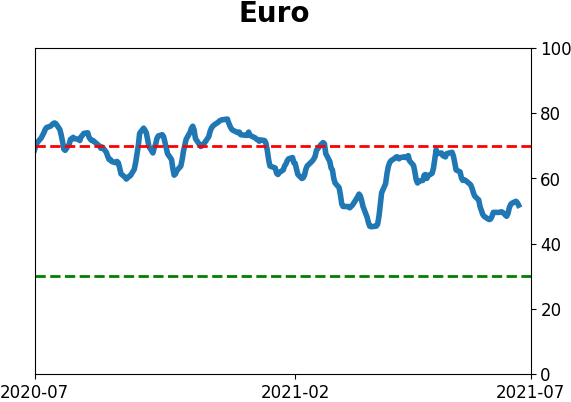
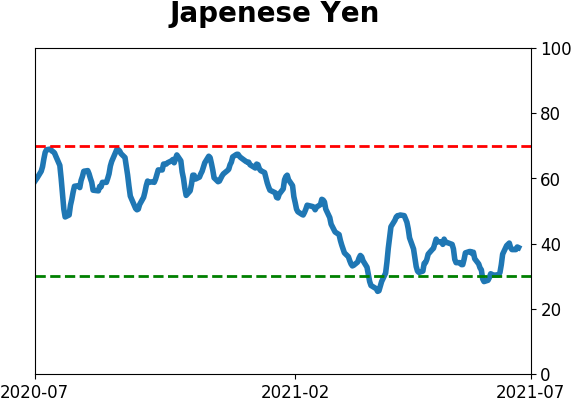
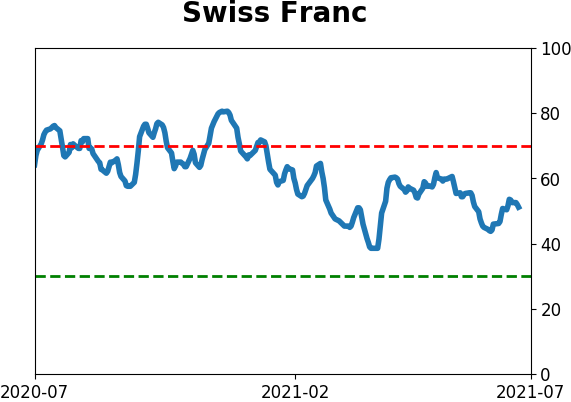
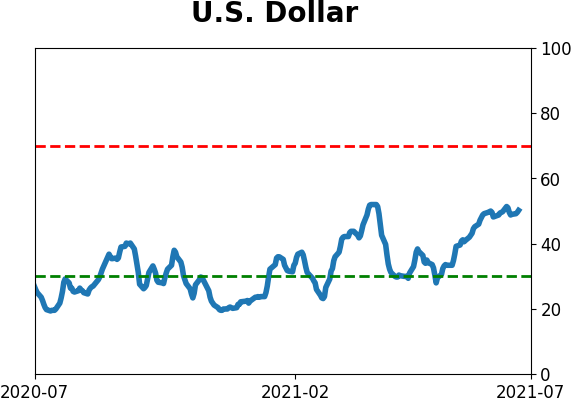
Sentiment Around The World
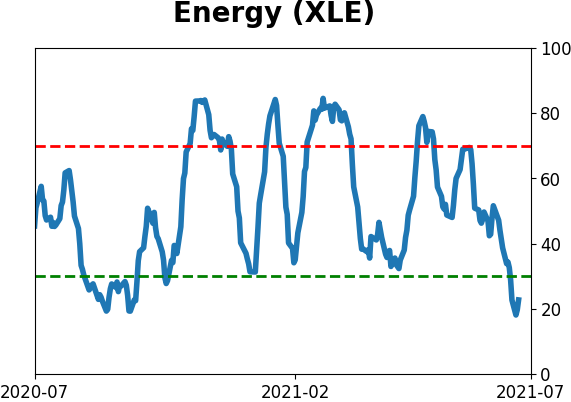
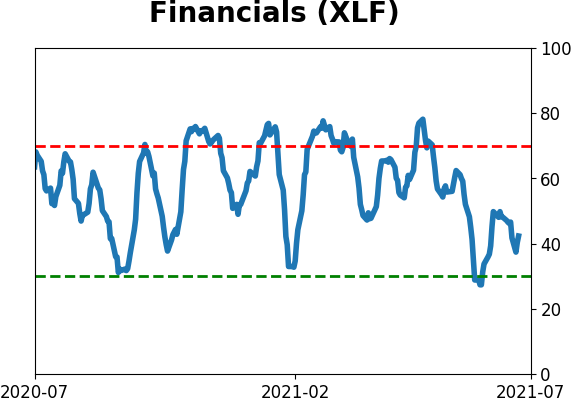
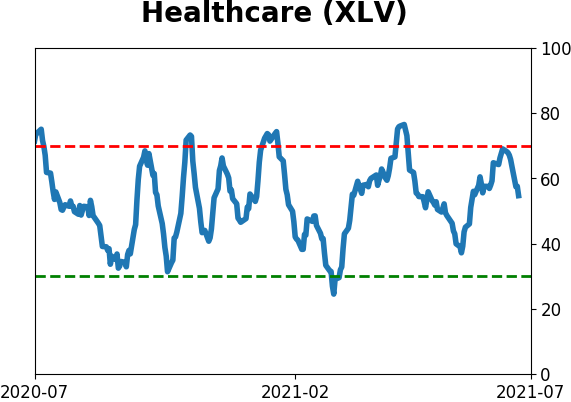
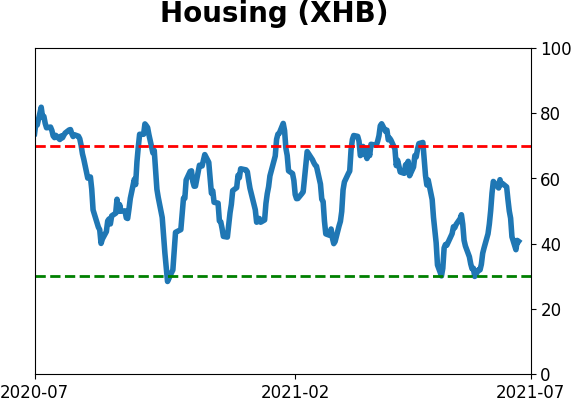
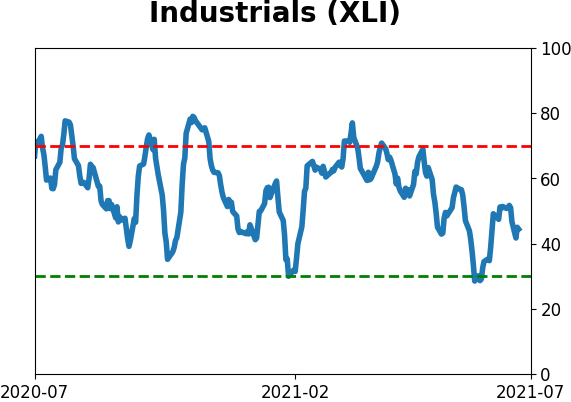
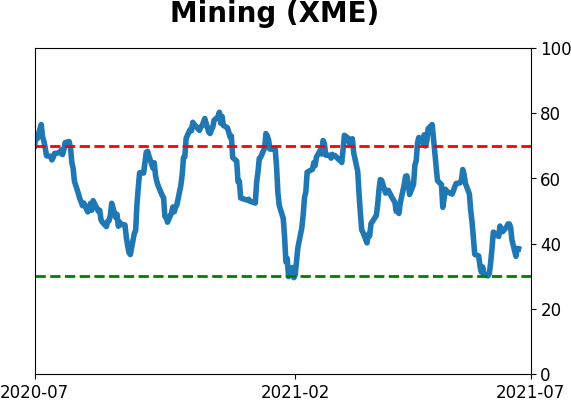
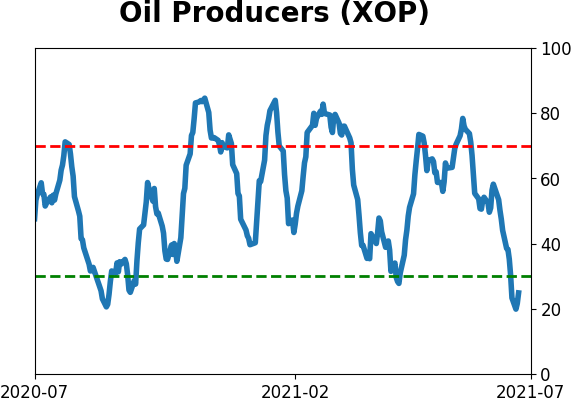
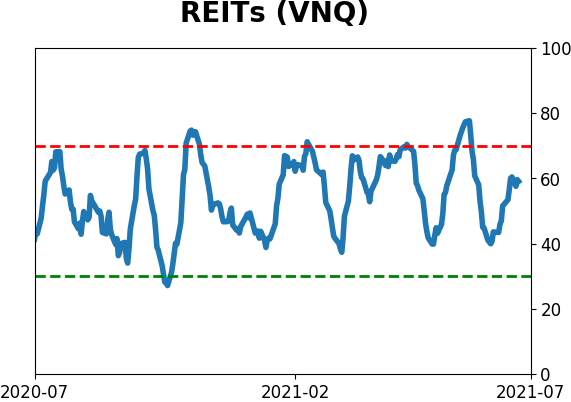
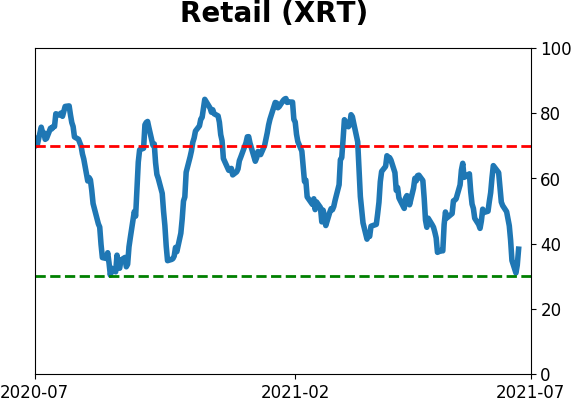
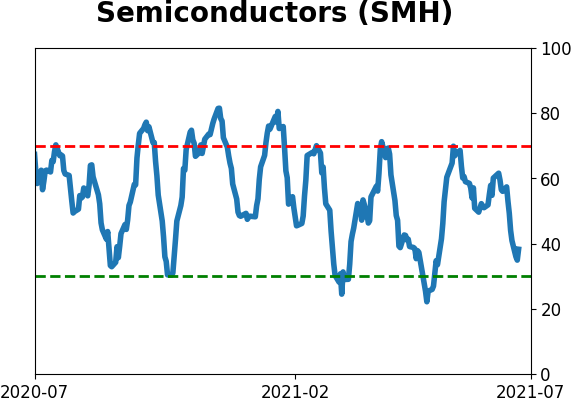
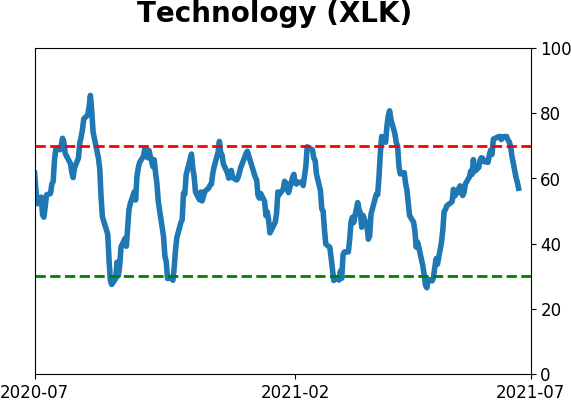
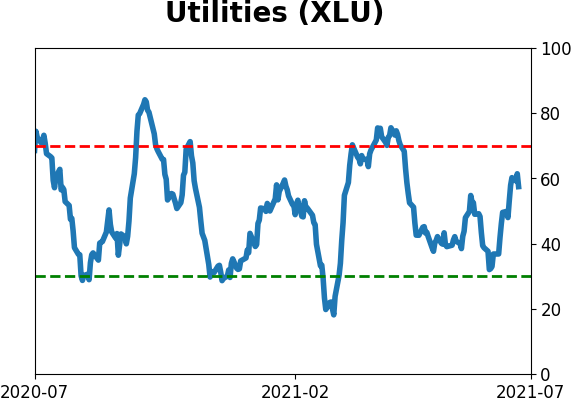
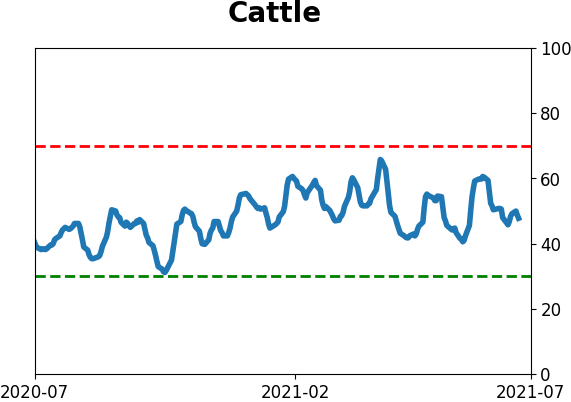
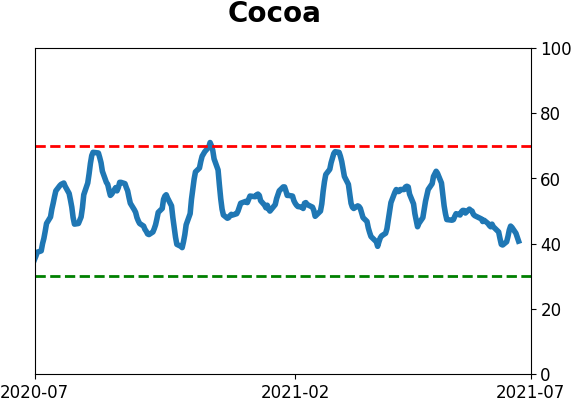
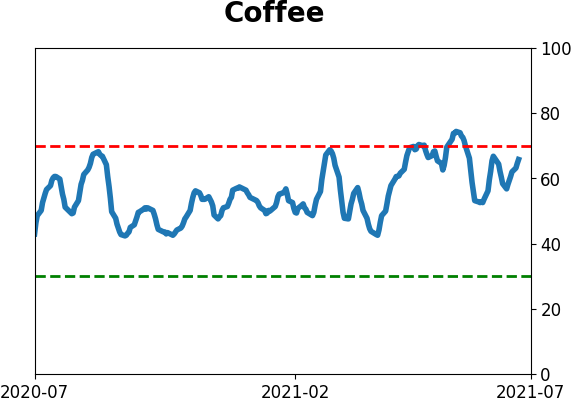
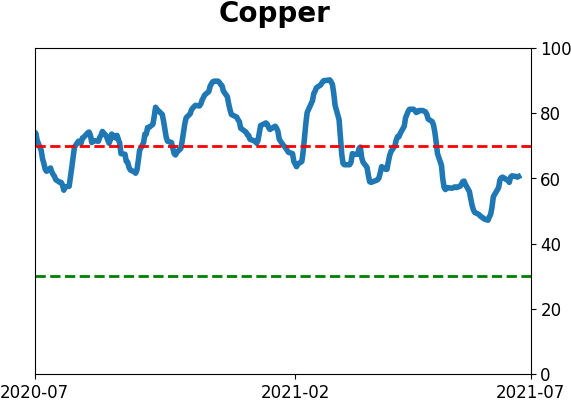
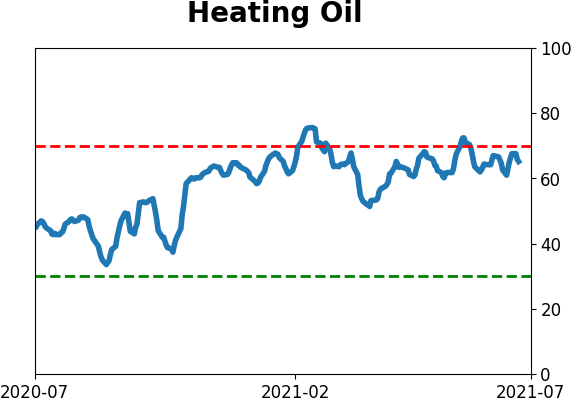
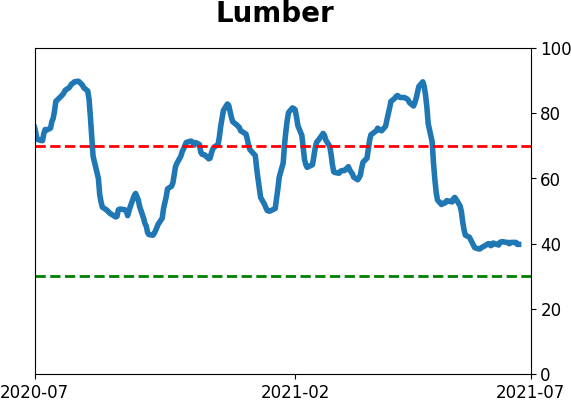
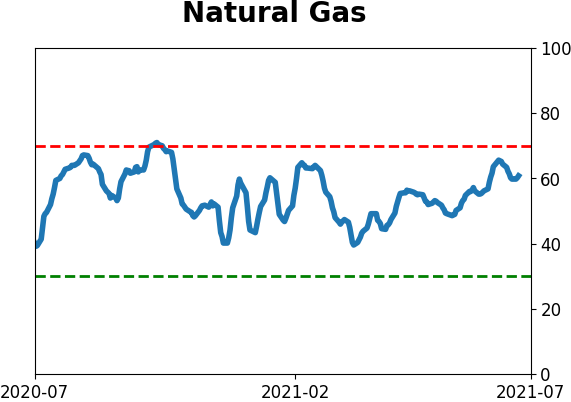
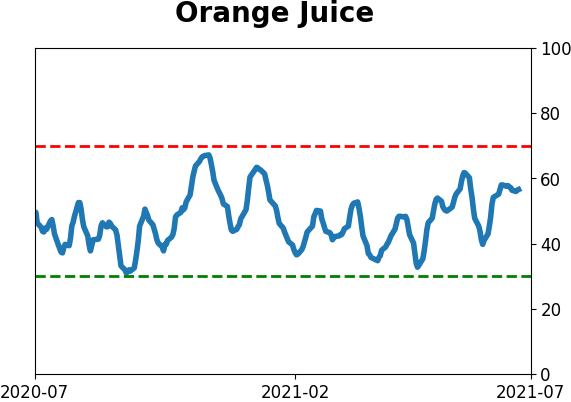
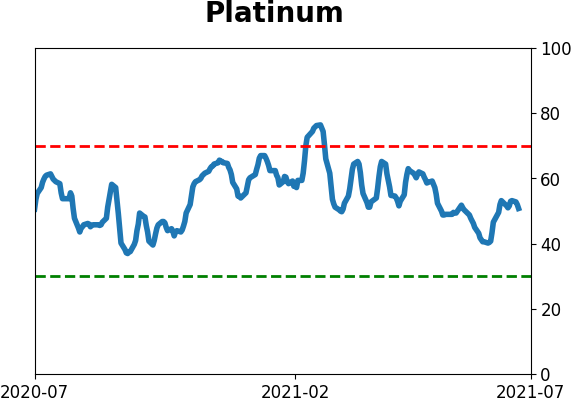
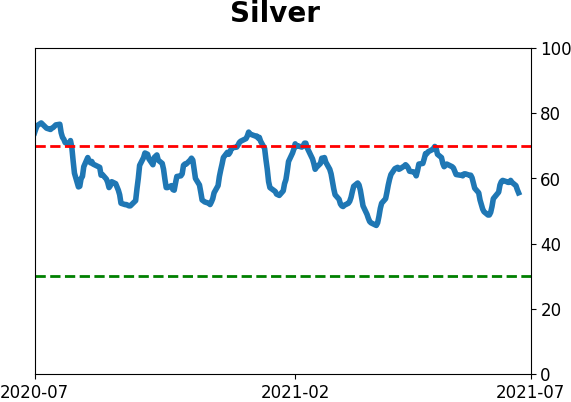
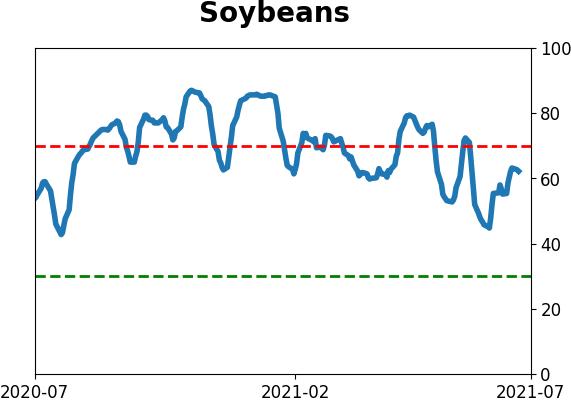
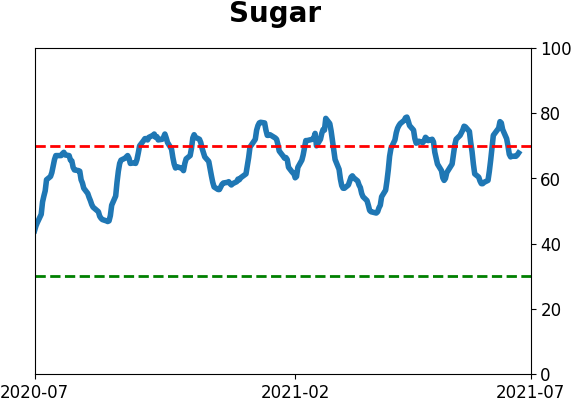
Optimism Index Thumbnails
|
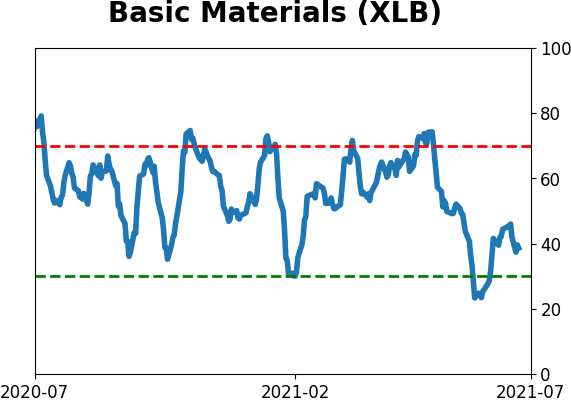
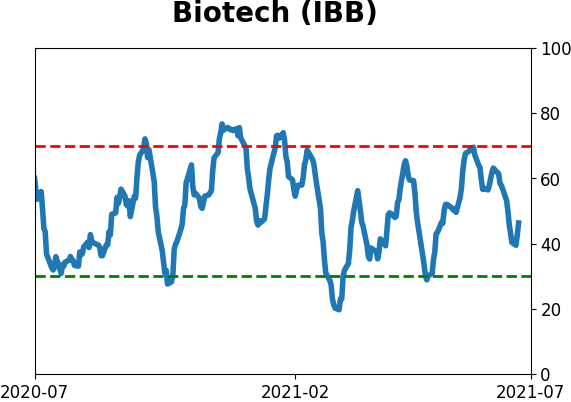
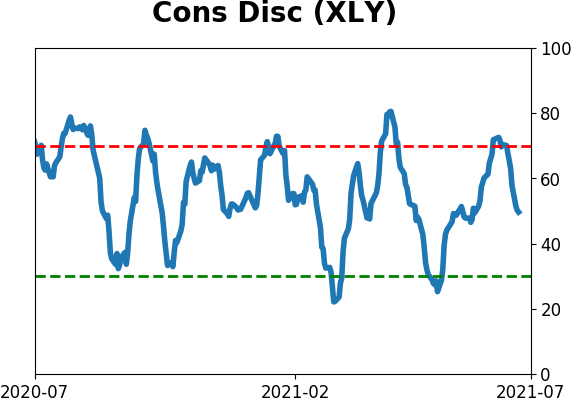
Sector ETF's - 10-Day Moving Average
|
|
|
Country ETF's - 10-Day Moving Average
|
|
|
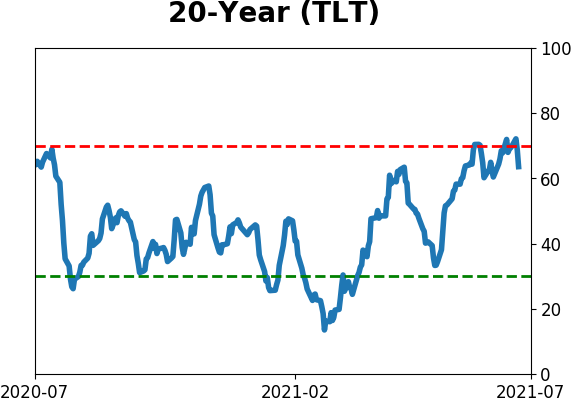
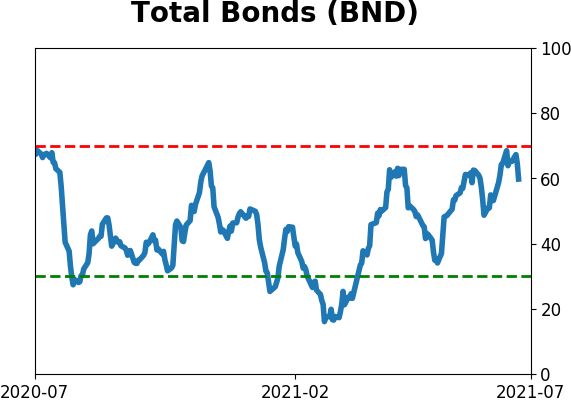
Bond ETF's - 10-Day Moving Average
|
|
|
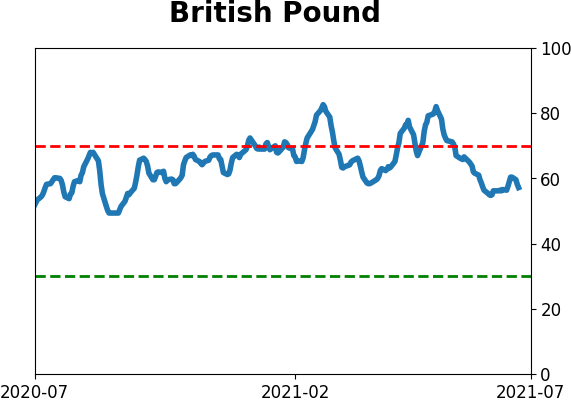
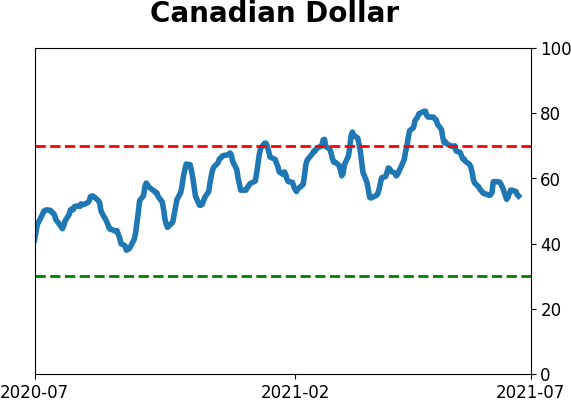
Currency ETF's - 5-Day Moving Average
|
|
|
Commodity ETF's - 5-Day Moving Average
|
|