Headlines
|
|
Growth Stocks Don't Like the Ends of Recessions:
The NBER has declared an end to recession in the U.S., ending the shortest one on record. After other public announcements of the ends of recessions, stocks were mixed up to a year later, yields typically rose, and Growth stocks struggled.
Bottom Line:
See the Outlook & Allocations page for more details on these summaries STOCKS: Hold
The speculative frenzy in February is wrung out. Internal dynamics have mostly held up, with some exceptions. Many of our studies still show a mixed to poor short-term view, with medium- and long-term ones turning more positive. BONDS: Hold
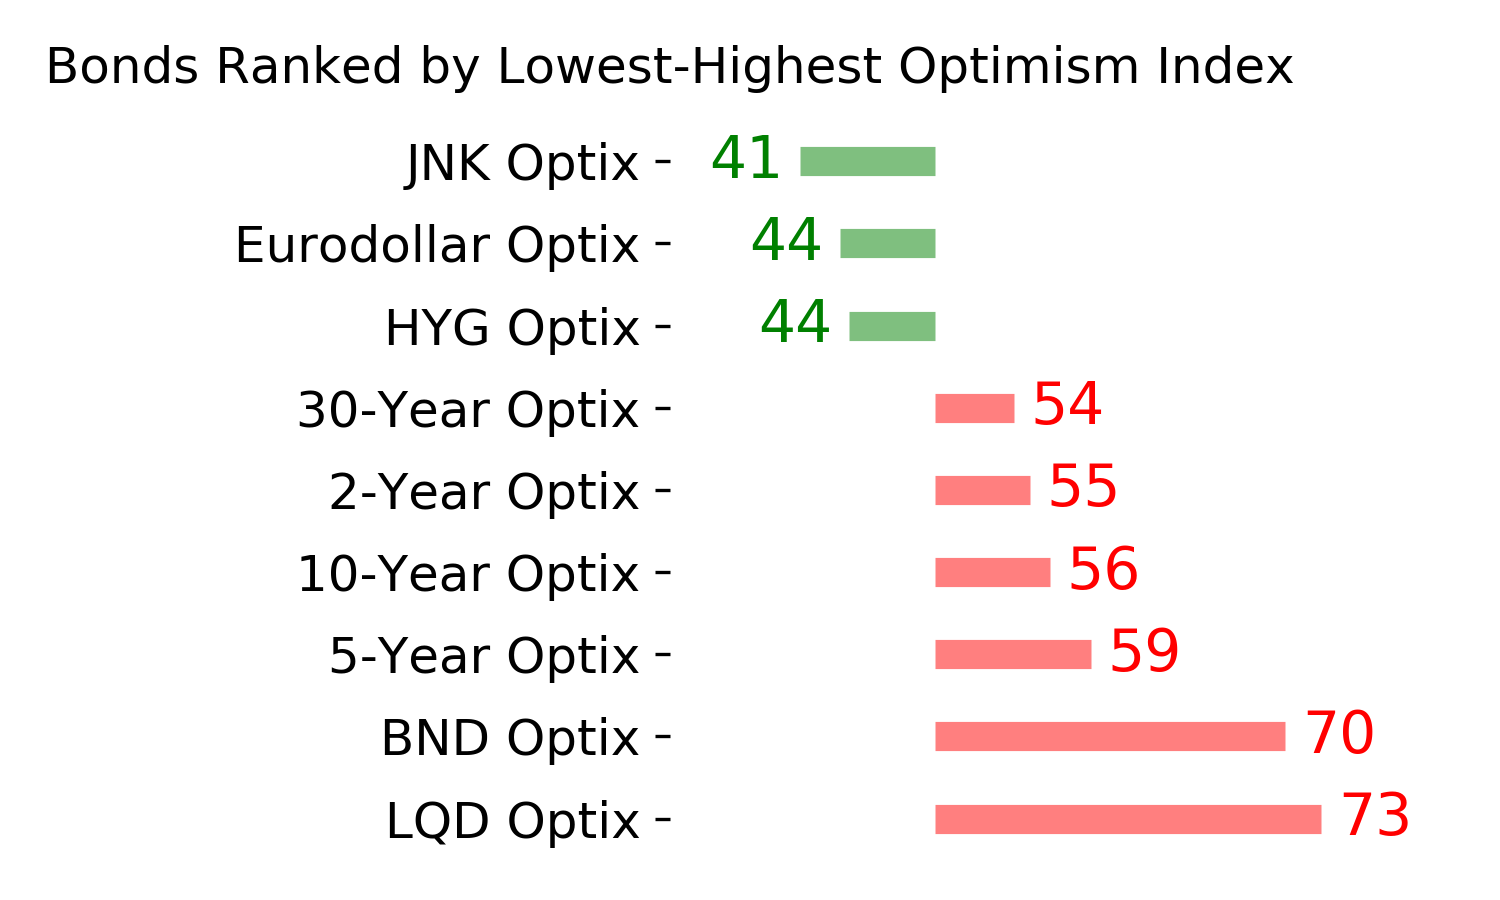
Various parts of the market got hit in March, with the lowest Bond Optimism Index we usually see during healthy environments. After a shaky couple of weeks, the broad bond market has modestly recovered. Not a big edge here either way. GOLD: Hold
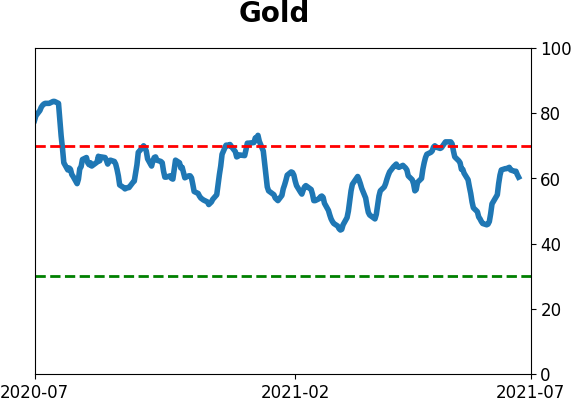
Gold and miners have done very well, recovering above long-term trend lines. The issue is that both have tended to perform poorly after similar situations - will have to wait and see how it plays out.
|
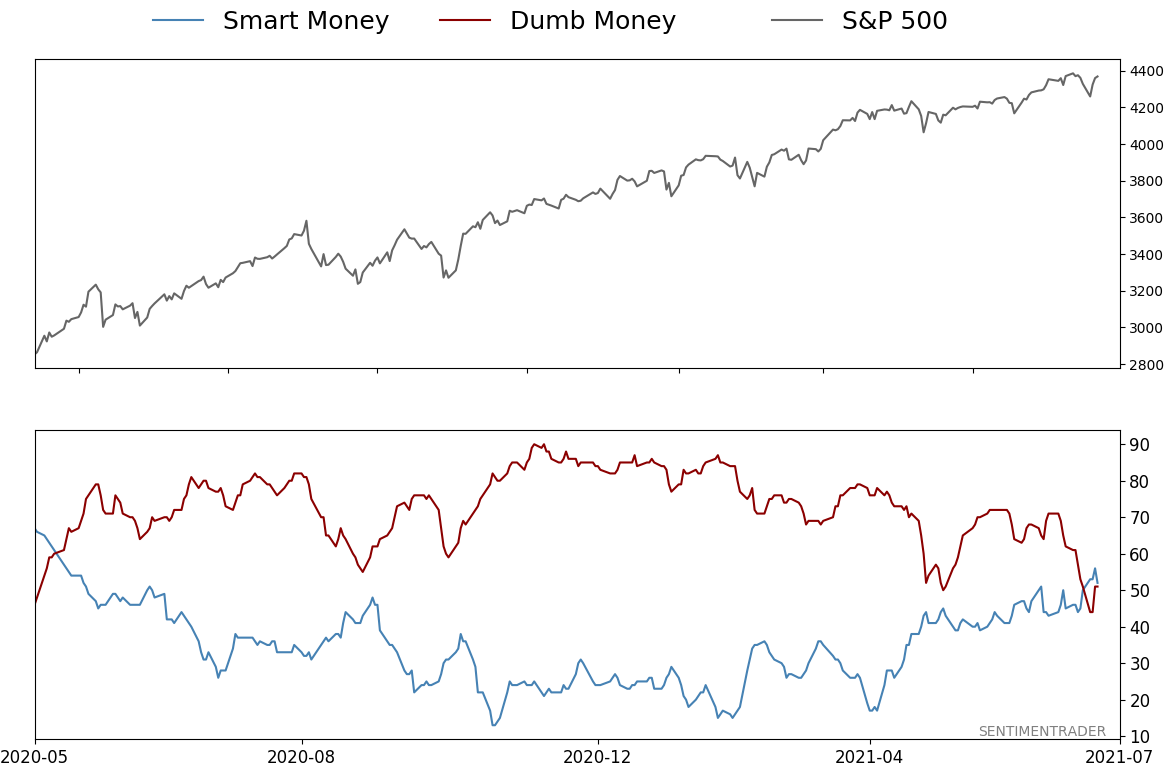
Smart / Dumb Money Confidence
|
Smart Money Confidence: 52%
Dumb Money Confidence: 51%
|
|
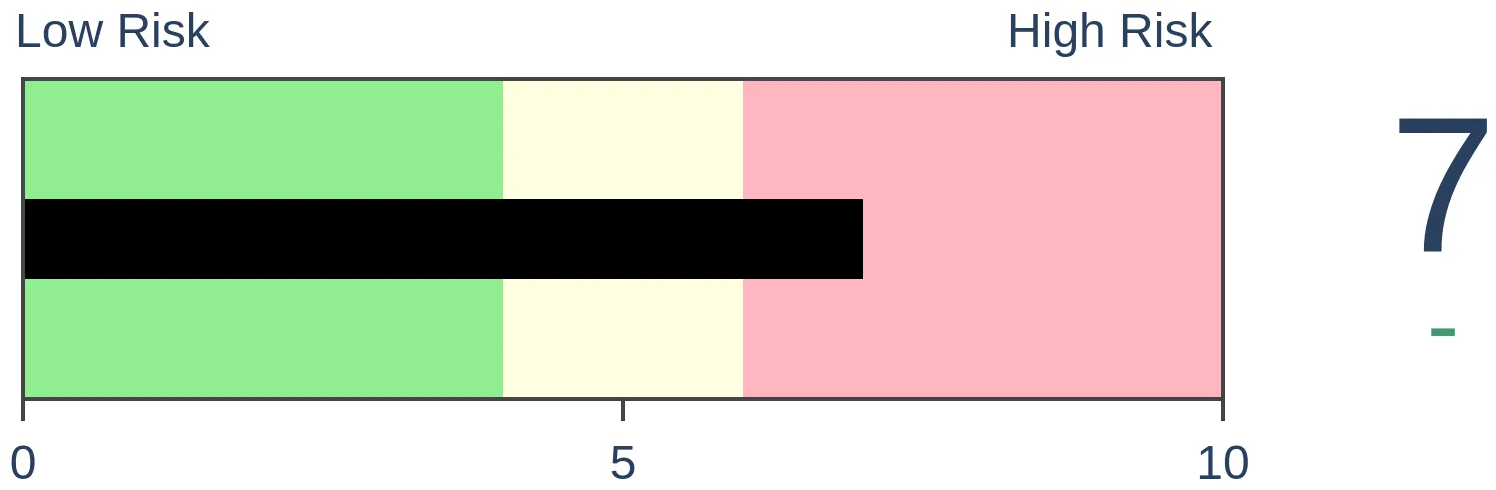
Risk Levels
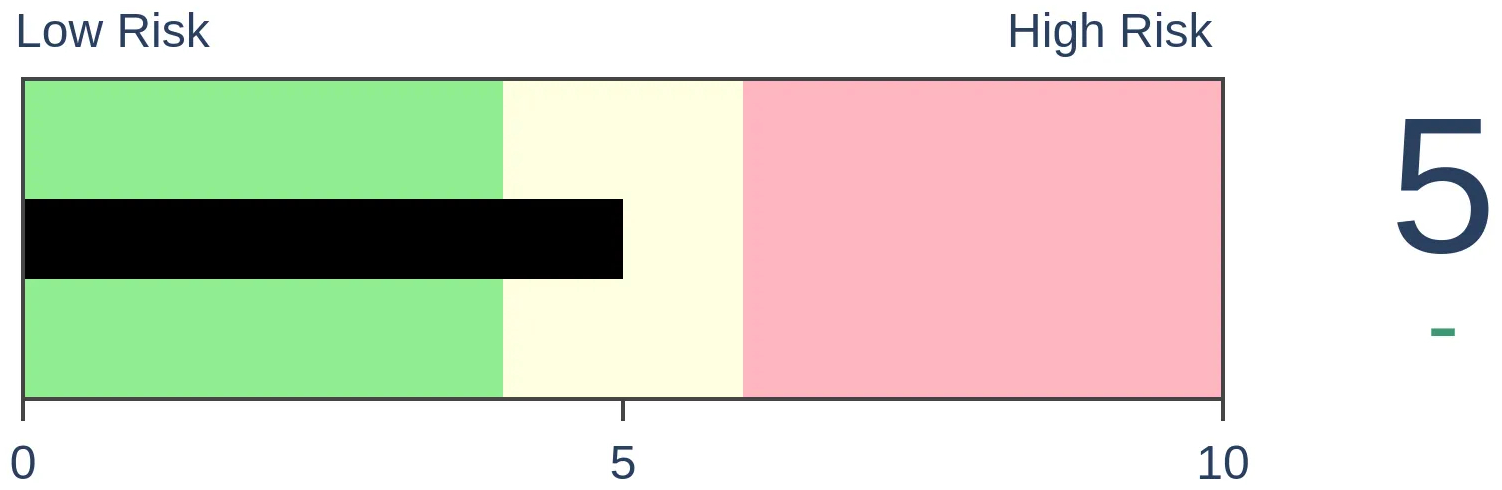
Stocks Short-Term
|
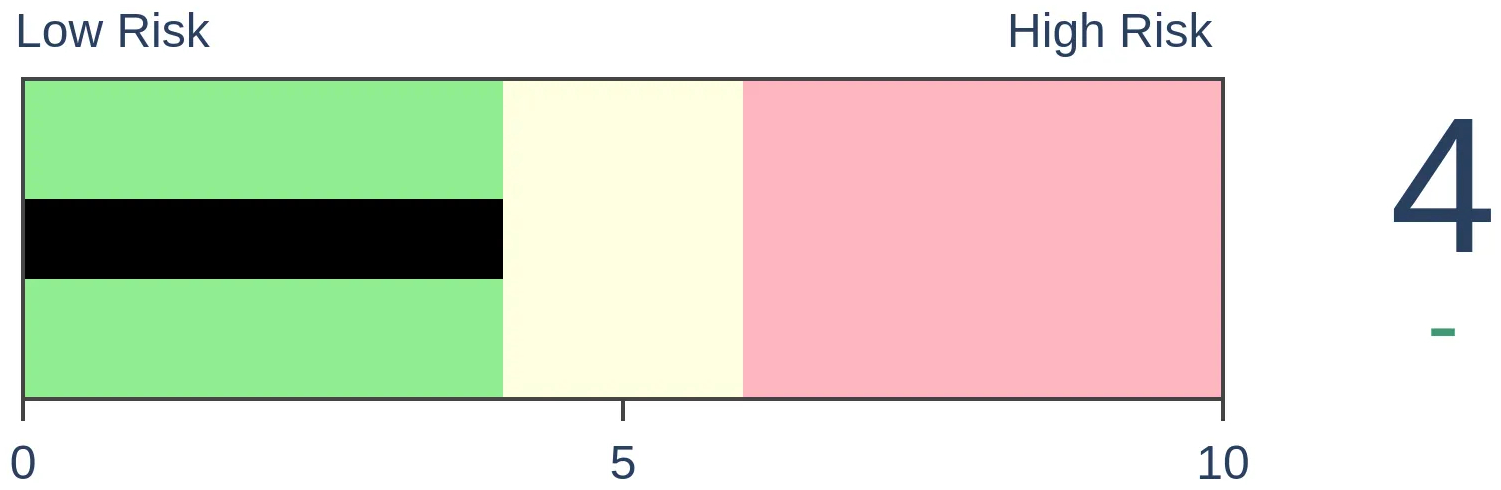
Stocks Medium-Term

|
|
Bonds

|
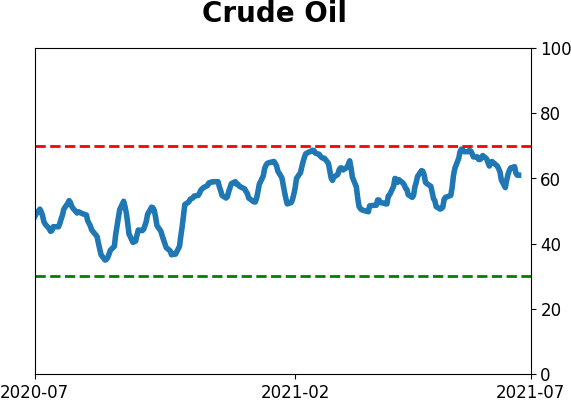
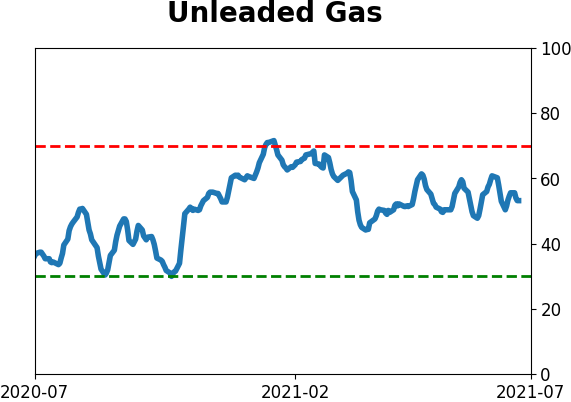
Crude Oil
|
|
Gold

|
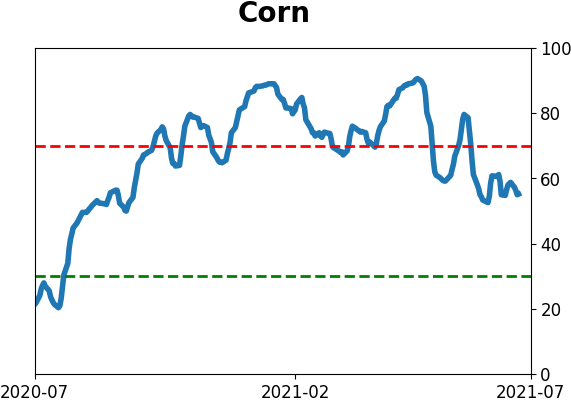
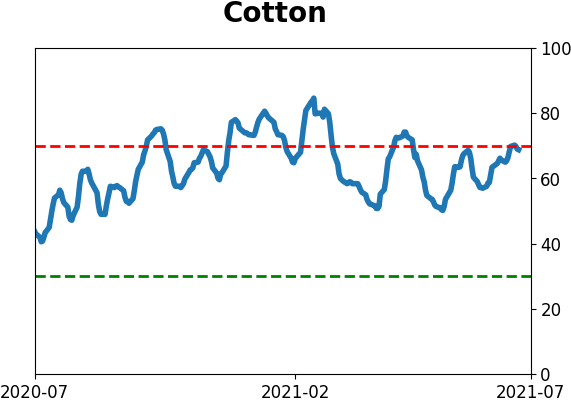
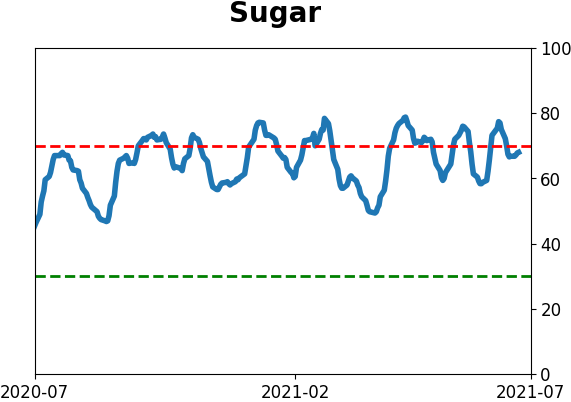
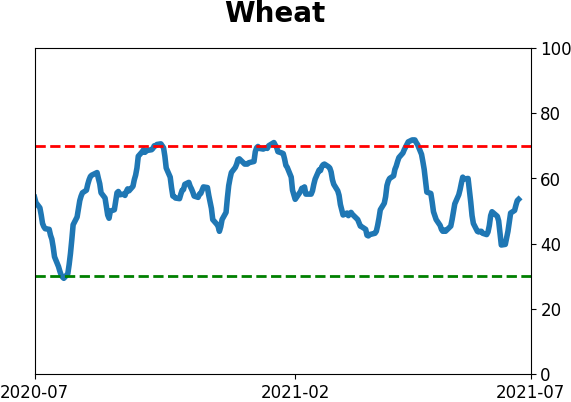
Agriculture
|
|
Research
By Jason Goepfert
BOTTOM LINE
The NBER has declared an end to recession in the U.S., ending the shortest one on record. After other public announcements of the ends of recessions, stocks were mixed up to a year later, yields typically rose, and Growth stocks struggled.
FORECAST / TIMEFRAME
None
|
The recession is over, and we can all breathe easier now.
According to the National Bureau of Economic Research (NBER), the "official" arbiter of U.S. business cycles, the economy pulled out of recession last April, ending the shortest recession on record.
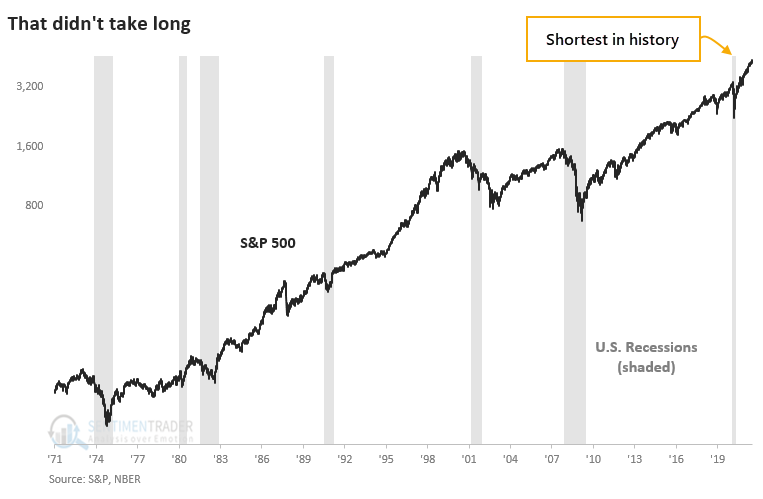
Great. The only problem is that it would have been nice to know this a year ago. Because of data lags and the requirements for determining business cycles, that's not possible, so we have to deal with things well after the fact.
ENDS OF RECESSIONS - OKAY FOR STOCKS, BAD FOR BONDS
To see if there is any potential use in becoming more optimistic once a recession is officially declared to be over, the table below shows how the S&P 500 performed following a publicly declared end to a recession by the NBER.
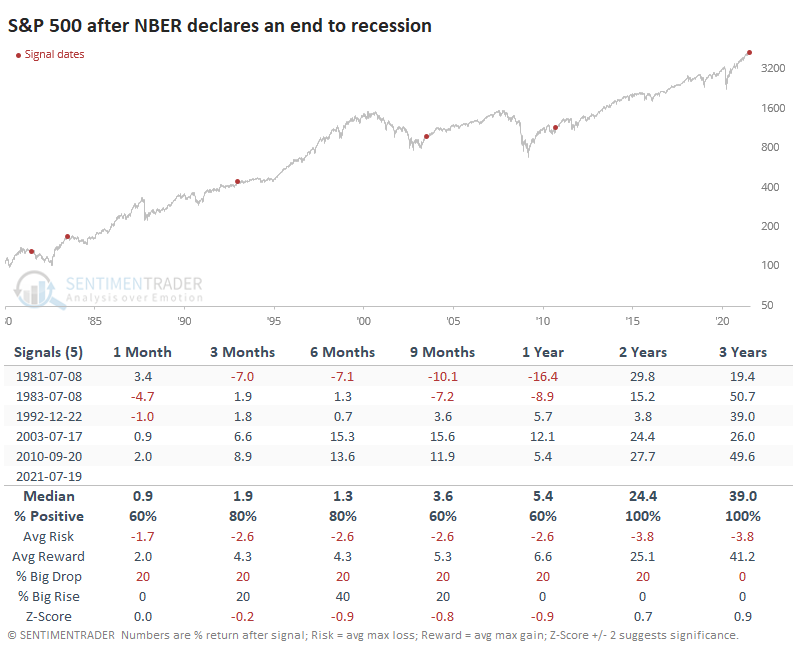
In the very short-term of a couple of weeks (not shown), the S&P dropped after each of the last five declarations. The weakness didn't last long, though it still underperformed a random return up to a year later. Only over the next 2-3 years did it show above-average performance, with low risk and high reward. The last two signals, clearly, were very positive for stocks over almost all time frames beyond a few weeks.
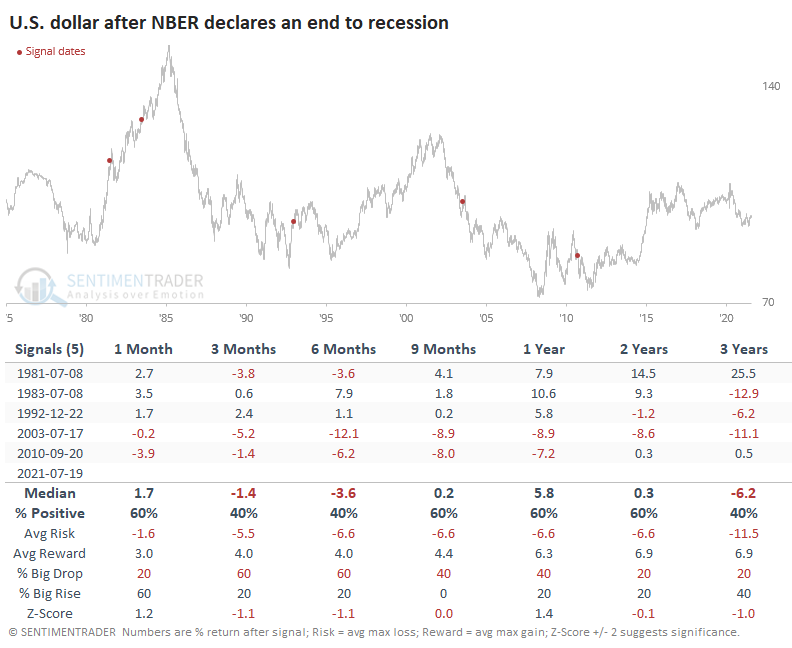
The U.S. dollar showed mixed returns.
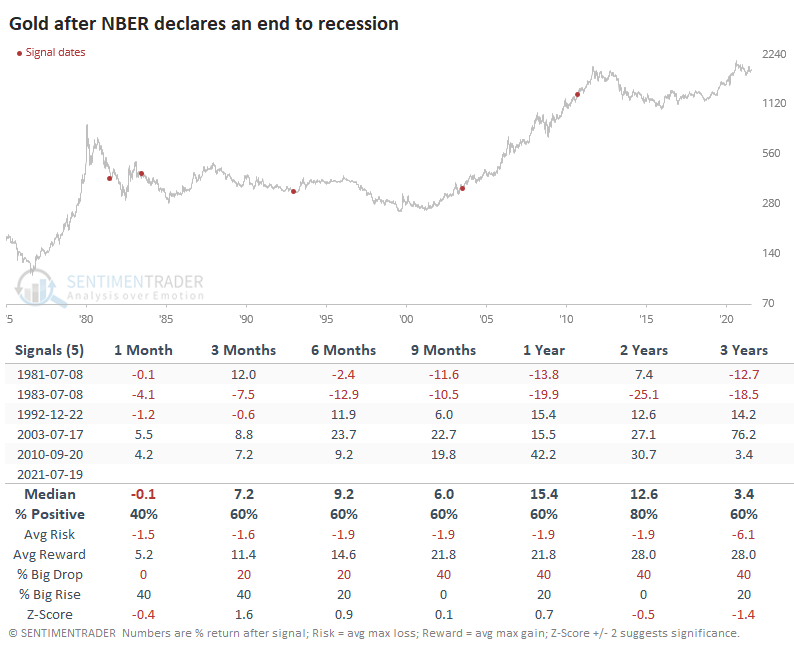
Gold was basically the inverse, with declines in the 1980s as the dollar rallied and gains after the last two as the dollar fell.
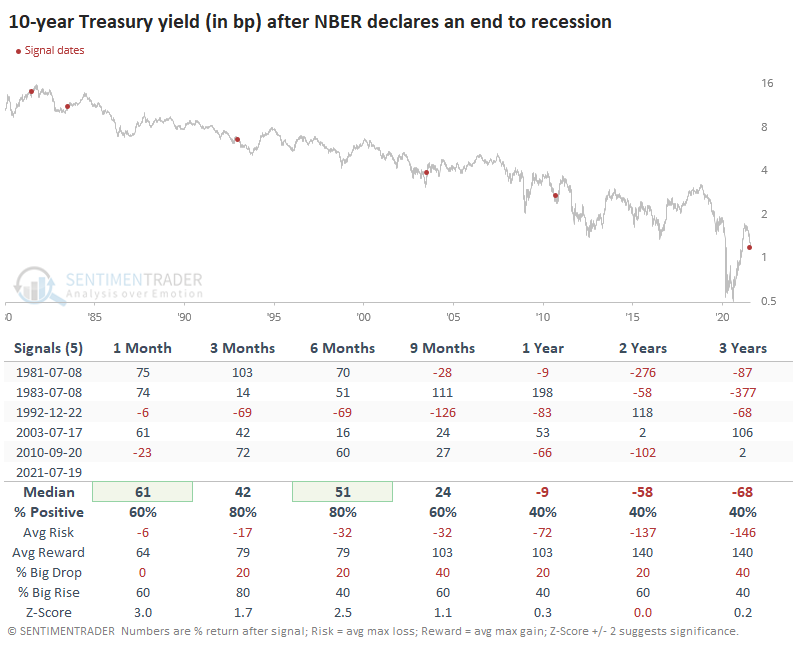
The yield on 10-year Treasuries rose four out of five times during the 3-6 months following an announcement that a recession had ended but had trouble holding those gains as the long-term trend of lower rates asserted itself.
ENERGY AND VALUE SHINED, GROWTH STUMBLED
Returns in sectors and factors showed some large differences, though we must be careful with such a small sample size. Some of these returns go against other recent studies, though one consistency is that Energy and Value stocks showed some of the best returns. The average return on Growth stocks was atrocious.
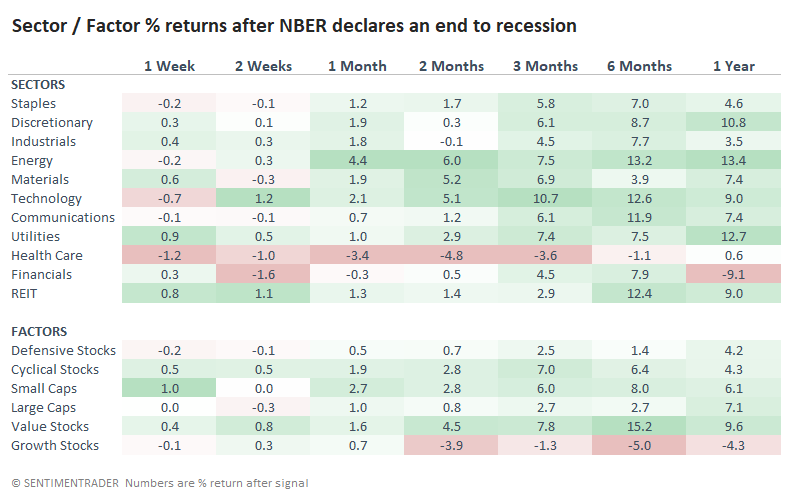
We can see that in their consistency as well. This is the percentage of time each sector and factor showed a positive return across the time frames. With a sample size of only five, though, this has less meaning.
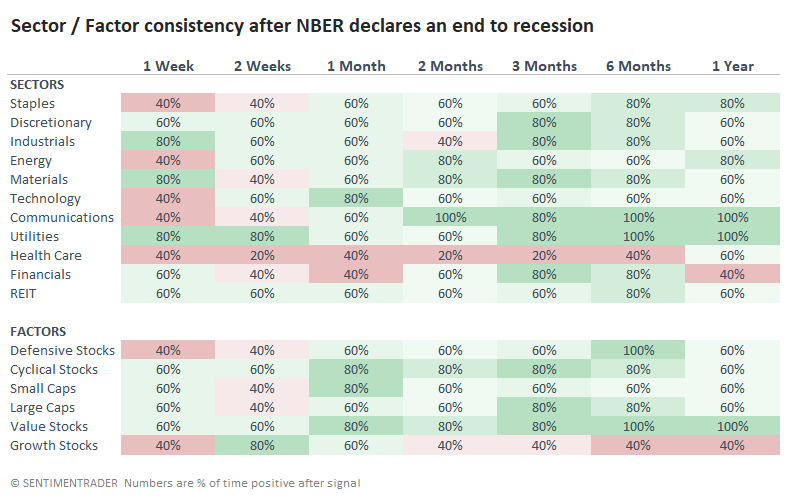
Often, the best time to invest for the long-term is when the news is worst. The national news is chock full of reports about the economy falling into recession, jobs being lost, markets tanking. The inverse isn't as true, but we can still generally expect below-average returns when everything seems rosy. Now that headlines will be trumpeting an end to the shortest recession on record, we should be on guard that it doesn't necessarily mean clear sailing, especially for Growth.
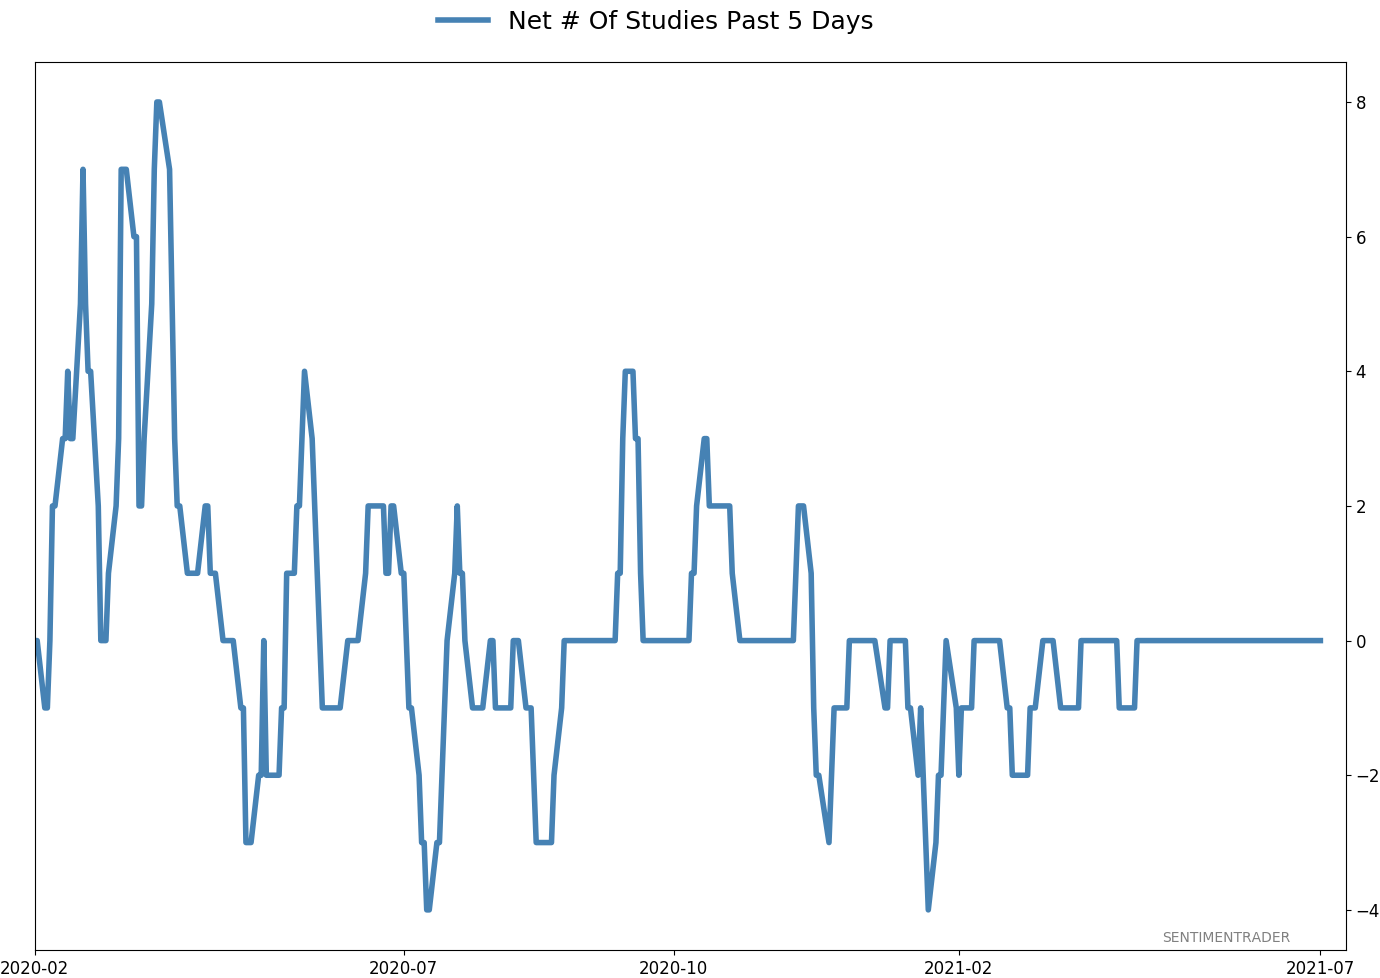
Active Studies
| Time Frame | Bullish | Bearish | | Short-Term | 0 | 4 | | Medium-Term | 3 | 3 | | Long-Term | 10 | 5 |
|
Indicators at Extremes
Portfolio
| Position | Description | Weight % | Added / Reduced | Date | | Stocks | RSP | 4.1 | Added 4.1% | 2021-05-19 | | Bonds | 23.9% BND, 6.9% SCHP | 30.7 | Reduced 7.1% | 2021-05-19 | | Commodities | GCC | 2.6 | Reduced 2.1%
| 2020-09-04 | | Precious Metals | GDX | 5.6 | Reduced 4.2% | 2021-05-19 | | Special Situations | 4.3% XLE, 2.2% PSCE | 7.6 | Reduced 5.6% | 2021-04-22 | | Cash | | 49.4 | | |
|
Updates (Changes made today are underlined)
Much of our momentum and trend work has remained positive for several months, with some scattered exceptions. Almost all sentiment-related work has shown a poor risk/reward ratio for stocks, especially as speculation drove to record highs in exuberance in February. Much of that has worn off, and most of our models are back toward neutral levels. There isn't much to be excited about here. The same goes for bonds and even gold. Gold has been performing well lately and is back above long-term trend lines. The issue is that it has a poor record of holding onto gains when attempting a long-term trend change like this, so we'll take a wait-and-see approach. RETURN YTD: 9.1% 2020: 8.1%, 2019: 12.6%, 2018: 0.6%, 2017: 3.8%, 2016: 17.1%, 2015: 9.2%, 2014: 14.5%, 2013: 2.2%, 2012: 10.8%, 2011: 16.5%, 2010: 15.3%, 2009: 23.9%, 2008: 16.2%, 2007: 7.8%
|
|
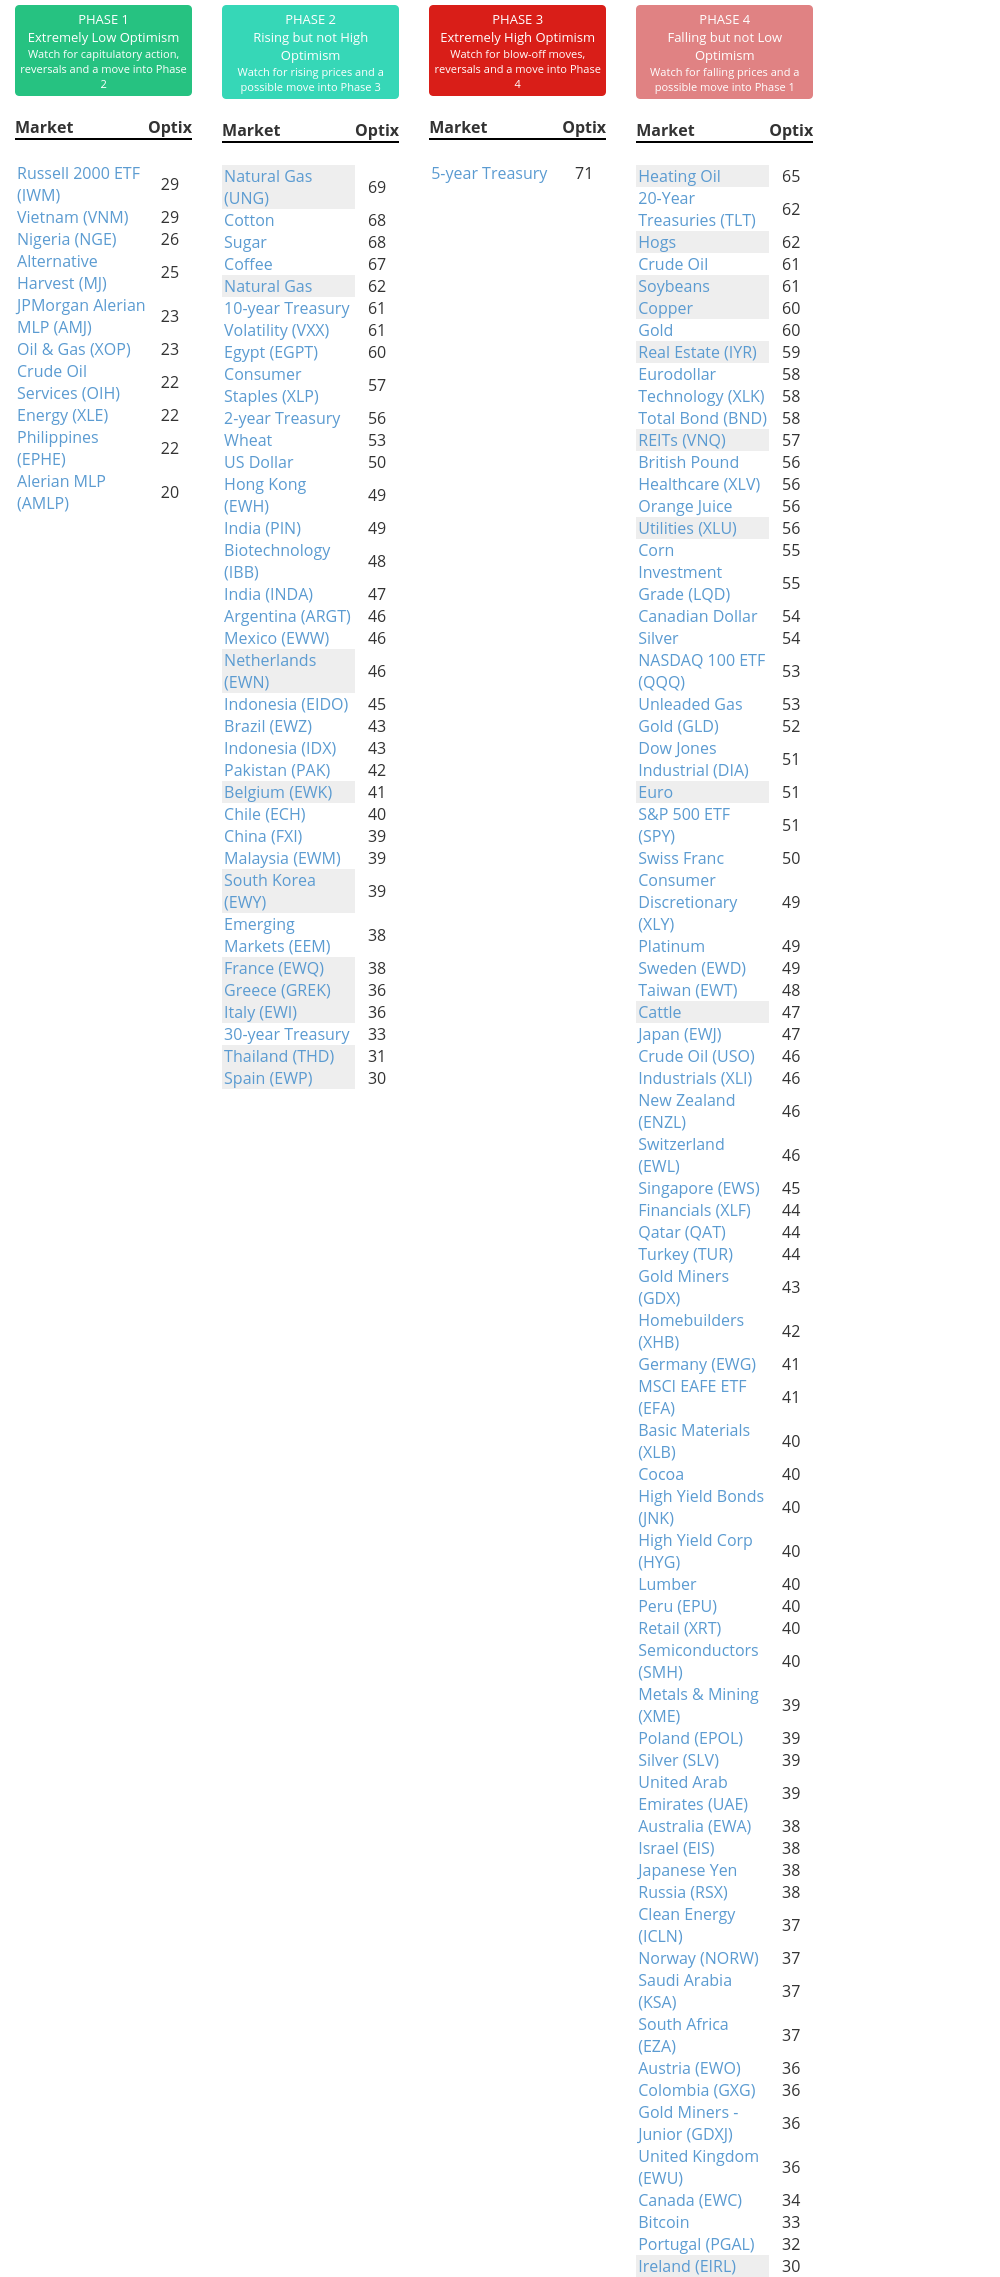
Phase Table
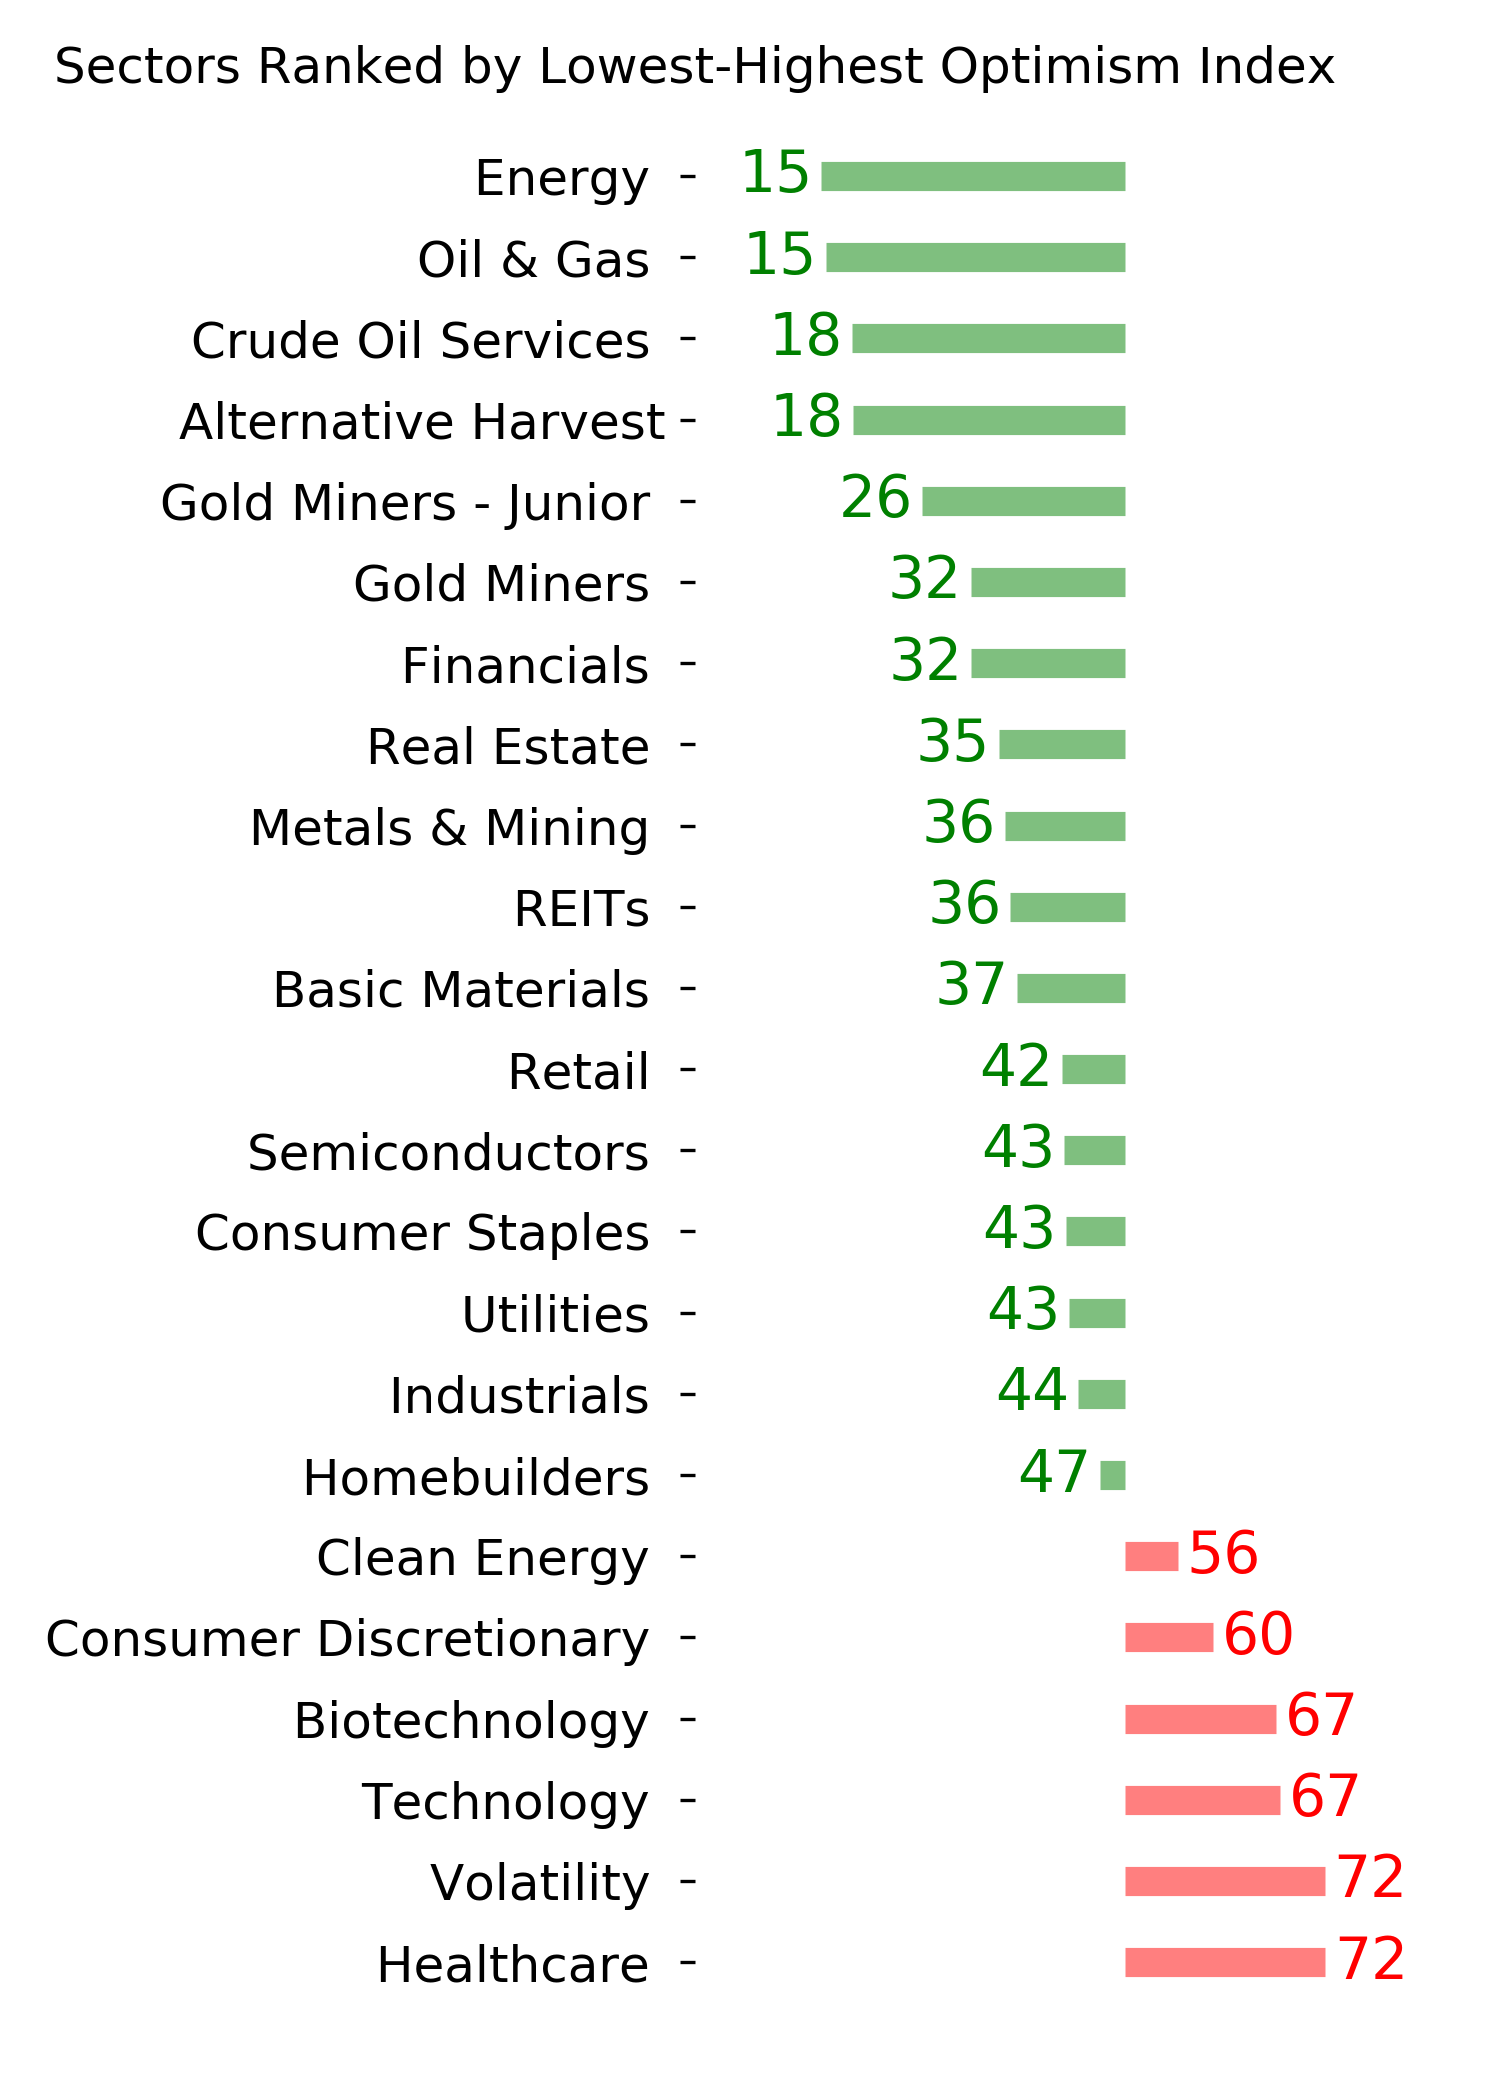
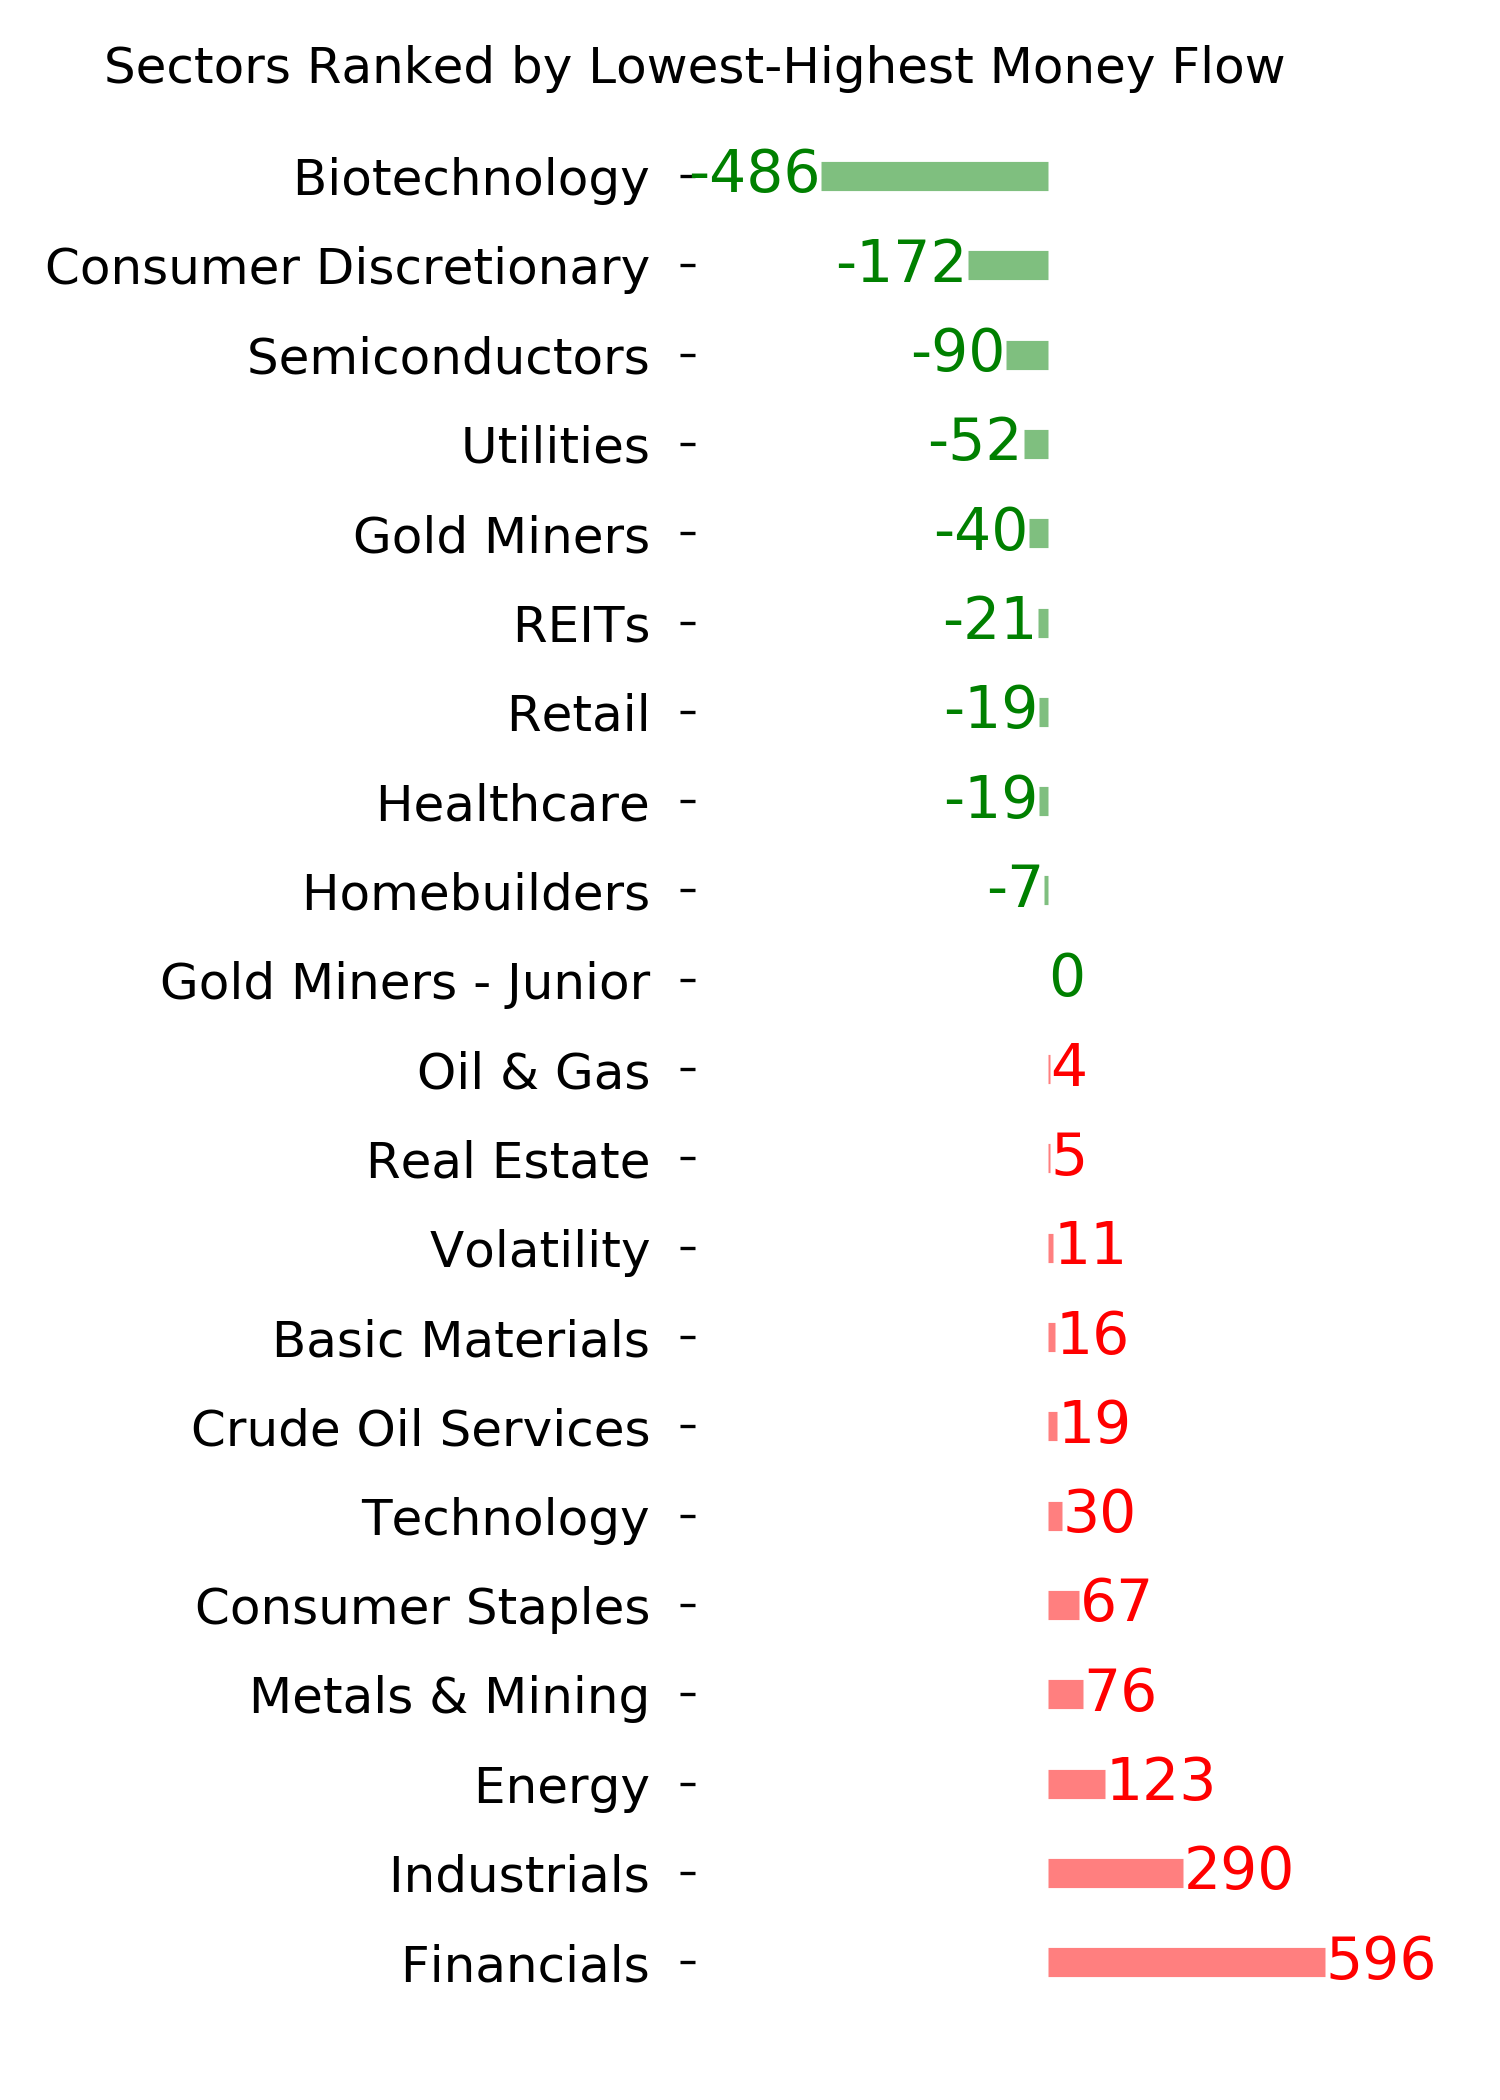
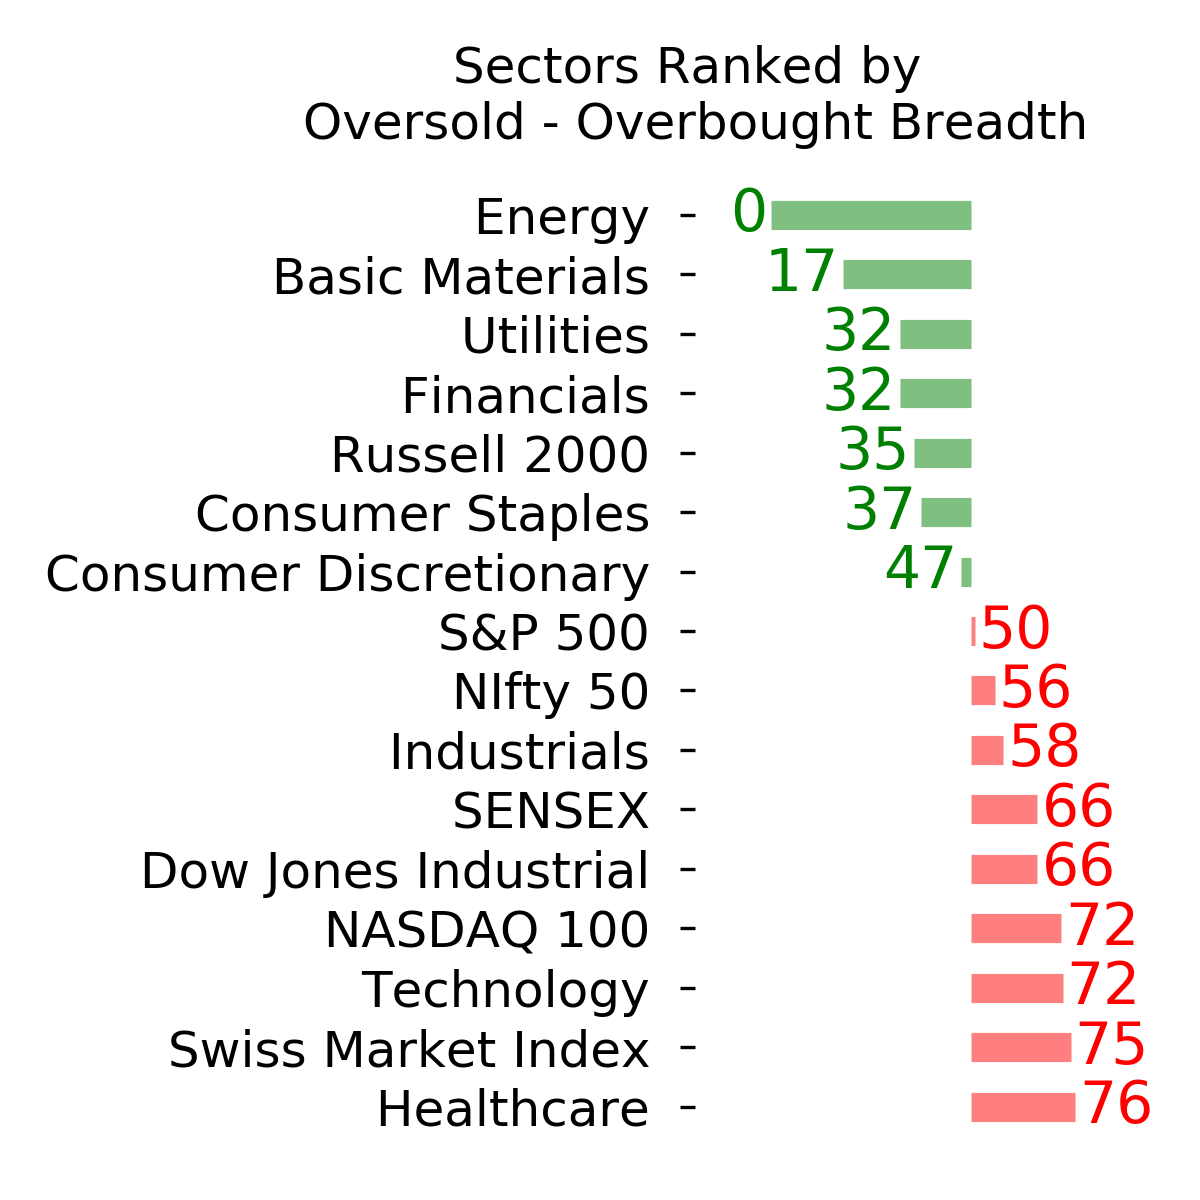
Ranks
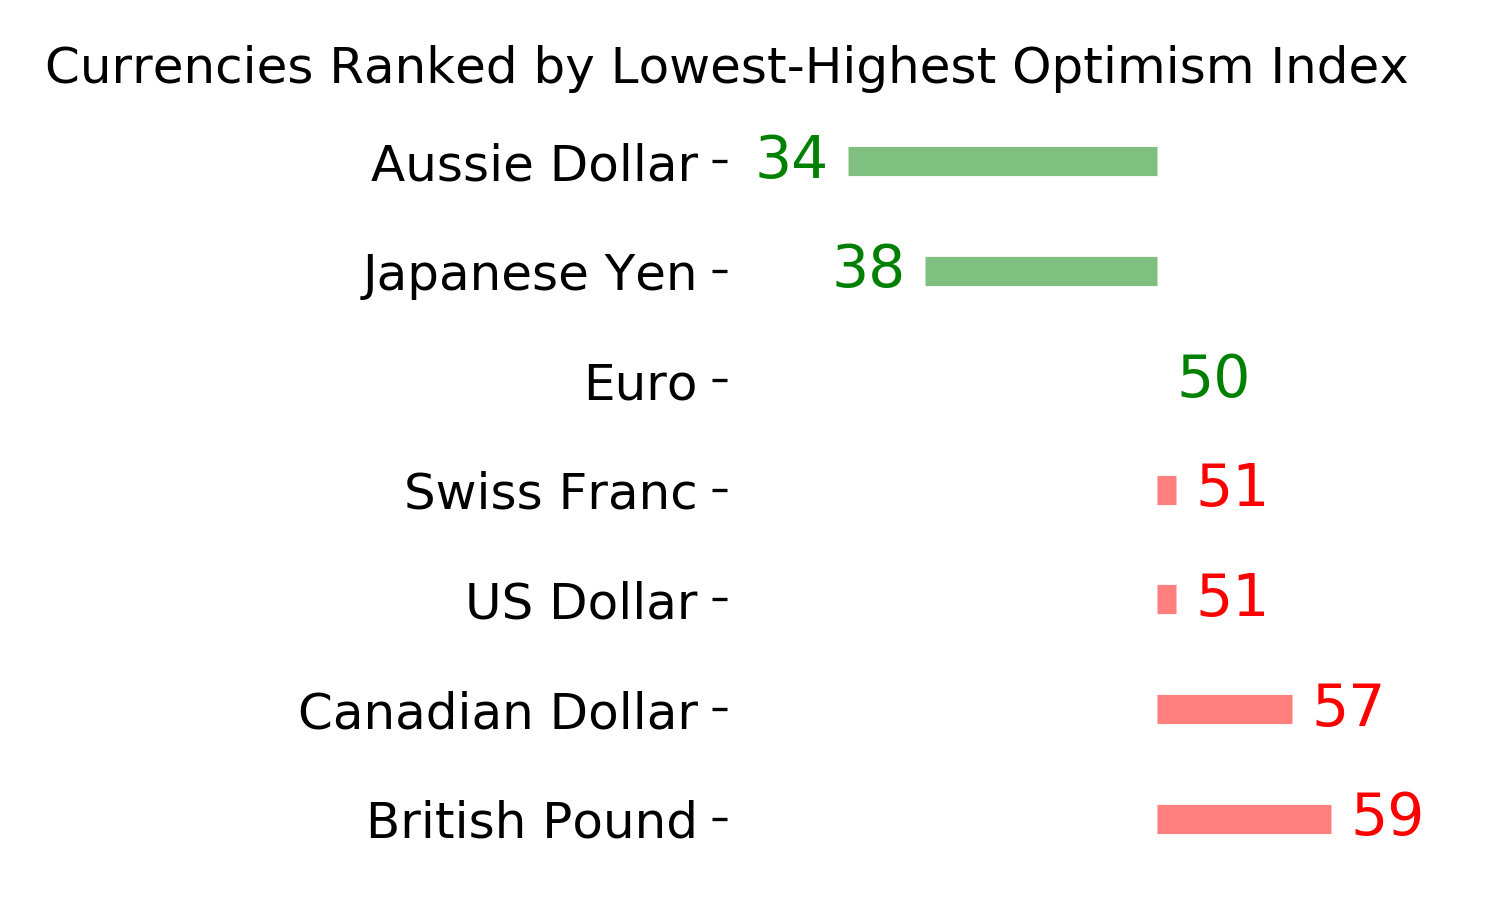
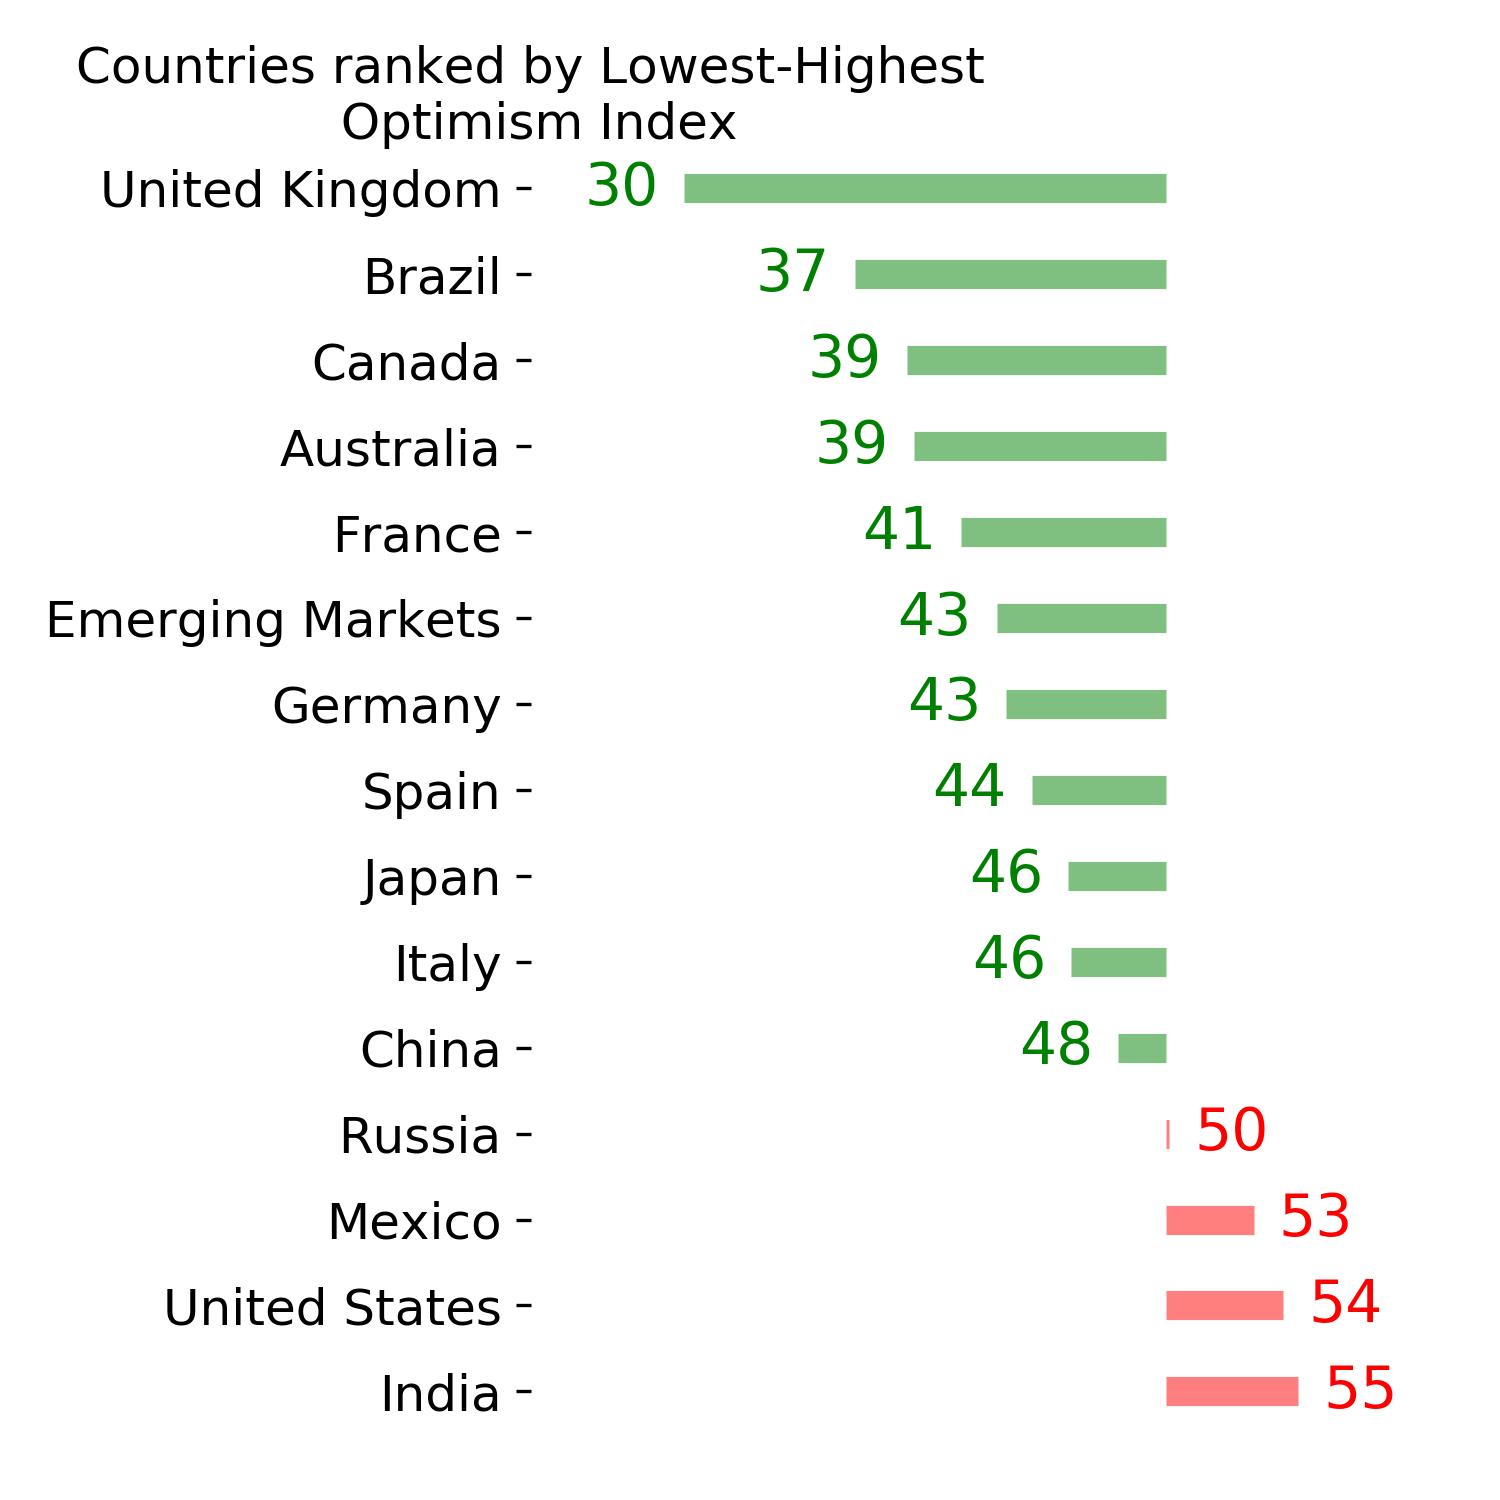
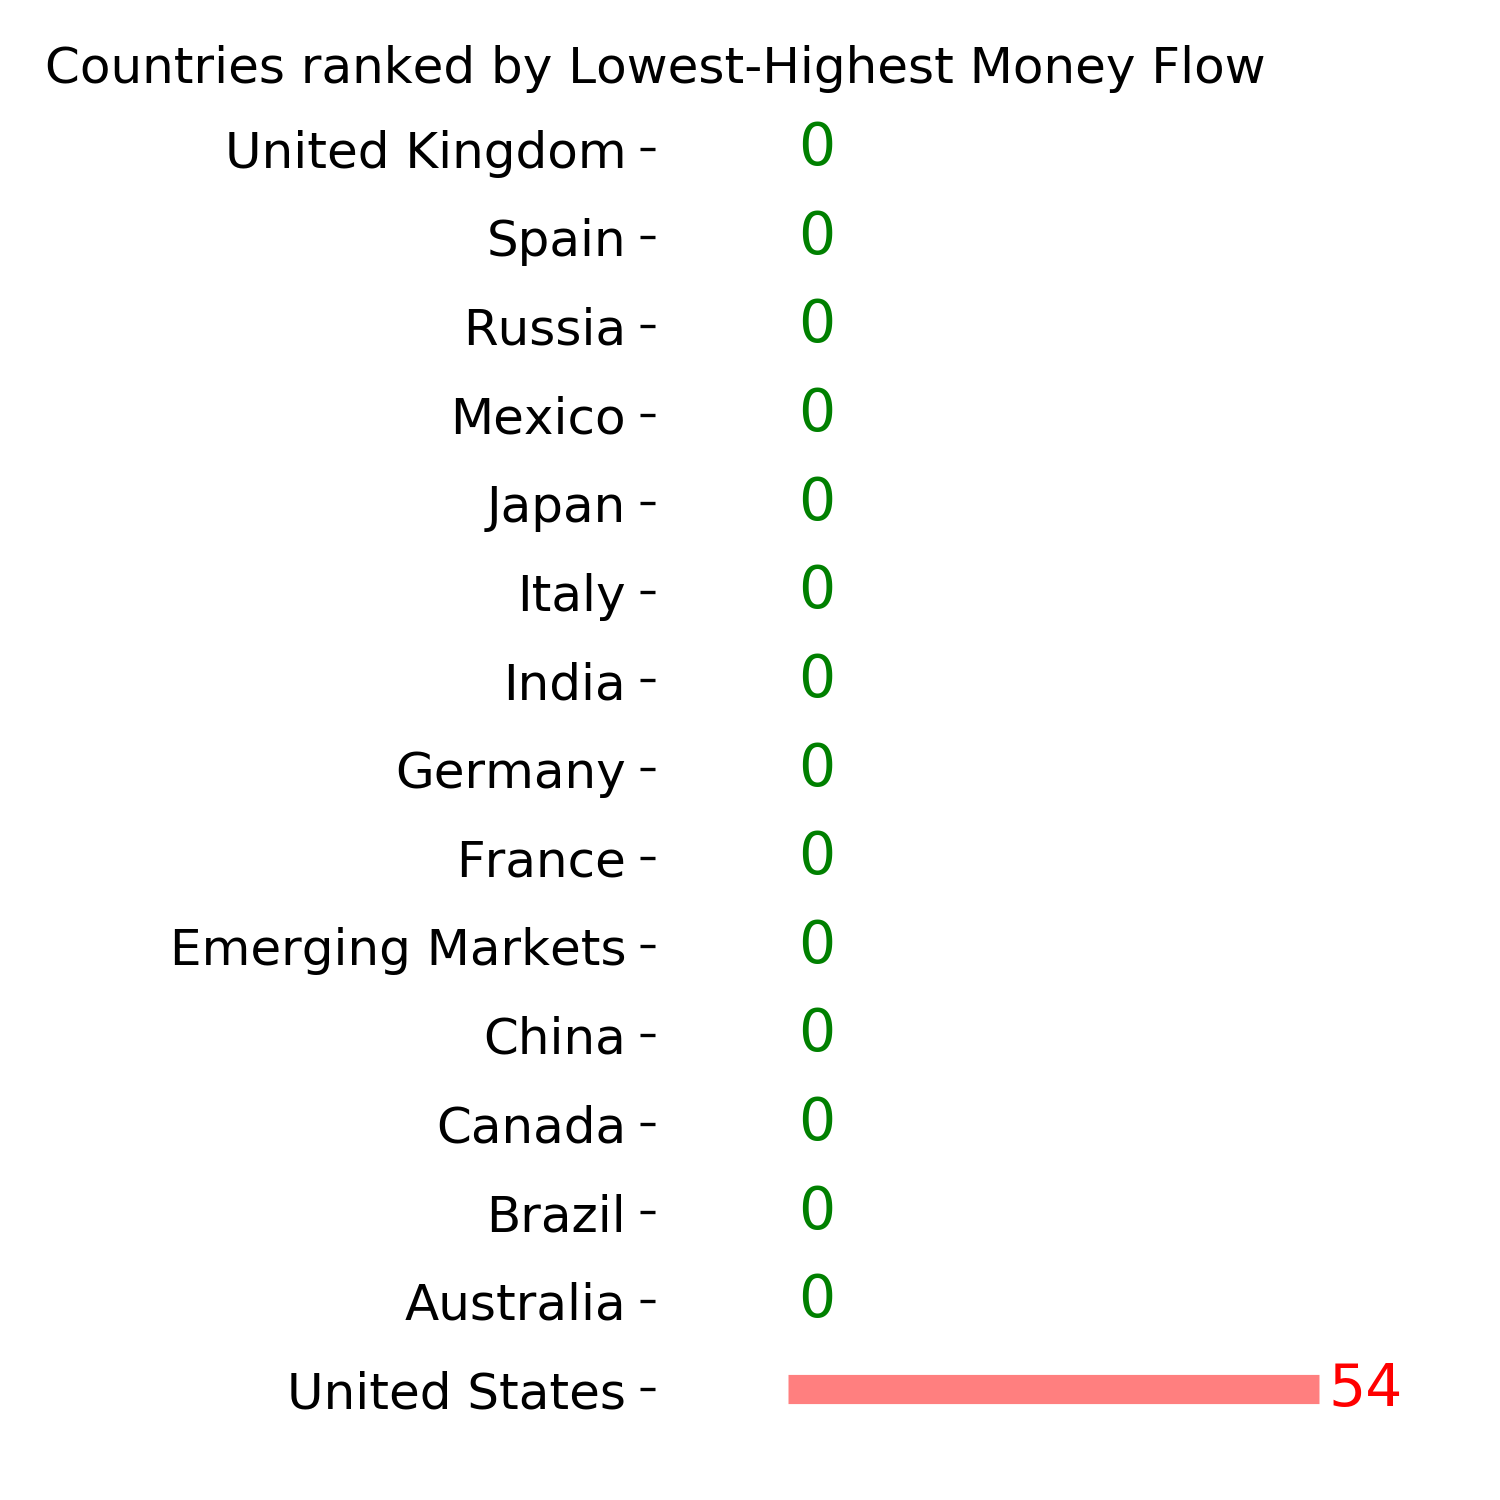
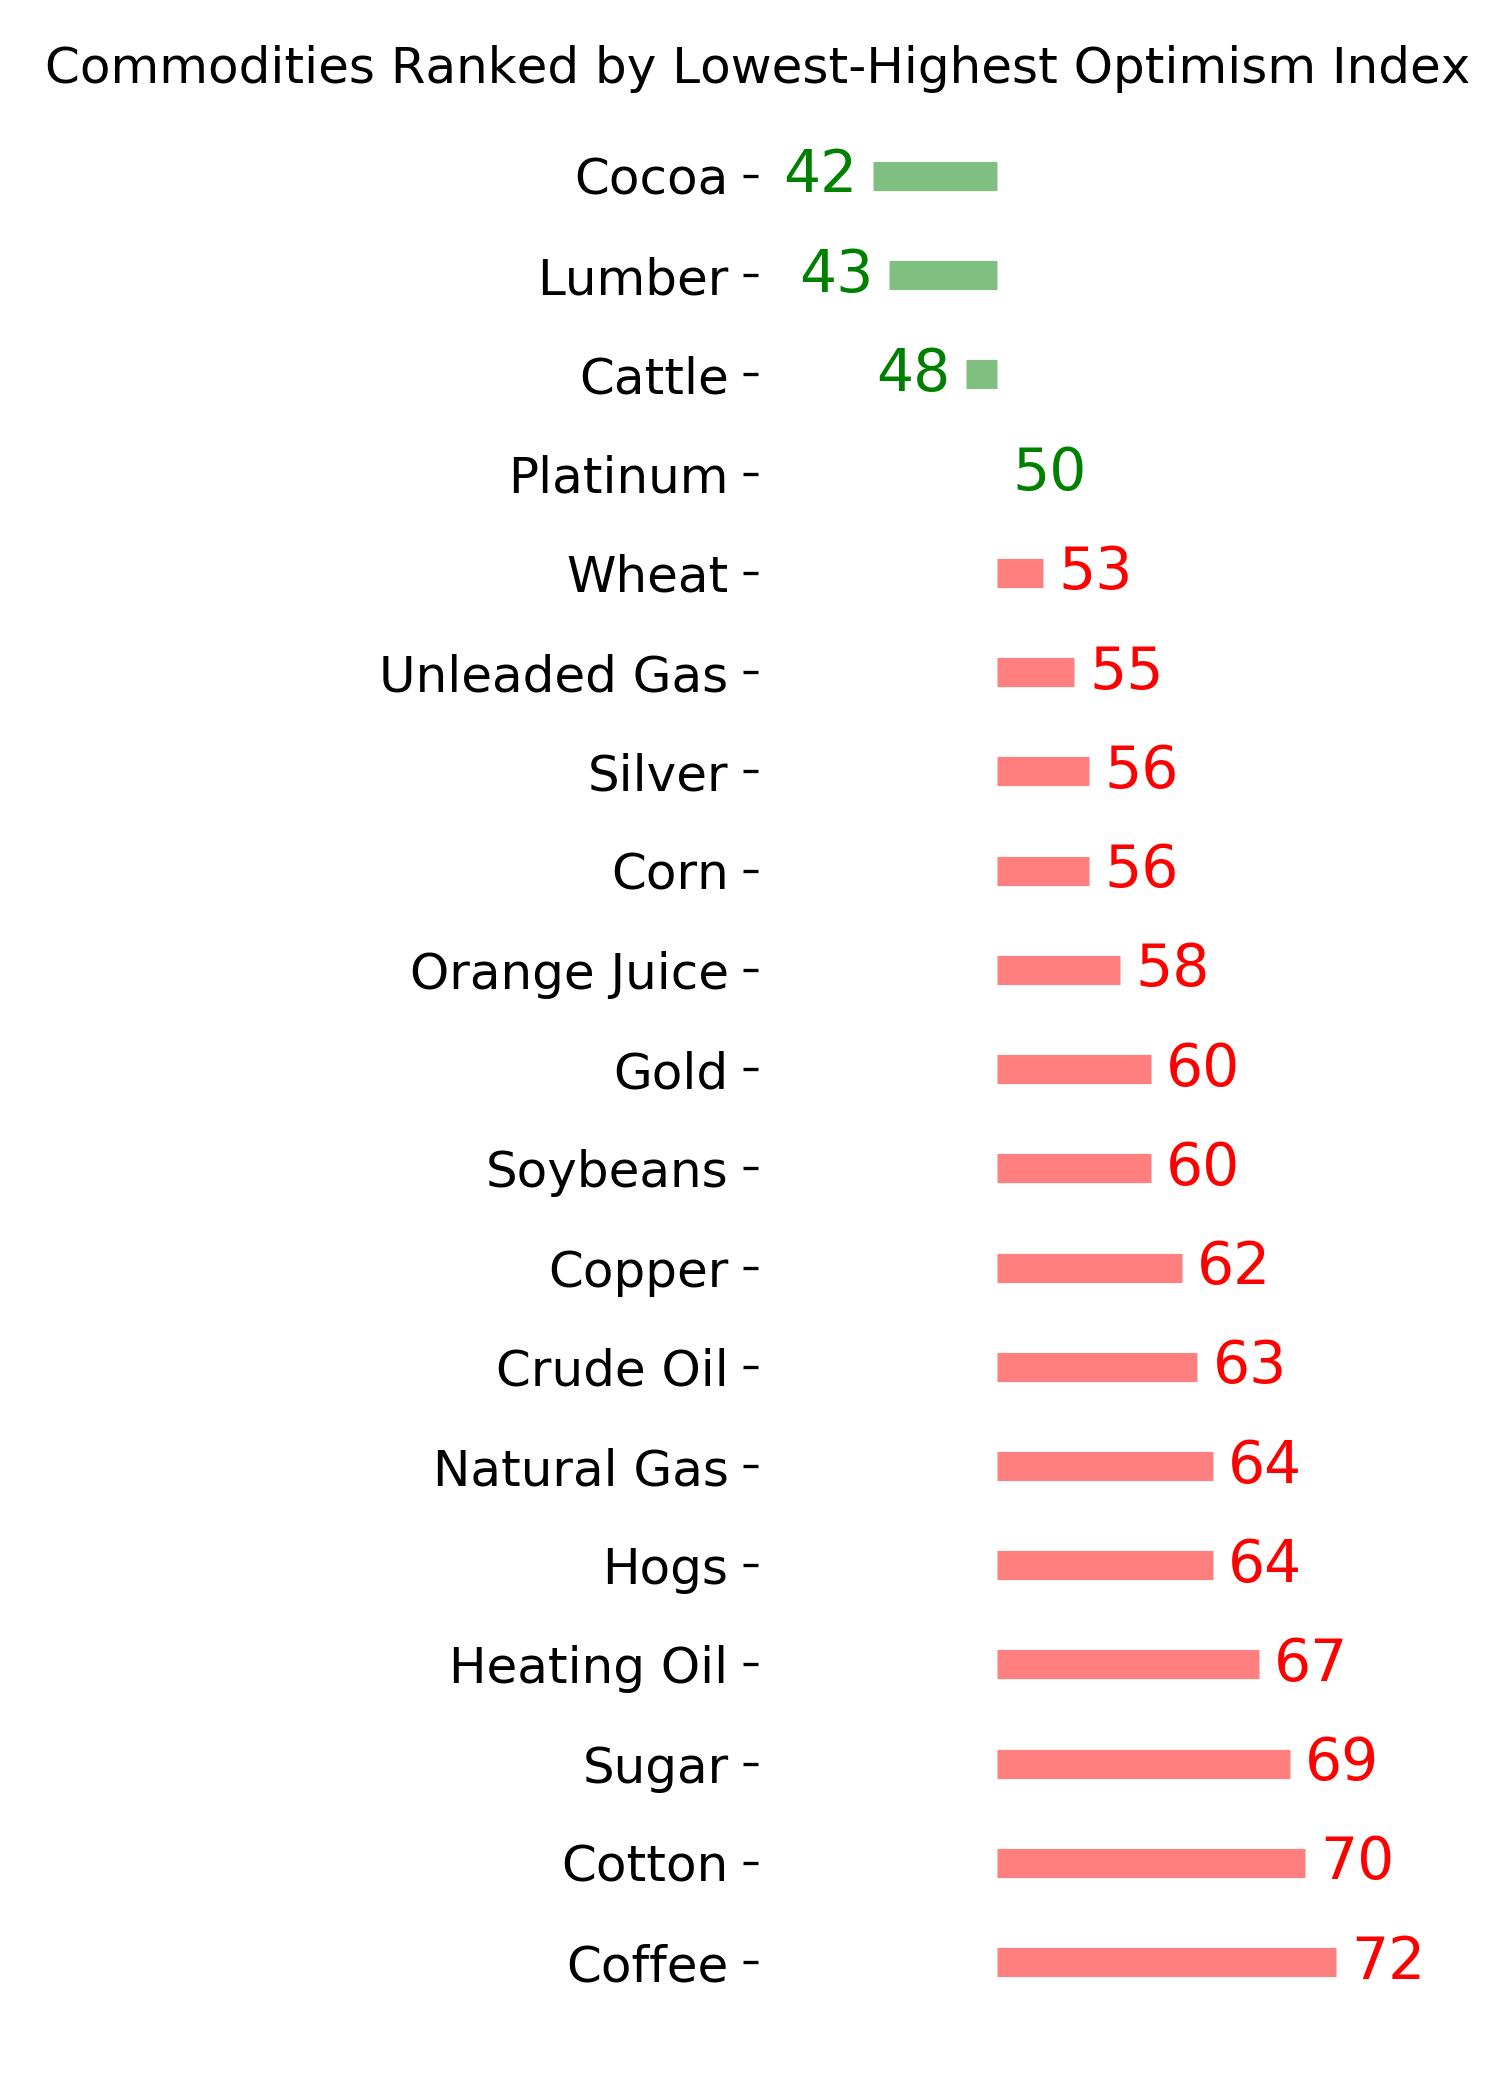
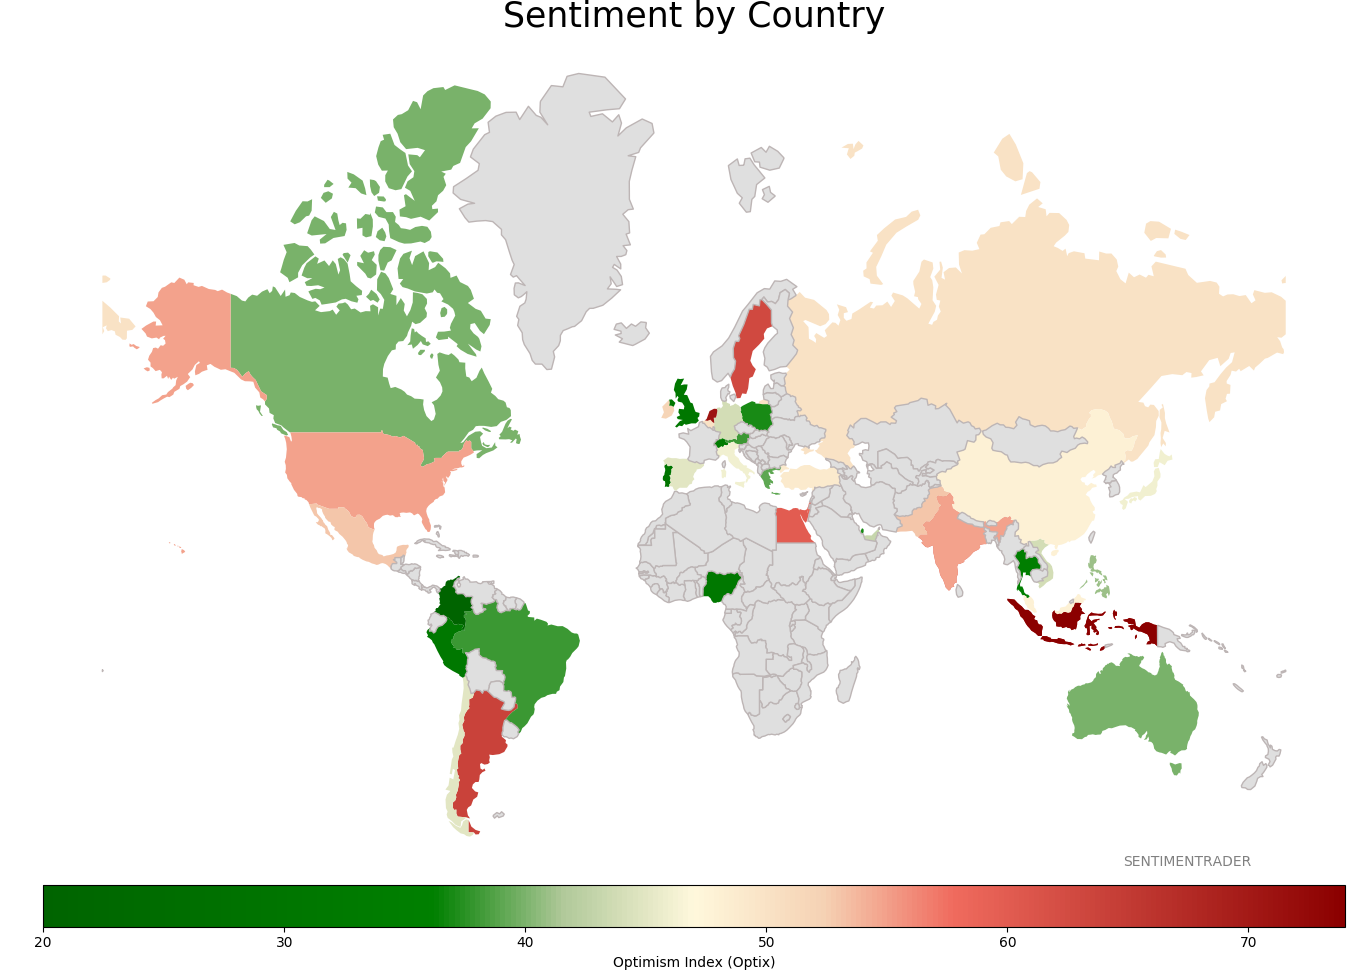
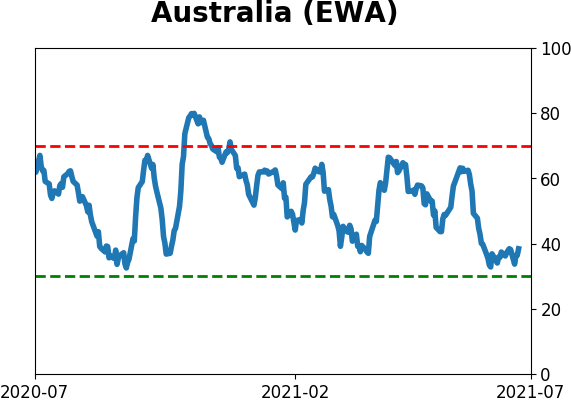
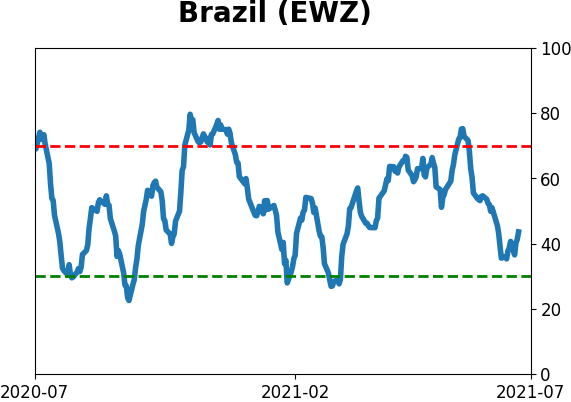
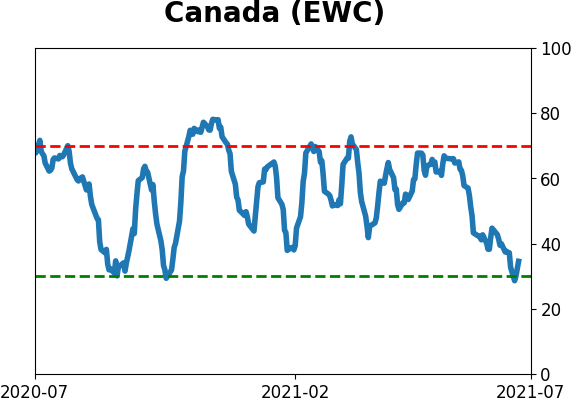
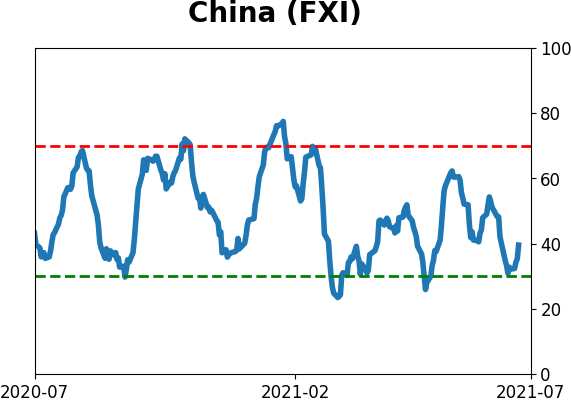
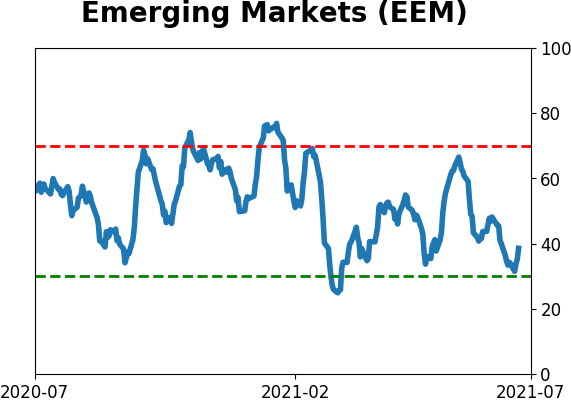
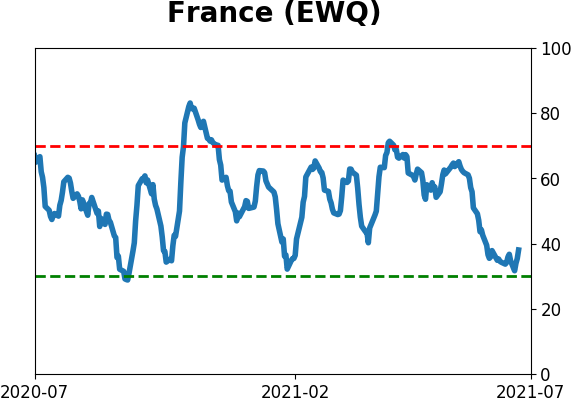
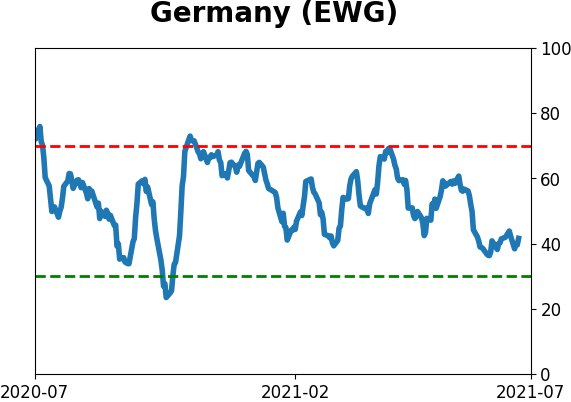
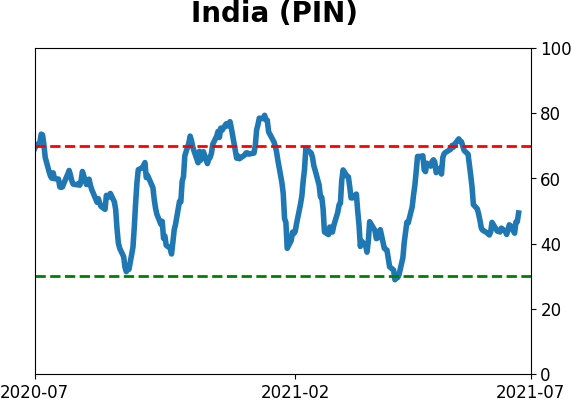
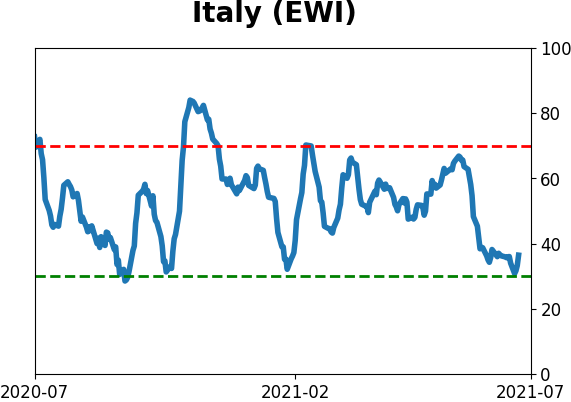
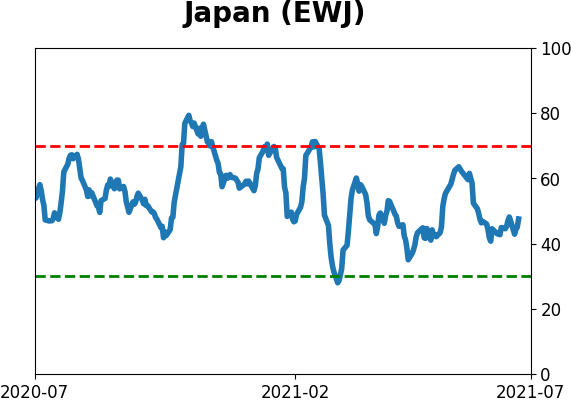
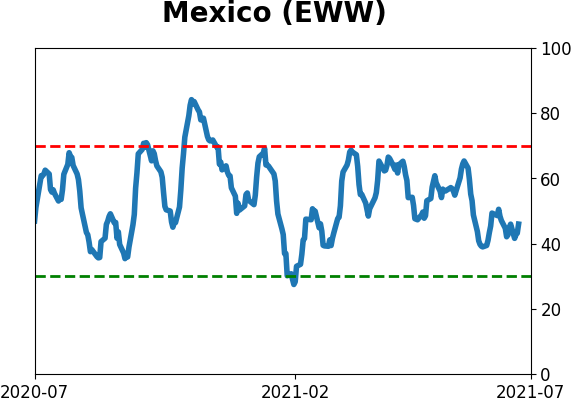
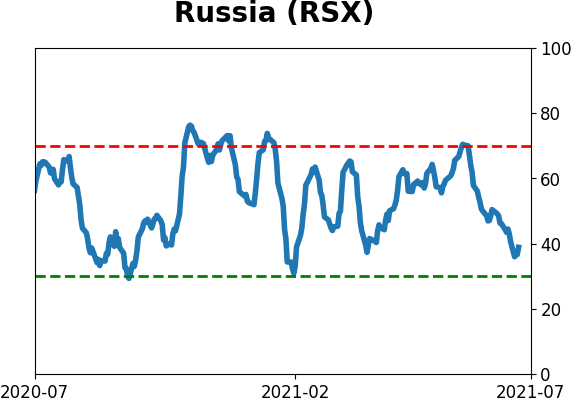
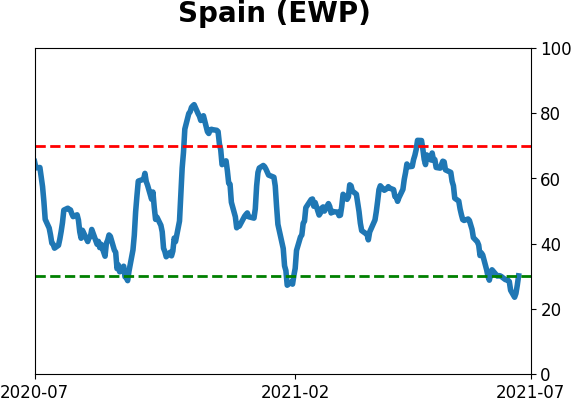
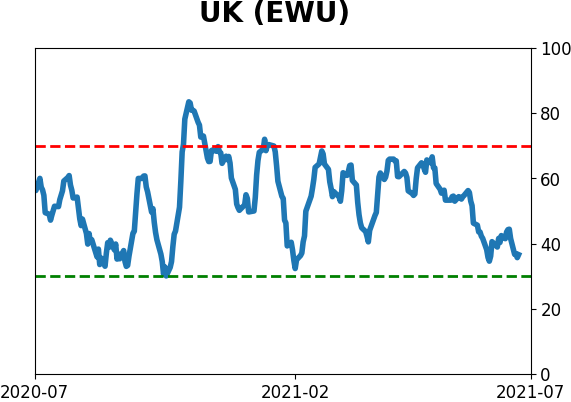
Sentiment Around The World
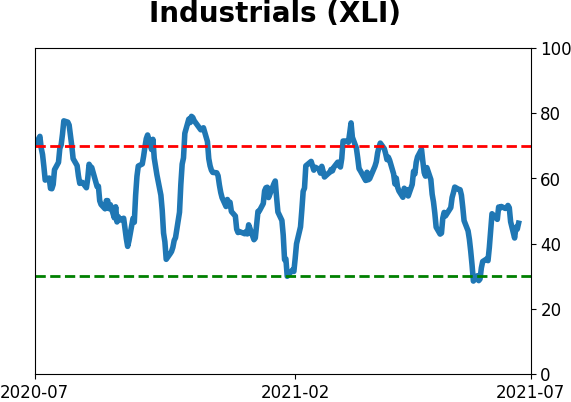
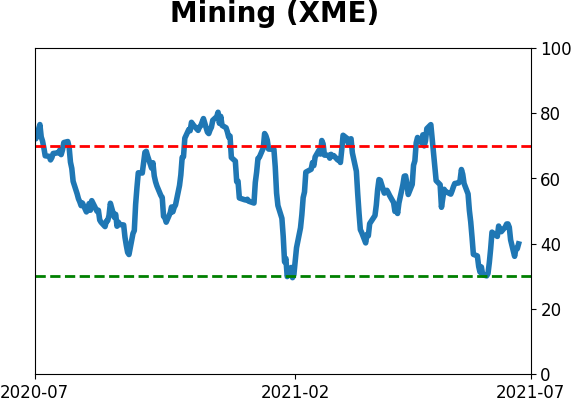
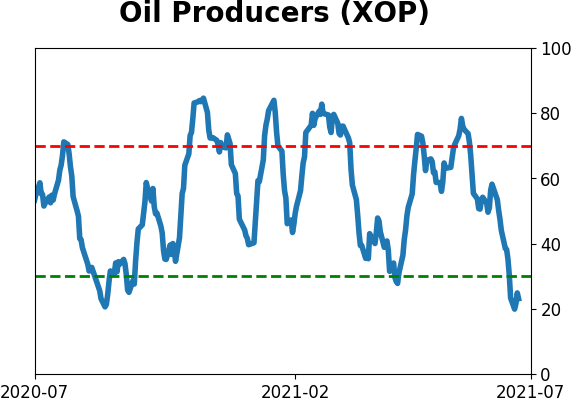
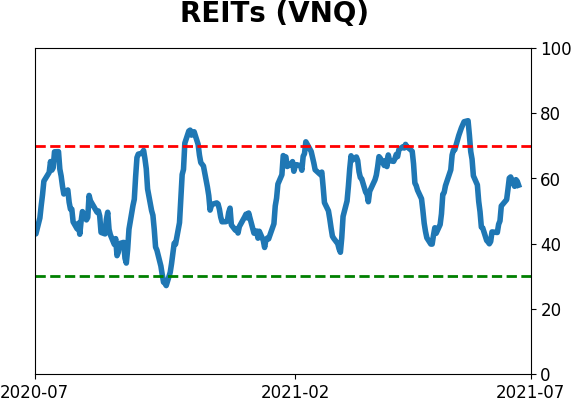
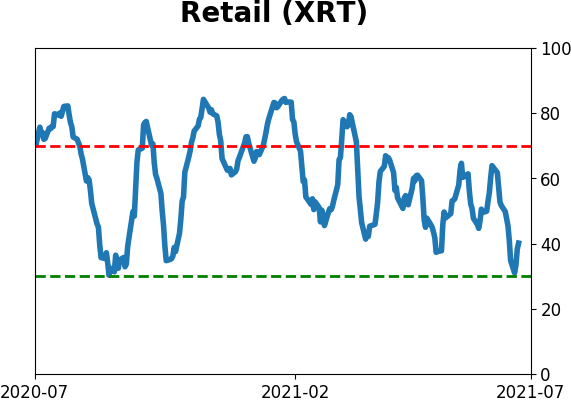
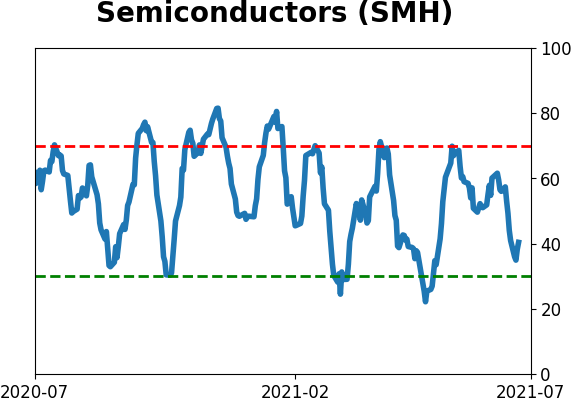
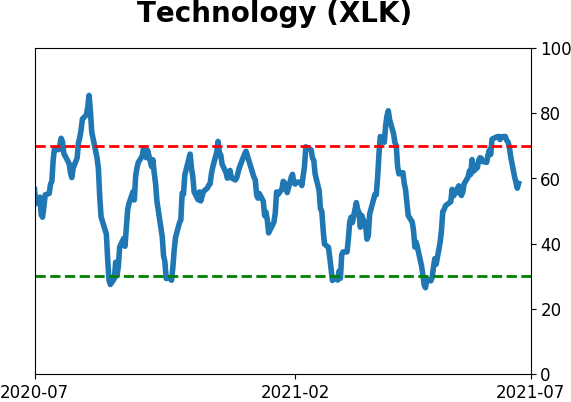
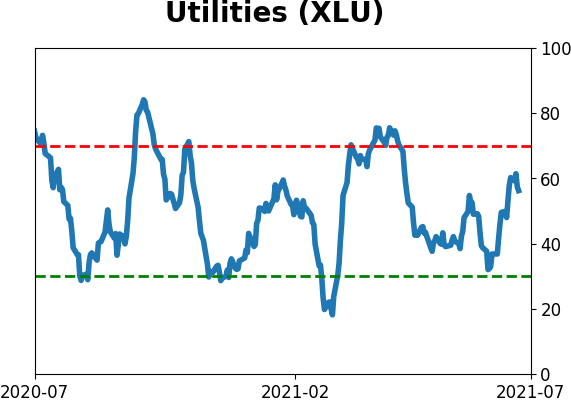
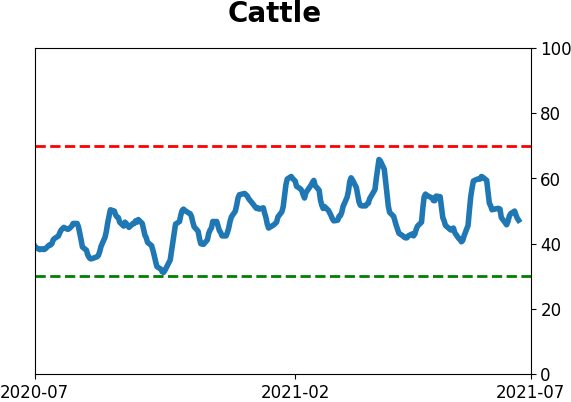
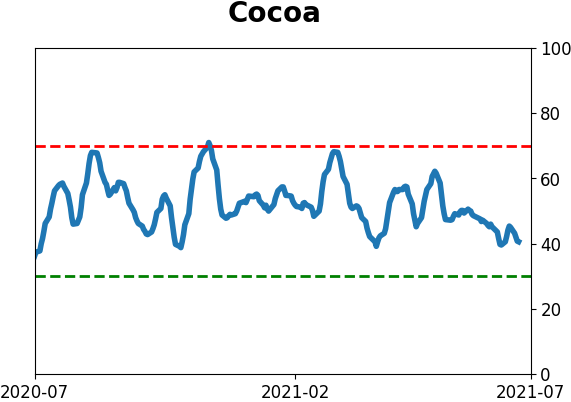
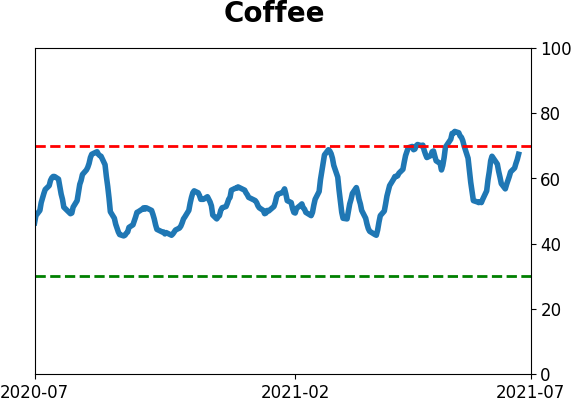
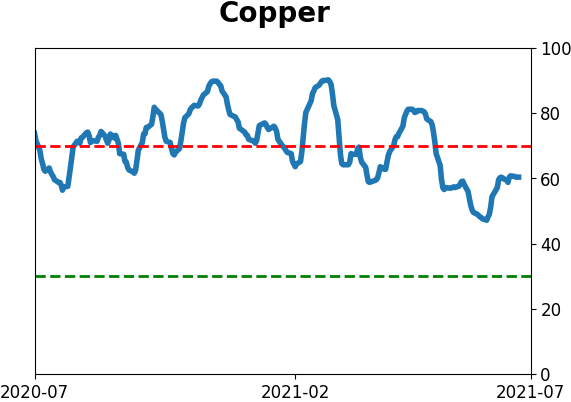
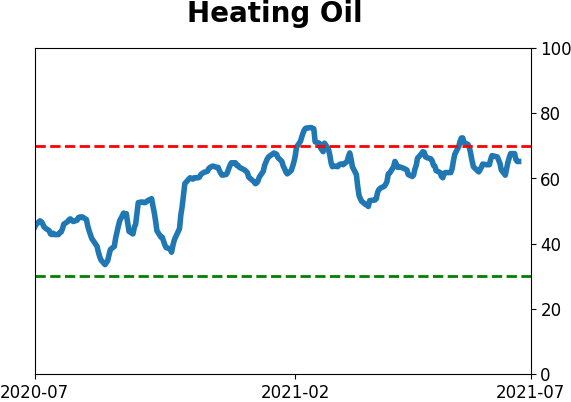
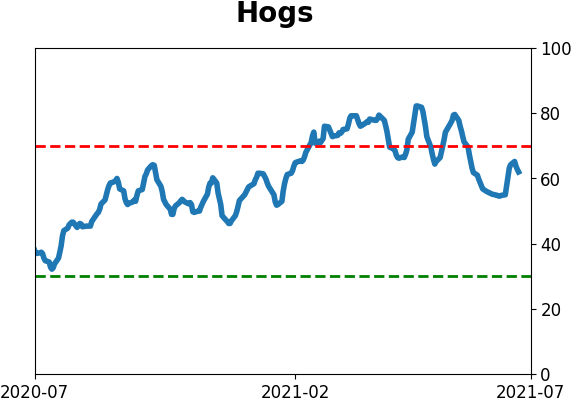
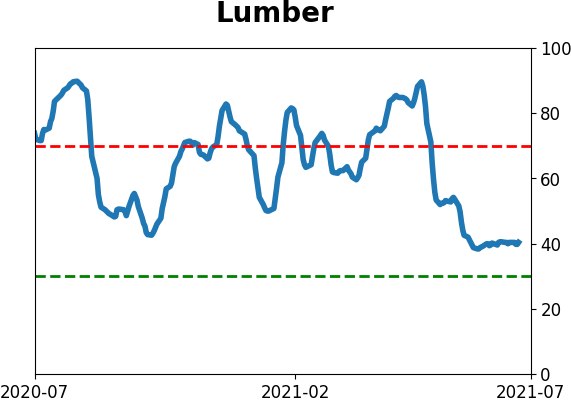
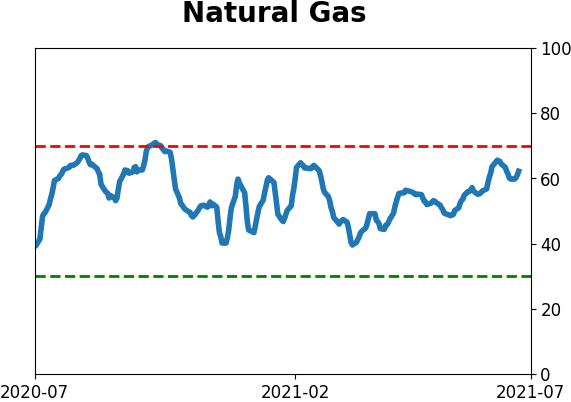
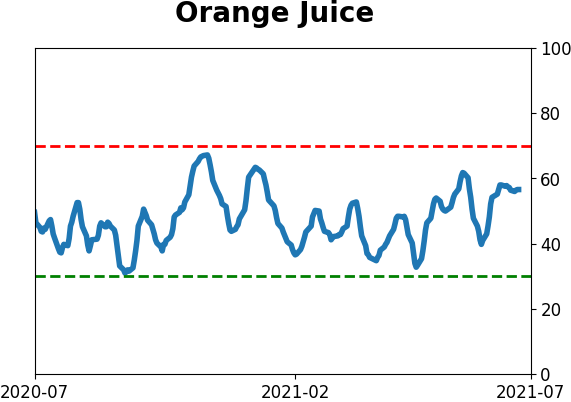
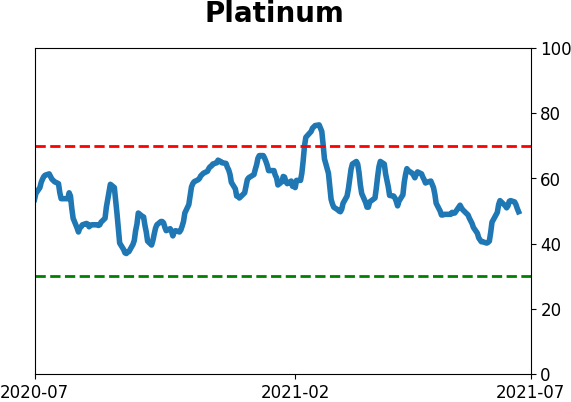
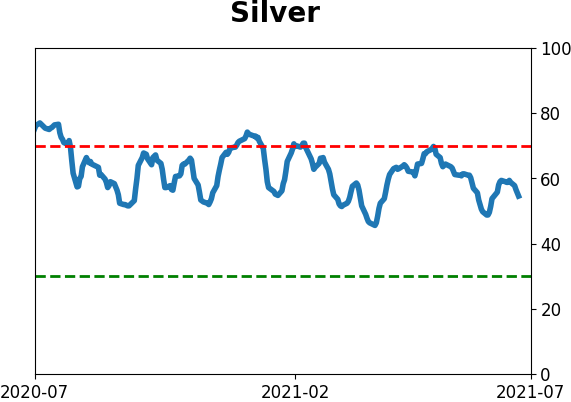
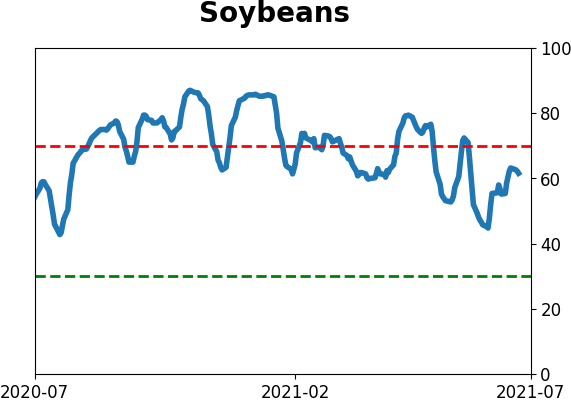
Optimism Index Thumbnails
|
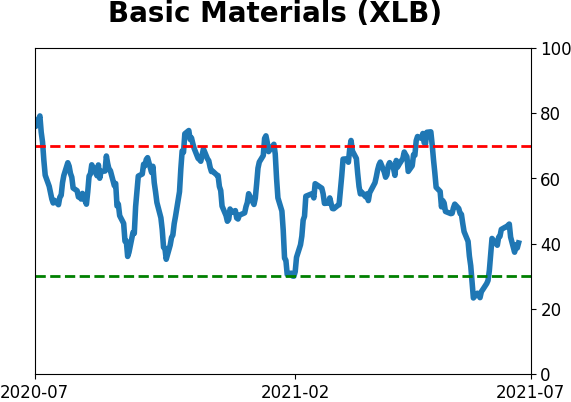
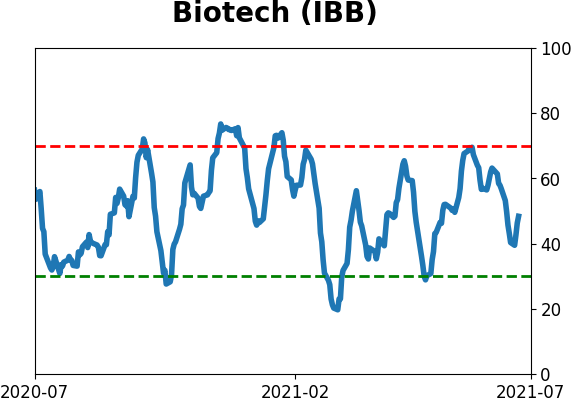
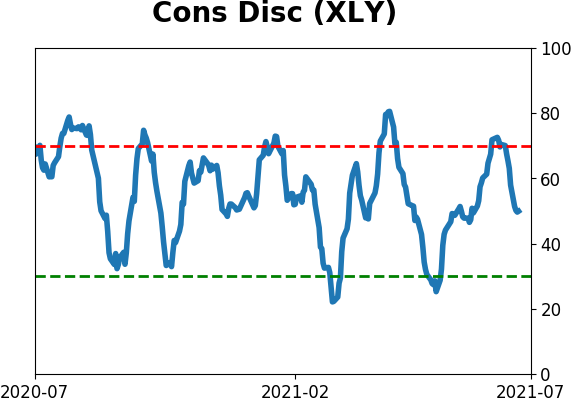
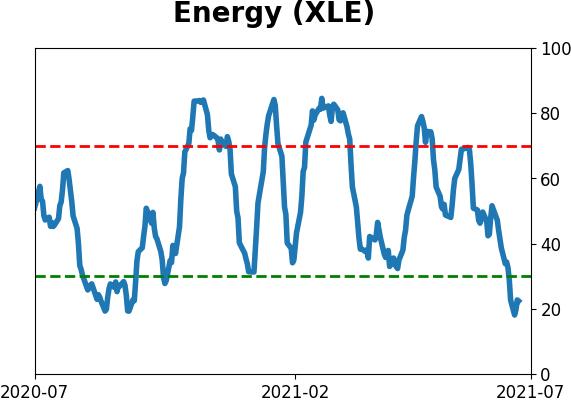
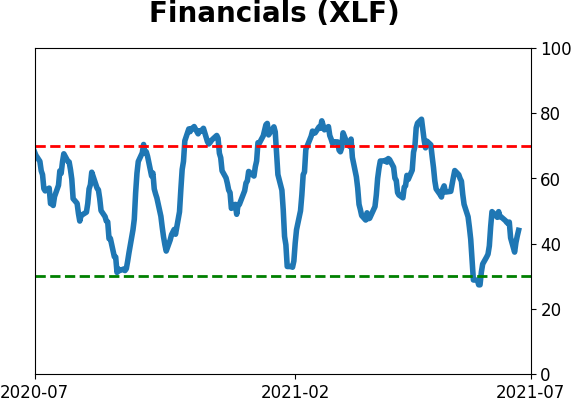
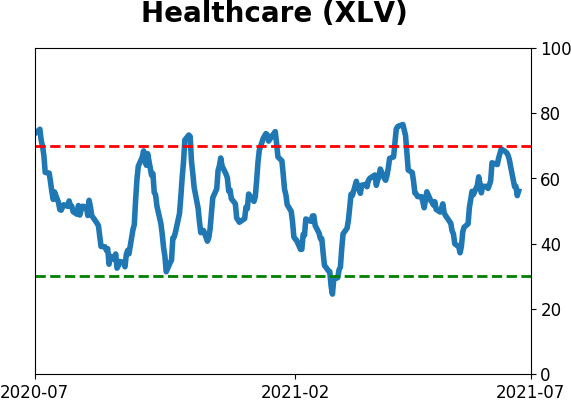
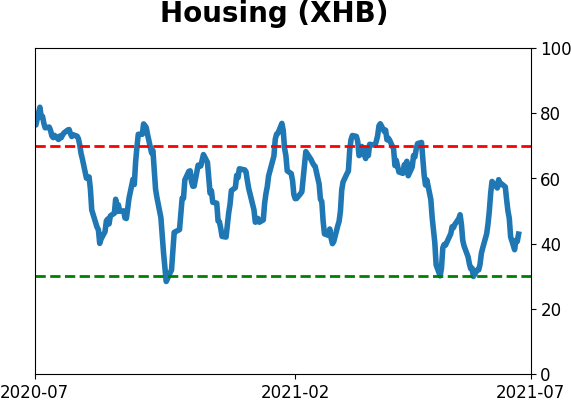
Sector ETF's - 10-Day Moving Average
|
|
|
Country ETF's - 10-Day Moving Average
|
|
|
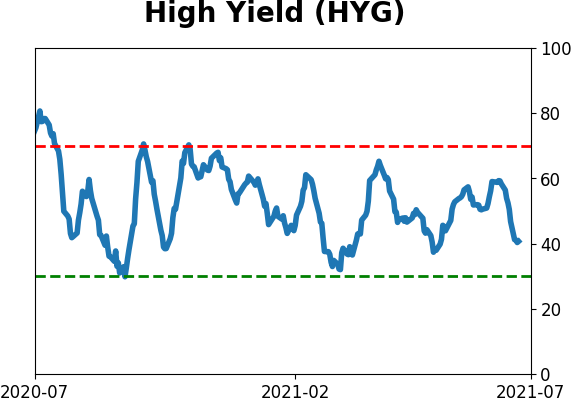
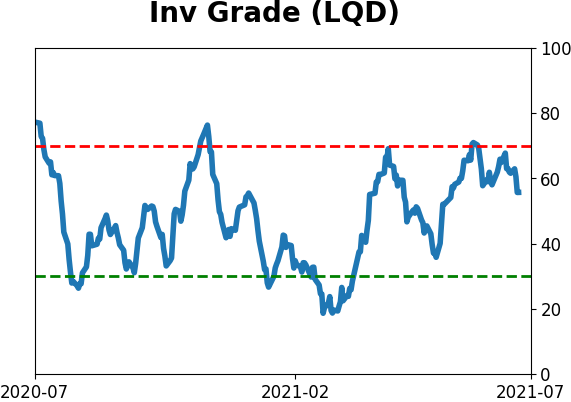
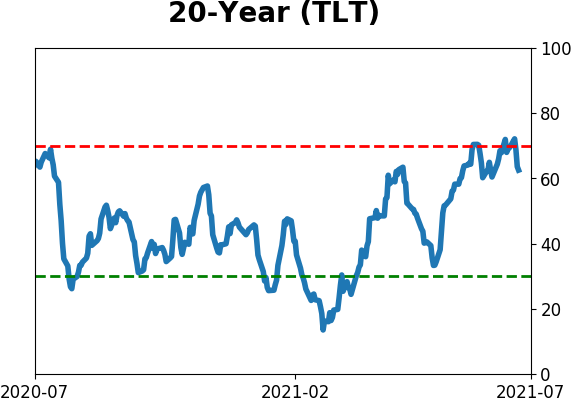
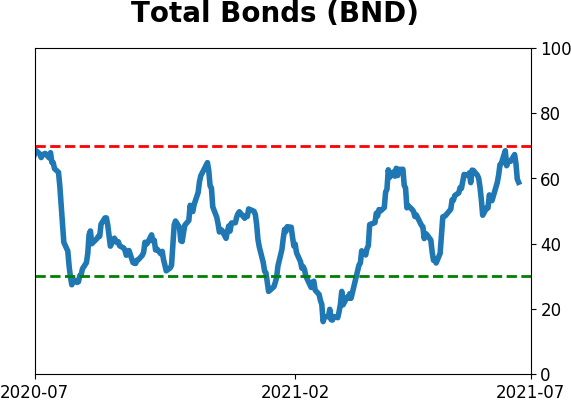
Bond ETF's - 10-Day Moving Average
|
|
|
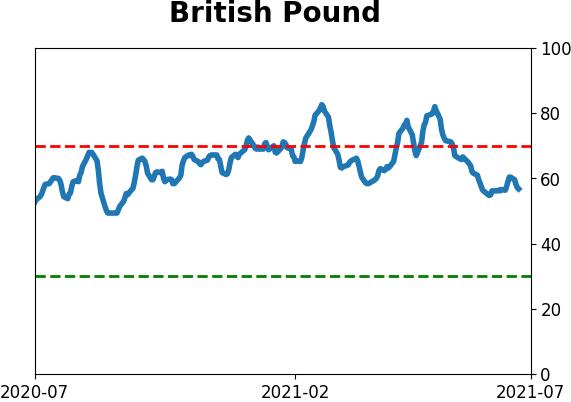
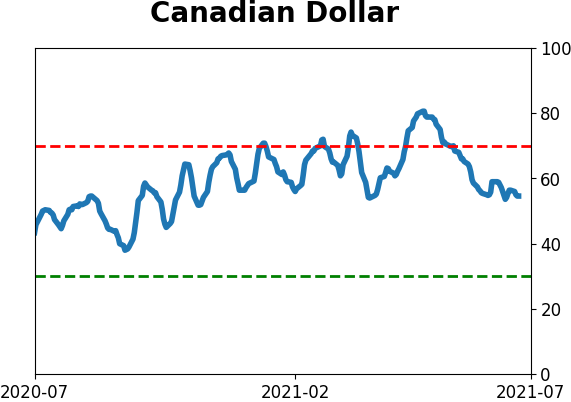
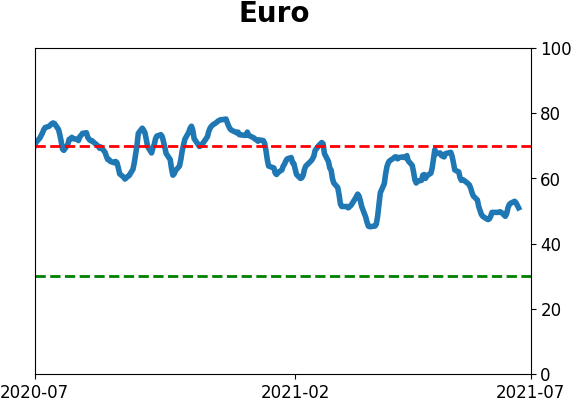
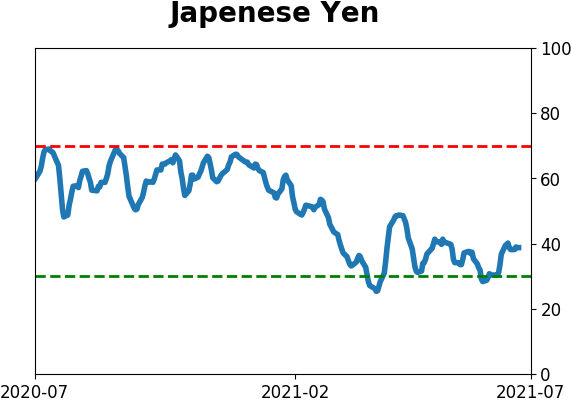
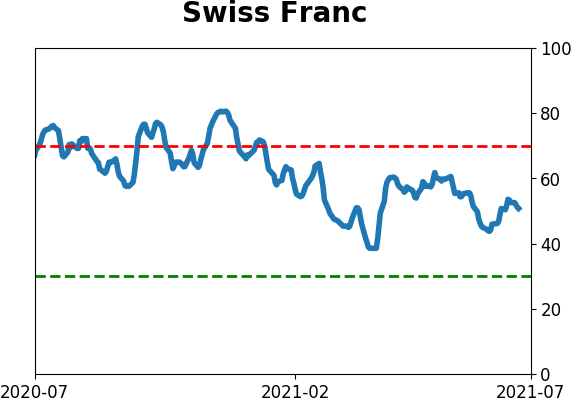
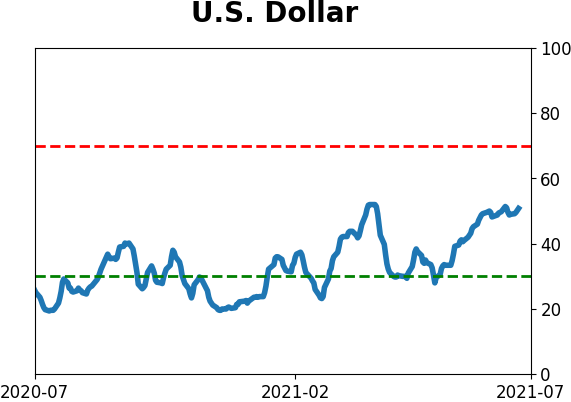
Currency ETF's - 5-Day Moving Average
|
|
|
Commodity ETF's - 5-Day Moving Average
|
|