Headlines
|
|
What it means when Dumb Money is so smart:
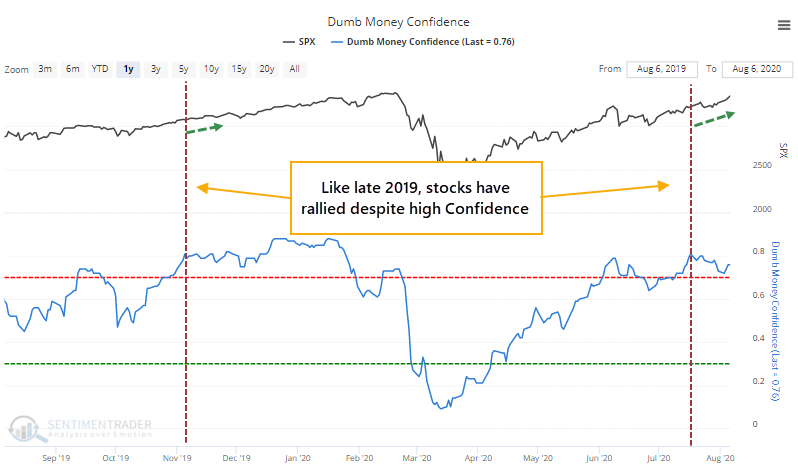
Confidence among "dumb money" indicators hit an extreme several weeks ago, and yet stocks have kept rallying. Over the past couple of weeks, our Risk Level has been high, and again stocks have rallied. We take a look at these failures and what it means when it happens to this degree.
Apple just won't quit:
Apple's market value is larger than nearly 90% of the value of the entire Russell 2000 index. Over the past 40 years, there have been only a few times when a single stock got even half this large relative to an entire index.
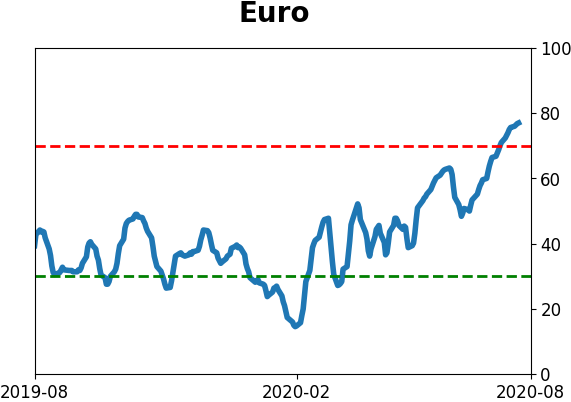
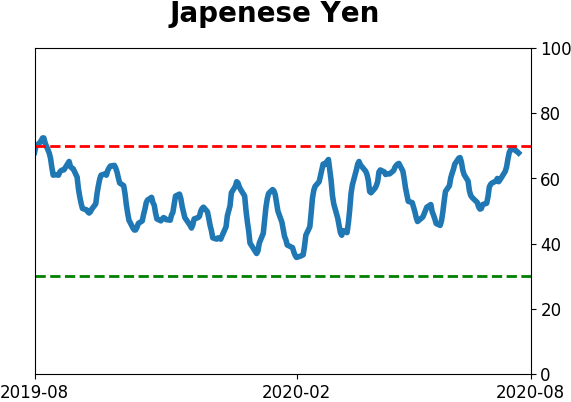
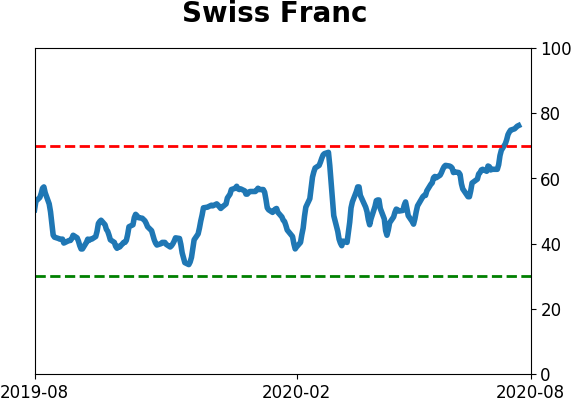
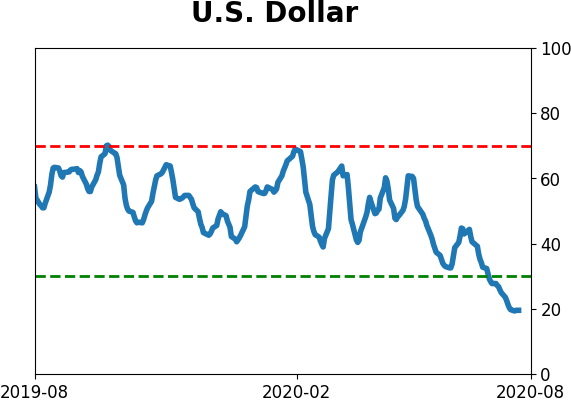
The latest Commitments of Traders report was released, covering positions through Tuesday: The 3-Year Min/Max Screen shows mostly the same extremes as last week, with "smart money" hedgers buying more U.S. dollars while selling the euro, yen, and franc. They also bought more mini S&P futures, driving their net long in major equity index futures above $30 billion. This has been extremely bullish since March, with the biggest caveat only that their behavior has diverged from how they've typically behaved over the past decade. There's no reason this is not bullish other than the simple idea that it's not how this group of traders has typically reacted. Hedgers are also still net short more than 3% of the open interest in 10-year Treasury futures. The Backtest Engine shows that over the past decade, 10-year futures rose over the next 3 months after only 6 out of 36 weeks, averaging -1.6%, when hedgers held this kind of position. It also shows that gold tended to dip, with GLD rising 33% of the time.
Only the index is stretched: In June, Troy pointed out that the Nasdaq was stretched way above its 200-day moving average despite relative few of its component stocks being above their own averages by any amount. Didn't seem to matter, and now it's the S&P 500's turn. By Thursday, it rose more than 9% above its 200-day average and yet fewer than 60% of its stocks are above their own averages. Over the past 30 years, this has happened on only four other days. For what it's worth, all four of them saw losses in the S&P between 2-4 weeks later. Those dates were 1998-07-23, 1998-11-23, 1999-12-31, and 2000-03-21.
Bottom Line:
- Weight of the evidence has been suggesting flat/lower stock prices short- to medium-term again; still suggesting higher prices long-term
- Indicators show high optimism, with Dumb Money Confidence recently above 80% with signs of reckless speculation during what appears to be an unhealthy market environment, historically a bad combination
- Active Studies show a heavy positive skew over the medium- to long-term; breadth thrusts, recoveries, and trend changes have an almost unblemished record at preceding higher prices over a 6-12 month time frame
- Signs of extremely skewed preference for tech stocks neared exhaustion by late June, especially relative to industrials and financials (here and here)
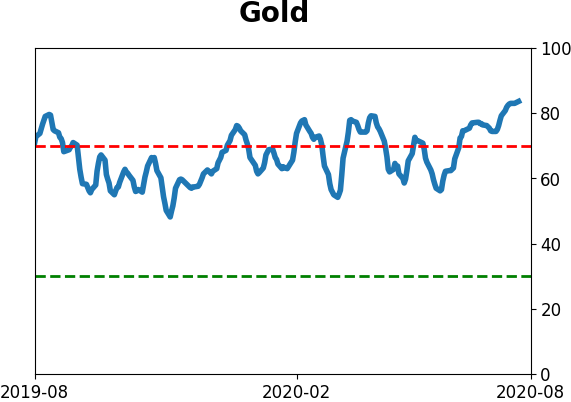
- Indicators and studies for other markets are showing less consistent forward results, though it's not a great sign for Treasuries that hedgers are net short and optimism on metals has become extreme, with "perfect" breadth among miners
|
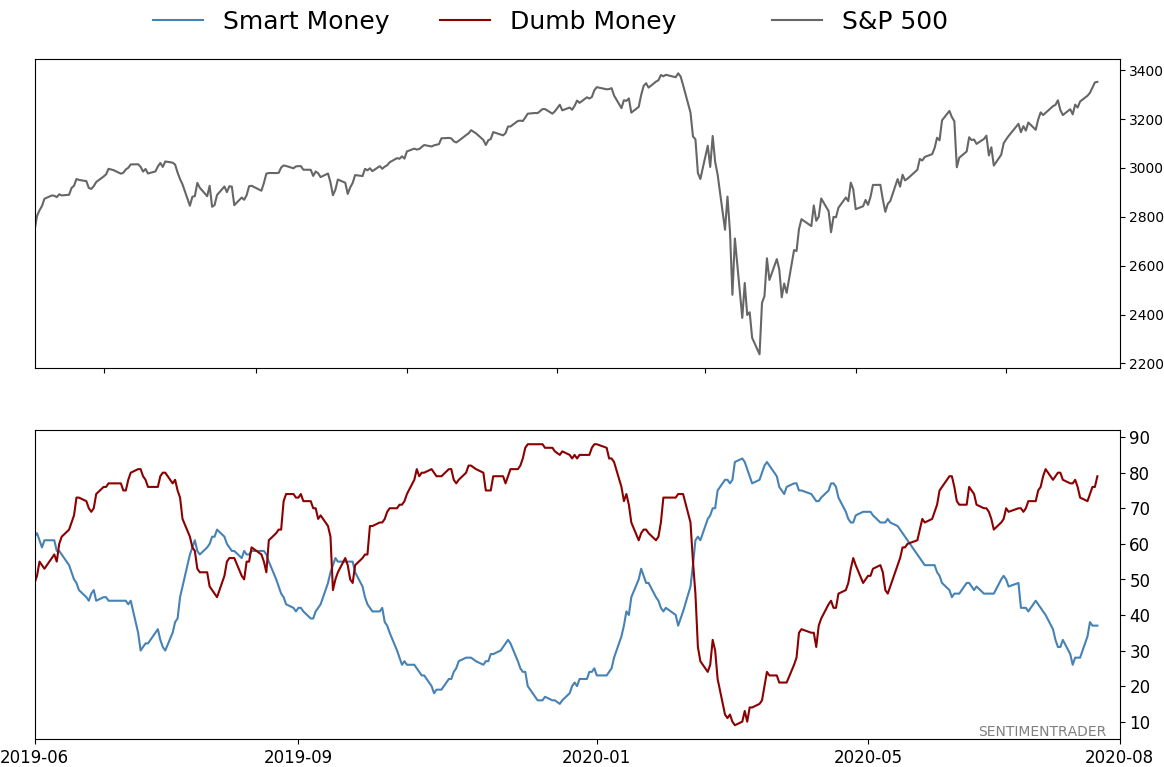
Smart / Dumb Money Confidence
|
Smart Money Confidence: 37%
Dumb Money Confidence: 79%
|
|
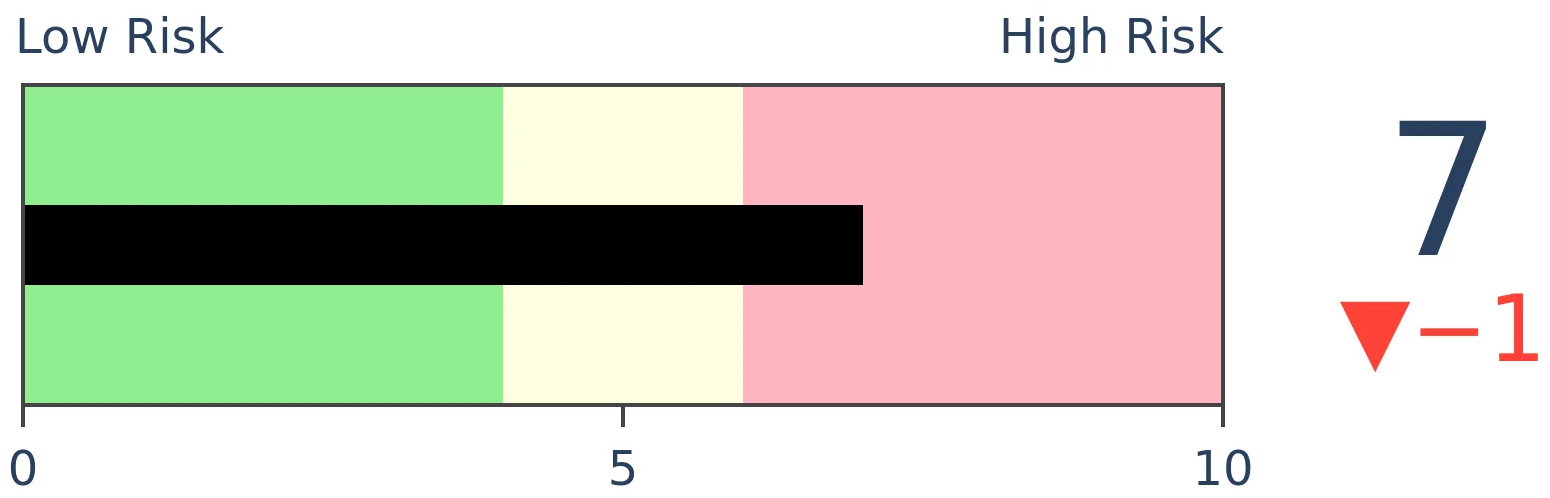
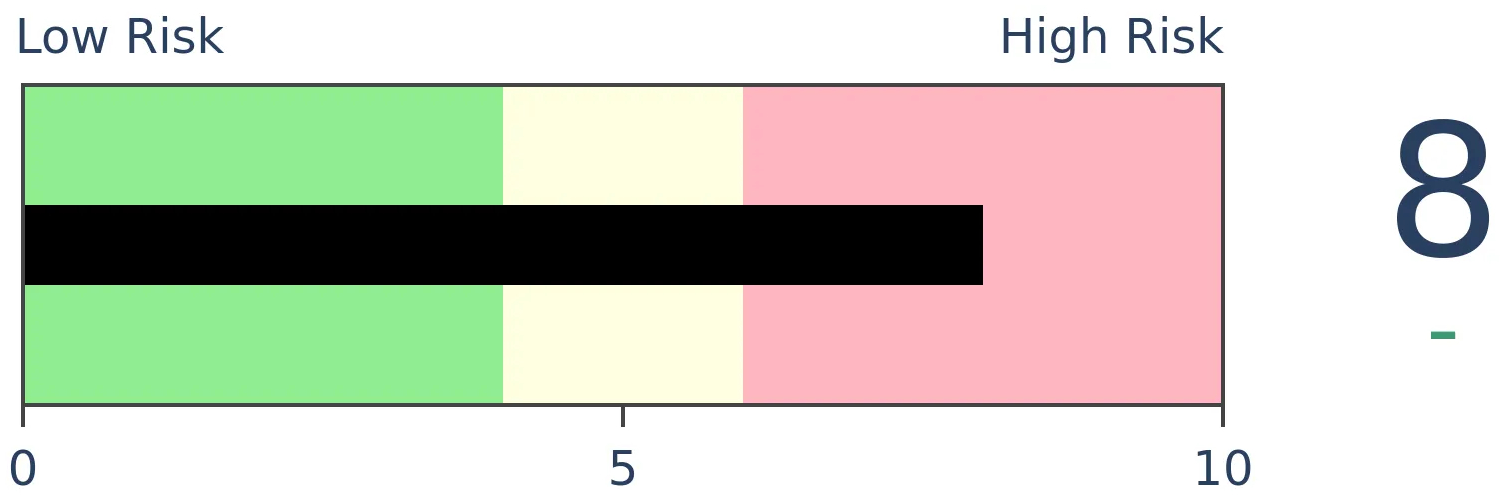
Risk Levels
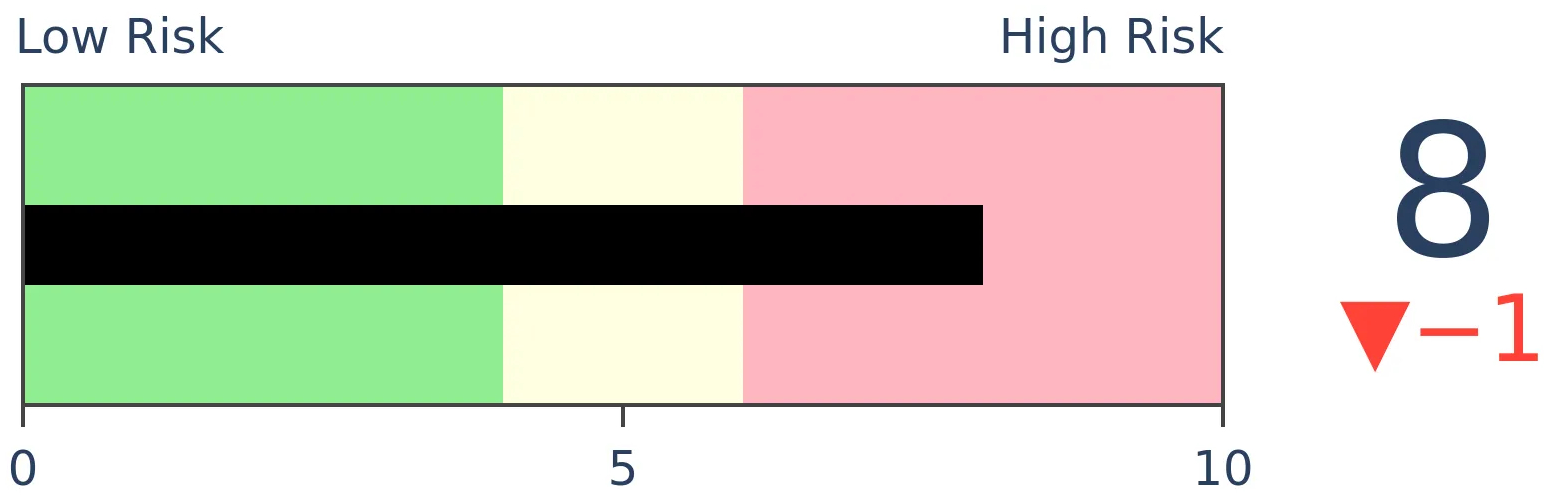
Stocks Short-Term
|
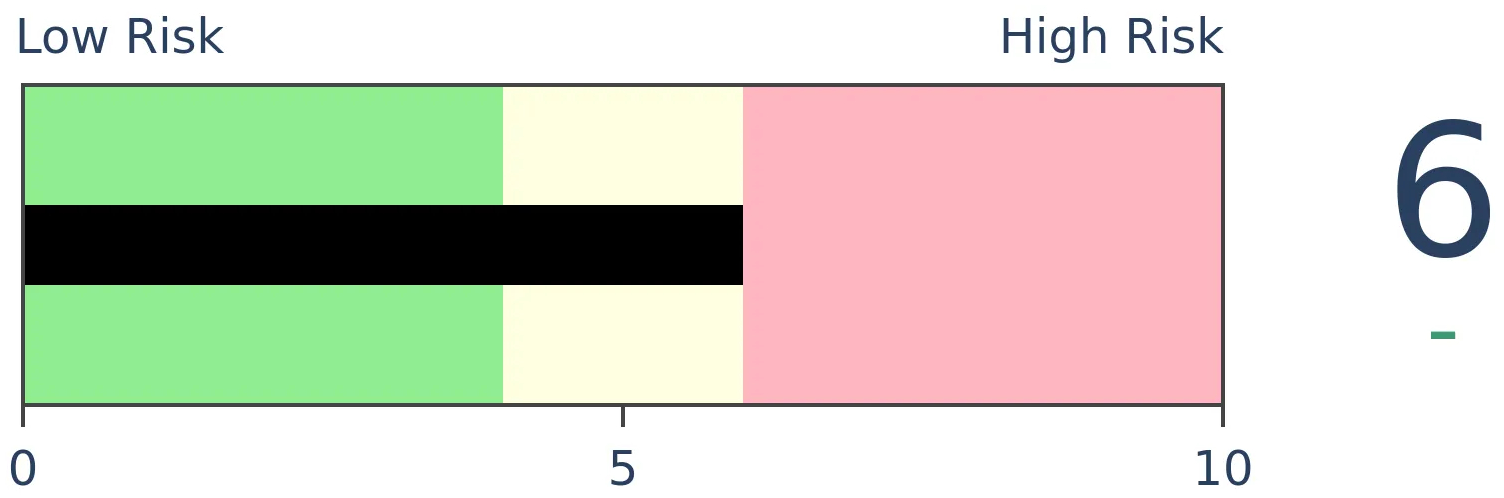
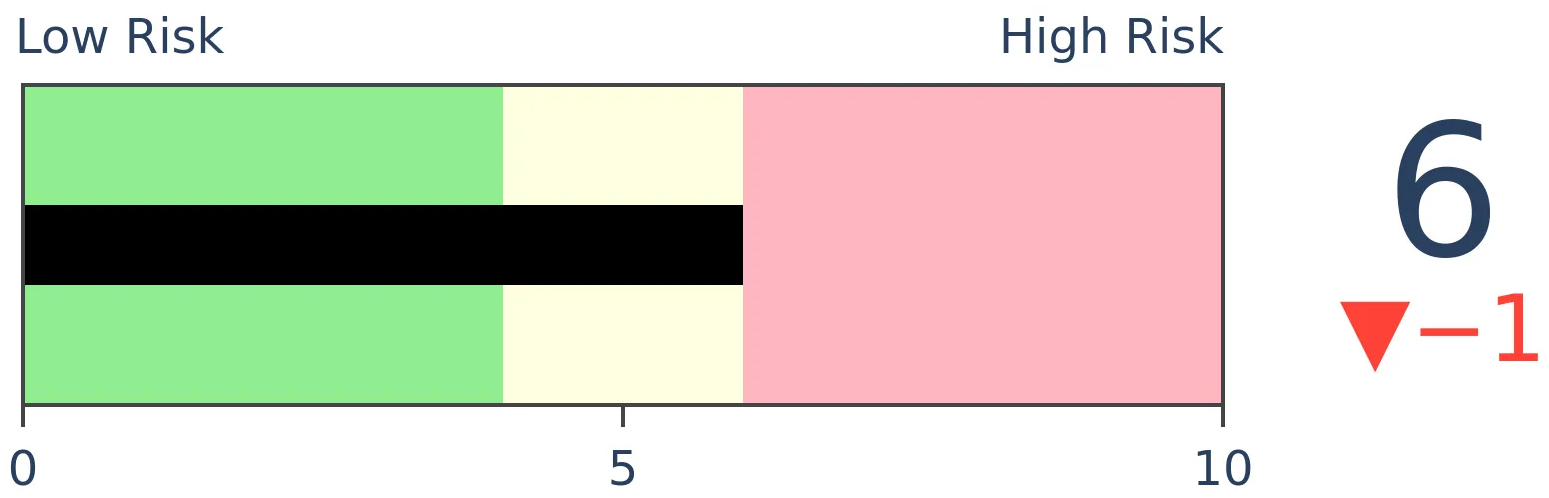
Stocks Medium-Term
|
|
Bonds
|
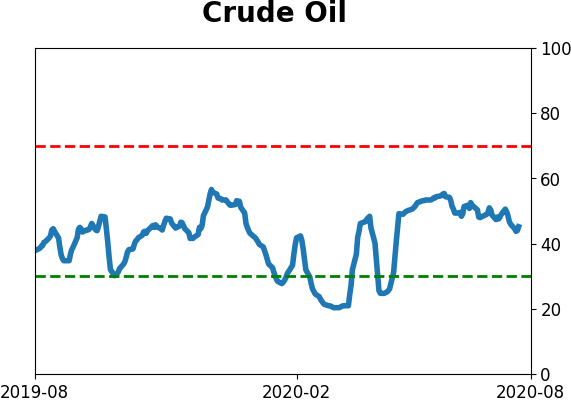
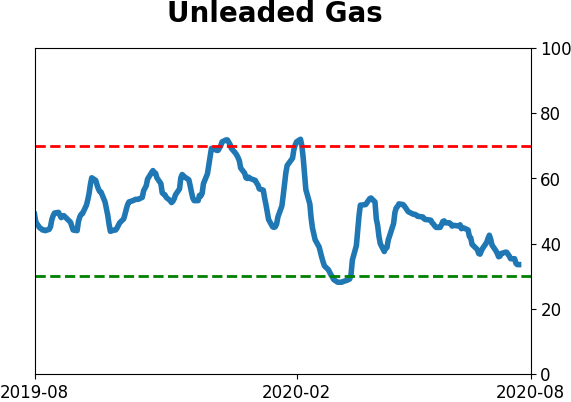
Crude Oil
|
|
Gold
|
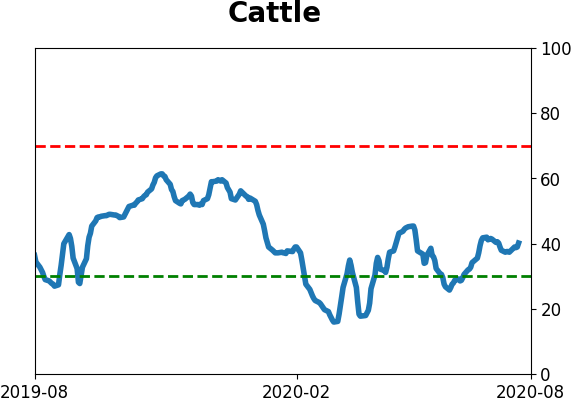
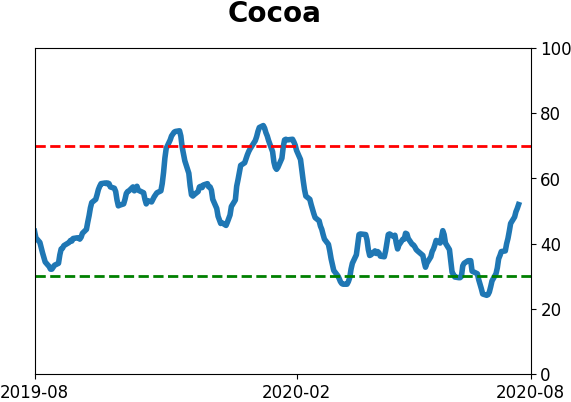
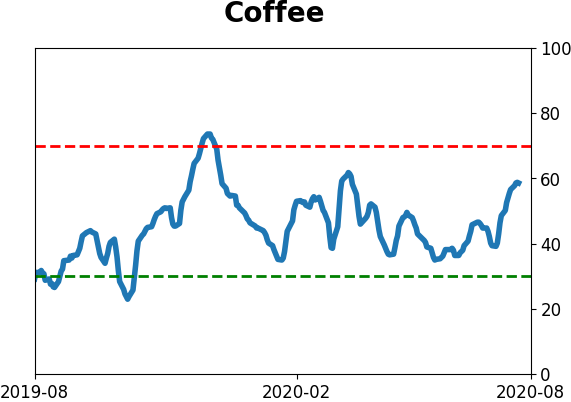
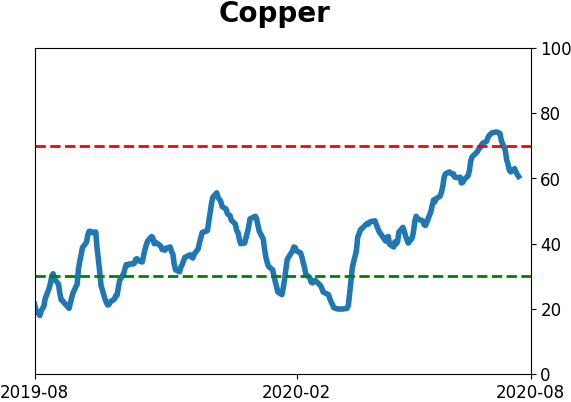
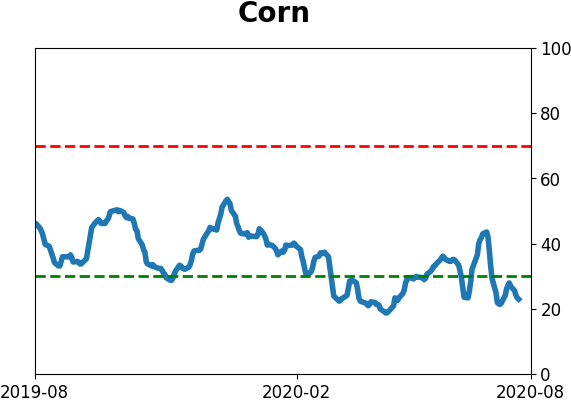
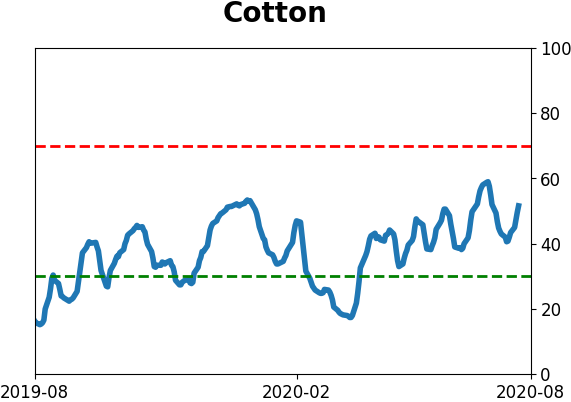
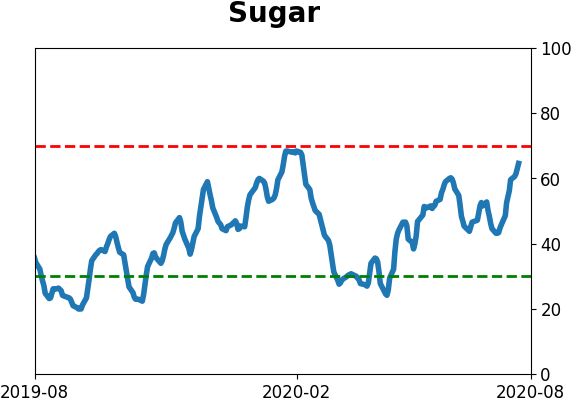
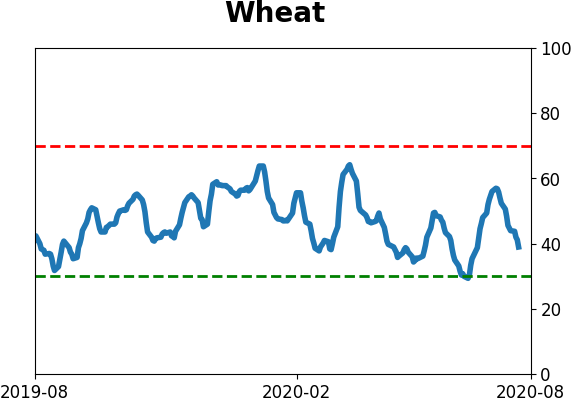
Agriculture

|
|
Research
BOTTOM LINE
Confidence among "dumb money" indicators hit an extreme several weeks ago, and yet stocks have kept rallying. Over the past couple of weeks, our Risk Level has been high, and again stocks have rallied. We take a look at these failures and what it means when it happens to this degree.
FORECAST / TIMEFRAME
None
|
The "dumb money" has been right, and they're not shy about letting everyone know about it.
It's a pejorative term, for sure, though we don't mean it that way. It's just shorthand for those investors who use a trend-following strategy. That can be perfectly valid, and they tend to be successful in riding the meat of a trend. Nothing wrong about that whatsoever. The issue arises when they become so confident that they establish their largest long positions AFTER markets have rallied hard, and their smallest after markets have declined.
Only because they tend to be their most exposed near market peaks and least near bottoms, is why they're classified as "dumb money."
The indicators we follow that track these investors reached a true extreme a few weeks ago. Future returns tend to be poor after these traders get this confident, with a very poor risk/reward skew. And yet, three weeks after Dumb Money Confidence hit 80%, the S&P 500 has rallied more than 3.9% while suffering a loss of only -0.3% on a closing basis. This is similar to late 2019.
Historically, future returns were decent after high Dumb Money Confidence failed to see much weakness over the next three weeks.
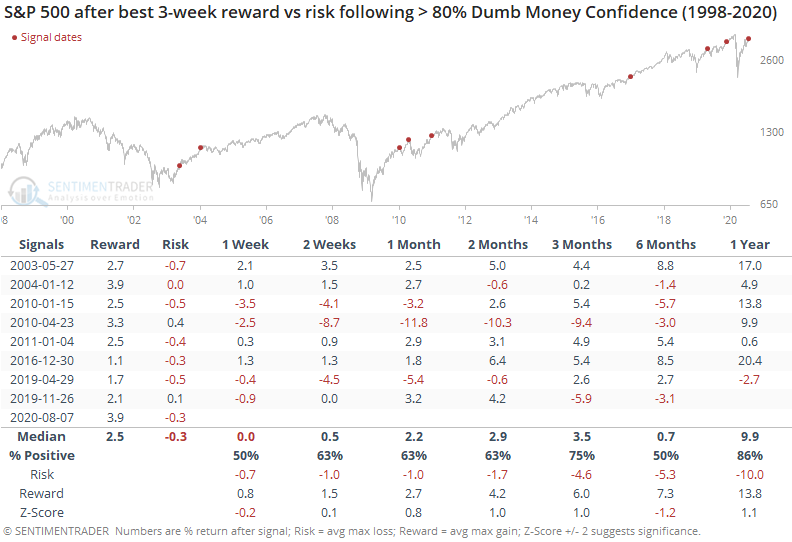
This wasn't an excuse to abandon all caution, though. Between 1-3 months later, three times the S&P showed no losses, while five times it suffered a loss on one of those time frames. Six months later, the S&P's median return was well below random.
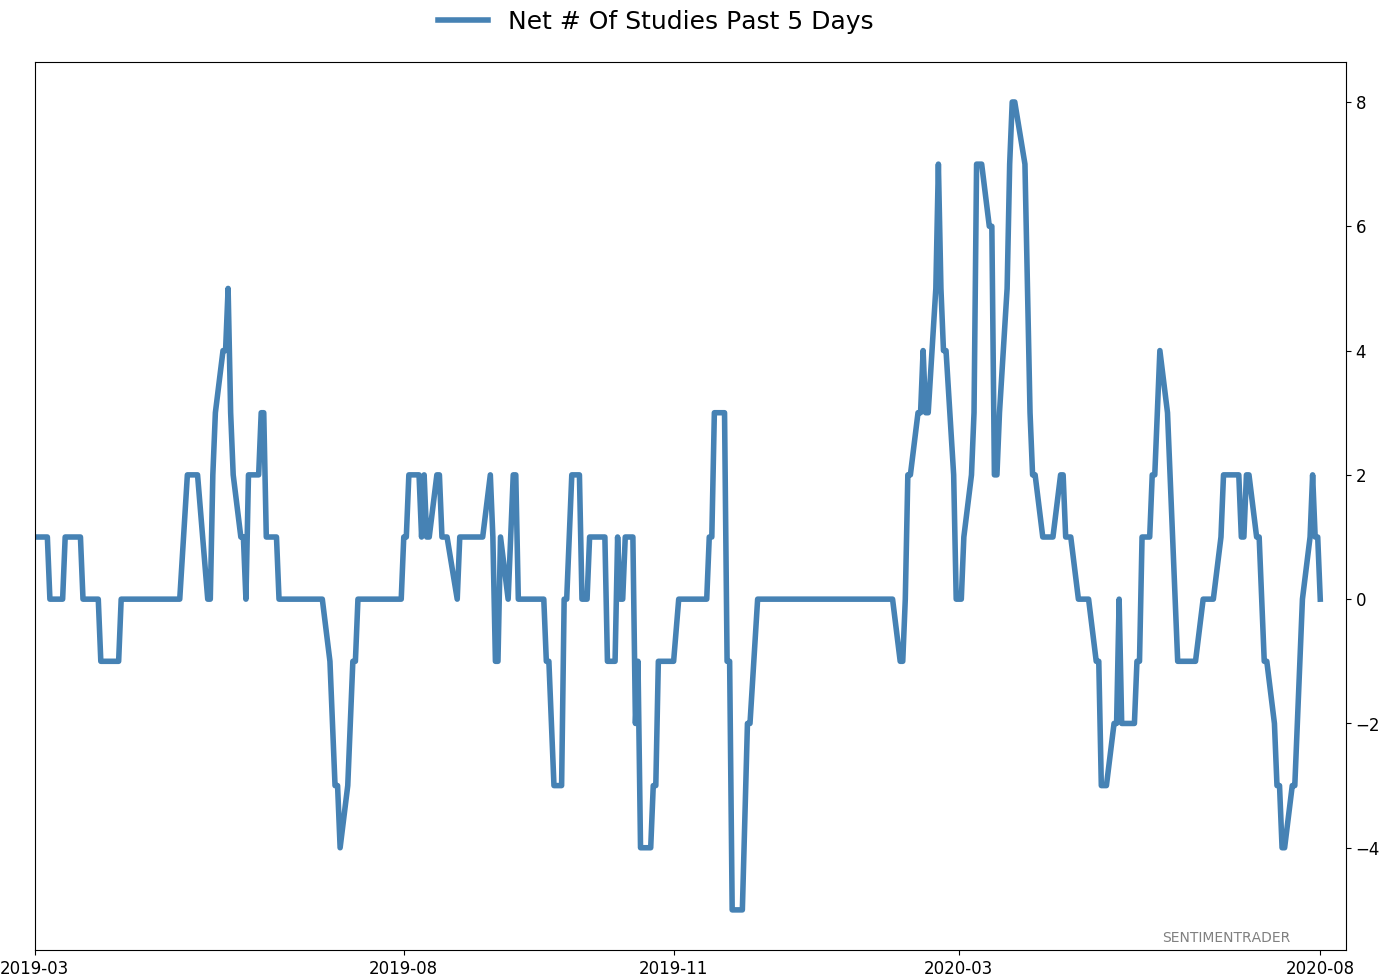
Because optimism has been high, and some of our studies have had a negative tilt, the Risk Level has been elevated.
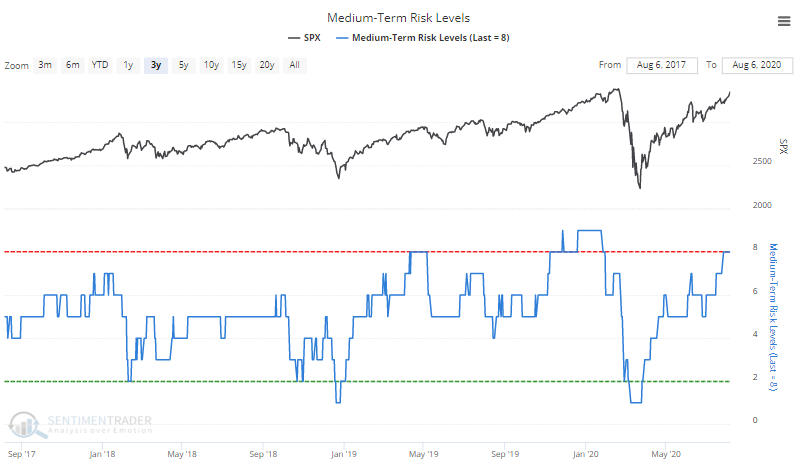
It's been at 8 since July 27, and yet stocks have continued to rally, so it failed to lead to immediate weakness.
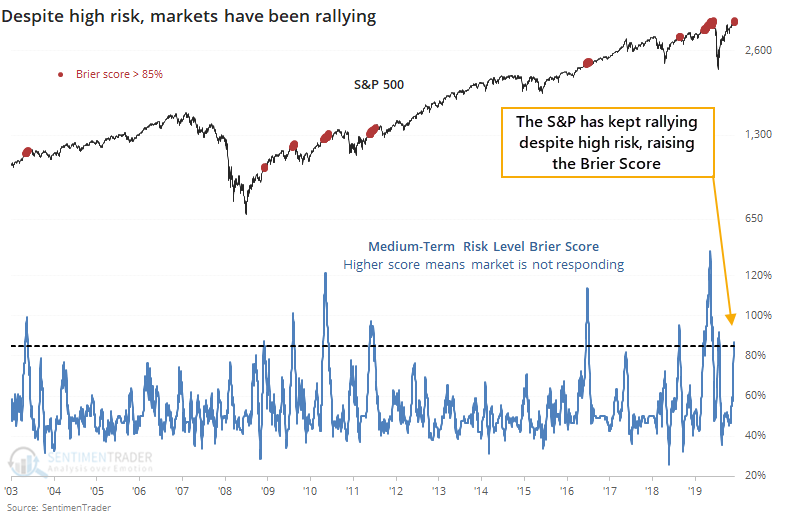
There is a way to quantify failure called the Brier Score. It looks at predictions versus outcomes, with a higher Score meaning worse predictions.
We looked at this when our risk level seemed to be failing in February 2017 and again in December 2019. The conclusion is usually that by the time markets have levitated beyond the typical and people begin doubting the indicators, sentiment has shifted so far that it can't be sustained.
In recent days, the Brier Score for the Risk Level has moved above 85%, meaning that it has failed to lead to the predicted outcomes. It's not as high as some previous spikes but is rapidly getting there.
When stocks have rallied despite high risk to this kind of degree, they did have a tendency to see some shorter-term follow-through, with a continued emphasis on low risk and high reward.
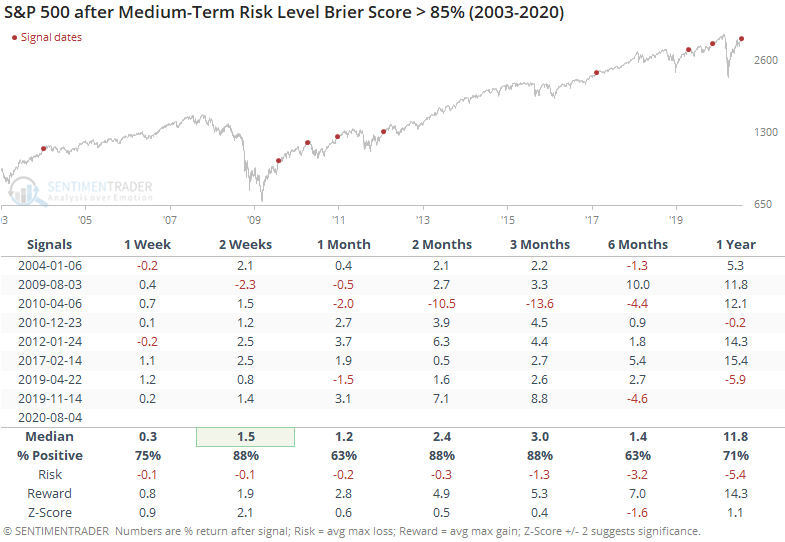
This is one of those times when stats don't really give the full picture. Simply eyeballing the chart shows us that except for August 2009 (recovery from the financial crisis) and February 2017 (one of the "creepiest" uptrends in market history), at some point the S&P gave back its gains, if only temporarily.
We spend a lot of time looking at failures in our indicators and models. It's not navel-gazing or some kind of sick obsession with self-flagellation. But instead of pretending that they don't exist and everything is perfect, looking at failures can give excellent clues as to whether the market environment has changed.
Maybe it has. Like 2009, we're recovering from a massive dislocation with even more massive breadth thrusts, recoveries, and trend changes. Longer-term, like 6-12 months, these have strongly suggested higher prices since they triggered from March through May. Shorter-term, on a multi-week to multi-month time frame, there have been many more warnings, and those have failed. Based on the evidence, these failures don't mean none of this works anymore, only that the consequences may be delayed. It would be extremely rare for there to be no consequences at all.
BOTTOM LINE
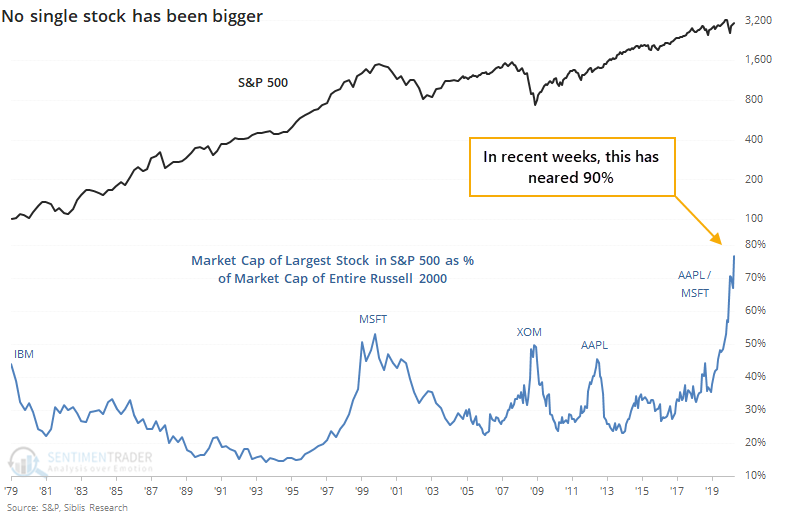
Apple's market value is larger than nearly 90% of the value of the entire Russell 2000 index. Over the past 40 years, there have been only a few times when a single stock got even half this large relative to an entire index.
FORECAST / TIMEFRAME
None
|
There has been quite a bit of hand-wringing about the biggest stocks in the market becoming an undue influence over the major indexes. There is some evidence to support this concern, but that evidence has been, well, evident for months and yet here we are, even more extreme.
The biggest stock in the U.S. and nearly the world, Apple, keeps powering higher. At the end of June, the value of Apple alone was nearly 80% of the market capitalization of the entire Russell 2000 index. As of today, it's nearly 90%. This is astounding - in the past 40 years, no single stock has come close to dwarfing the value of so many other companies.
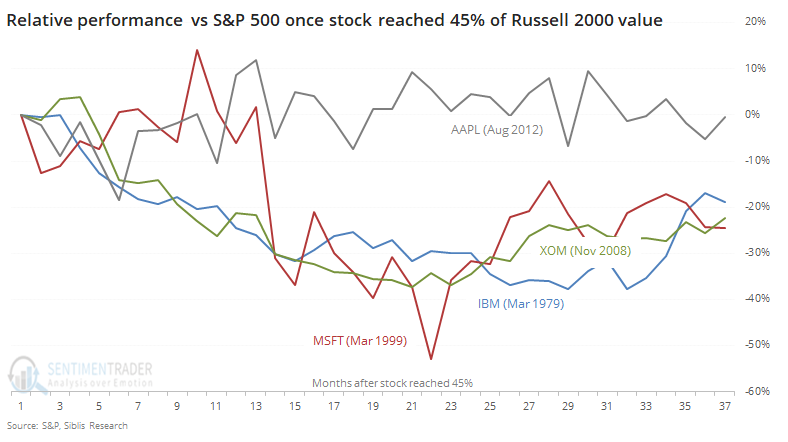
Prior to the past year, once a stock reached about 45% of the value of the entire Russell 2000, its influence started to wane. The ratio of that stock versus the rest of the S&P 500 had a tendency to drop dramatically over the next couple of years, as much as we can consider such a tiny sample size to show a tendency.
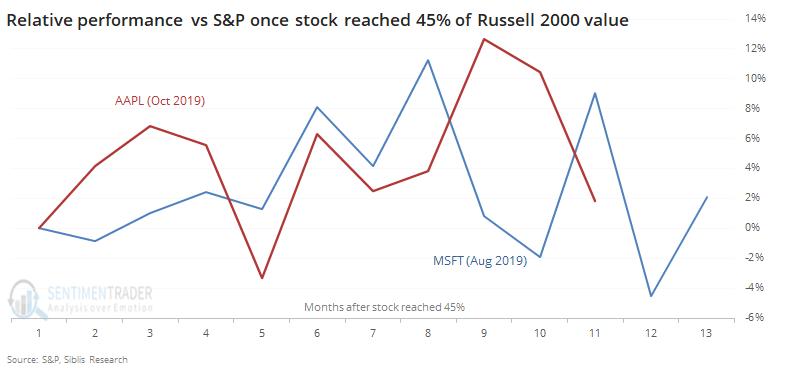
When Microsoft reached this 45% threshold last August, it didn't put much of a dent in its relative performance versus the index. Neither has Apple since it took over that crown last October.
When IBM and Exxon held this honor, their relative returns started to suffer pretty much immediately. In 1999, Microsoft managed to keep up its relative outperformance for about a year before cracking. In 2012, Apple did too, before it basically just traded in line with the index.
The historical precedent here is too small to generate any solid conclusion, and the current weight of these stocks is so absurd that there really is no true precedent, anyway. There might be a very slight suggestion that those piling into the largest stocks are betting against the "rules" of economics and market history, but those rules have been put on hold for months on end already.
Active Studies
| Time Frame | Bullish | Bearish | | Short-Term | 0 | 1 | | Medium-Term | 8 | 11 | | Long-Term | 46 | 1 |
|
Indicators at Extremes
Portfolio
| Position | Weight % | Added / Reduced | Date | | Stocks | 29.8 | Reduced 9.1% | 2020-06-11 | | Bonds | 0.0 | Reduced 6.7% | 2020-02-28 | | Commodities | 5.2 | Added 2.4%
| 2020-02-28 | | Precious Metals | 0.0 | Reduced 3.6% | 2020-02-28 | | Special Situations | 0.0 | Reduced 31.9% | 2020-03-17 | | Cash | 65.0 | | |
|
Updates (Changes made today are underlined)
After stocks bottomed on March 23rd, they enjoyed a historic buying thrust and retraced a larger amount of the decline than "just a bear market rally" tends to. Through June, there were signs of breadth thrusts, recoveries, and trend changes that have an almost unblemished record at preceding higher prices over a 6-12 month time frame. On a shorter-term basis, our indicators have been showing high optimism, with Dumb Money Confidence recently above 80%, along with signs of reckless speculation during what appears to be an unhealthy market environment, historically a bad combination. While there are certainly some outlier indicators that are showing apathy or even outright pessimism, a weight-of-the-evidence approach suggests high risk over a multi-week to multi-month time frame. I've been carrying a low (too low) level of exposure to stocks, as well as bonds and gold. I don't see a good opportunity to add to any of those currently, with poor prospects pretty much all the way around. As worried as I am over the medium-term, I would only grudgingly reduce my exposure even further given the longer-term positives we spent so much time discussing in the spring. At this point, I would only look seriously at lowering exposure further if the S&P 500 drops below approximately 3220, an initial sign that its recent mini-breakout had failed.
RETURN YTD: -2.8% 2019: 12.6%, 2018: 0.6%, 2017: 3.8%, 2016: 17.1%, 2015: 9.2%, 2014: 14.5%, 2013: 2.2%, 2012: 10.8%, 2011: 16.5%, 2010: 15.3%, 2009: 23.9%, 2008: 16.2%, 2007: 7.8%
|
|
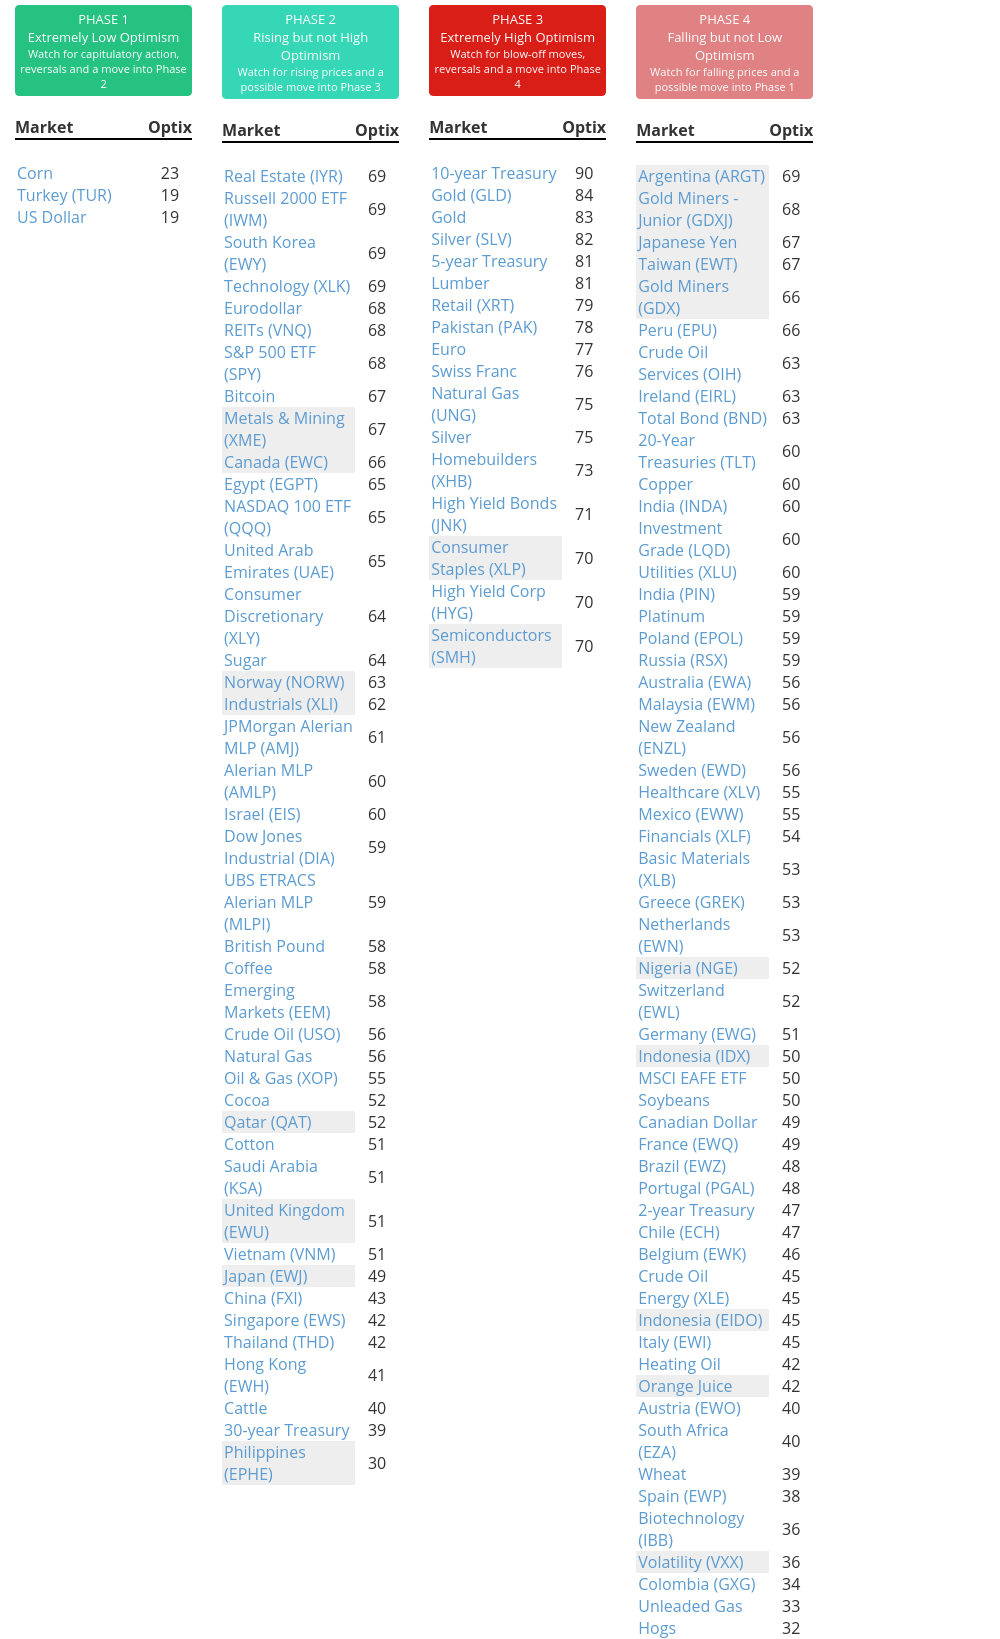
Phase Table
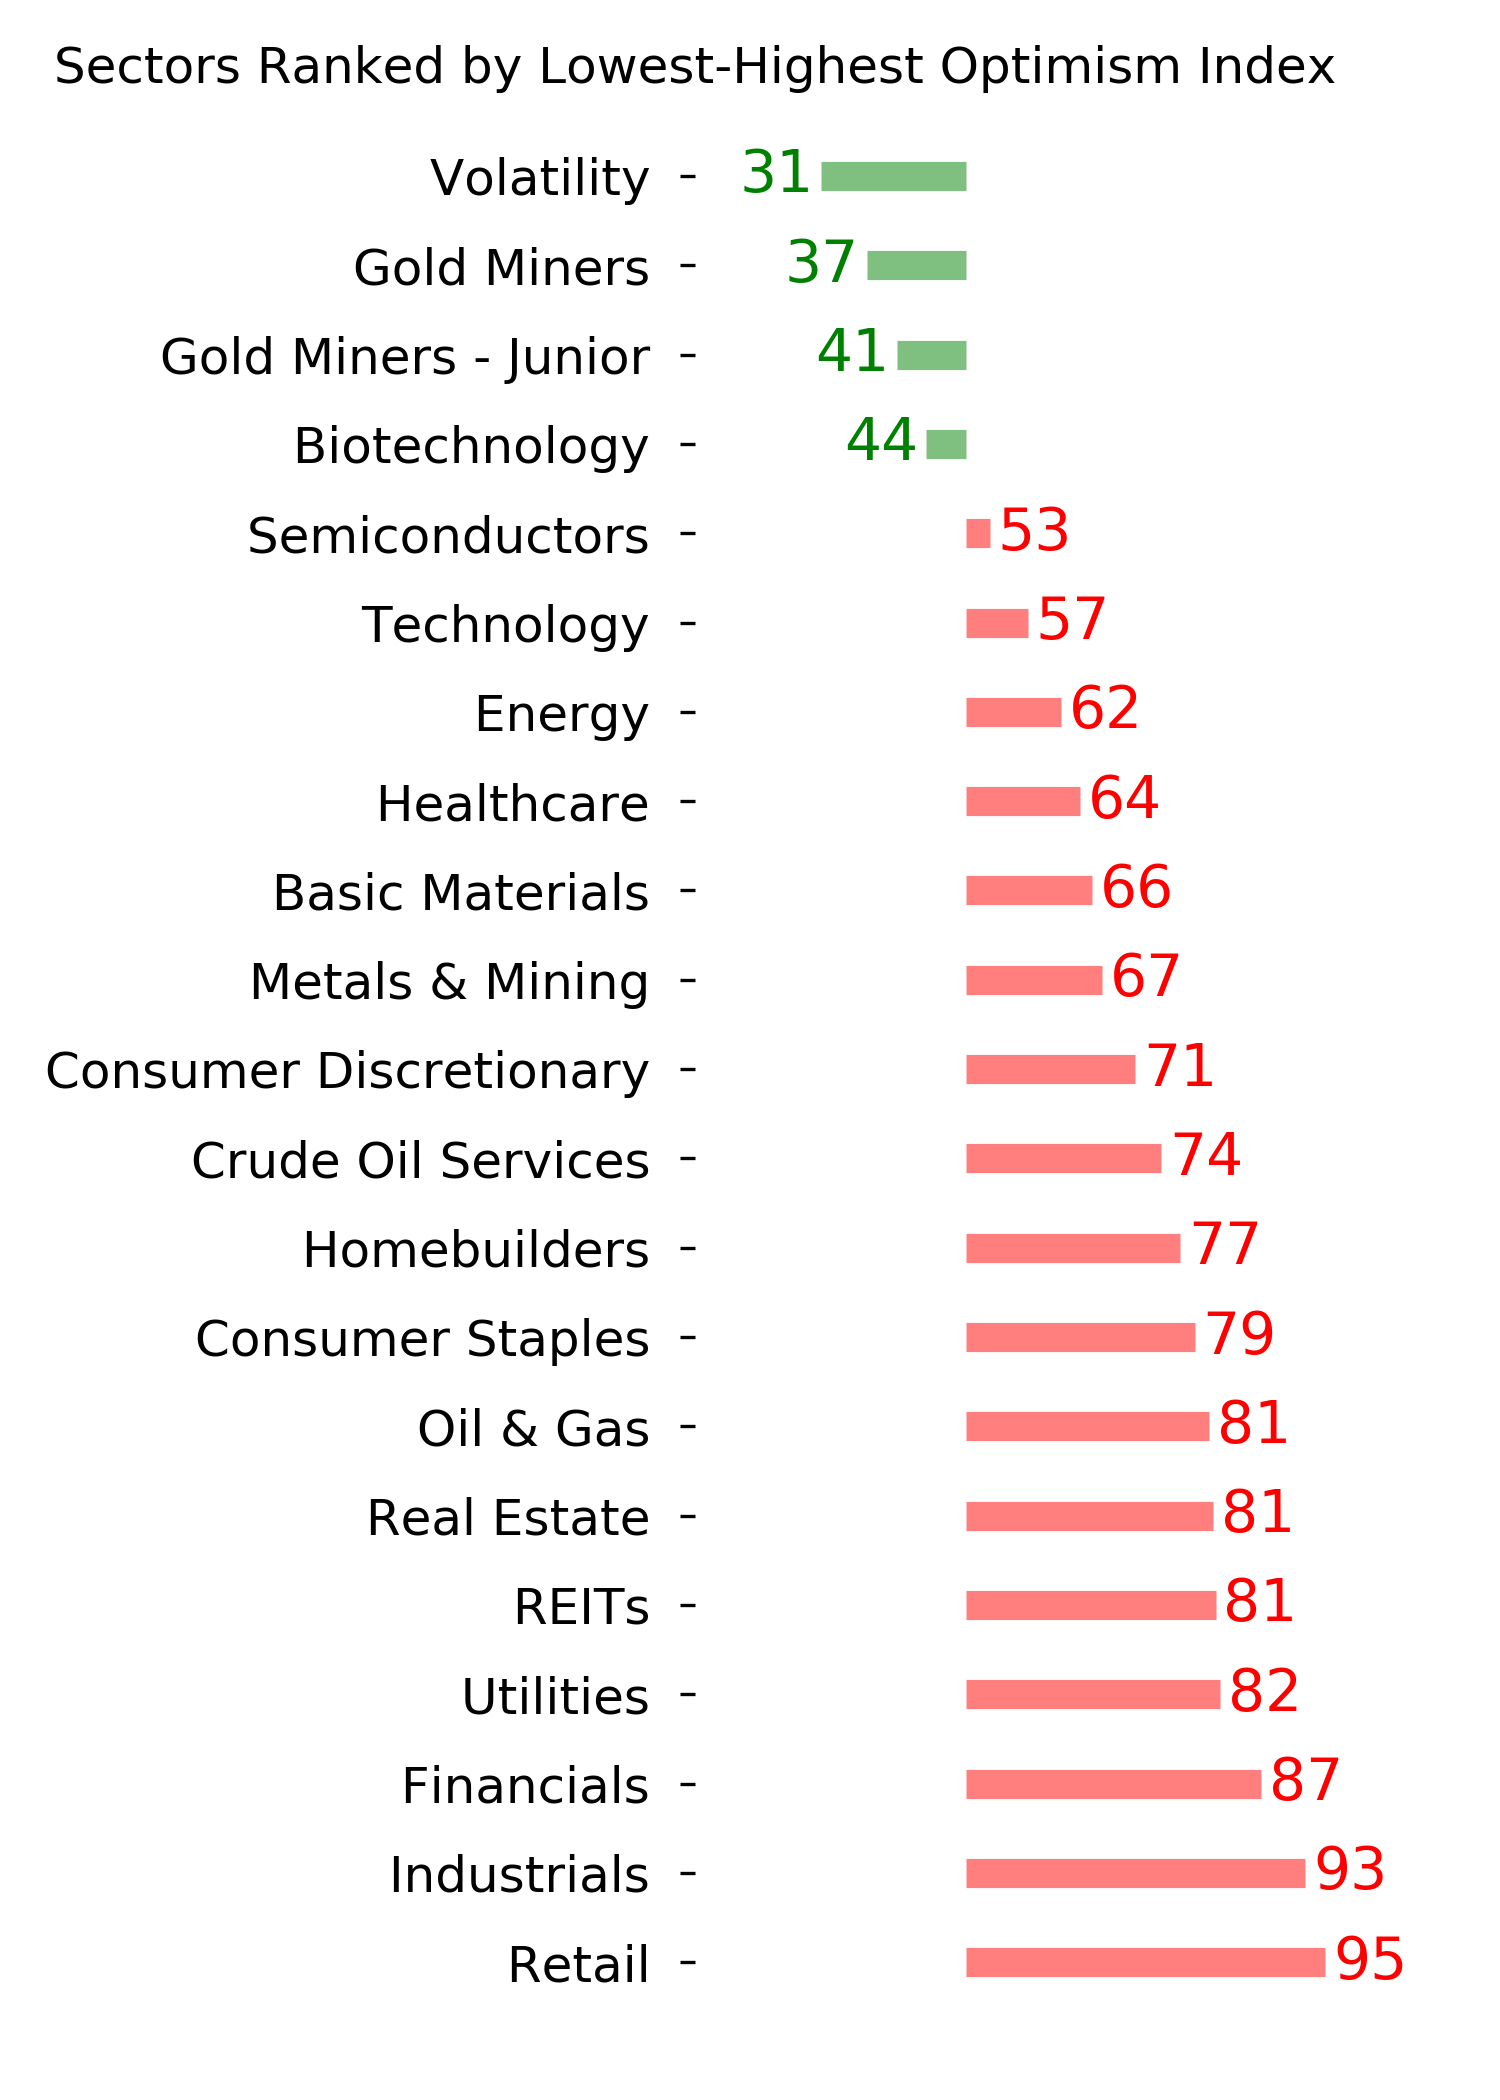
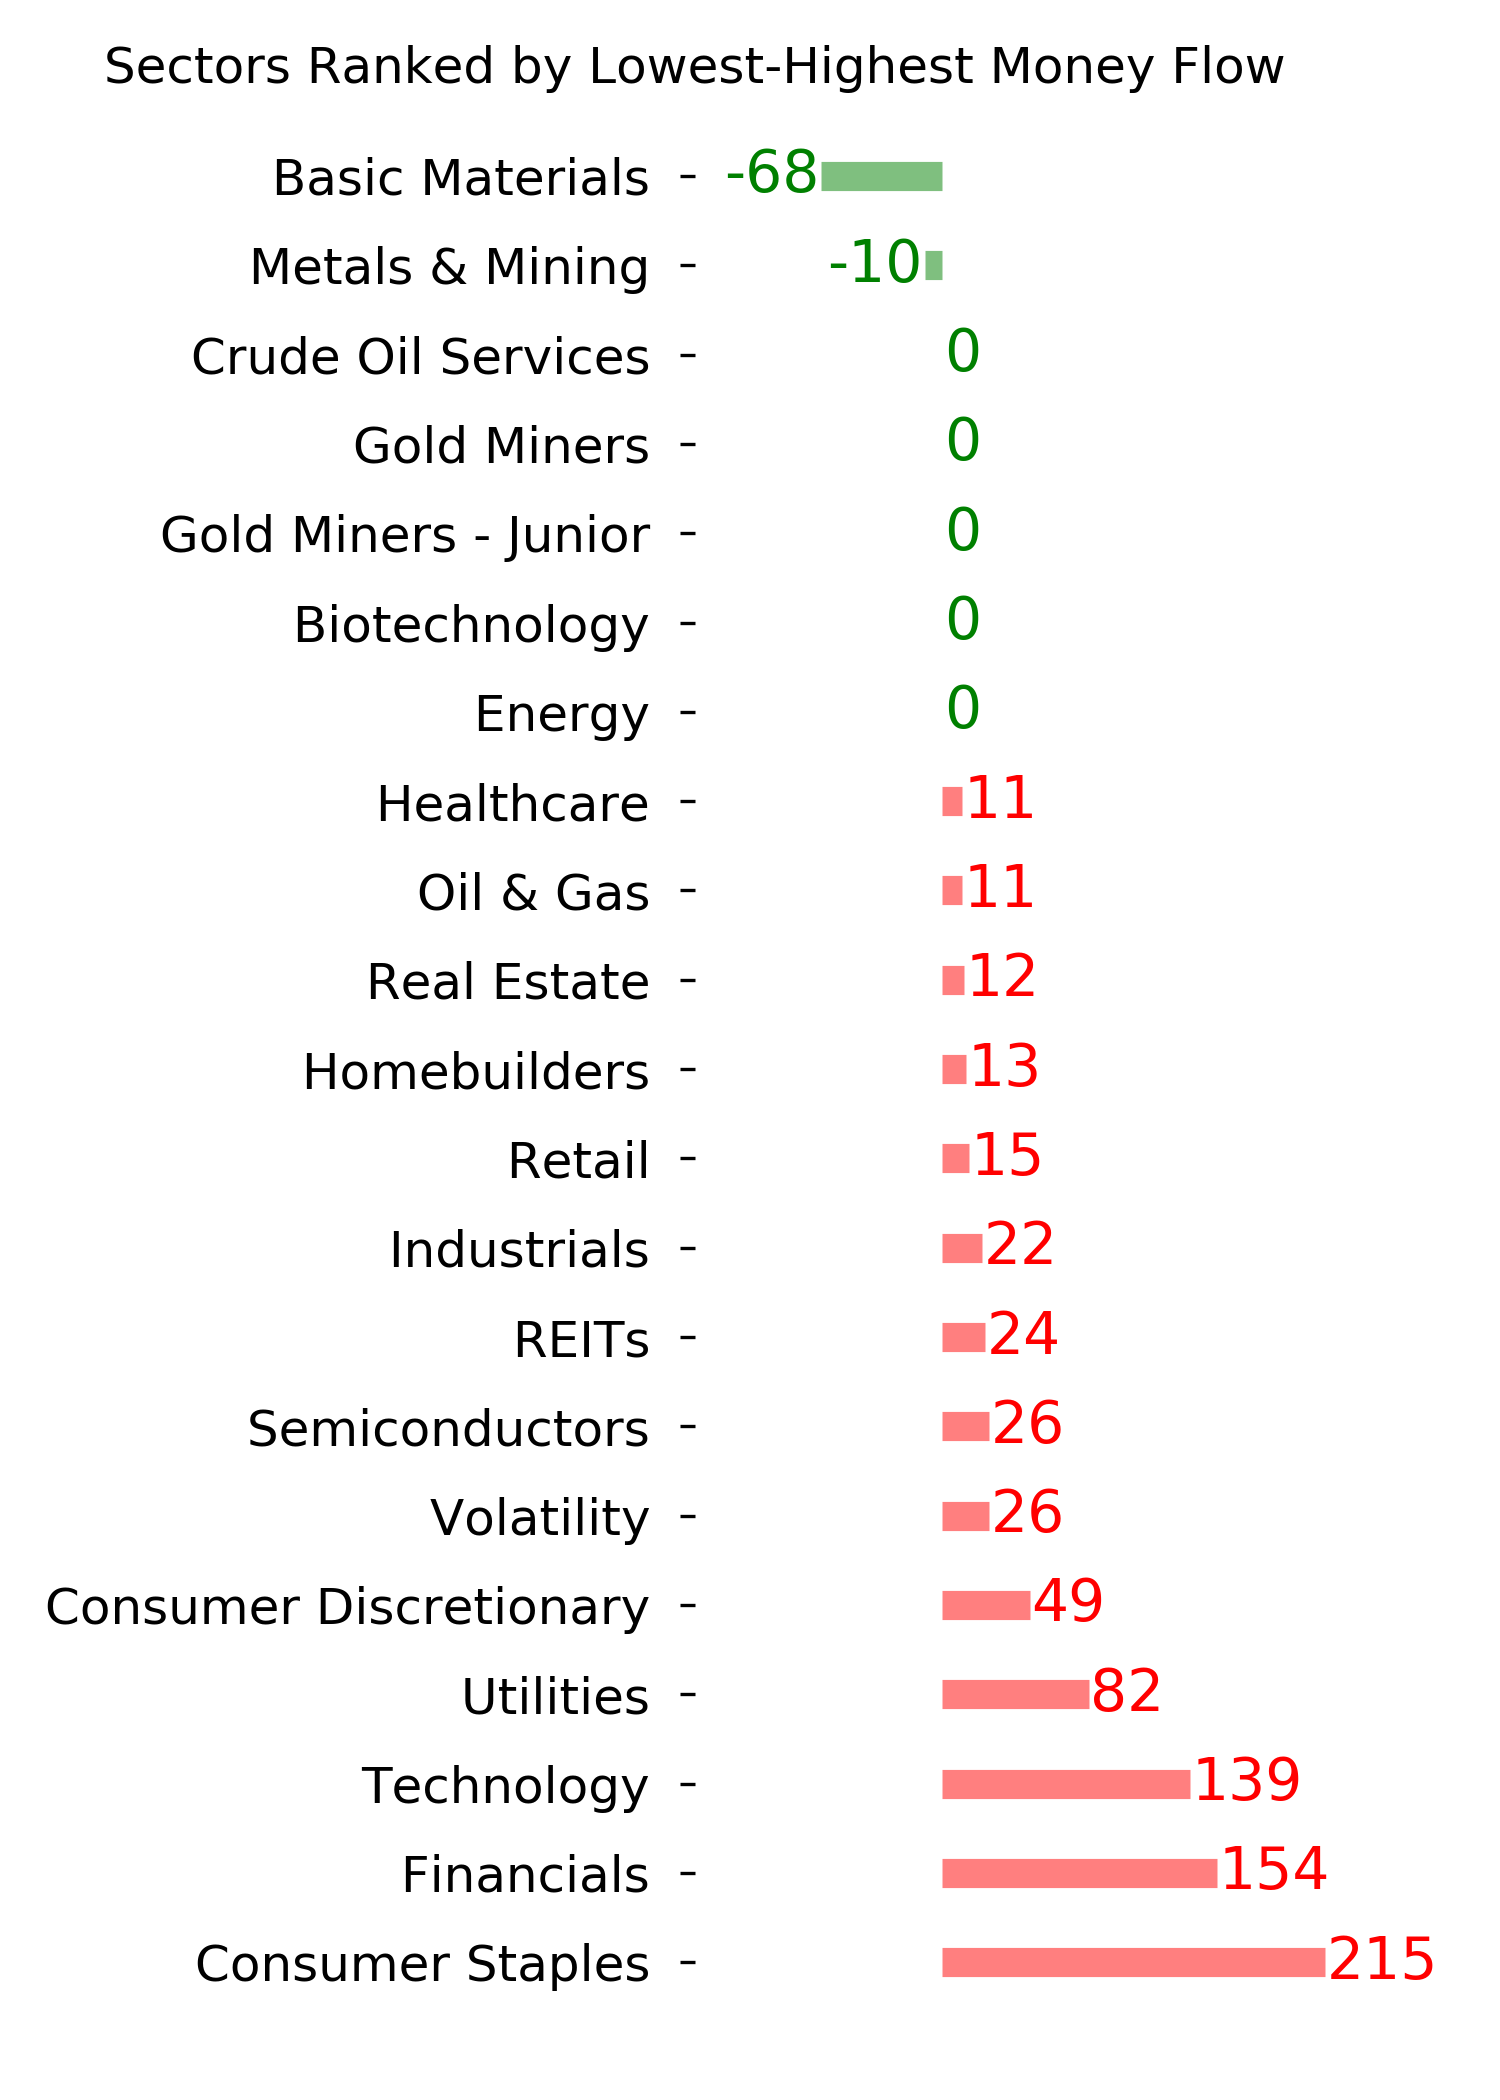
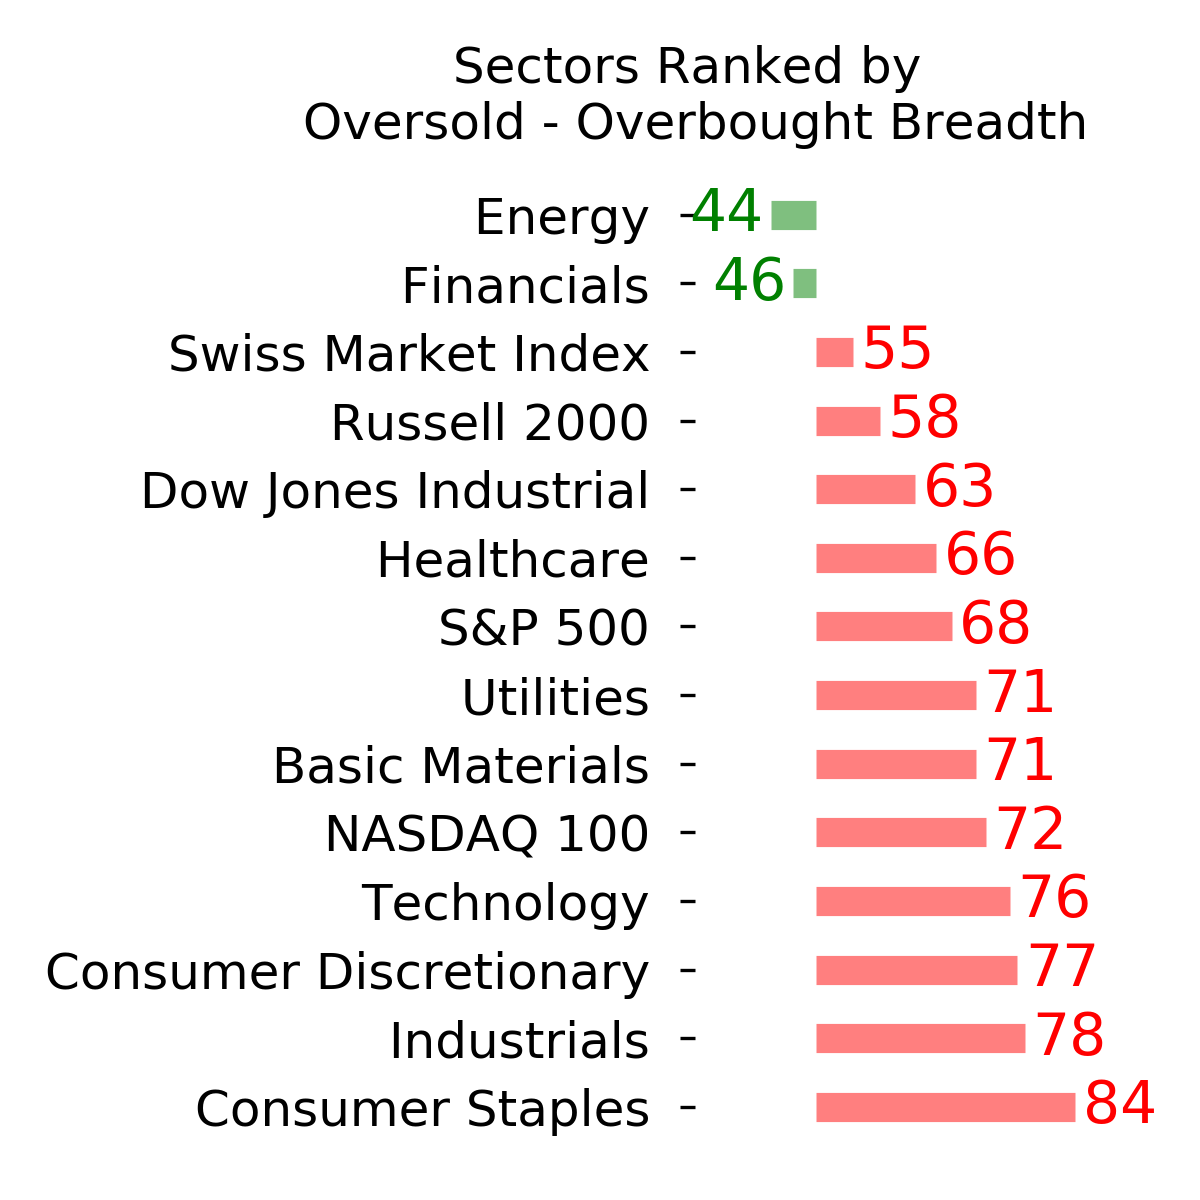
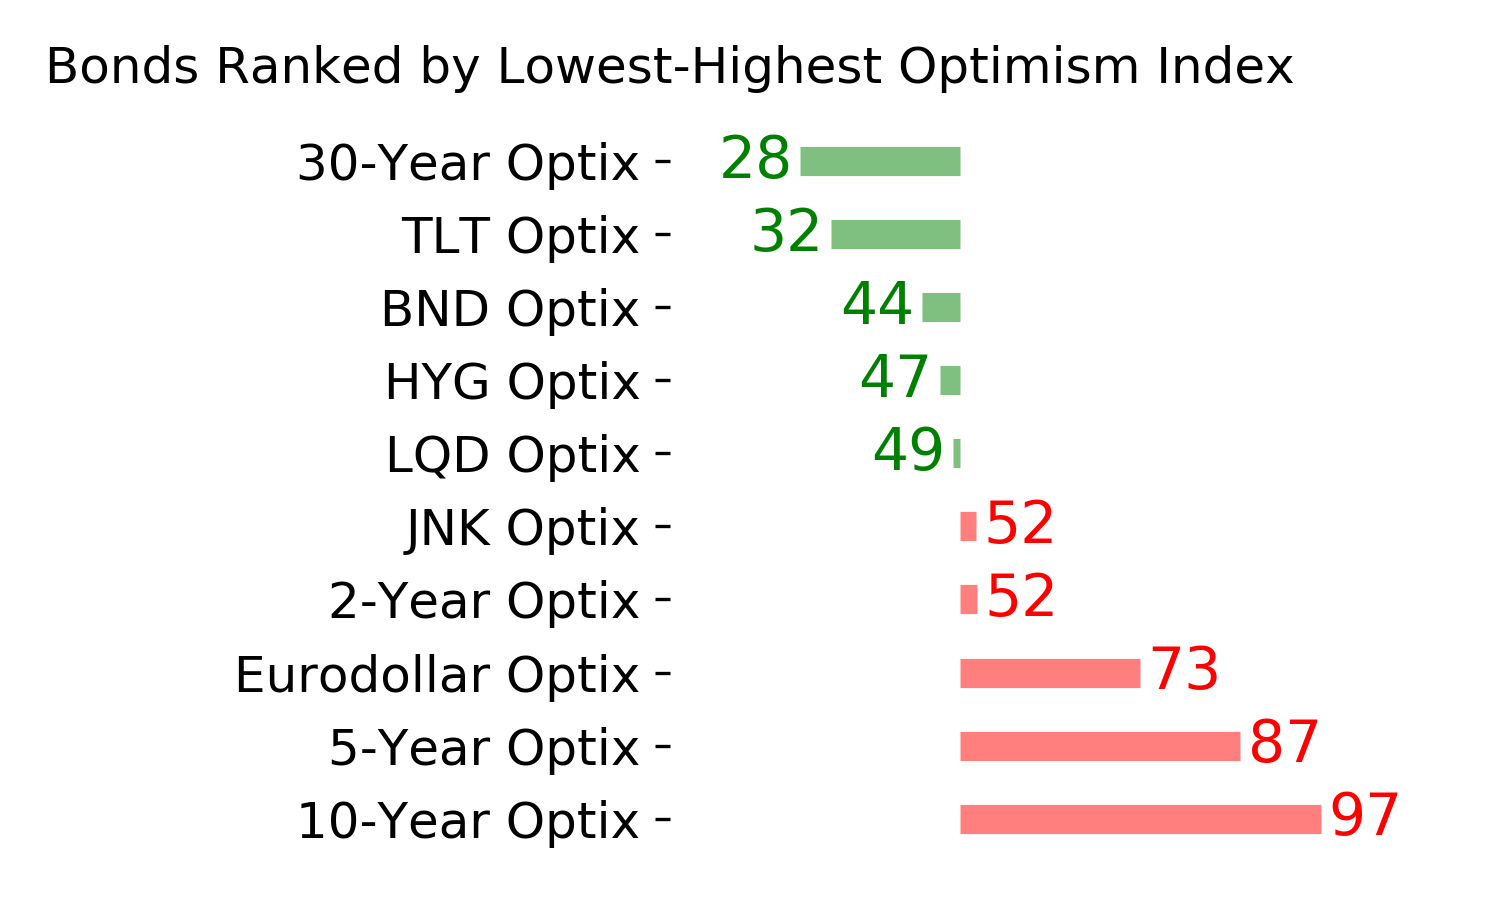
Ranks
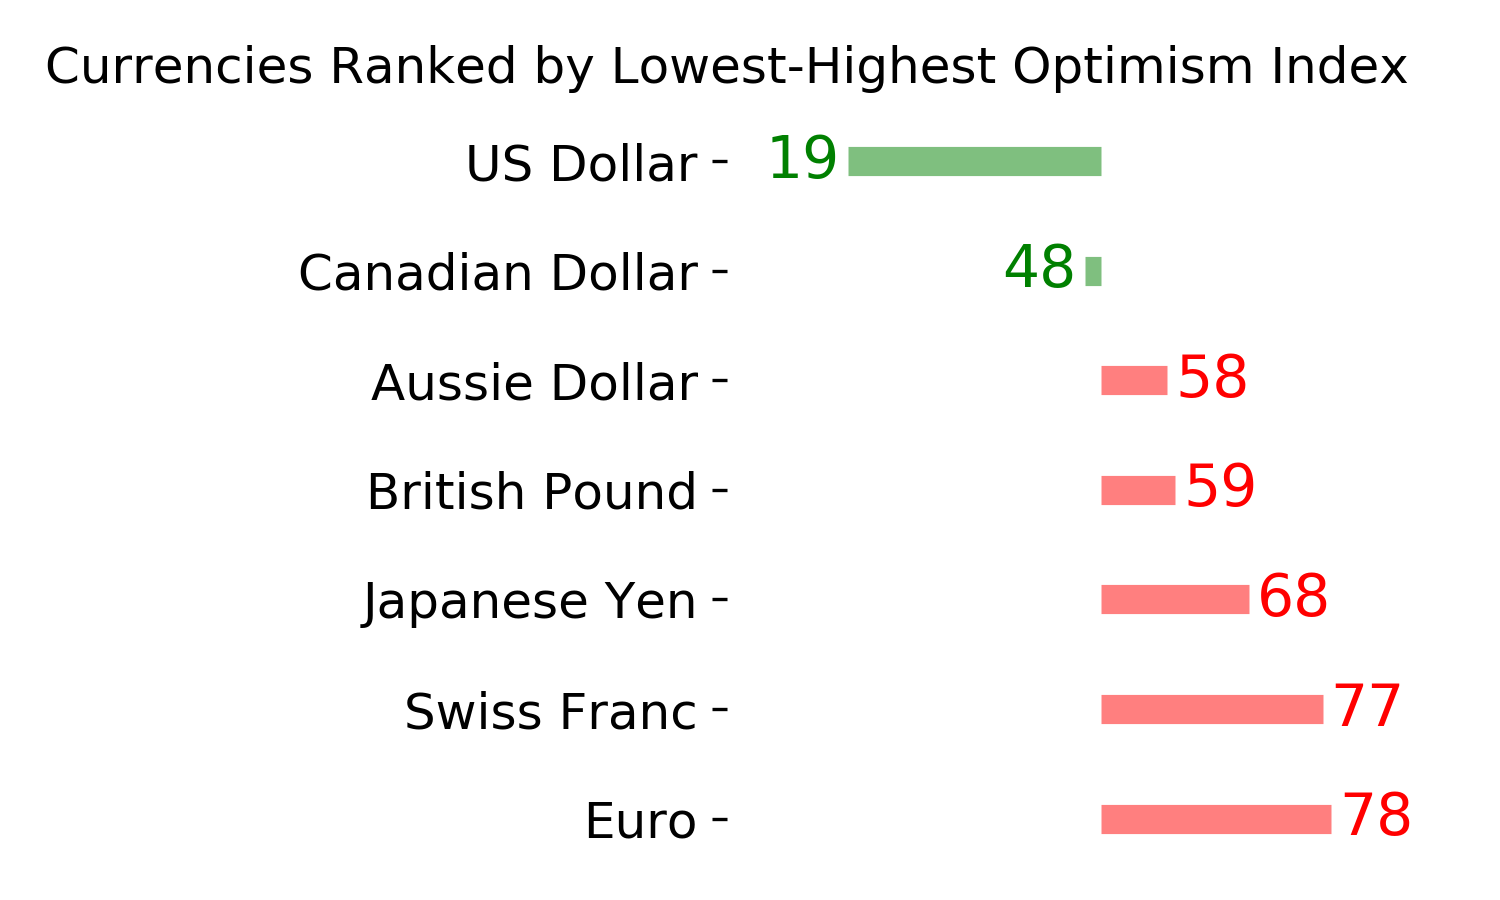
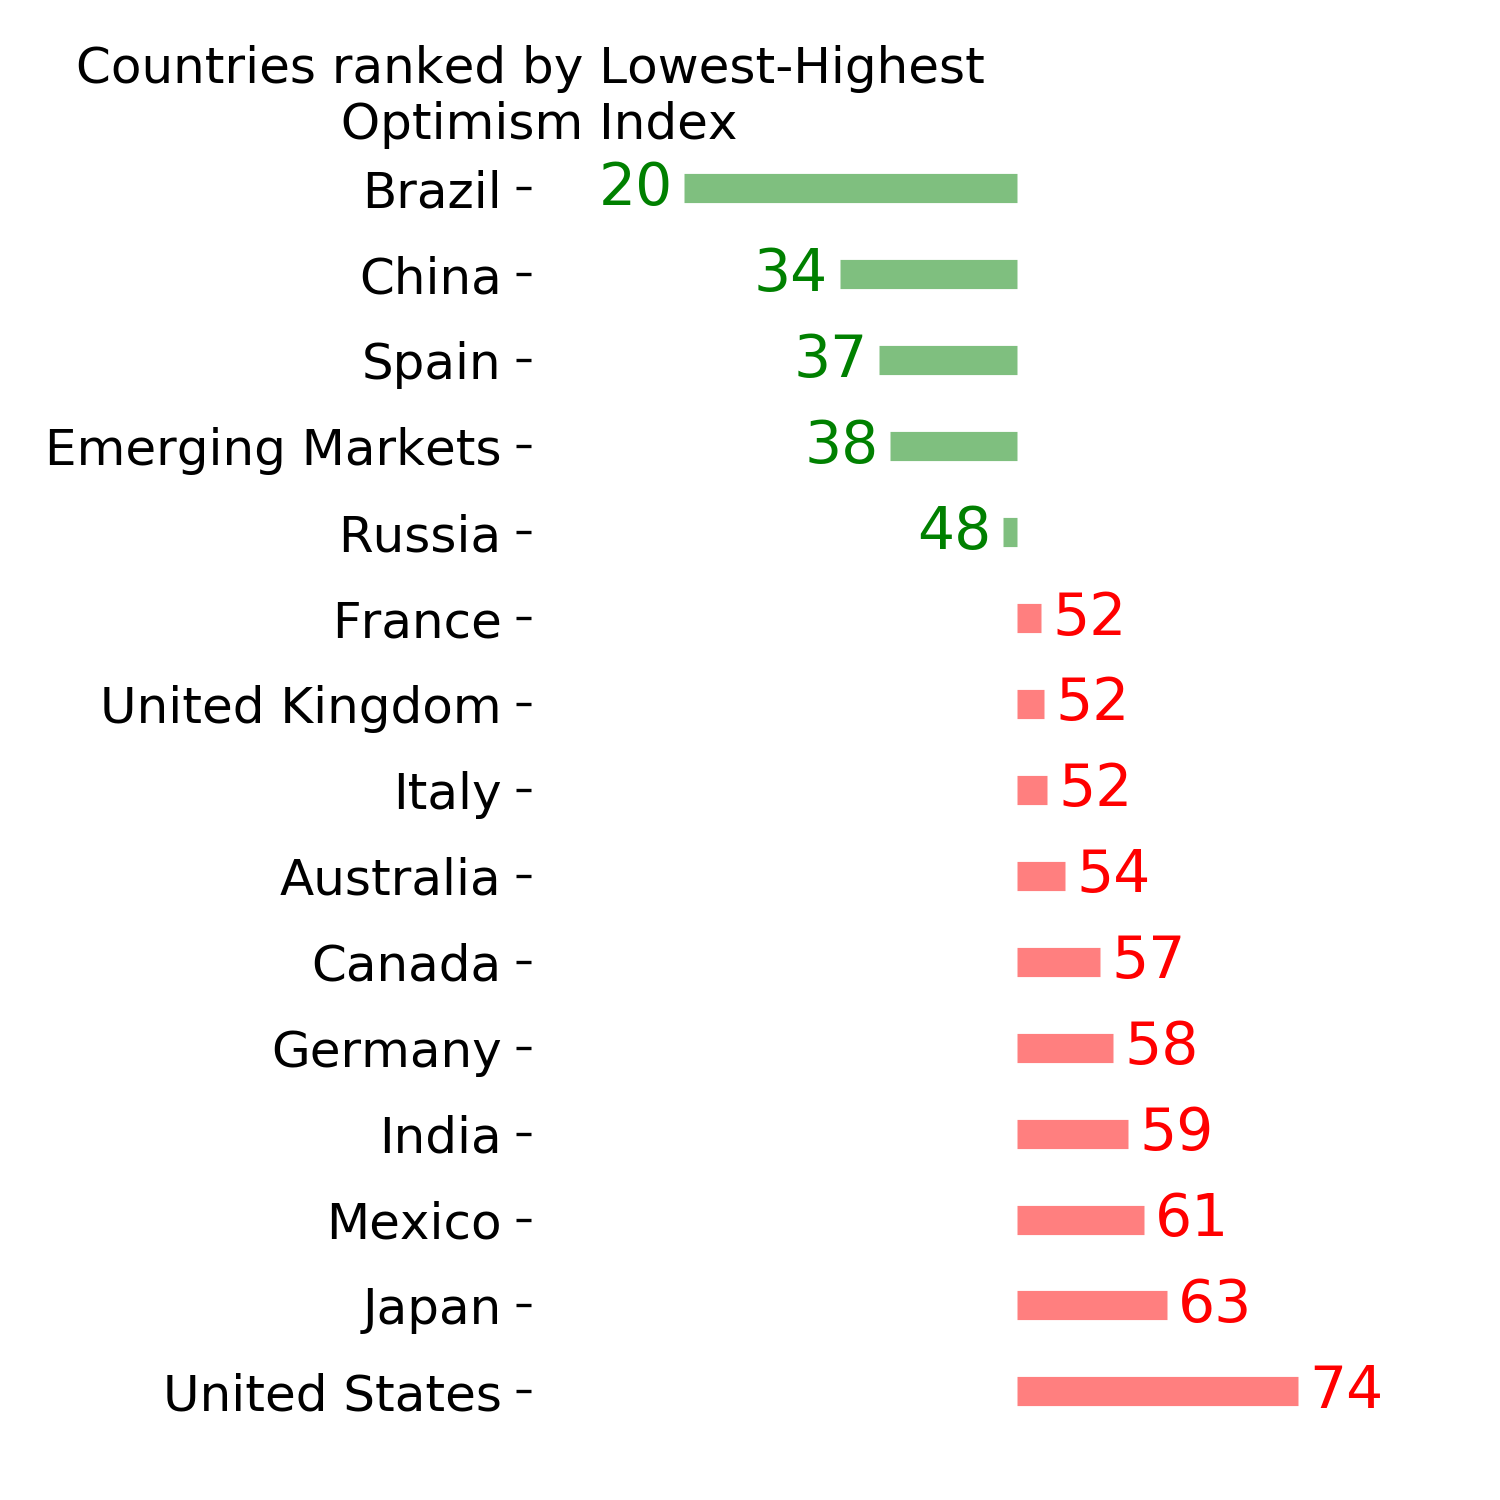
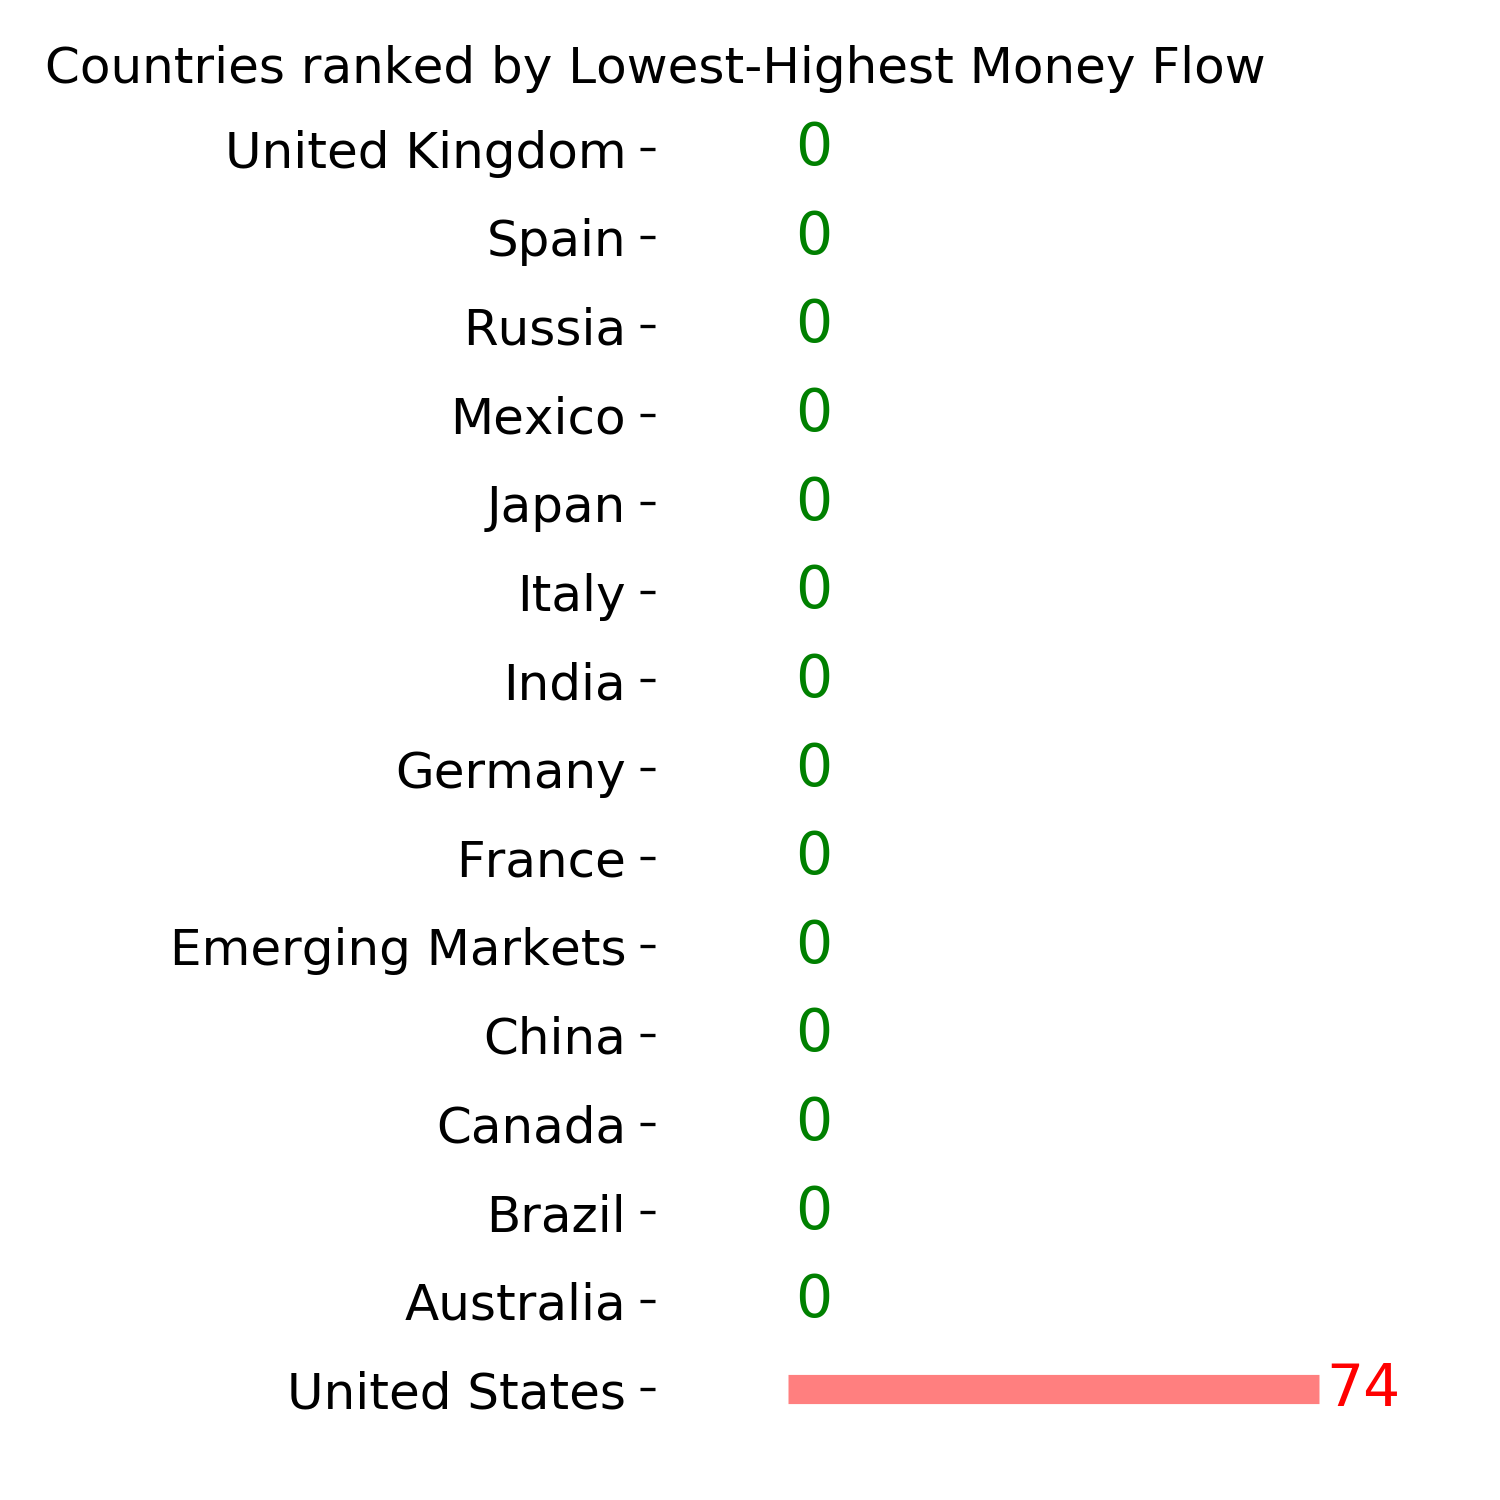
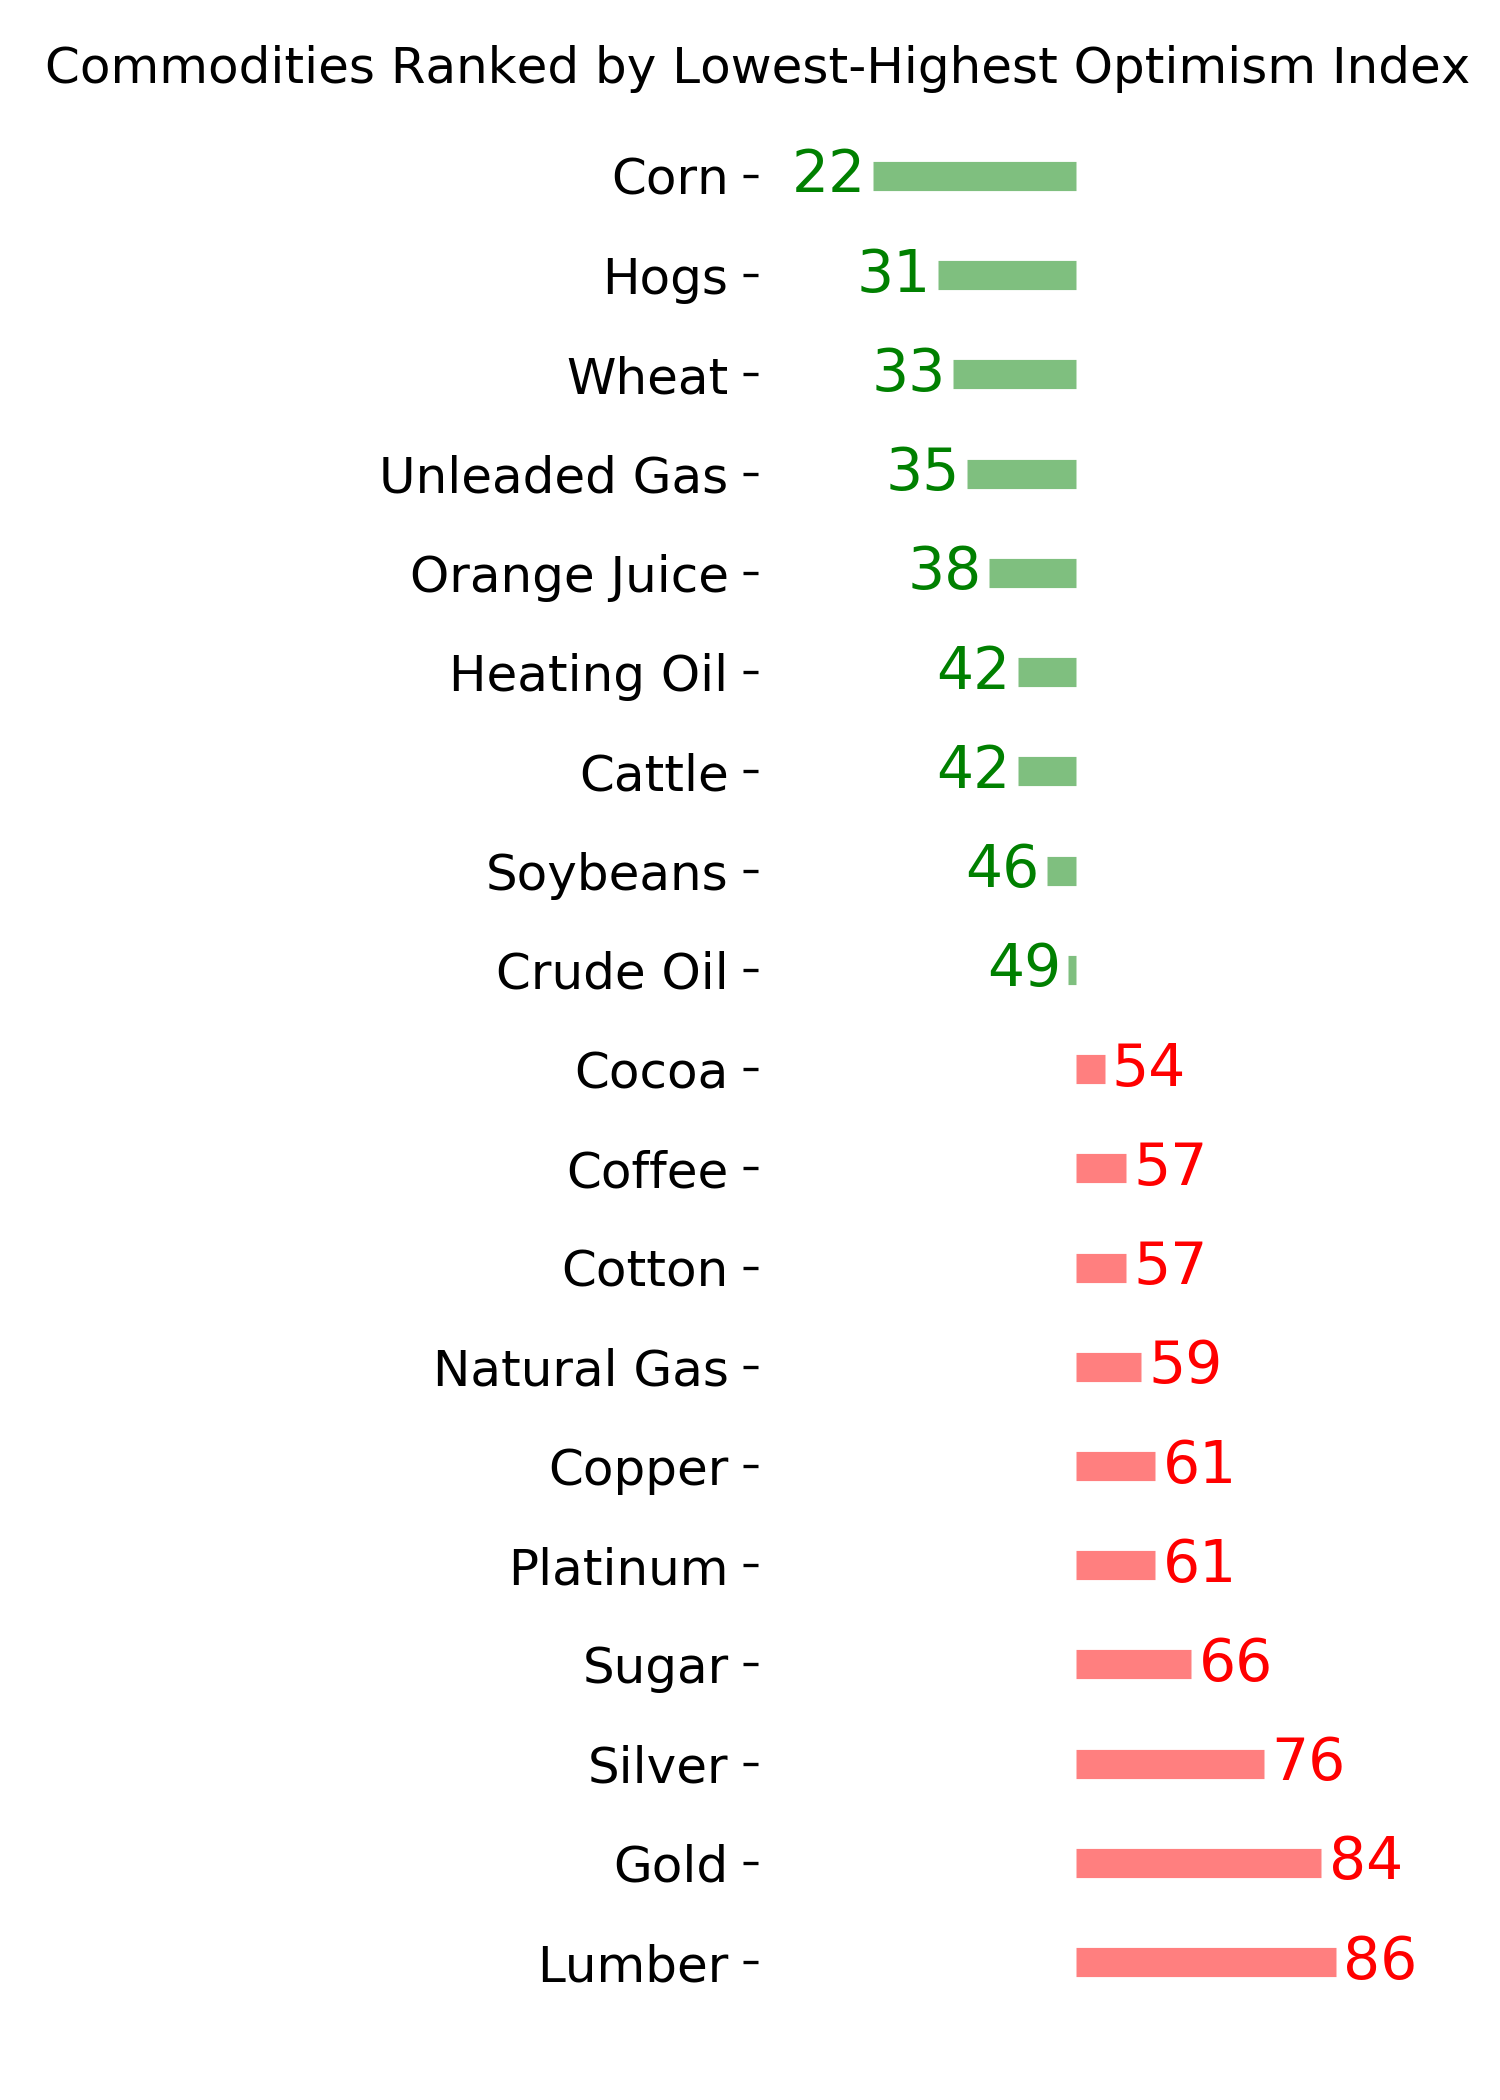
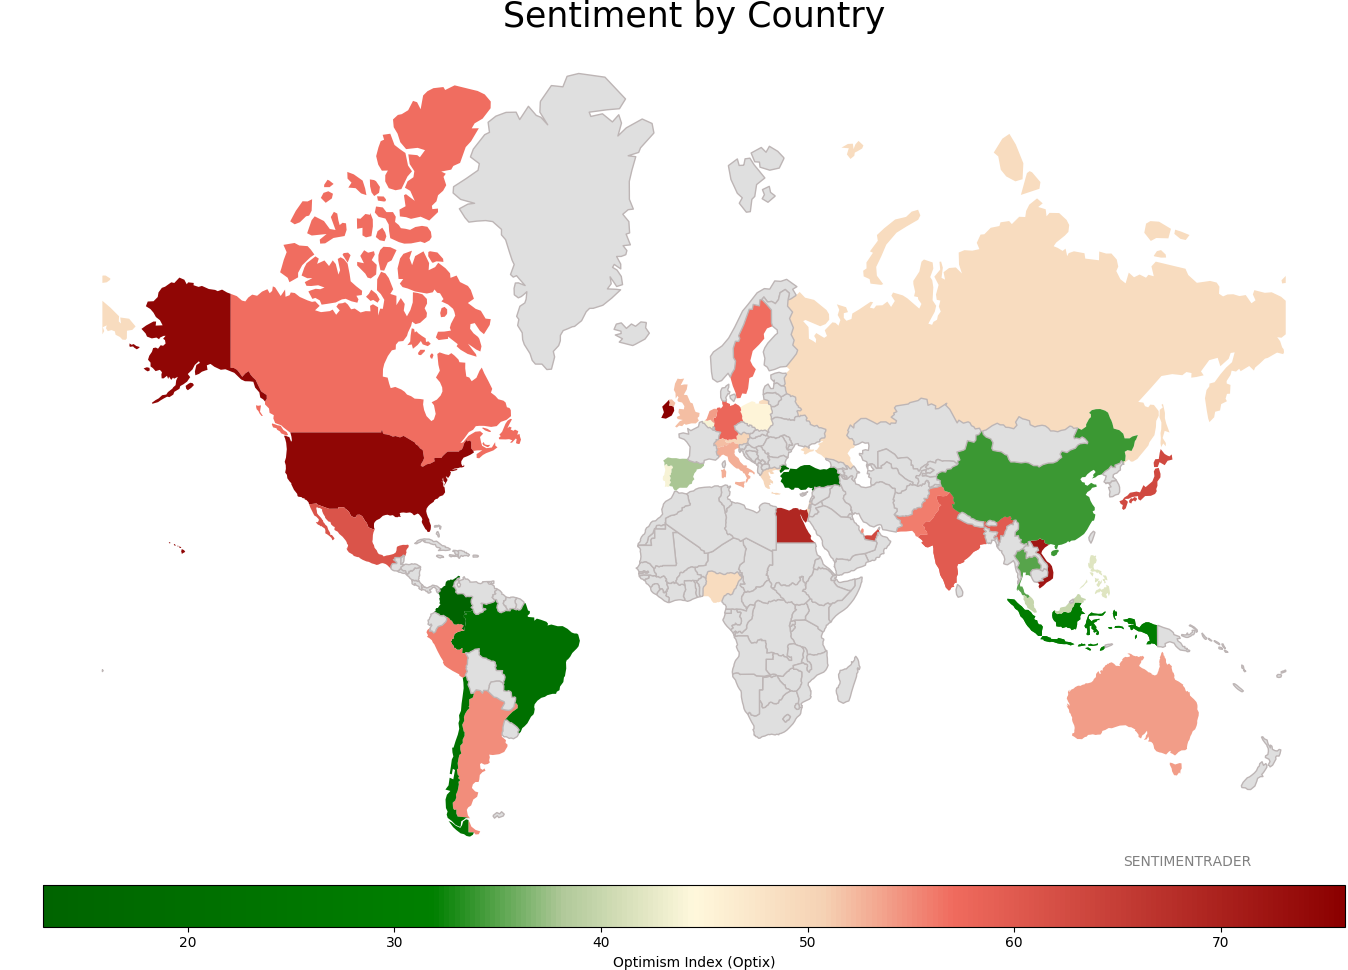
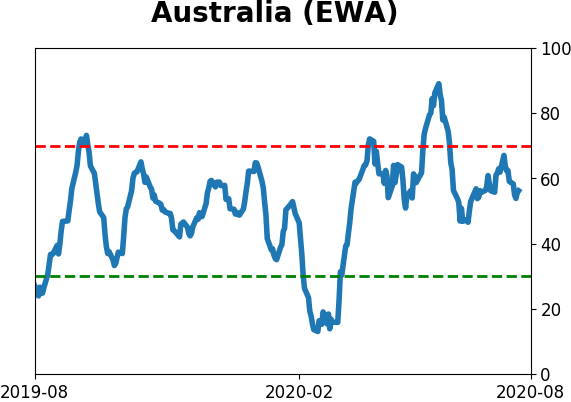
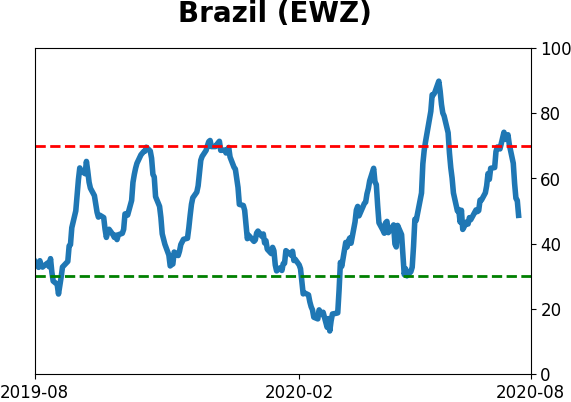
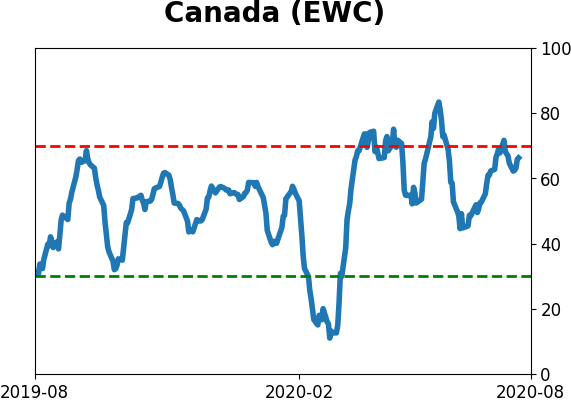
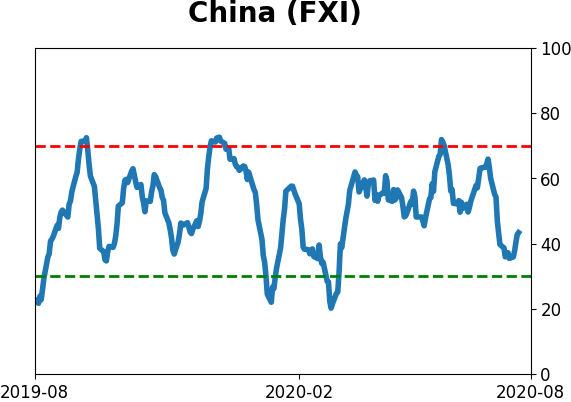
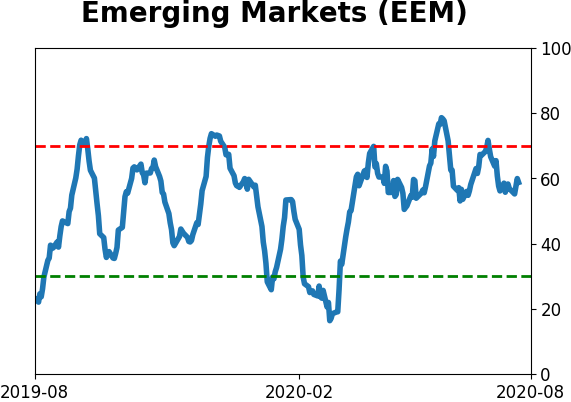
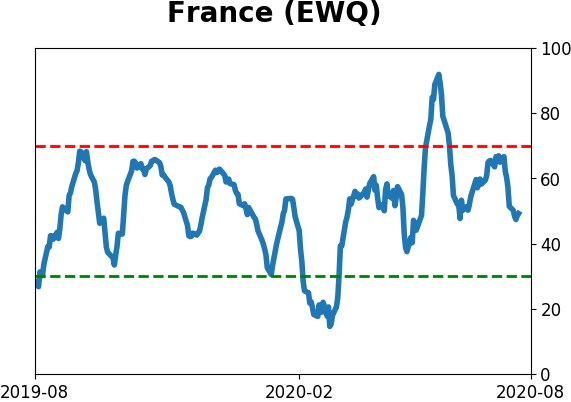
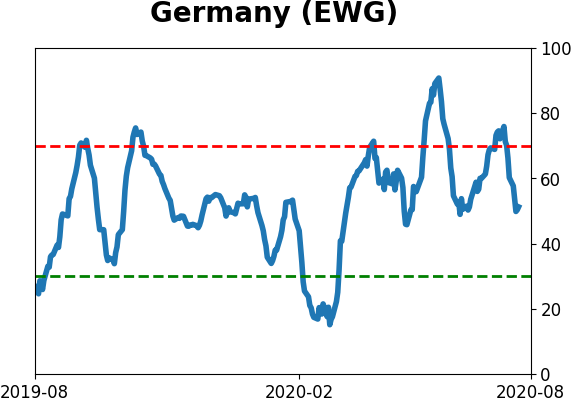
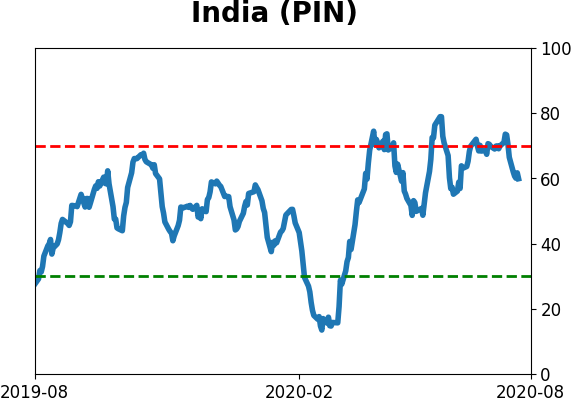
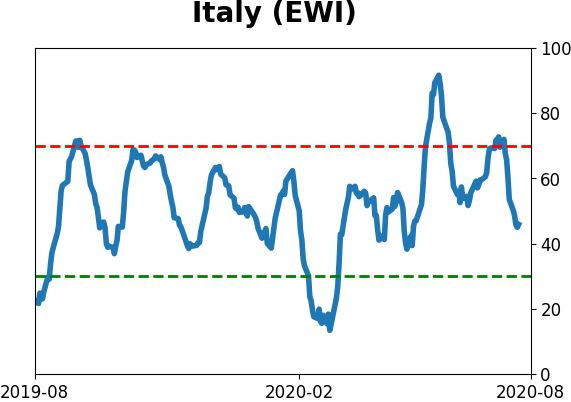
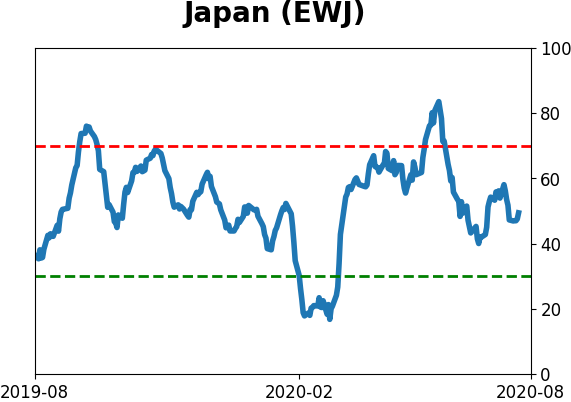
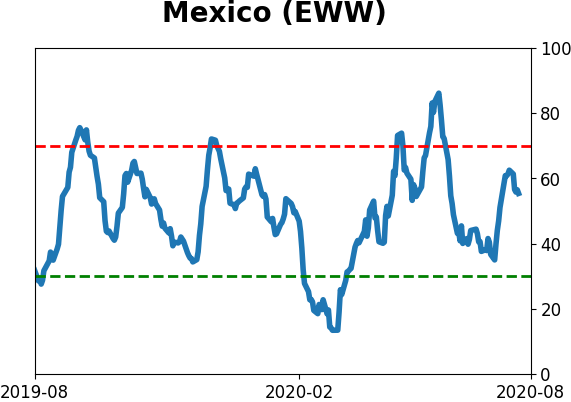
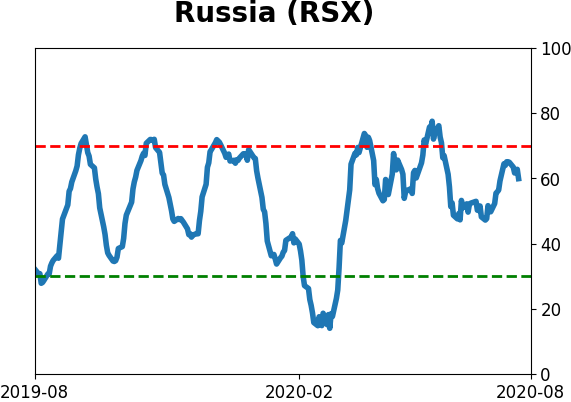
Sentiment Around The World
Optimism Index Thumbnails
|
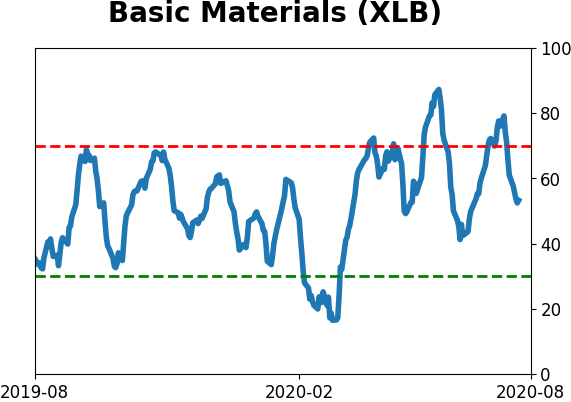
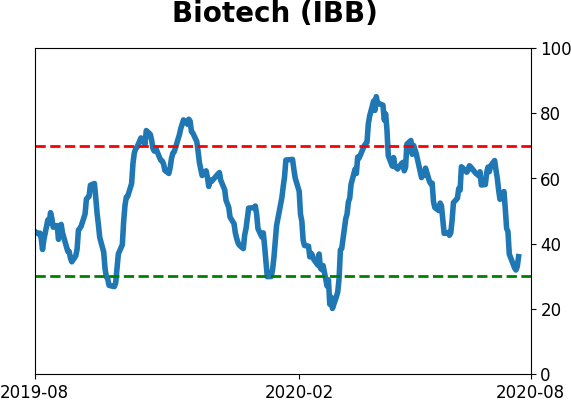
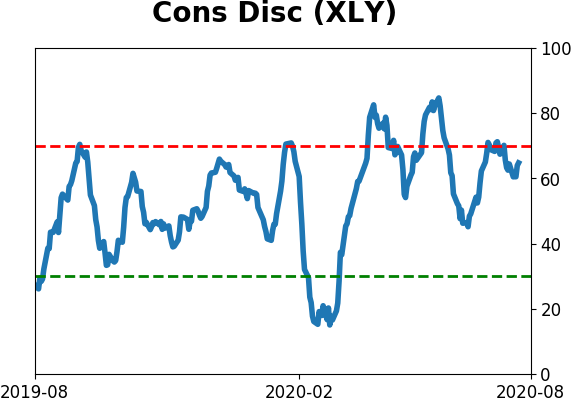
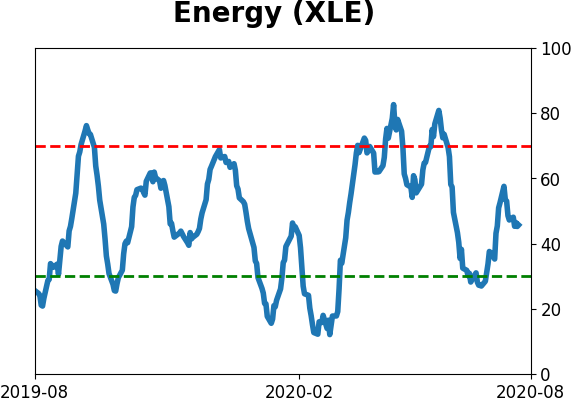
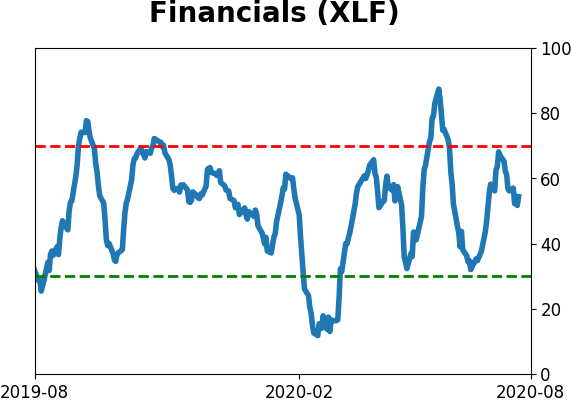
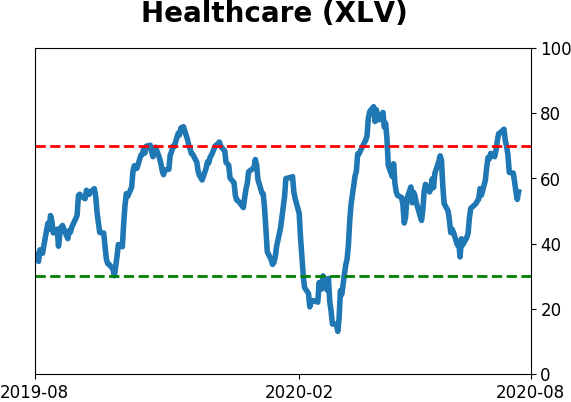
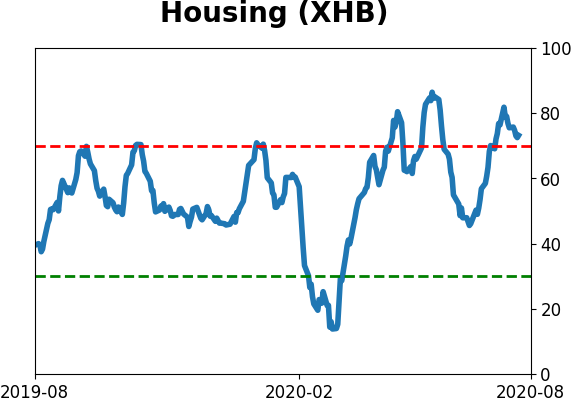
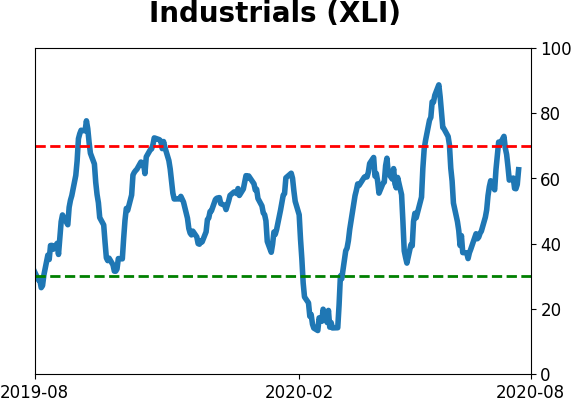
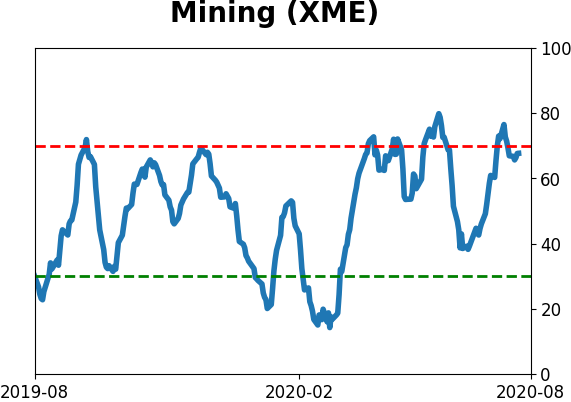
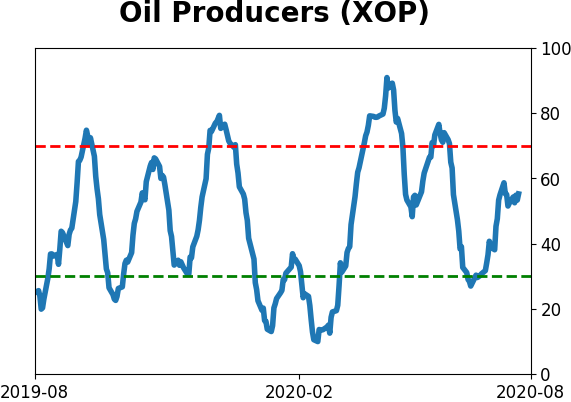
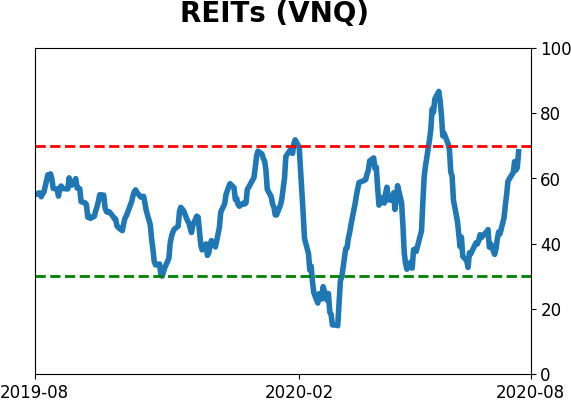
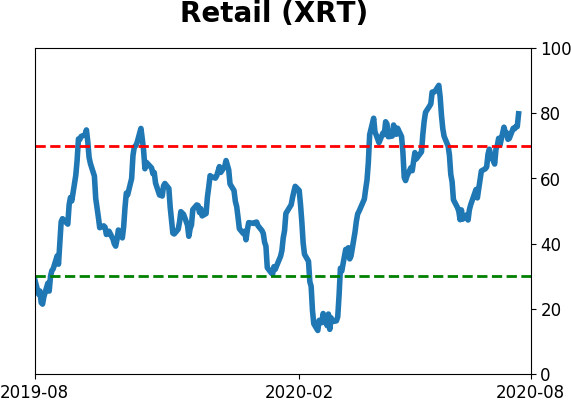
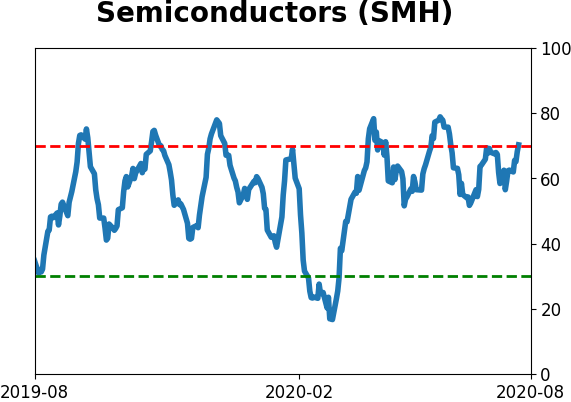
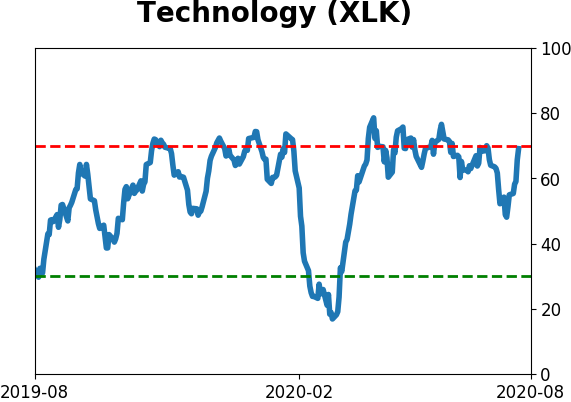
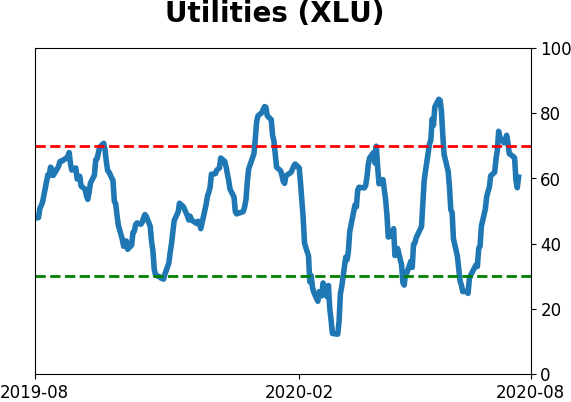
Sector ETF's - 10-Day Moving Average
|
|
|
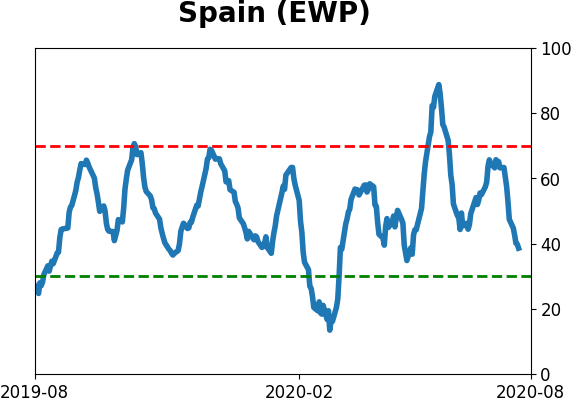
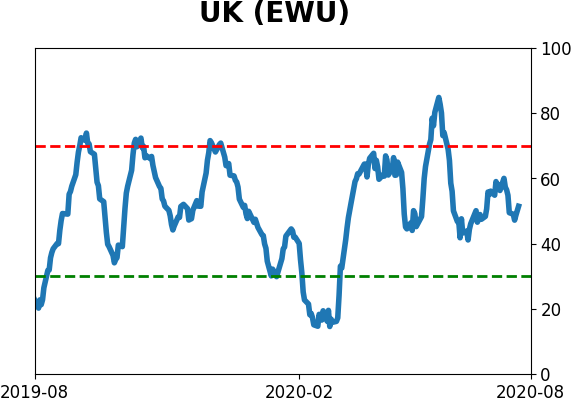
Country ETF's - 10-Day Moving Average
|
|
|
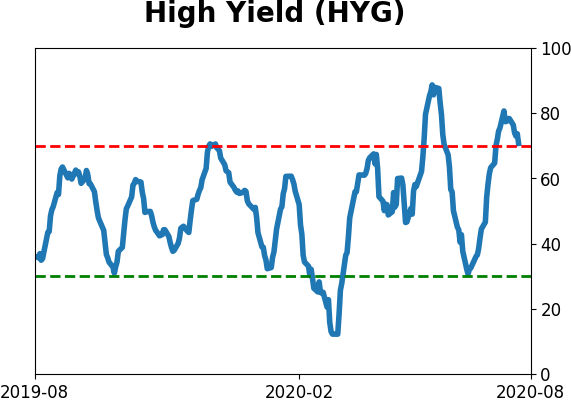
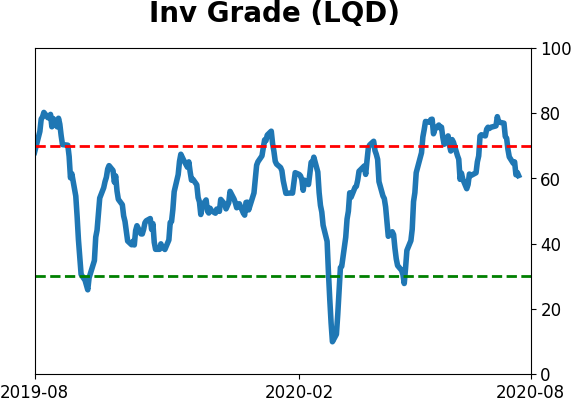
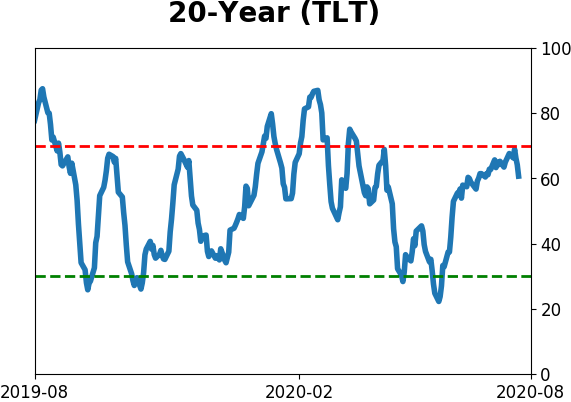
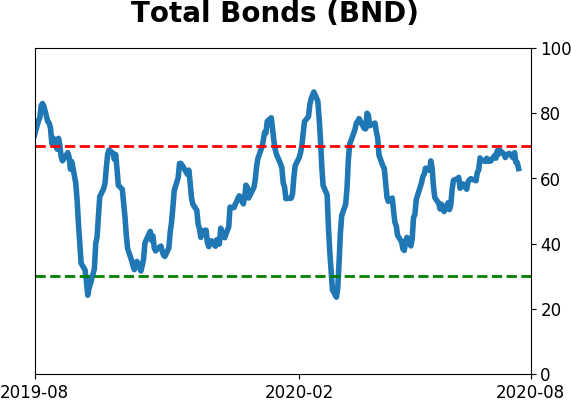
Bond ETF's - 10-Day Moving Average
|
|
|
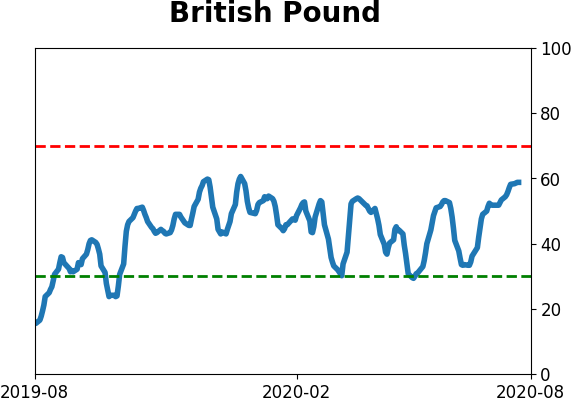
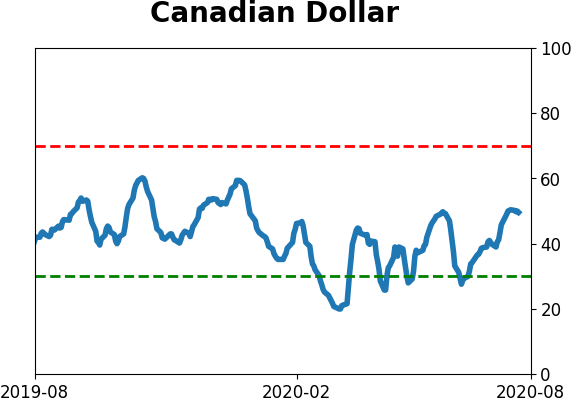
Currency ETF's - 5-Day Moving Average
|
|
|
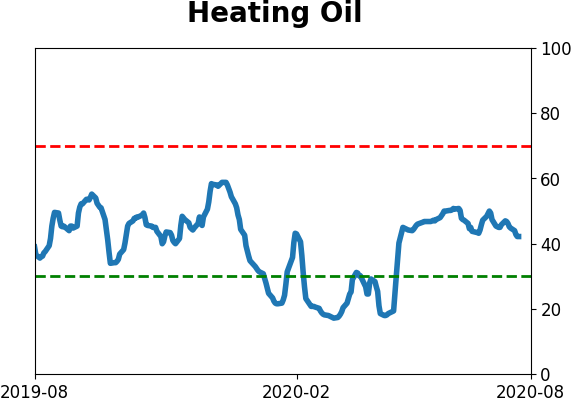
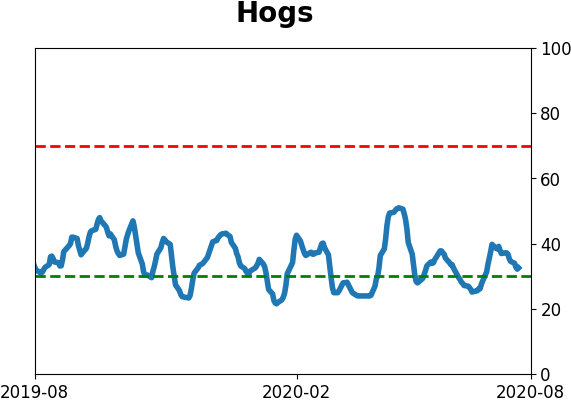
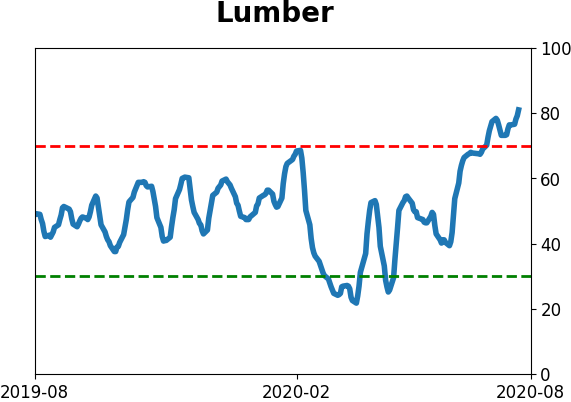
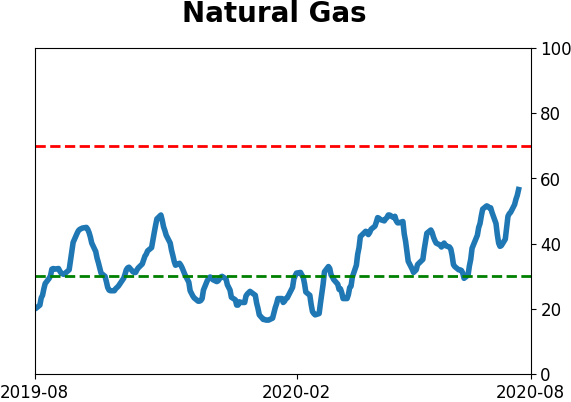
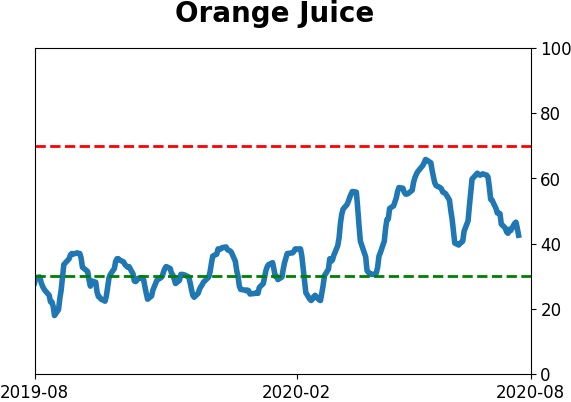
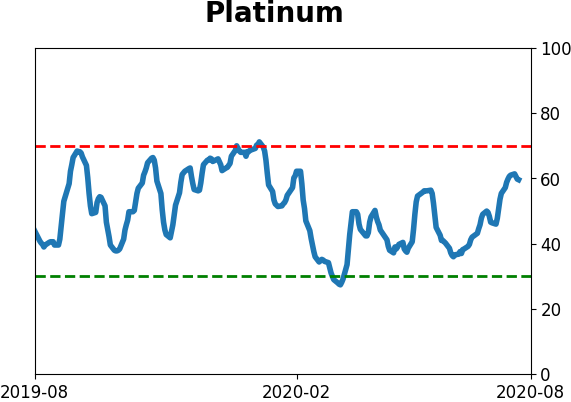
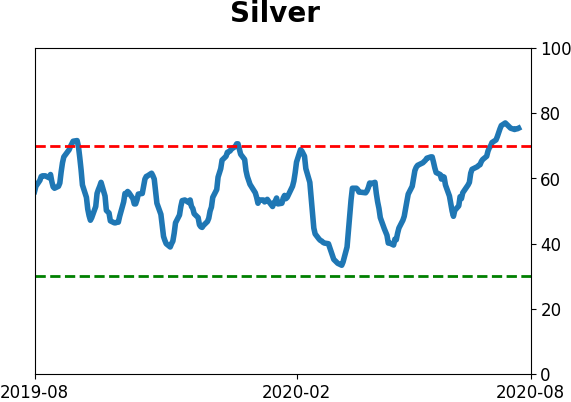
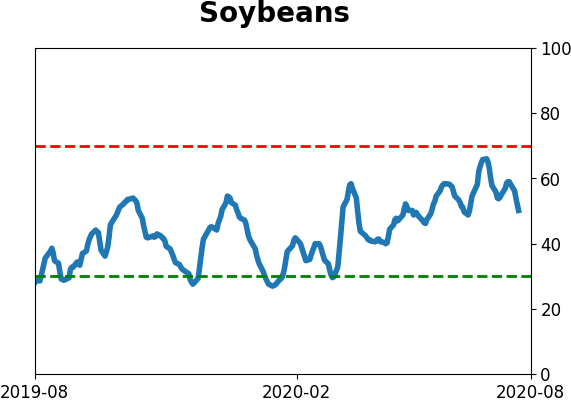
Commodity ETF's - 5-Day Moving Average
|
|