Headlines
|
|
Speculative options traders return:
The smallest of options traders (and the largest, too) have returned to their speculative ways. They've once again been buying call options while staying away from hedges. Overall speculative activity is now the highest since the spring of 2000.
Stocks are calming down after near-record volatility:
After a near-record amount of volatility in March and April, stock swings have calmed down. The S&P 500's average true range over a 5-day span dropped to less than 1% for the first time in months. That hasn't been a reliable sign that calm conditions would necessarily last.
Bottom Line:
- Weight of the evidence has been suggesting flat/lower stock prices short- to medium-term again; still suggesting higher prices long-term
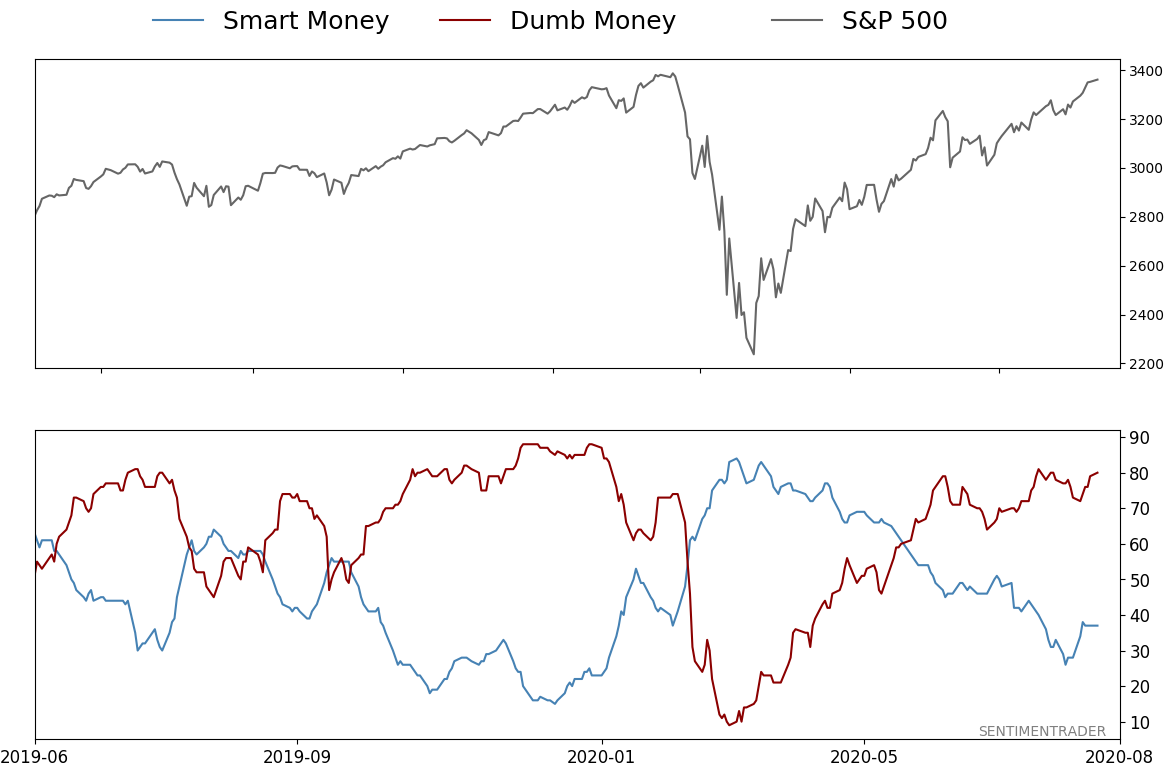
- Indicators show high optimism, with Dumb Money Confidence recently above 80% with signs of reckless speculation during what appears to be an unhealthy market environment, historically a bad combination
- Active Studies show a heavy positive skew over the medium- to long-term; breadth thrusts, recoveries, and trend changes have an almost unblemished record at preceding higher prices over a 6-12 month time frame
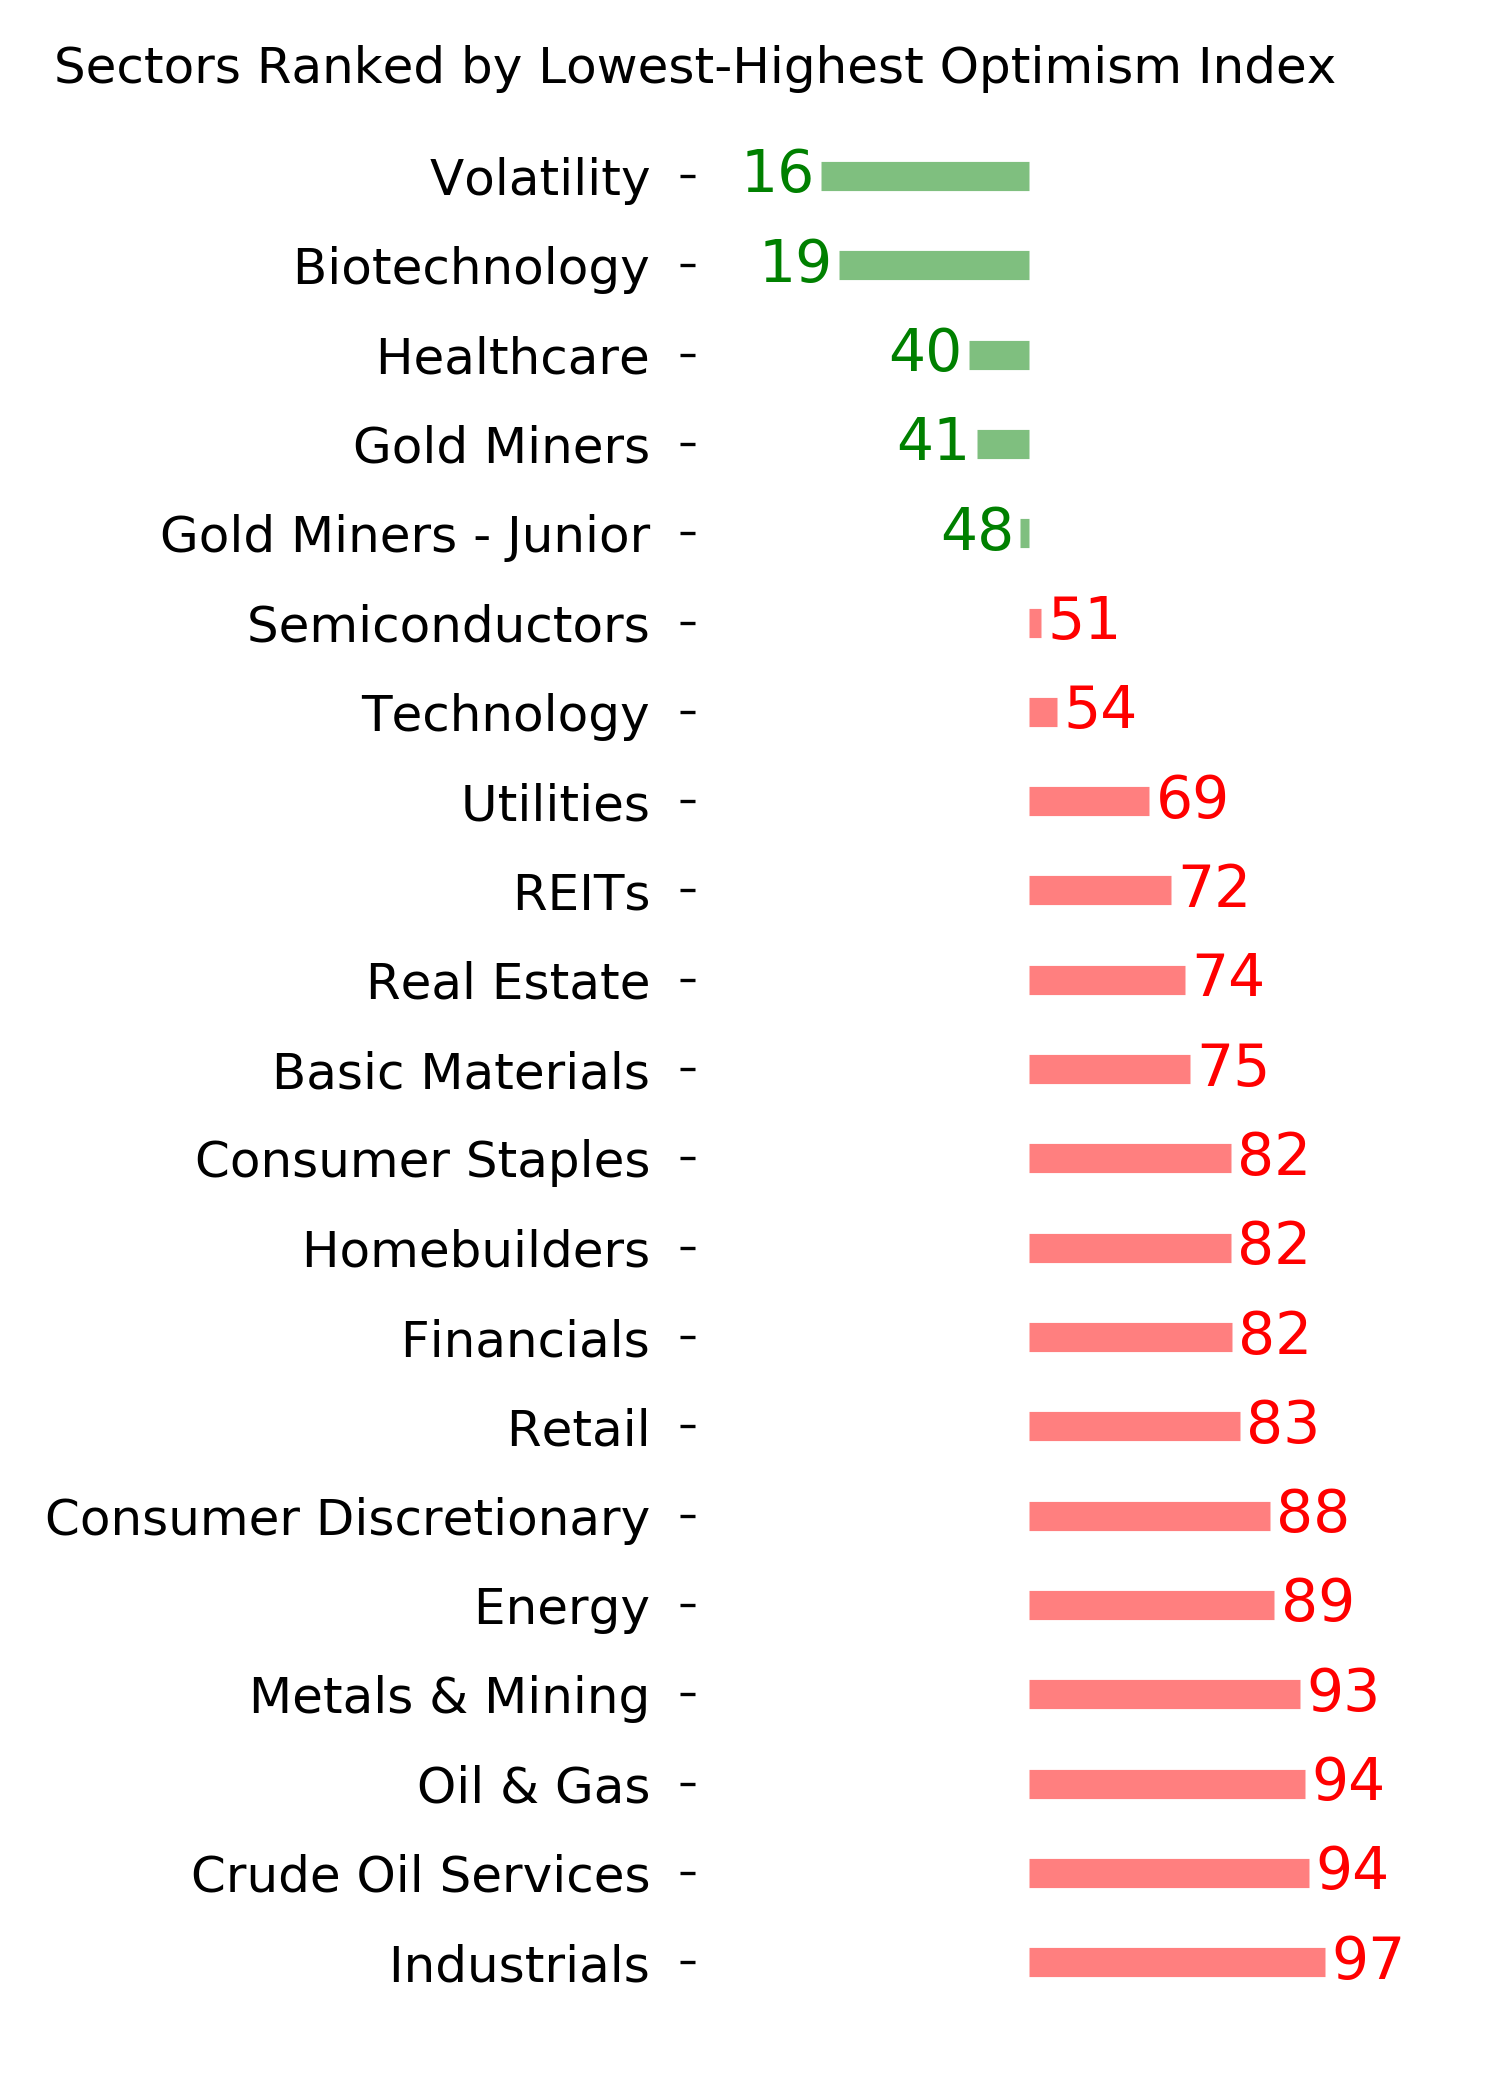
- Signs of extremely skewed preference for tech stocks neared exhaustion by late June, especially relative to industrials and financials (here and here)
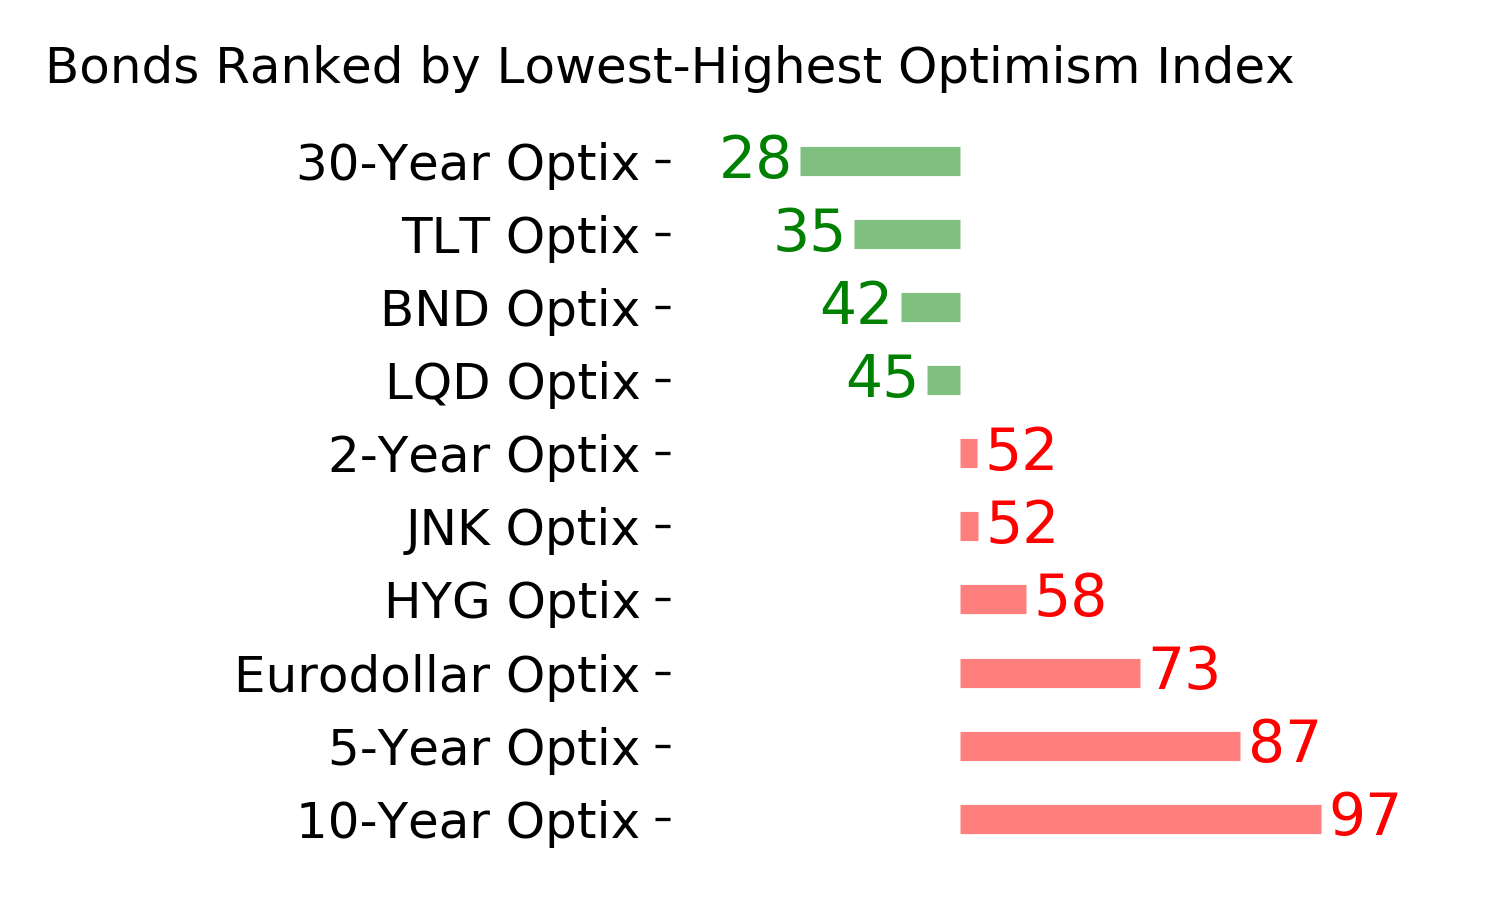
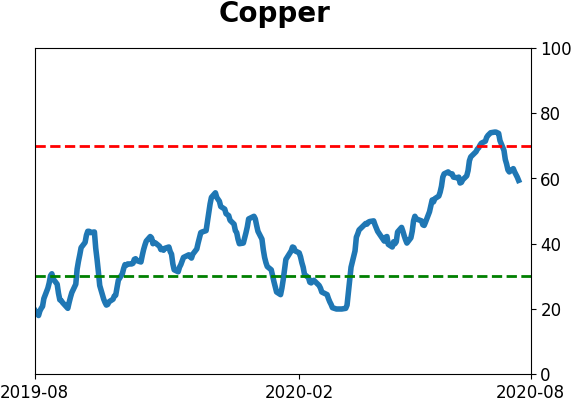
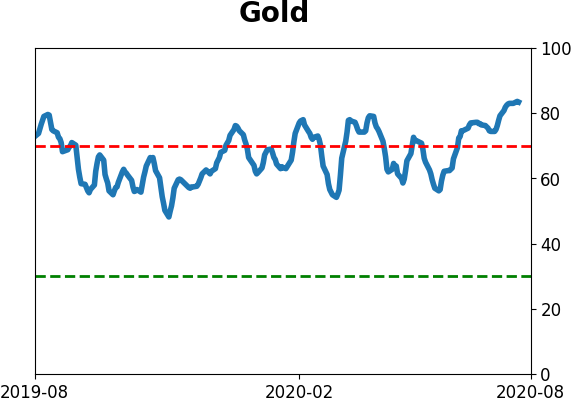
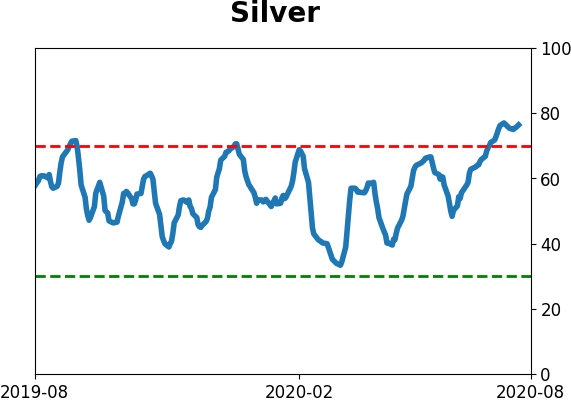
- Indicators and studies for other markets are showing less consistent forward results, though it's not a great sign for Treasuries that hedgers are net short and optimism on metals has become extreme, with "perfect" breadth among miners
|
Smart / Dumb Money Confidence
|
Smart Money Confidence: 37%
Dumb Money Confidence: 80%
|
|
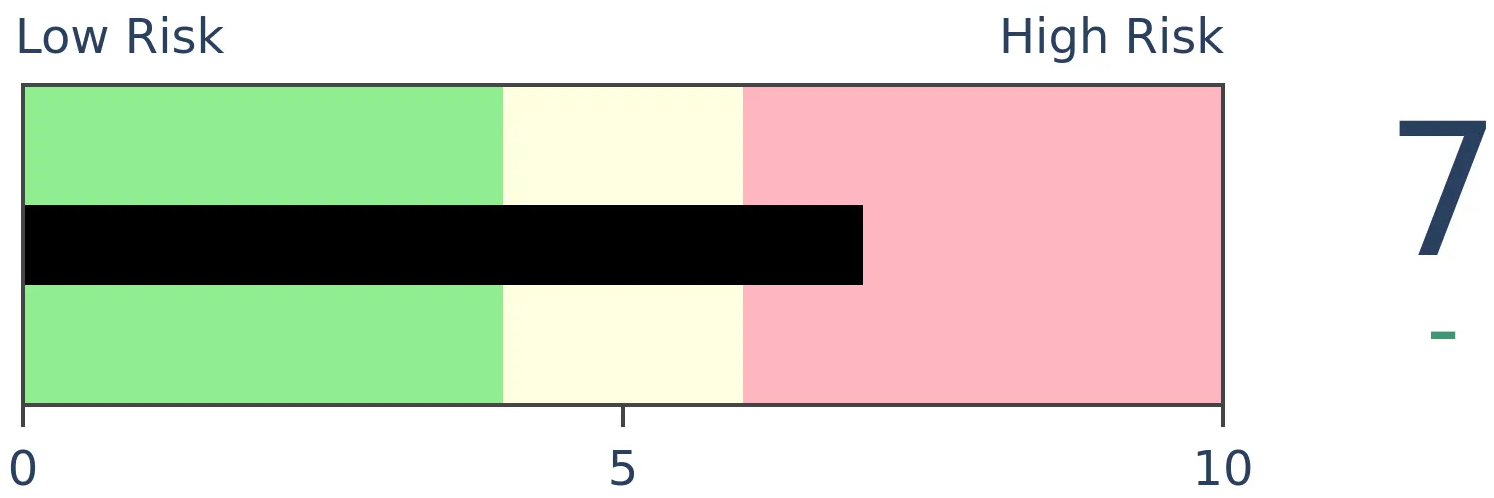
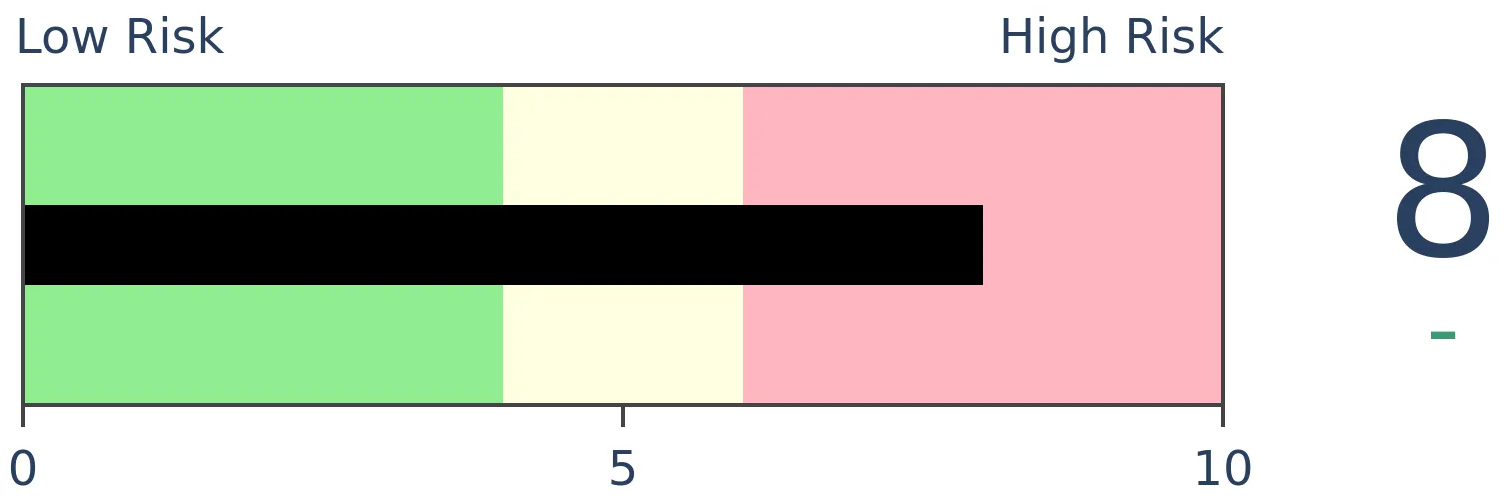
Risk Levels
Stocks Short-Term
|
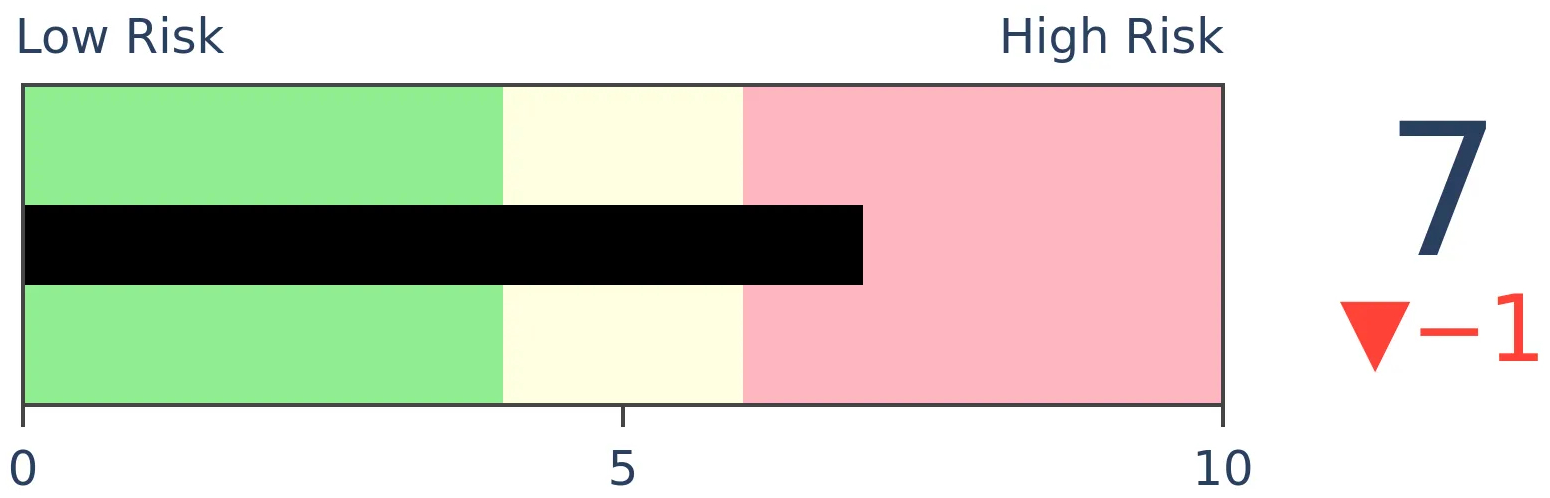
Stocks Medium-Term
|
|
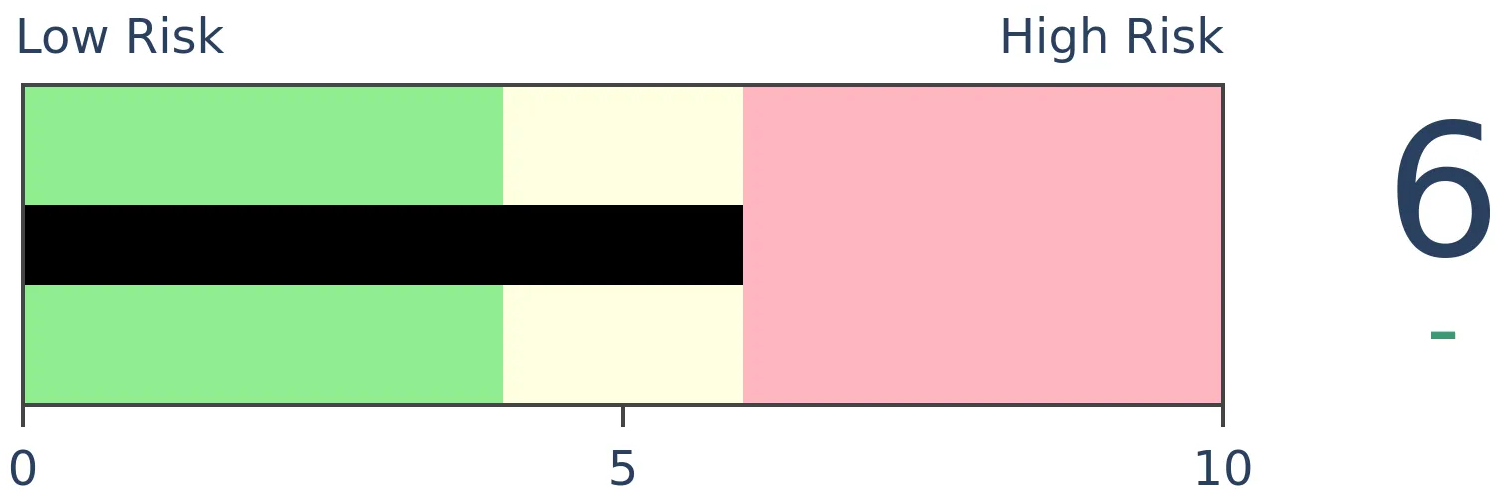
Bonds

|
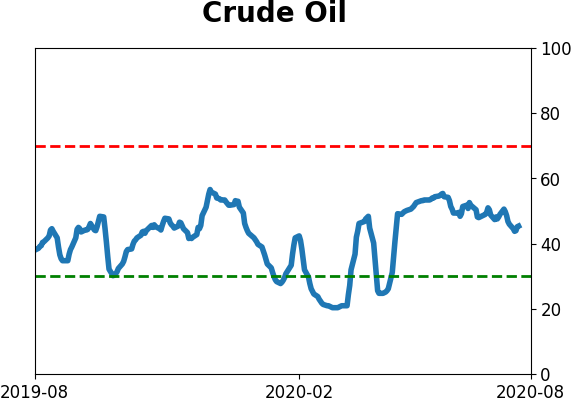
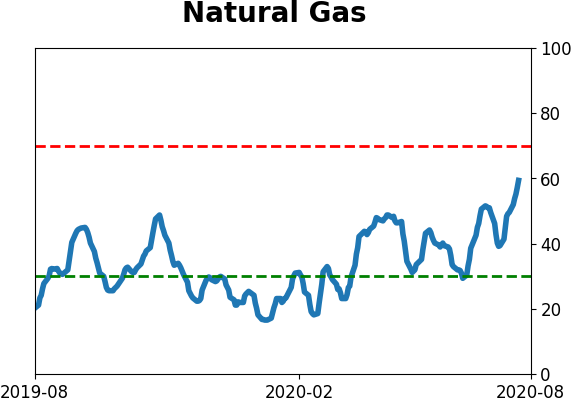
Crude Oil

|
|
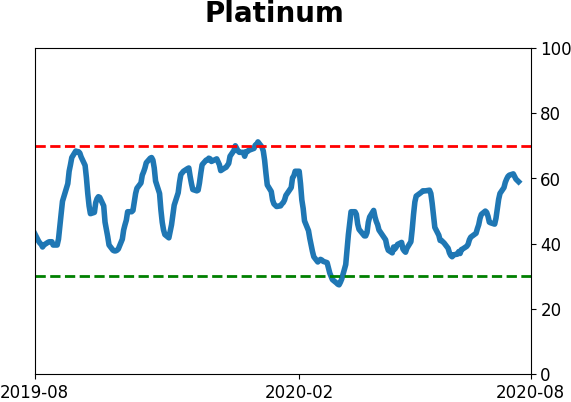
Gold
|
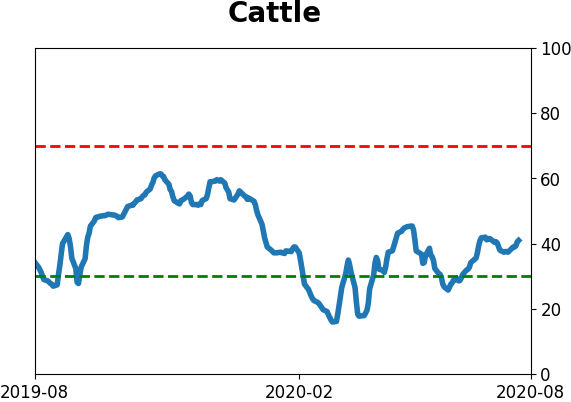
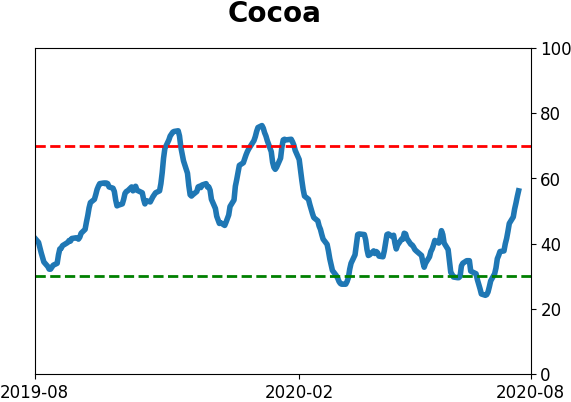
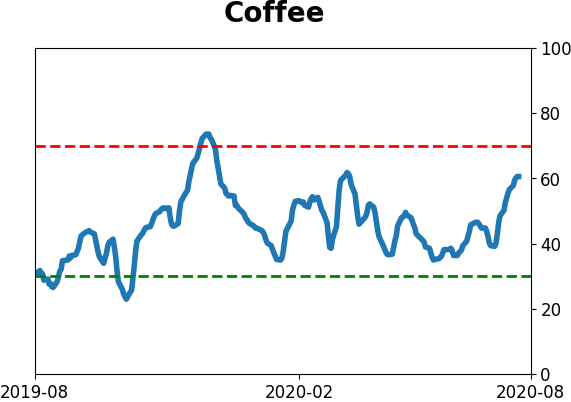
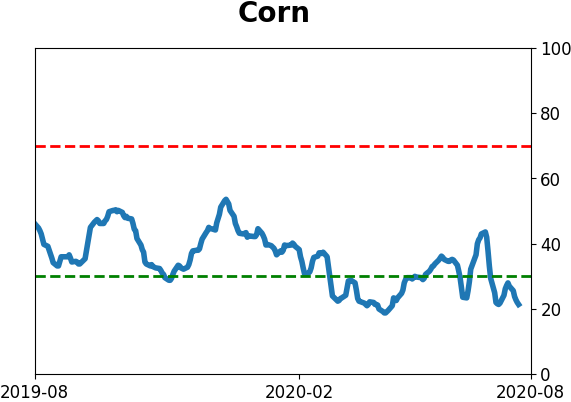
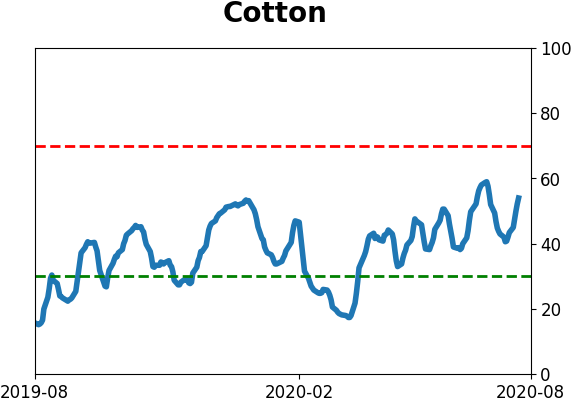
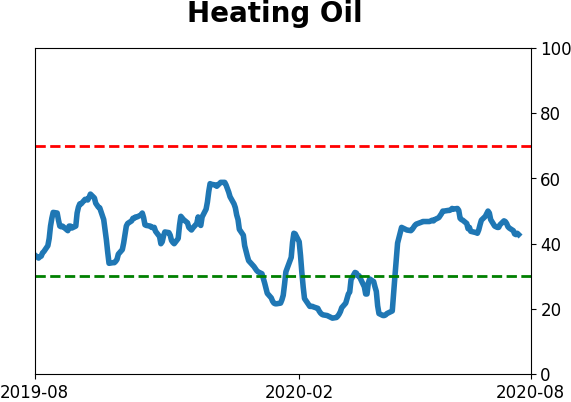
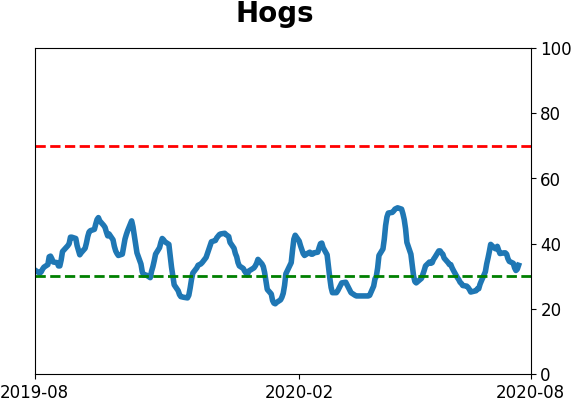
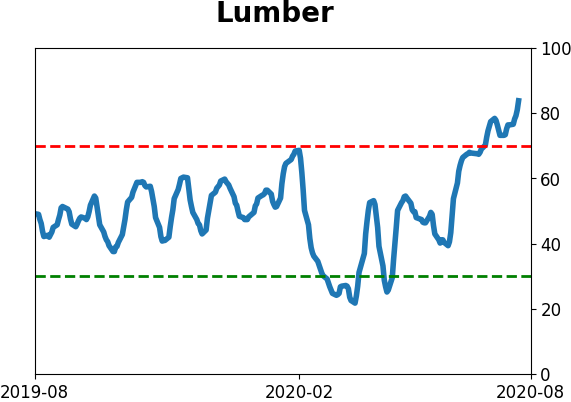
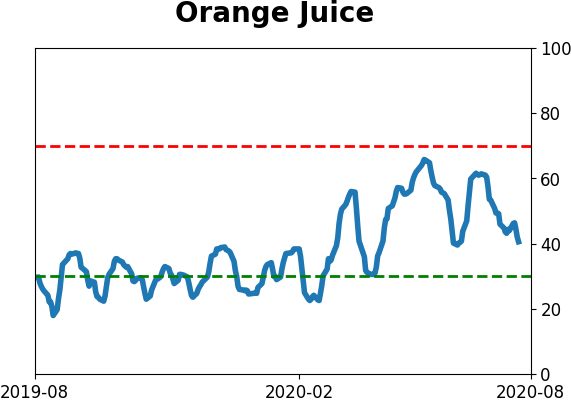
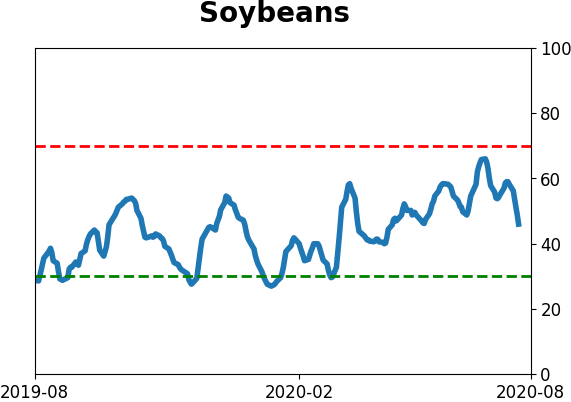
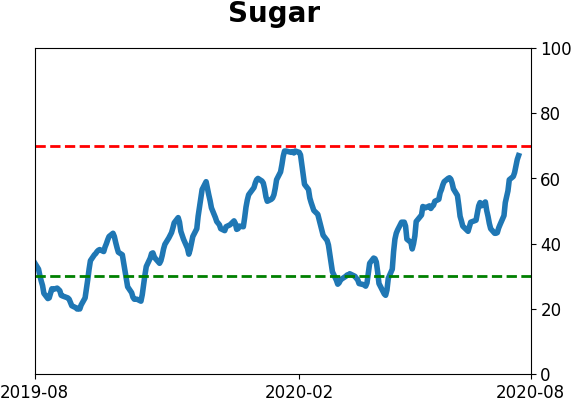
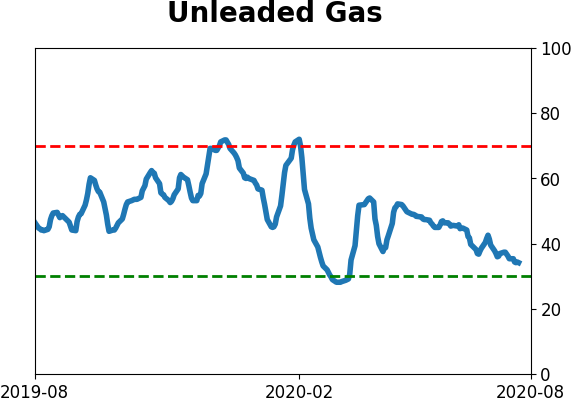
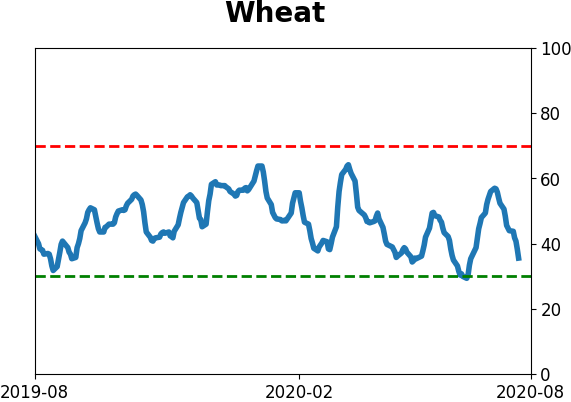
Agriculture
|
|
Research
BOTTOM LINE
The smallest of options traders (and the largest, too) have returned to their speculative ways. They've once again been buying call options while staying away from hedges. Overall speculative activity is now the highest since the spring of 2000.
FORECAST / TIMEFRAME
SPY -- Down, Medium-Term
|
Two months ago, options traders were making stunning bets that stocks would continue to rise. In 20 years, they had never behaved so aggressively. After a stumble, the S&P 500 has managed to climb above where it was then, while broader indexes like the New York Composite still remain below their June highs.
And now the traders are back.
Last week, the smallest of options traders, those using fewer than 10 contracts, spent more than half of their total volume on purchasing speculative call options. This has been consistent over the past five weeks, tying with April 2000 as the most ever.
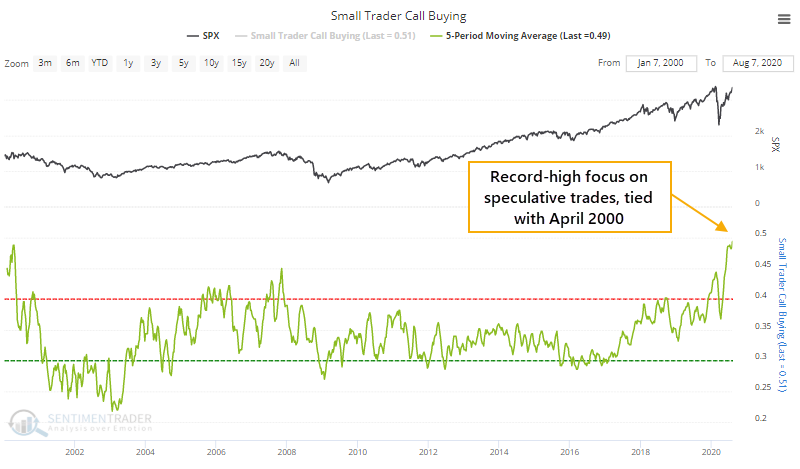
They pulled back on hedging activity last week, with less of an emphasis on put buying. So the ROBO Put/Call Ratio plunged to the lowest level since October 2007. The Backtest Engine shows poor returns following similar readings.
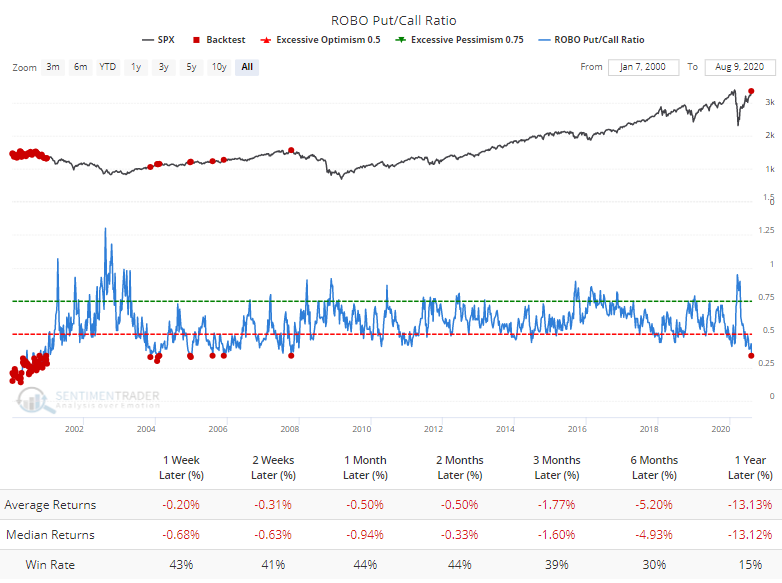
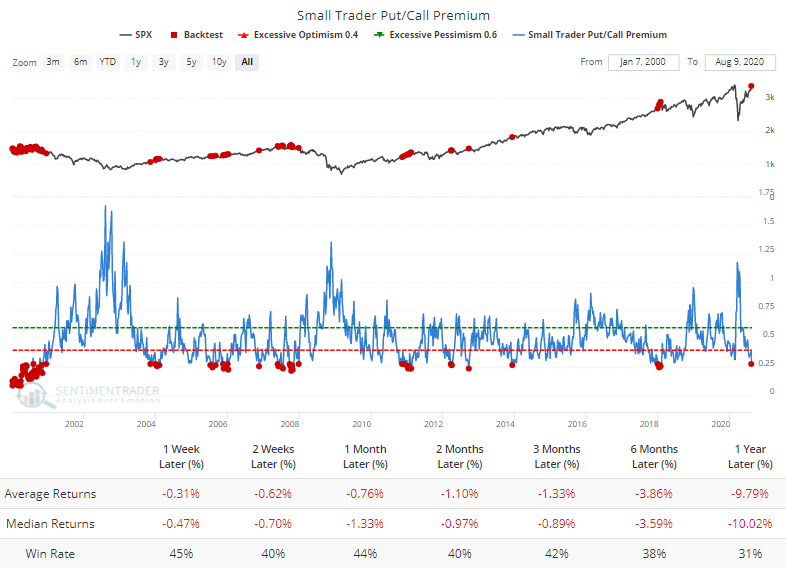
It's not only the raw volume of contracts traded that's notable, but it's also the money they're spending. The premiums that small traders are paying to jump into these call options are heavy relative to the amount of money they're spending on hedging activity. The Put/Call Premium has fallen to an extremely low level and the S&P has struggled after similar readings.
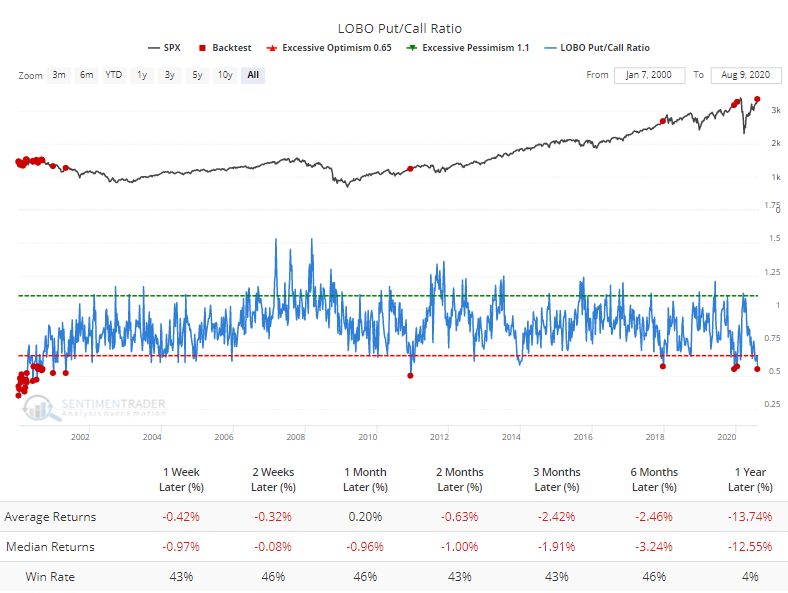
The largest of options traders, those using 50 contracts or more, never get as enthusiastic as the smallest traders. But even they are showing one of the most extreme skews toward speculative activity in 20 years, which has also preceded poor returns.
The most comprehensive options indicator we follow, the Options Speculation Index, takes into account trading activity among all traders on all U.S. exchanges and compares the volume flowing into bullish strategies versus bearish ones. It just spiked to 1.63, meaning that traders opened 63% more bullish strategies than bearish ones last week. We haven't seen this kind of behavior since the spring of 2000.
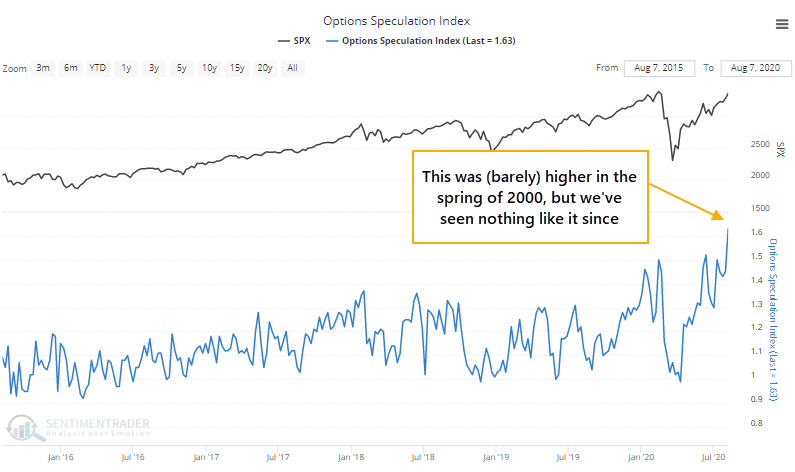
There isn't any way to put a positive spin on this kind of behavior. Perhaps if we've just entered some kind of 1999-style speculative orgy that will lead to an exponential rise then exponential fall, maybe. More likely is just a tough market for new bulls to hold onto shorter-term gains. Even though some recent extremes have failed to lead to much weakness in the popular indexes, it would be exceptionally unusual to see stocks continue to power higher without interruption after seeing such confidence among traders using speculative, leveraged, expiring instruments.
BOTTOM LINE
After a near-record amount of volatility in March and April, stock swings have calmed down. The S&P 500's average true range over a 5-day span dropped to less than 1% for the first time in months. That hasn't been a reliable sign that calm conditions would necessarily last.
FORECAST / TIMEFRAME
None
|
In March and April, we spent a lot of time looking at the historic volatility in indexes and stocks. On some measures, it was the most volatile stretch in history, with the others essentially showing a perfect record of higher prices over the next 6-12 months.
Since then, volatility has ebbed. As Troy showed in a premium note, the VIX has declined for 16 out of the past 20 weeks, a record stretch. The four other times it declined 15 out of 20 weeks, it jumped during the next 2-4 weeks.
Over the past week, in particular, stocks have calmed down. The 5-day average true range for the S&P 500 dropped below 1% for the first time in months. The end of August is often the least volatile, with the lowest volume, out of the entire year (including holidays) but this is early.
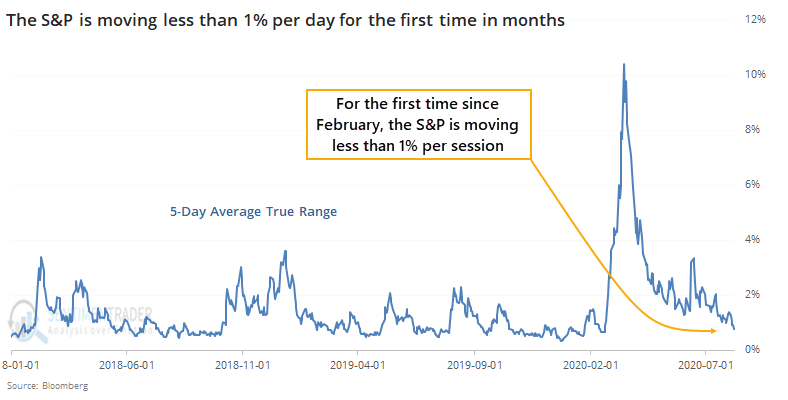
Of course, this follows what had been one of the wildest periods ever.
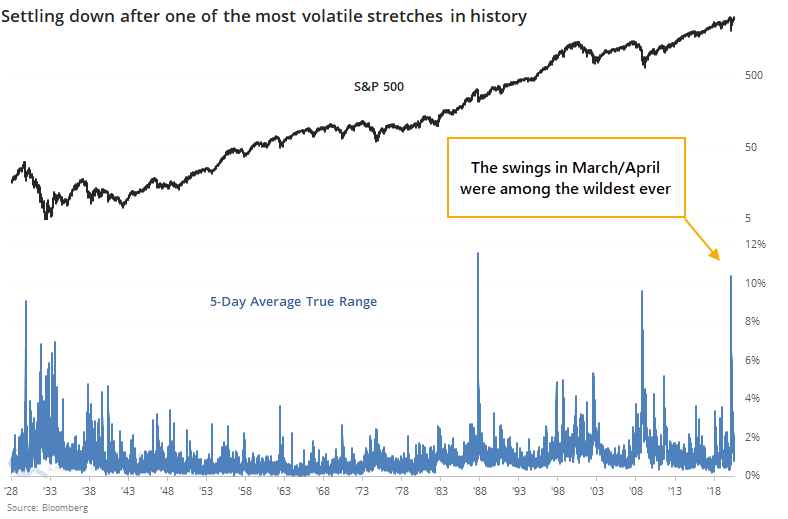
Once the S&P's average true range cycles from above 4% to below 1%, theory suggests that investors have come to grips with whatever crisis was at the forefront at the time, ostensibly ushering in calmer conditions and higher prices.
Let's check.
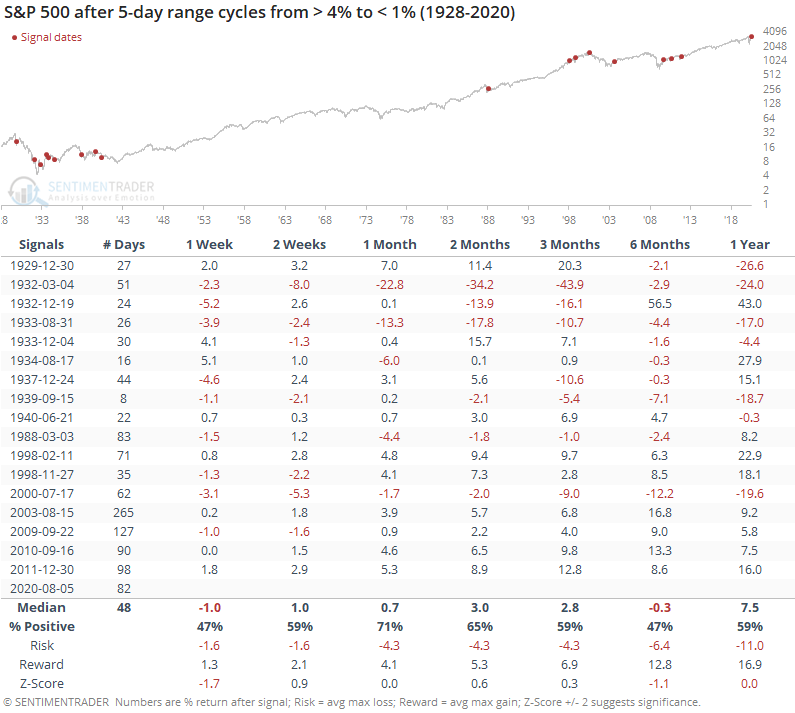
An argument could be made that this is the case, as the S&P rose most of the time, across most time frames. It was no slam dunk, however, and six months later it was down more often than up, with a poor average return.
The risk/reward skew across all time frames was poor as well, though much of that is due to the multiple signals in the 1930s. In recent decades, it has been more of a medium- to long-term positive, but with worse performance shorter-term.
Prior to the last 5 years or so, very narrow ranges, on light volume, as stocks neared previous highs was a decent suggestion that selling pressure was about to hit. Price and volume patterns have become less reliable in recent years, however, and we wouldn't place much weight on that.
There also isn't much evidence that this new regime of calm is necessarily a good sign for bulls - the best signals triggered coming out of major declines, which we have. And some of the worst came when stocks were near their highs, which we are. Seems like a wash.
Active Studies
| Time Frame | Bullish | Bearish | | Short-Term | 0 | 1 | | Medium-Term | 8 | 12 | | Long-Term | 46 | 1 |
|
Indicators at Extremes
Portfolio
| Position | Weight % | Added / Reduced | Date | | Stocks | 29.8 | Reduced 9.1% | 2020-06-11 | | Bonds | 0.0 | Reduced 6.7% | 2020-02-28 | | Commodities | 5.2 | Added 2.4%
| 2020-02-28 | | Precious Metals | 0.0 | Reduced 3.6% | 2020-02-28 | | Special Situations | 0.0 | Reduced 31.9% | 2020-03-17 | | Cash | 65.0 | | |
|
Updates (Changes made today are underlined)
After stocks bottomed on March 23rd, they enjoyed a historic buying thrust and retraced a larger amount of the decline than "just a bear market rally" tends to. Through June, there were signs of breadth thrusts, recoveries, and trend changes that have an almost unblemished record at preceding higher prices over a 6-12 month time frame. On a shorter-term basis, our indicators have been showing high optimism, with Dumb Money Confidence recently above 80%, along with signs of reckless speculation during what appears to be an unhealthy market environment, historically a bad combination. While there are certainly some outlier indicators that are showing apathy or even outright pessimism, a weight-of-the-evidence approach suggests high risk over a multi-week to multi-month time frame. I've been carrying a low (too low) level of exposure to stocks, as well as bonds and gold. I don't see a good opportunity to add to any of those currently, with poor prospects pretty much all the way around. As worried as I am over the medium-term, I would only grudgingly reduce my exposure even further given the longer-term positives we spent so much time discussing in the spring. At this point, I would only look seriously at lowering exposure further if the S&P 500 drops below approximately 3220, an initial sign that its recent mini-breakout had failed.
RETURN YTD: -2.8% 2019: 12.6%, 2018: 0.6%, 2017: 3.8%, 2016: 17.1%, 2015: 9.2%, 2014: 14.5%, 2013: 2.2%, 2012: 10.8%, 2011: 16.5%, 2010: 15.3%, 2009: 23.9%, 2008: 16.2%, 2007: 7.8%
|
|
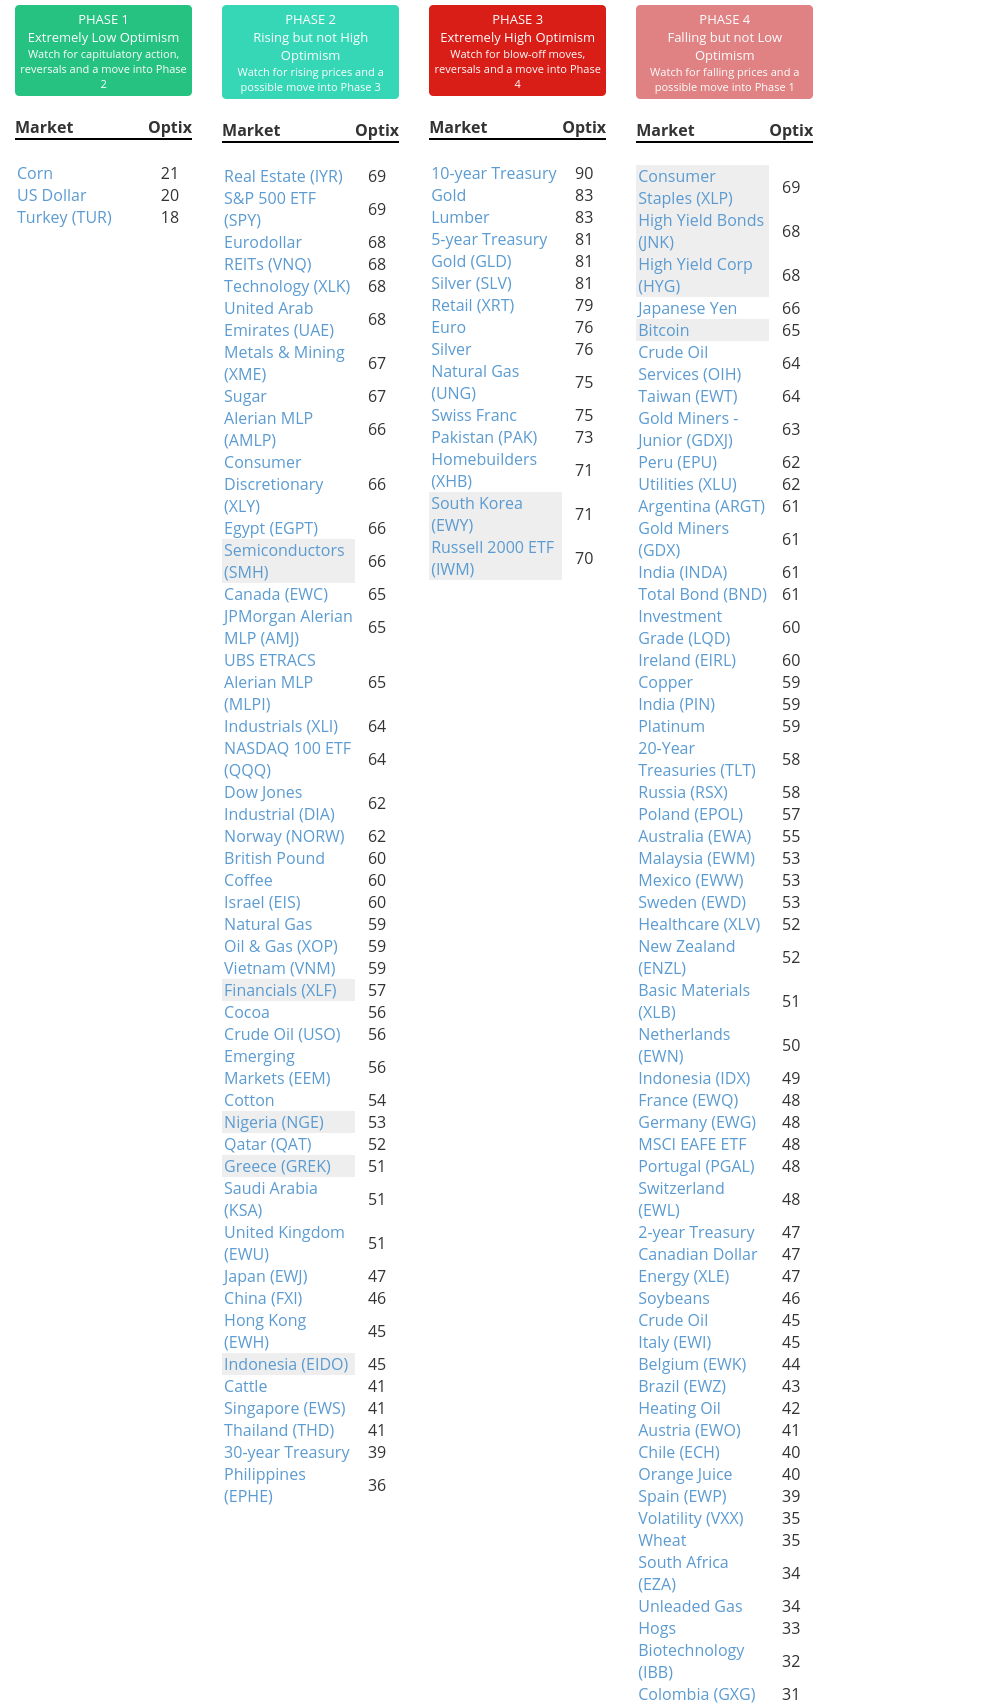
Phase Table
Ranks
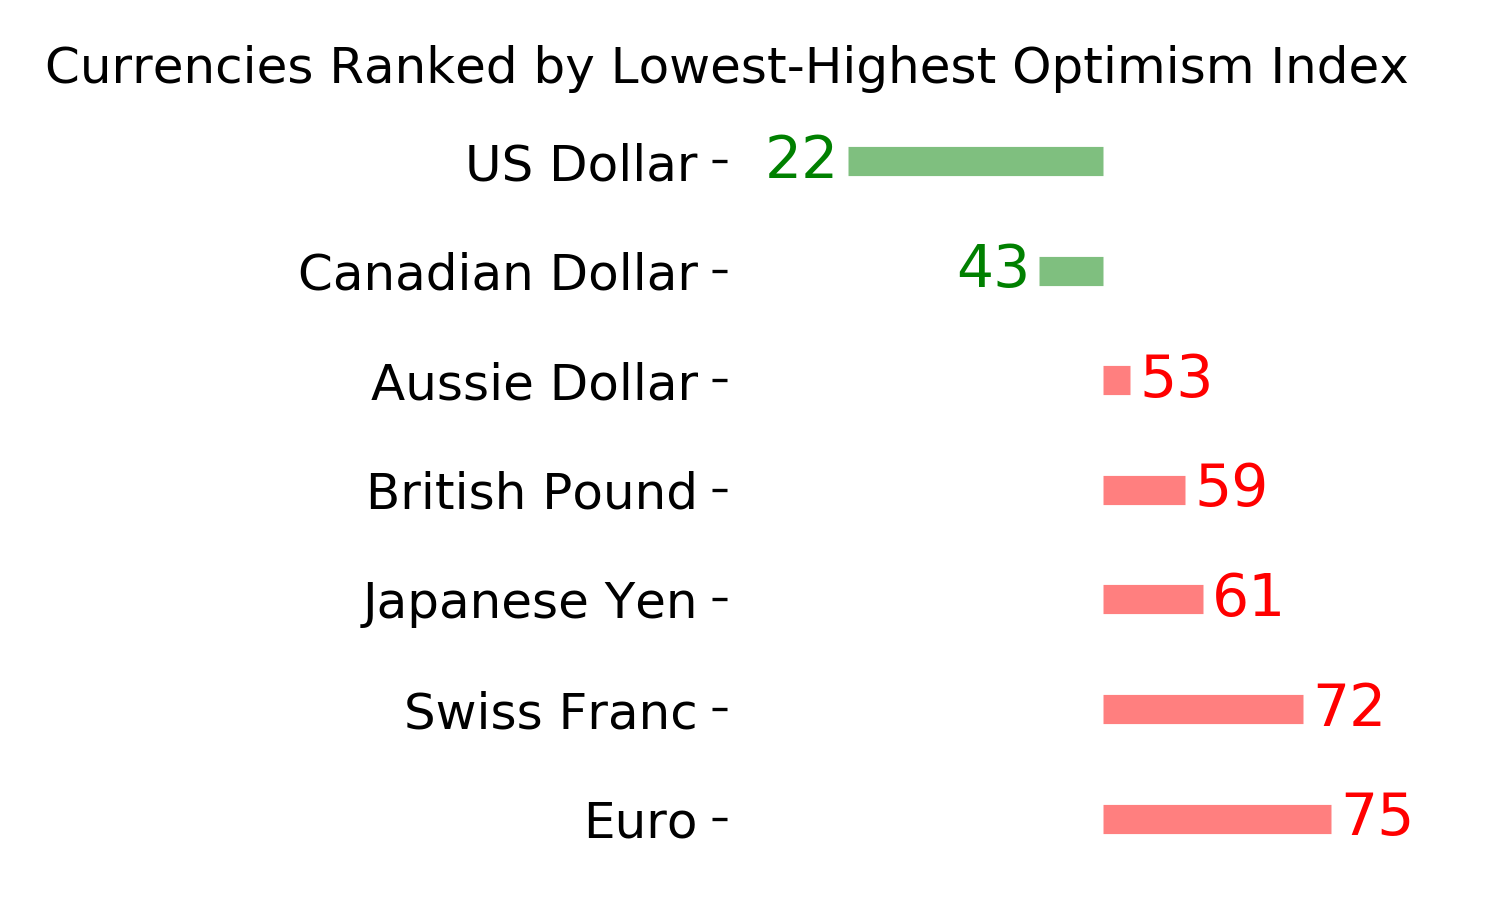
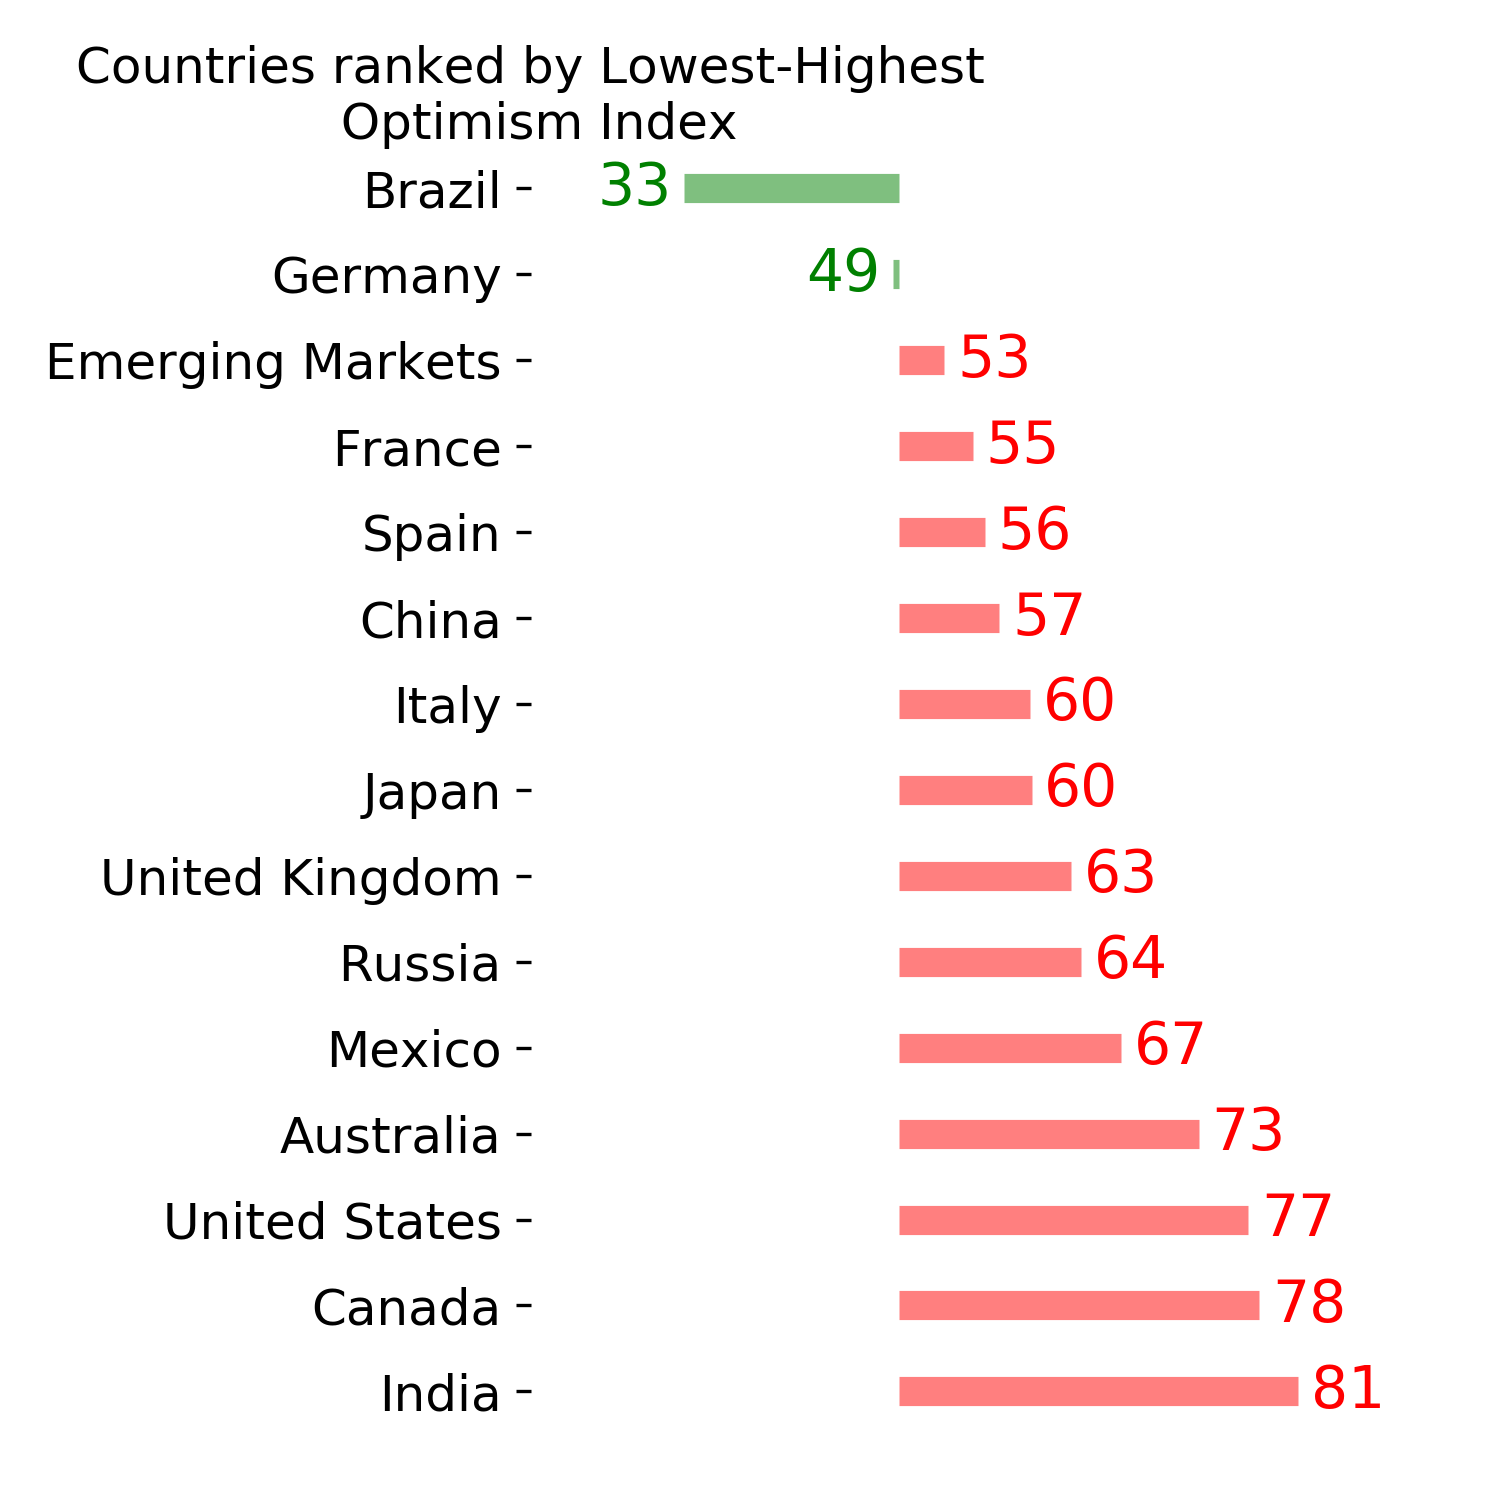
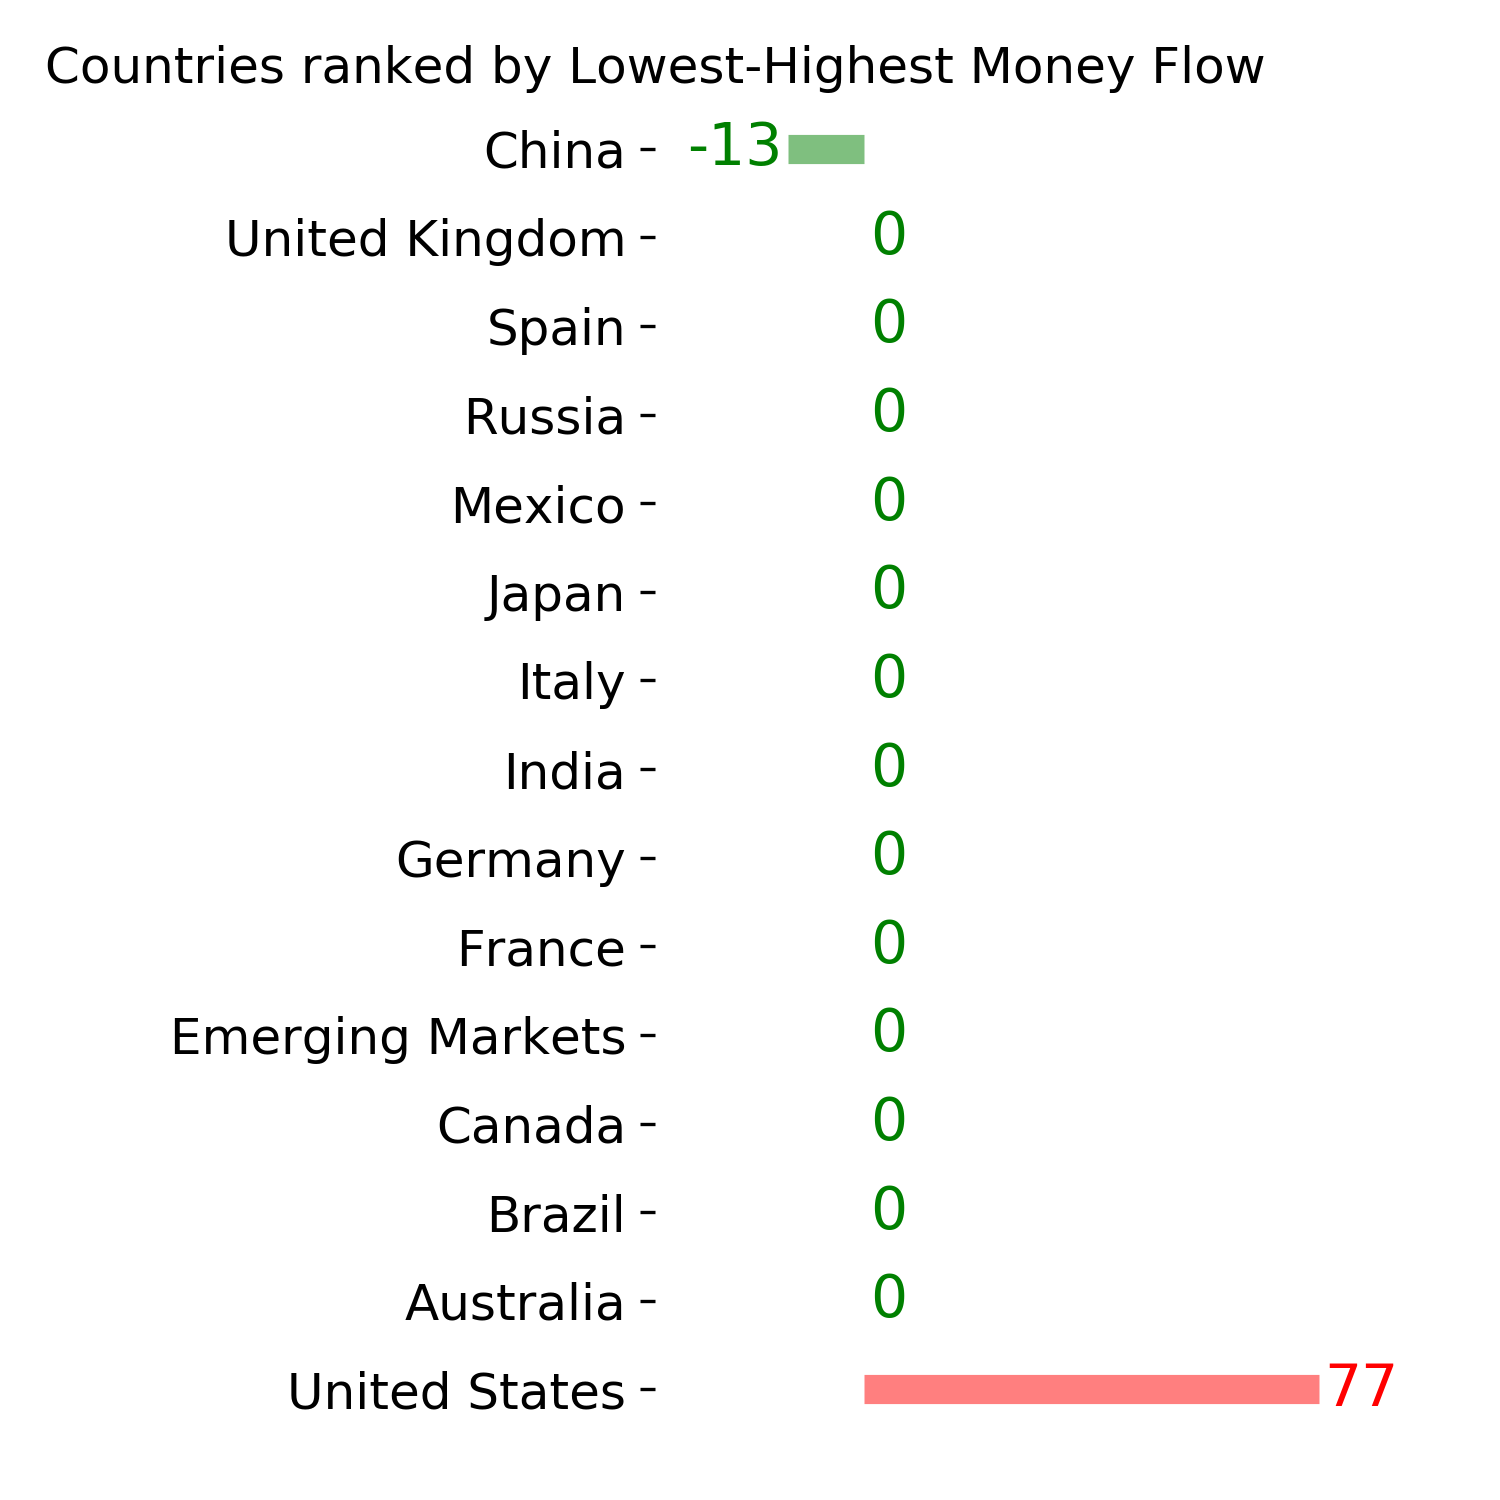
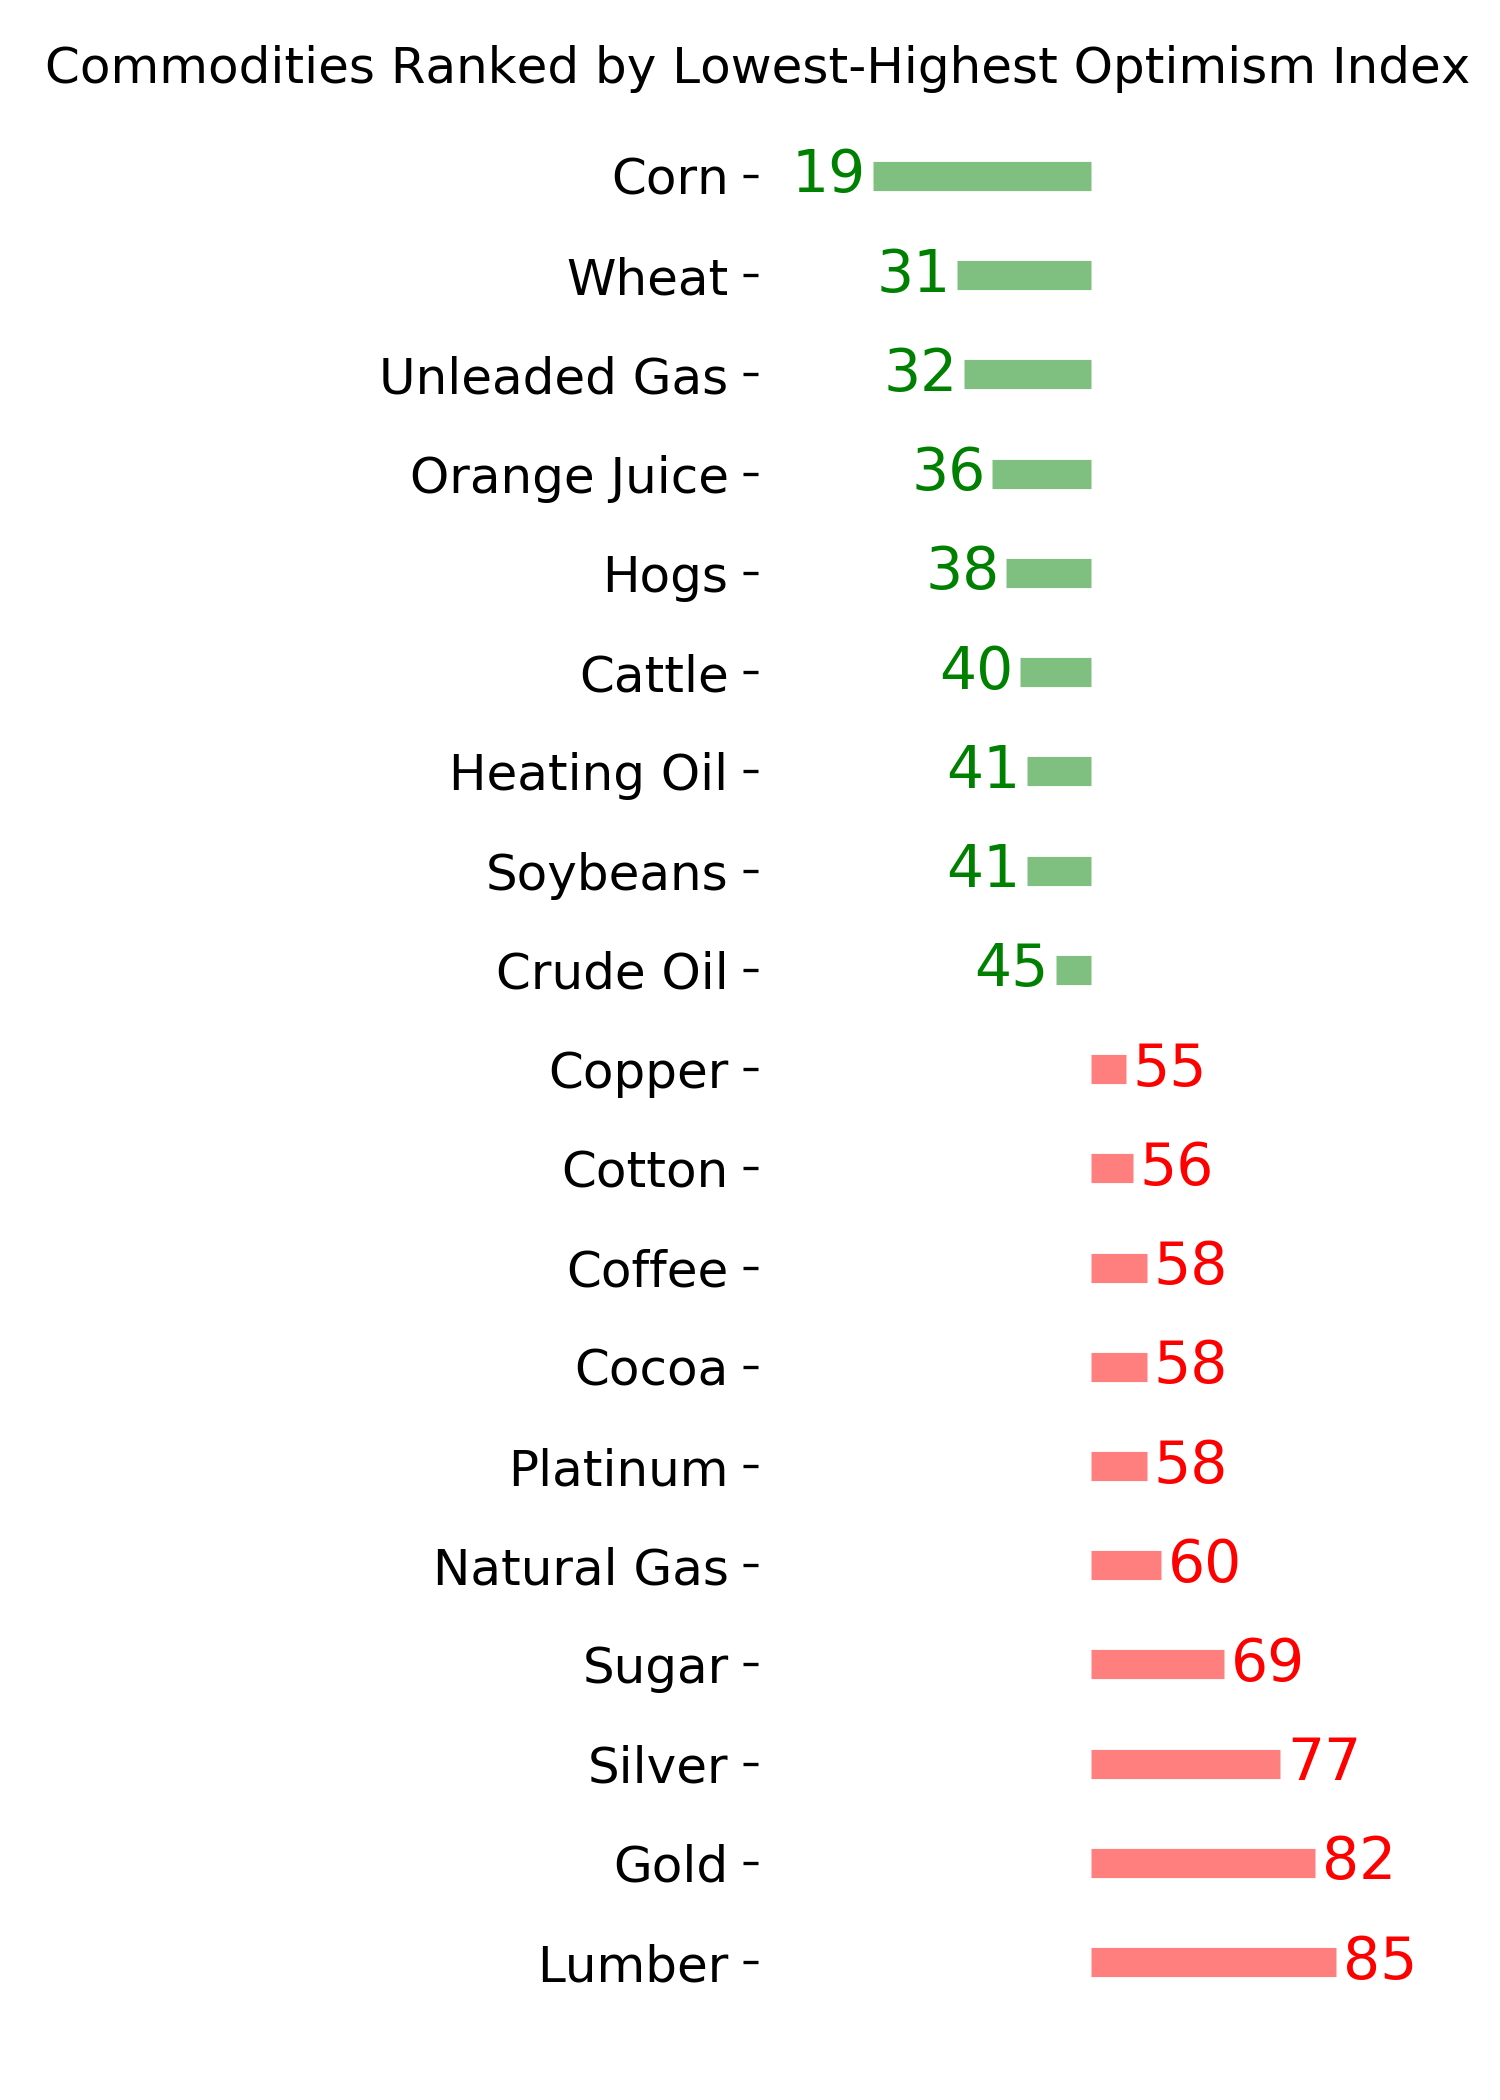
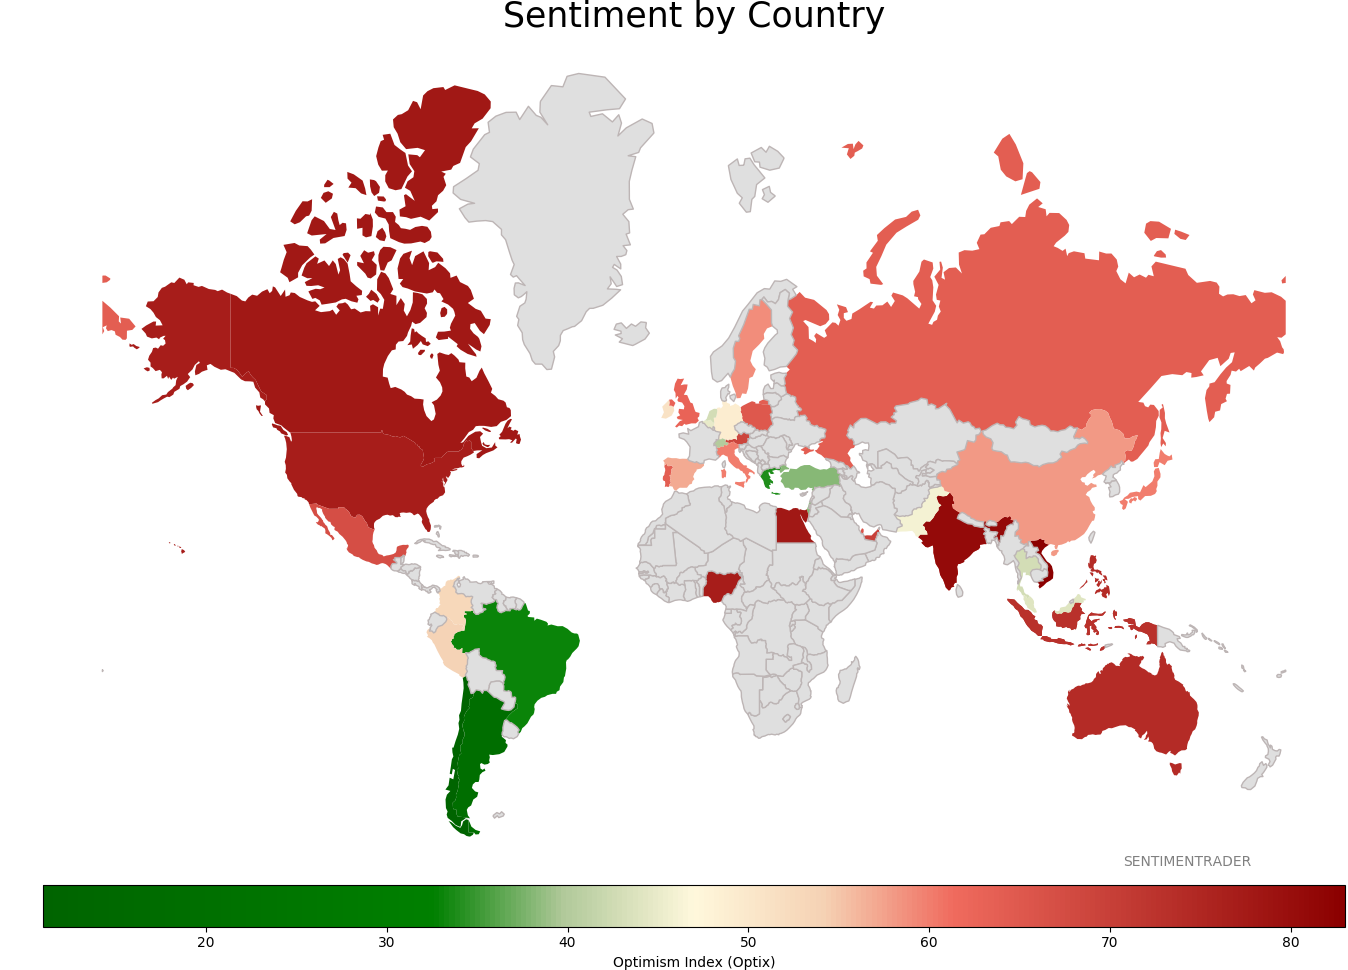
Sentiment Around The World
Optimism Index Thumbnails
|
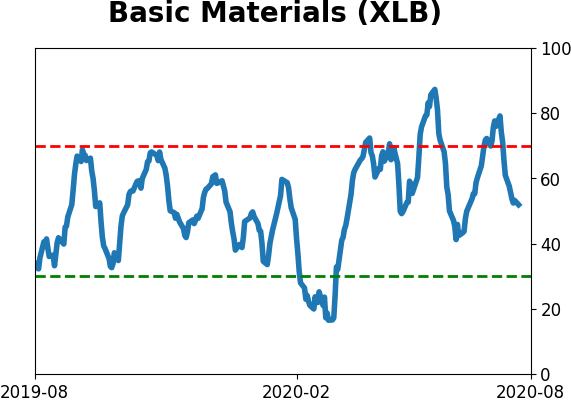
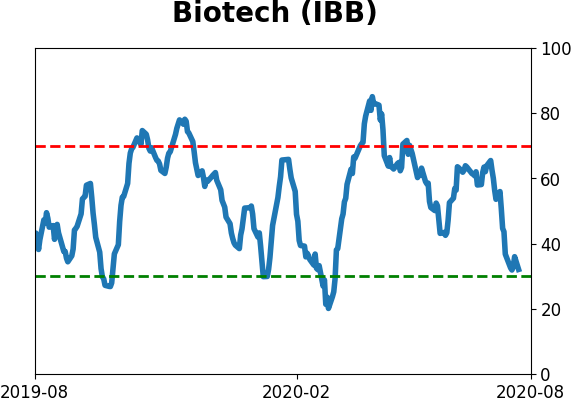
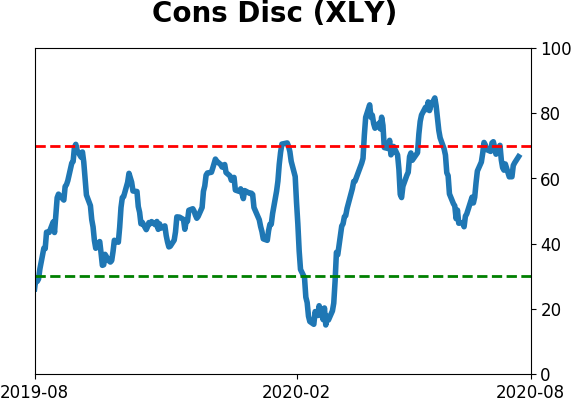
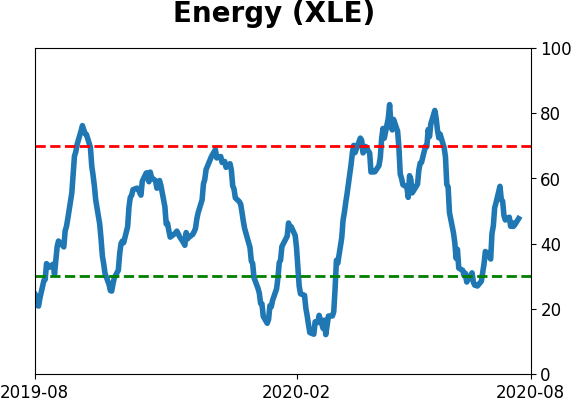
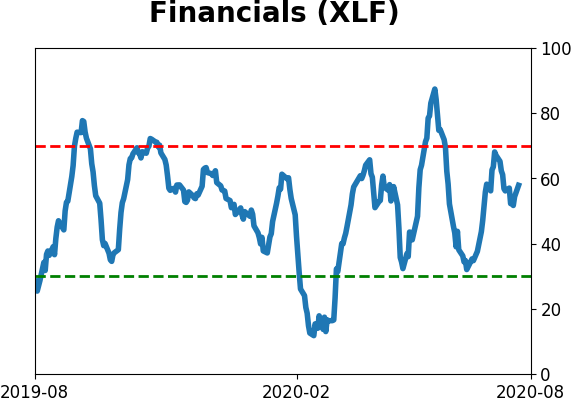
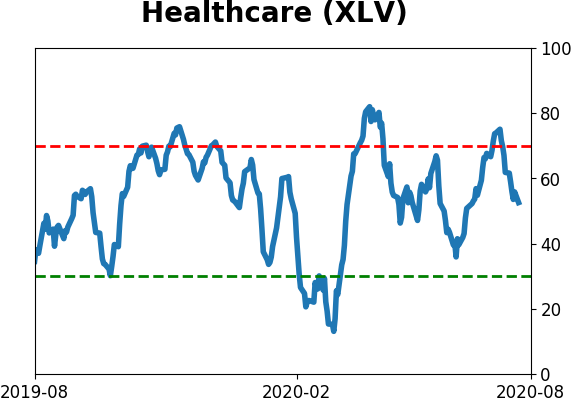
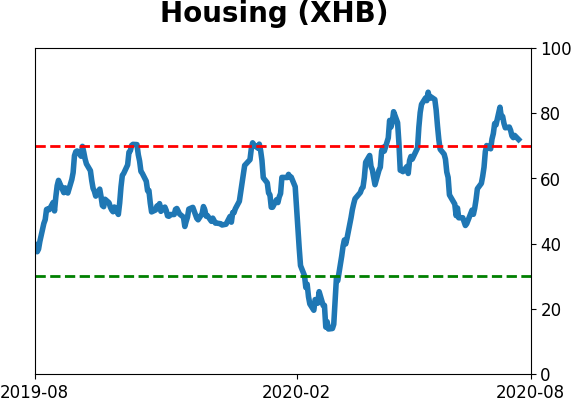
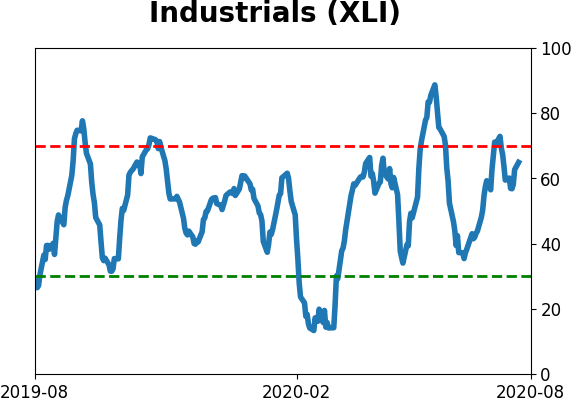
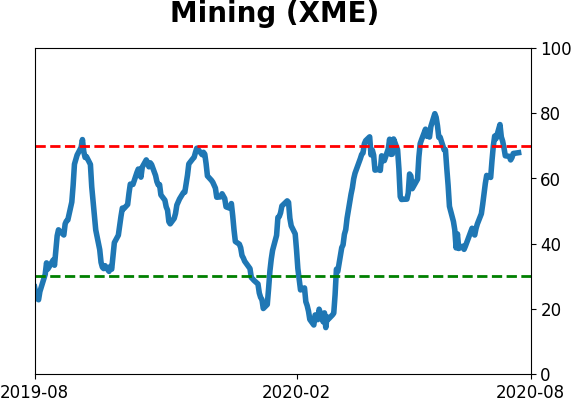
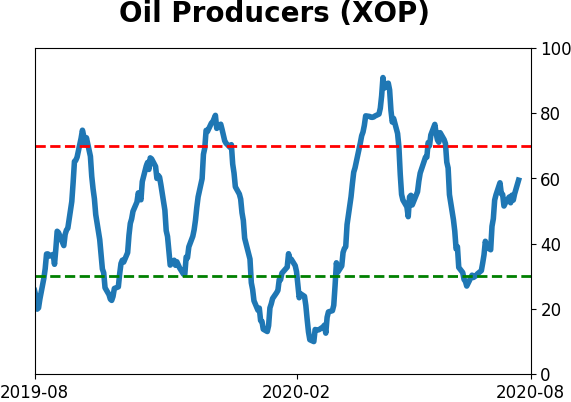
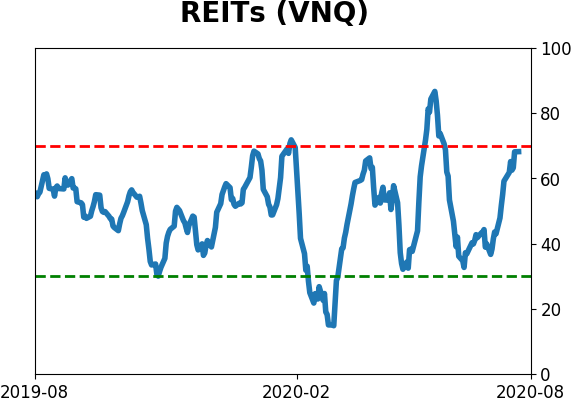
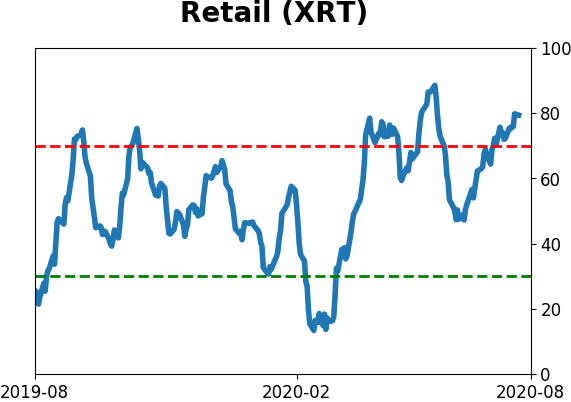
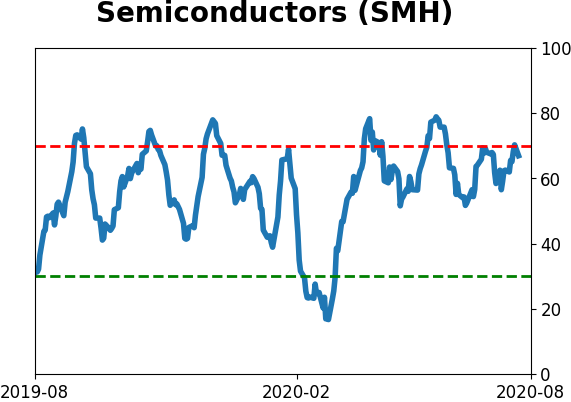
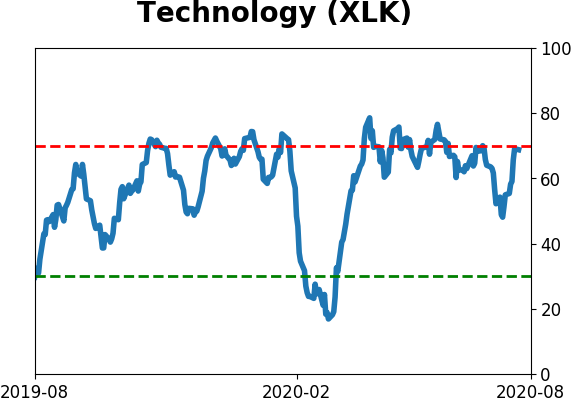
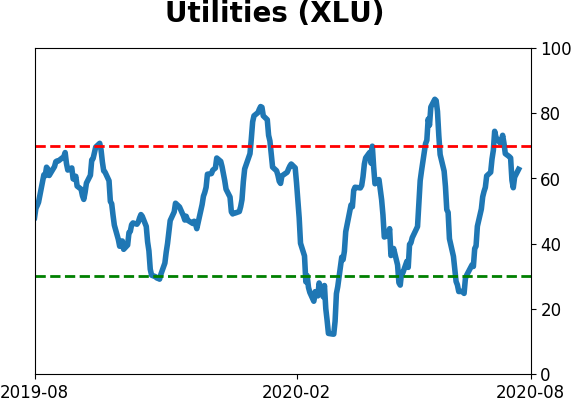
Sector ETF's - 10-Day Moving Average
|
|
|
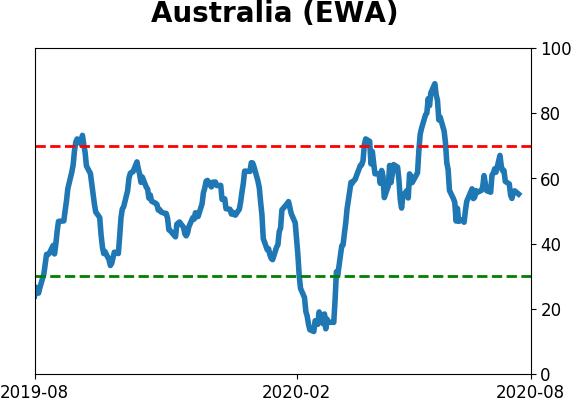
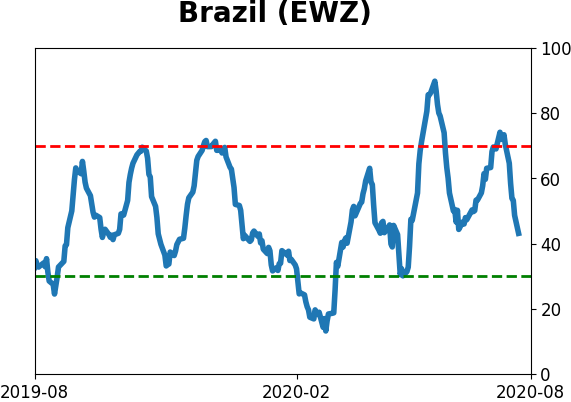
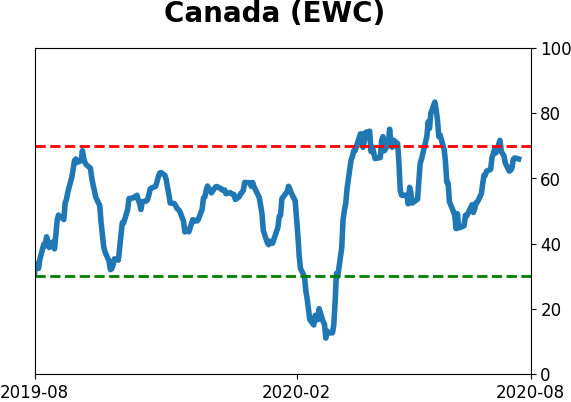
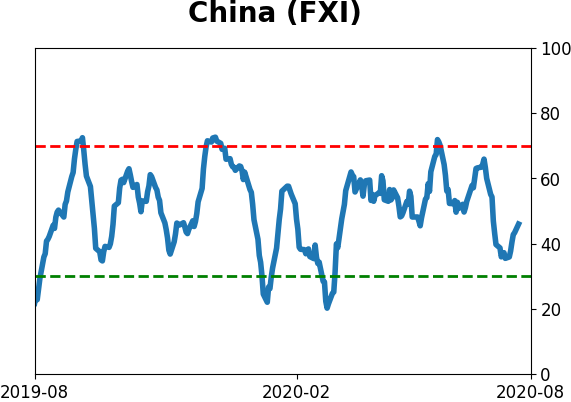
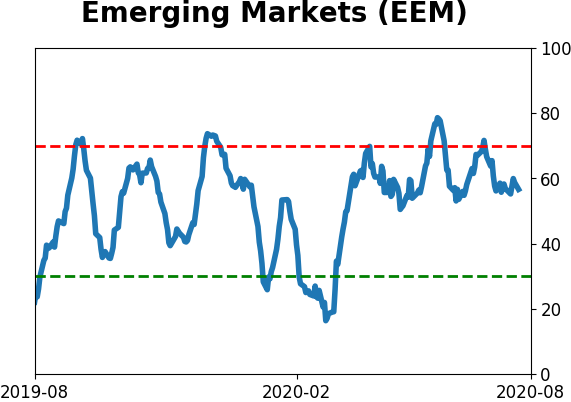
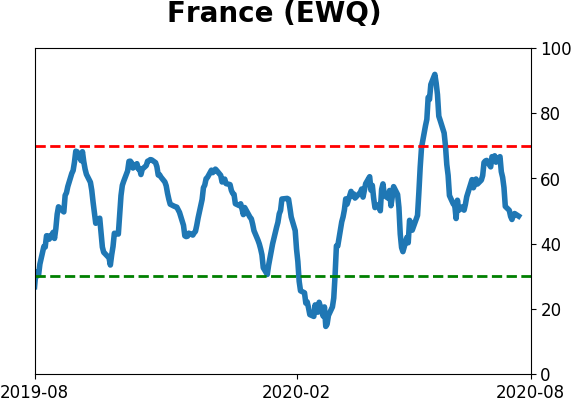
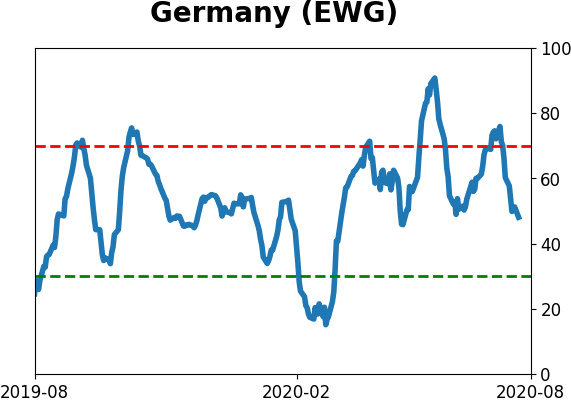
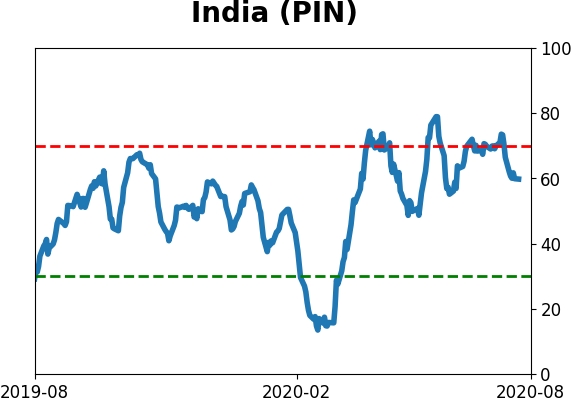
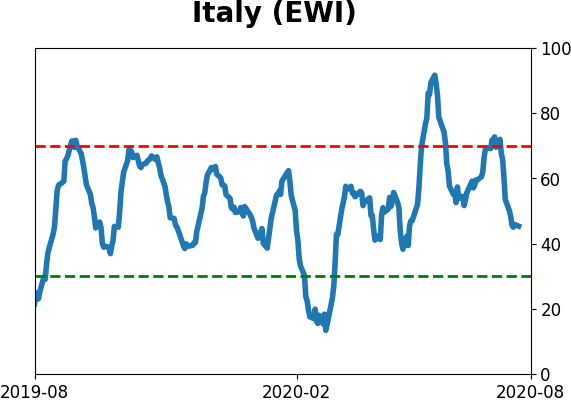
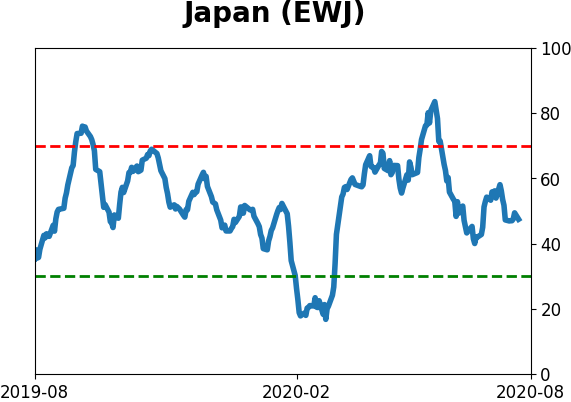
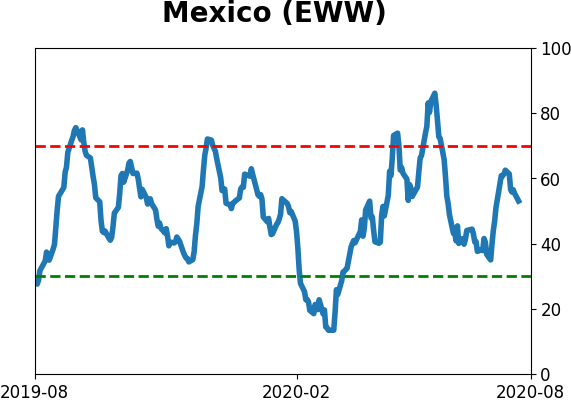
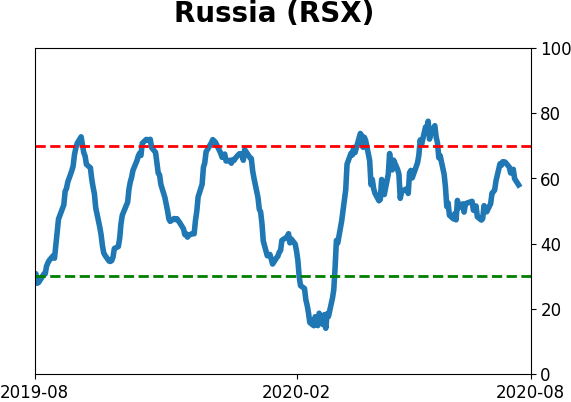
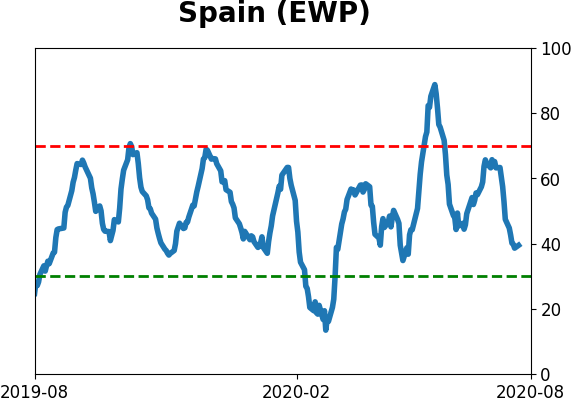
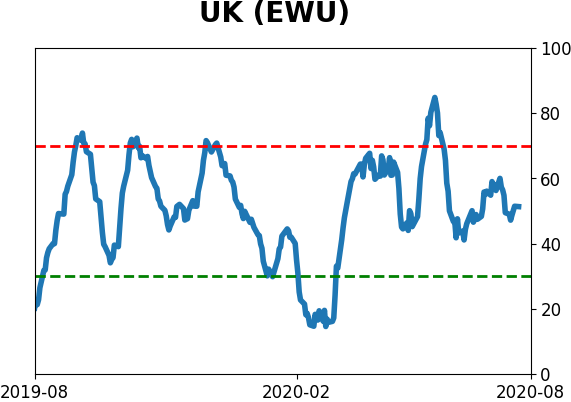
Country ETF's - 10-Day Moving Average
|
|
|
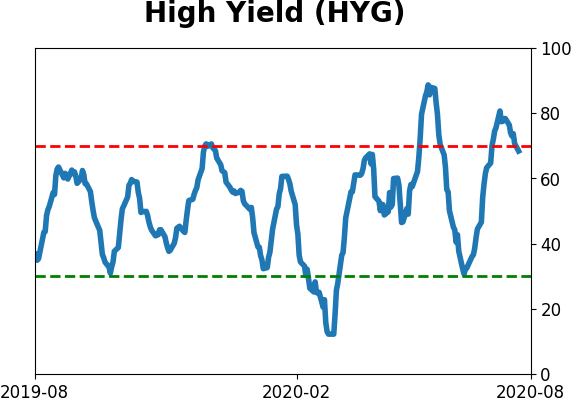
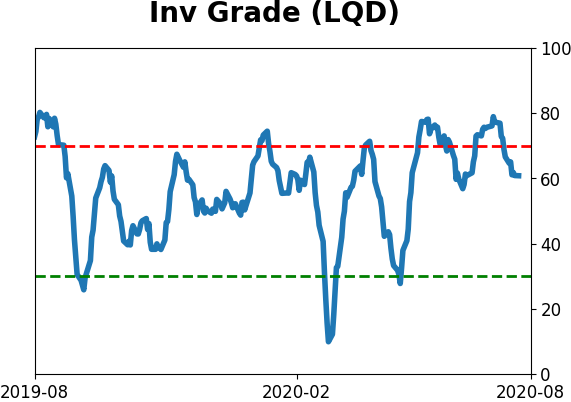
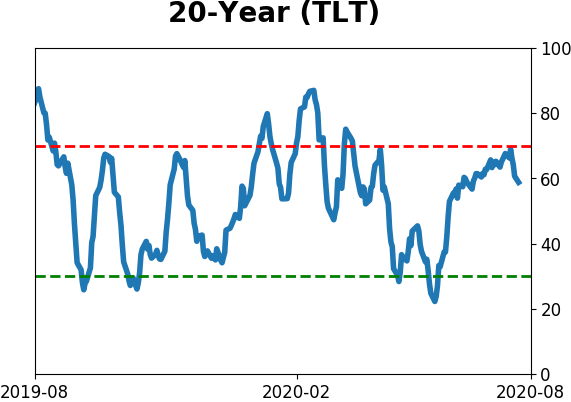
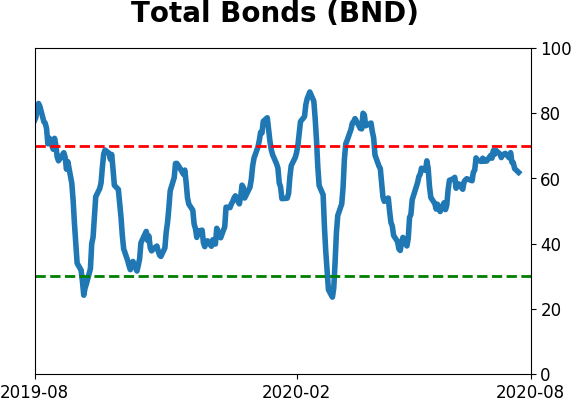
Bond ETF's - 10-Day Moving Average
|
|
|
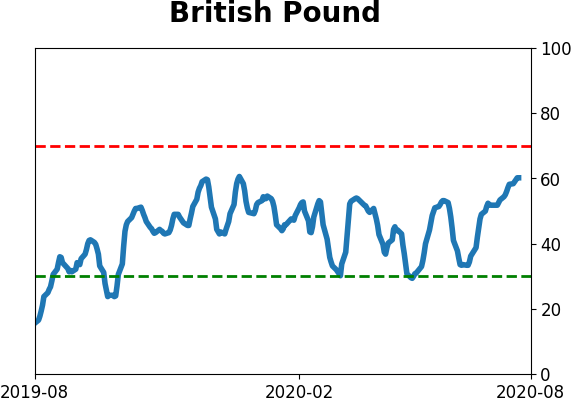
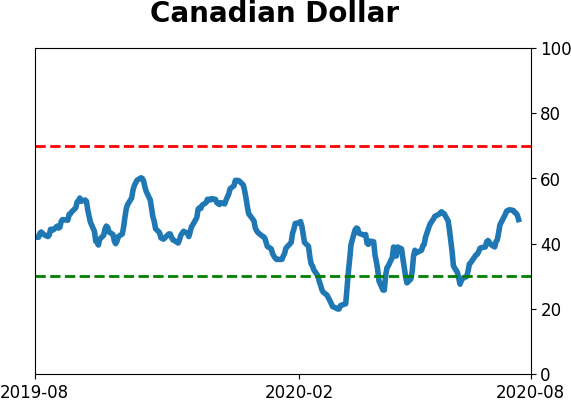
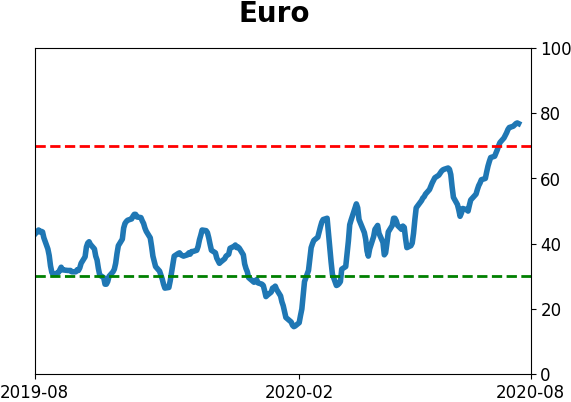
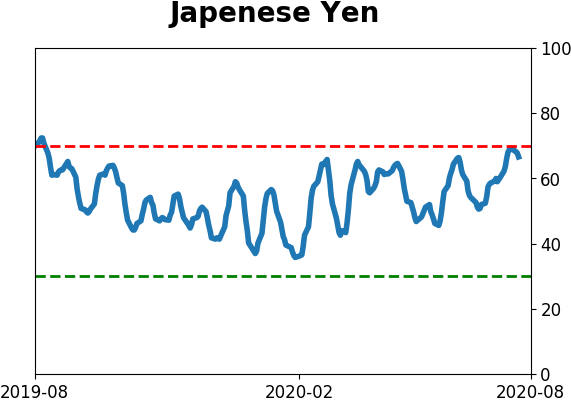
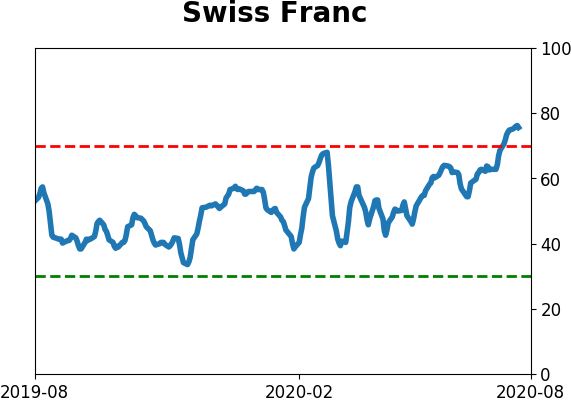
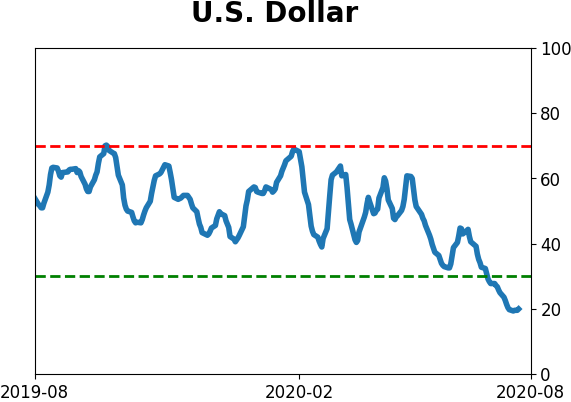
Currency ETF's - 5-Day Moving Average
|
|
|
Commodity ETF's - 5-Day Moving Average
|
|