Headlines
|
|
Gold optimism finally takes a header:
Optimism on gold, silver, and miners was extremely high in late July and early August. Their punishing losses in recent days has caused a tumble in sentiment, which usually has meant that there is more room to go before the excesses are unwound.
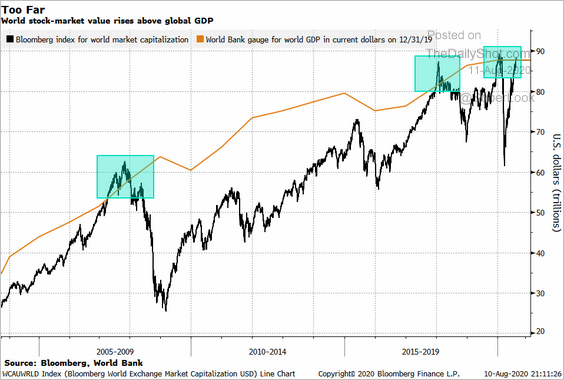
Stocks are worth more than the whole economy:
Global stock market capitalization is higher than global GDP for one of the few times ever. Even just the valuation of U.S. stocks is nearing half of global output, a level seen only twice before in the past 60 years. The other two preceded many years of U.S. underperformance relative to the rest of the world's markets.
More odd masking: A handful of times over the past month or so, we've noted weak breadth readings despite big gains in some of the indexes. So far, it has not mattered one whit. It happened again on Wednesday, with the Nasdaq Composite gaining more than 2% yet its Up Volume Ratio was only 53%. That is the lowest in history, dating to 1984, on a day the Composite gained more than 2%. There have been 6 other days when the Up Volume Ratio was below 60% on a day with this large of a gain in the Composite, and they were not auspicious: 1999-04-05, 2000-03-21, 2000-03-31, 2000-04-17, 2000-05-24, and 2000-08-03.
Bottom Line:
- Weight of the evidence has been suggesting flat/lower stock prices short- to medium-term again; still suggesting higher prices long-term
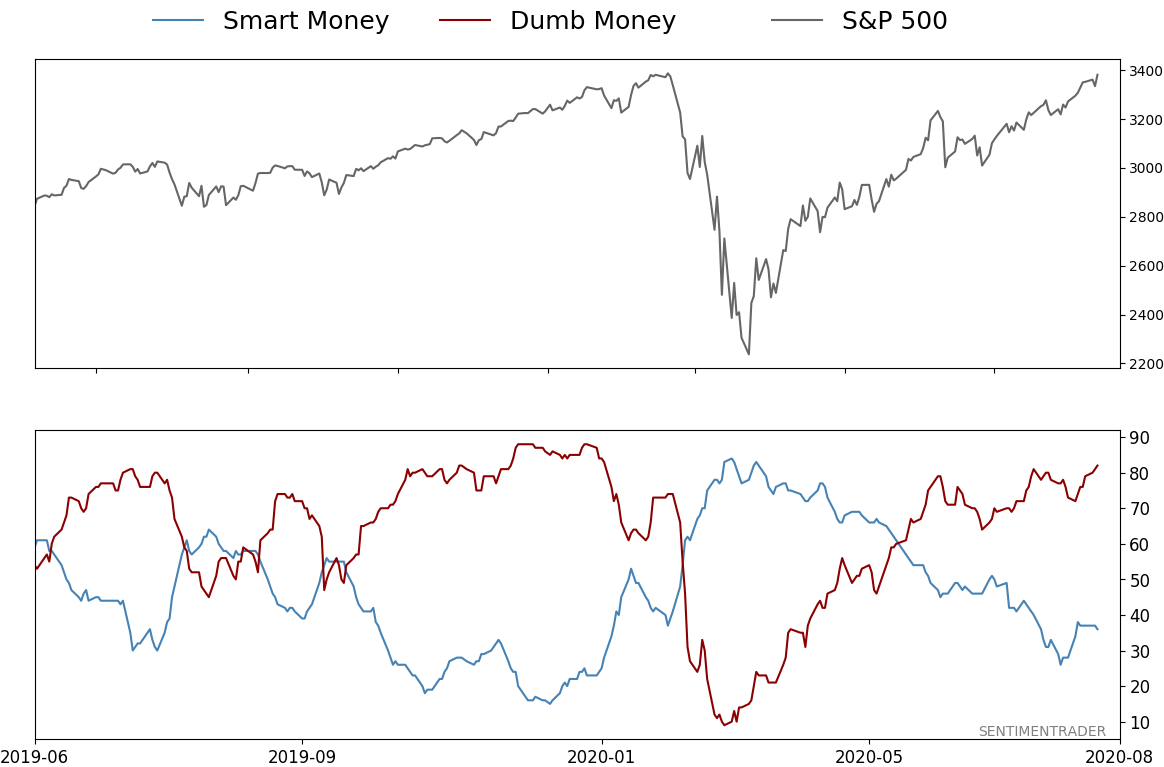
- Indicators show high optimism, with Dumb Money Confidence recently above 80% with signs of reckless speculation during what appears to be an unhealthy market environment, historically a bad combination
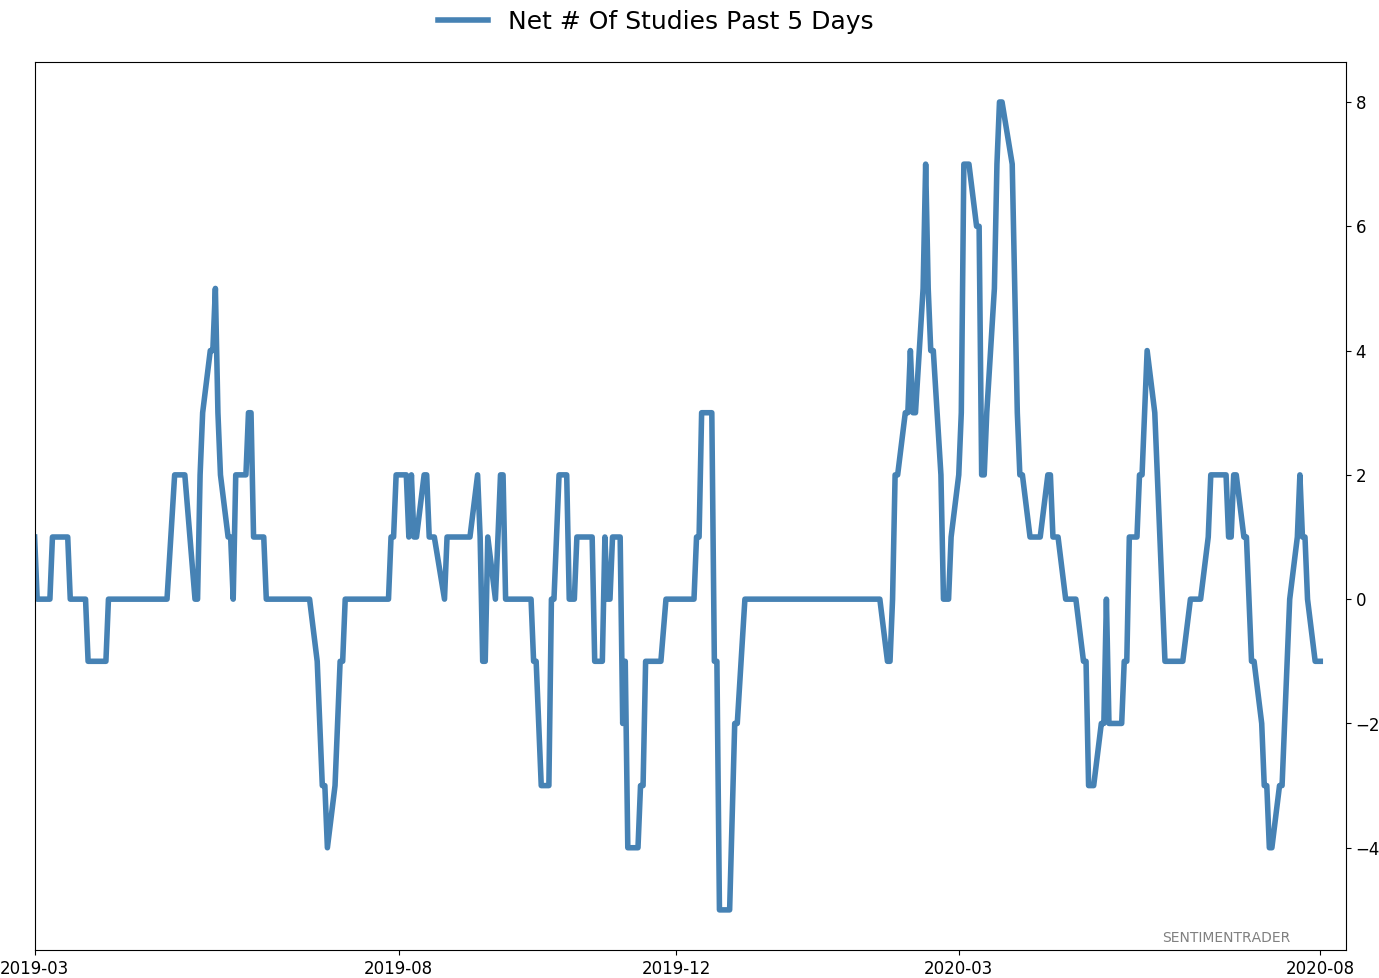
- Active Studies show a heavy positive skew over the medium- to long-term; breadth thrusts, recoveries, and trend changes have an almost unblemished record at preceding higher prices over a 6-12 month time frame
- Signs of extremely skewed preference for tech stocks neared exhaustion by late June, especially relative to industrials and financials (here and here)
- Indicators and studies for other markets are showing less consistent forward results, though it's not a great sign for Treasuries that hedgers are net short and optimism on metals recently became extreme, with "perfect" breadth among miners
|
Smart / Dumb Money Confidence
|
Smart Money Confidence: 36%
Dumb Money Confidence: 82%
|
|
Risk Levels
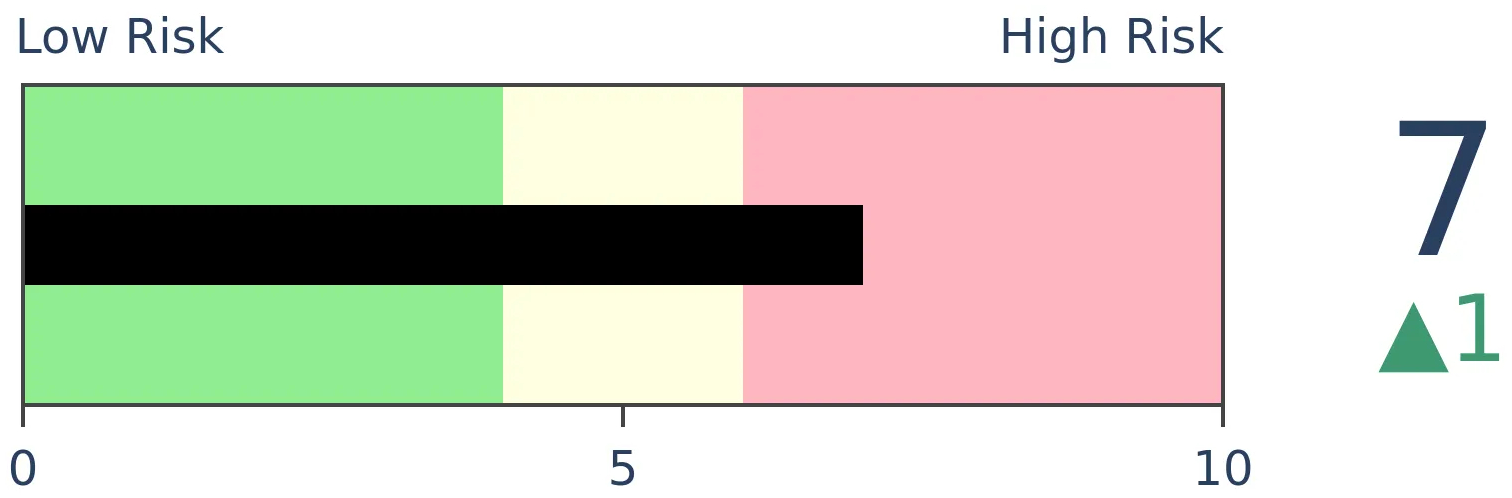
Stocks Short-Term
|
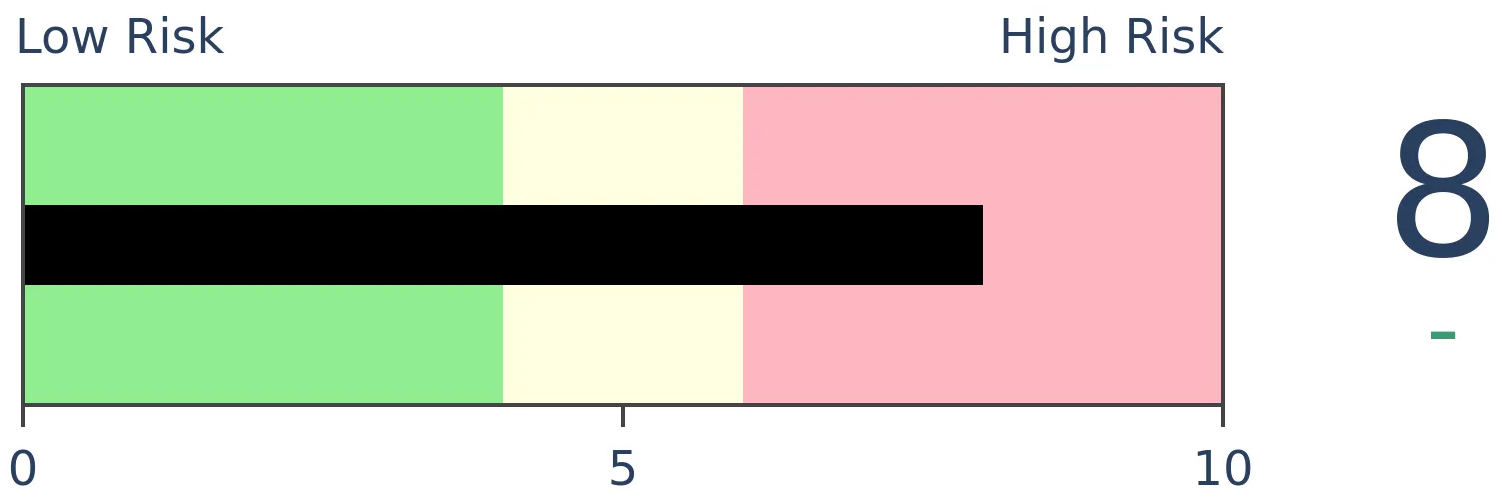
Stocks Medium-Term
|
|
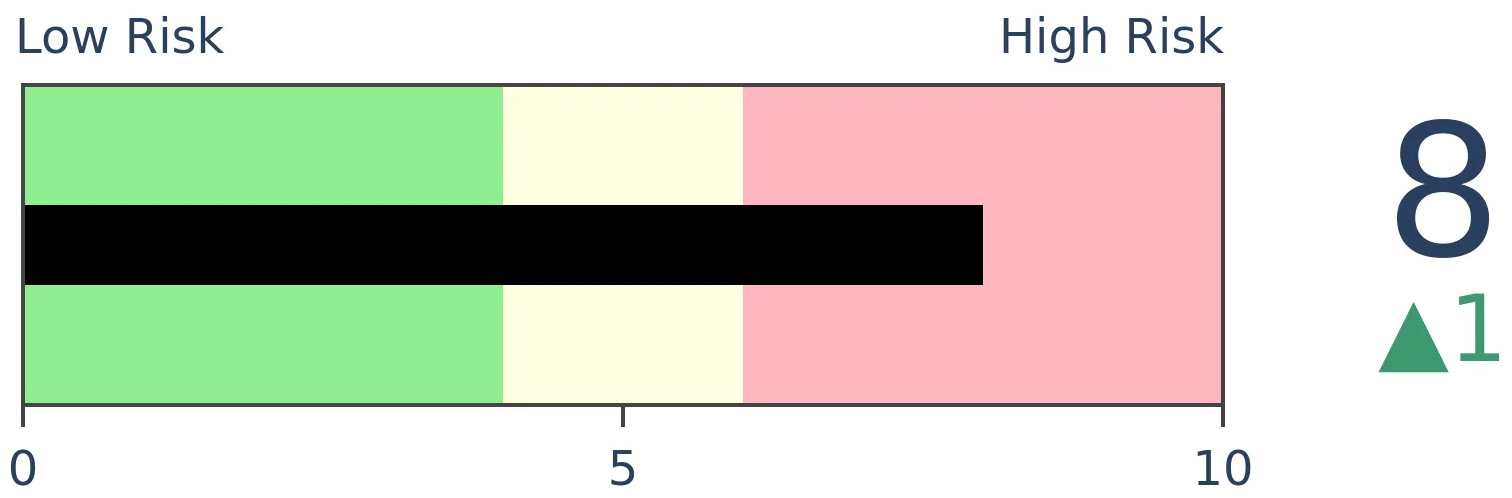
Bonds

|
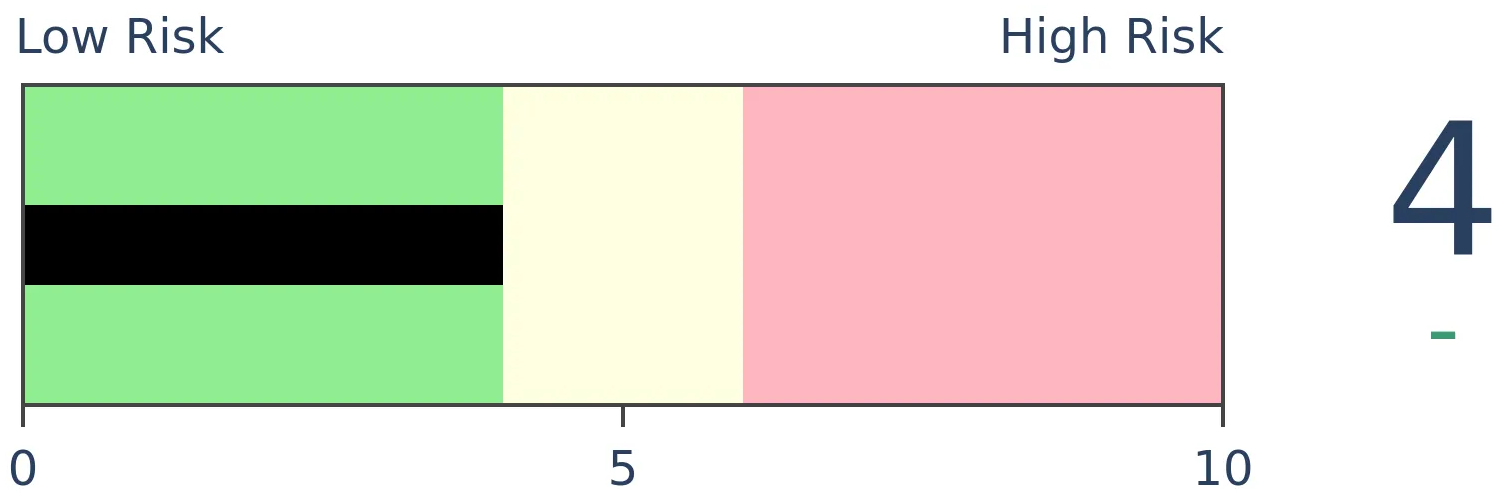
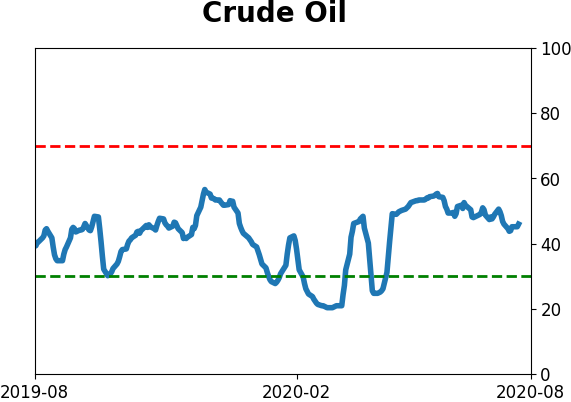
Crude Oil
|
|
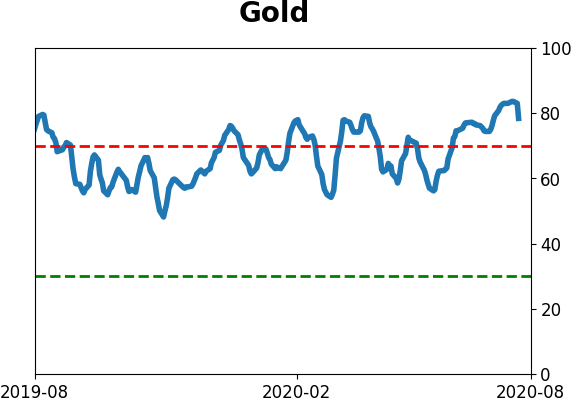
Gold
|
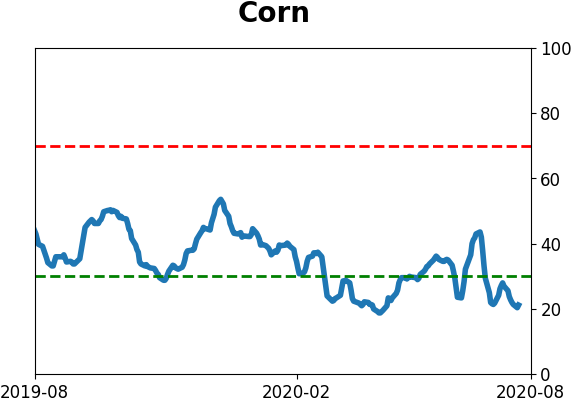
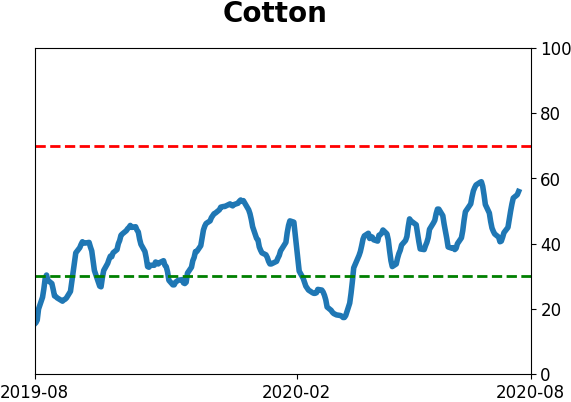
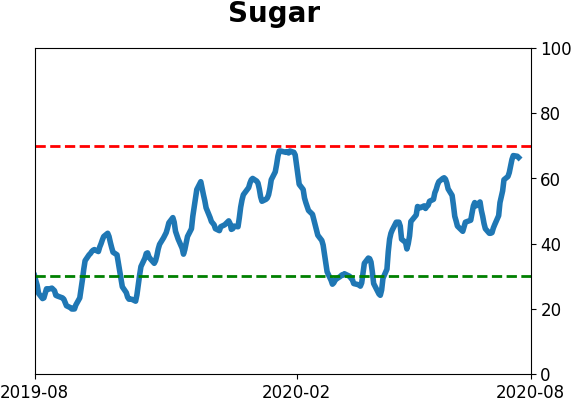
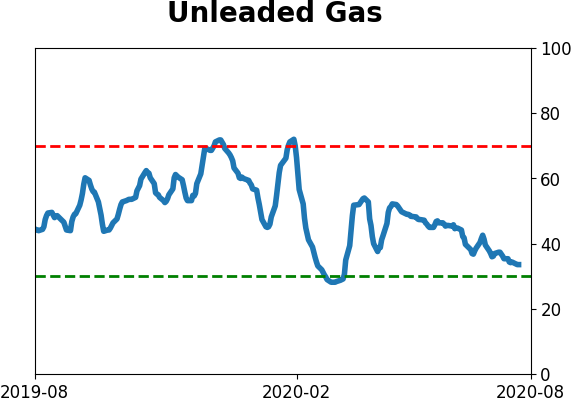
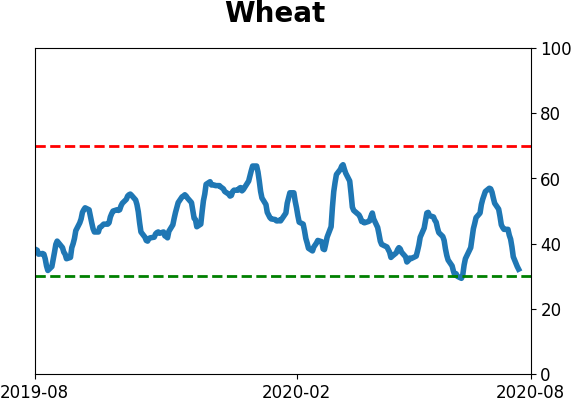
Agriculture

|
|
Research
BOTTOM LINE
Optimism on gold, silver, and miners was extremely high in late July and early August. Their punishing losses in recent days has caused a tumble in sentiment, which usually has meant that there is more room to go before the excesses are unwound.
FORECAST / TIMEFRAME
GLD -- Down, Medium-Term
|
Warning signs have been triggering in gold, silver, and mining stocks for a few weeks, especially after it looked like they were firing on all cylinders.
Reality hit hard on Tuesday and optimism about the metals took a header. In a premium note, Troy mentioned that the Optimism Index for gold fell the most ever in a single day, cratering from above 80 to barely above 60.
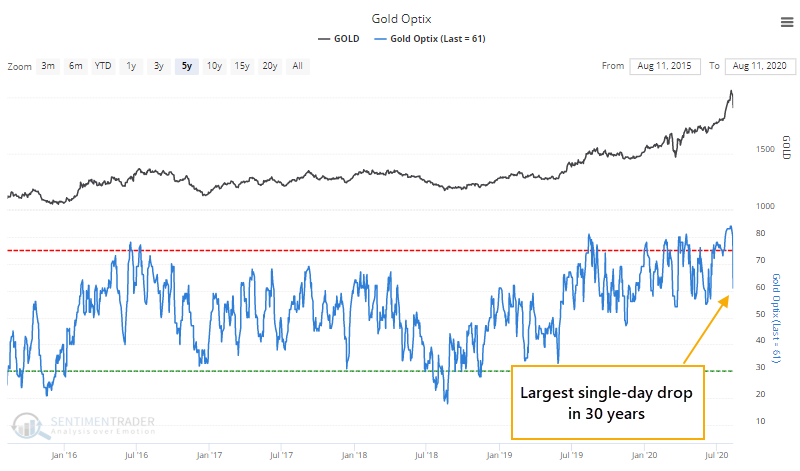
It fell a bit further and the Optimism Index has now cycled from well into excessive optimism back to neutral. Since 1990, this has typically meant the metal had more work to do to shed all of that optimism.
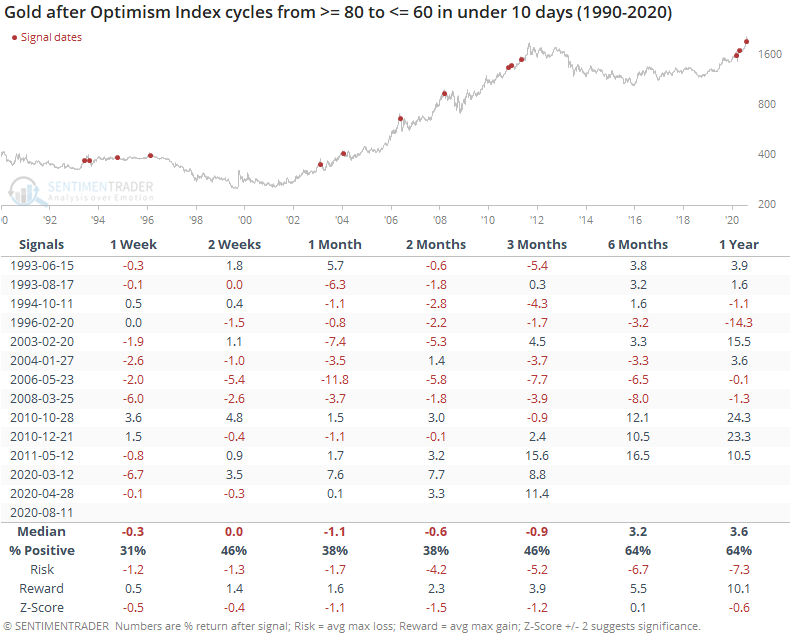
When the Optix fell from 80 or above to 60 or below within two weeks, it rarely snapped back immediately. All but three of the signals showed a loss somewhere between 1-3 months later, though it's interesting that the three exceptions are the last three signals, including two in 2020 alone. Perhaps that means the market environment is changed and gold isn't playing by the rules that governed it in recent decades but suggesting "this time is different" is an awfully high hurdle.
BOTTOM LINE
Global stock market capitalization is higher than global GDP for one of the few times ever. Even just the valuation of U.S. stocks is nearing half of global output, a level seen only twice before in the past 60 years. The other two preceded many years of U.S. underperformance relative to the rest of the world's markets.
FORECAST / TIMEFRAME
None
|
Stocks have disconnected from the economy, and that's not news. The divergence has been going on for months, with a relentless rally in stocks juxtaposed against terrible economic numbers and even more horrendous anecdotes about job losses, business closures, and bankruptcies.
While stocks generally follow the economy, the two are not linked to any tight degree. They can decouple for months at a time, as investors are much more forward-looking than economic reports. Still, this has been a standout year when it comes to trying to use one to forecast the other.
As Bloomberg notes, the capitalization of equities across the world has surpassed global gross domestic product.
"The market value of the world’s equities has risen above the dollar value of the global economy, which some investors say is a sign of overheated markets. Total stock-market capitalization reached $87.83 trillion on Sunday, compared with the 2019 gross domestic product of all countries at $87.75 trillion."
With the stunning rise in big American tech stocks, the U.S. portion of this global equity market capitalization is nearing all-time highs. While there isn't necessarily a connection between stock values and economic output, it is a way to estimate sentiment and valuations.
While stocks' value as a share of U.S. GDP has taken a hit, the total market cap of all U.S. stocks relative to the latest IMF estimate for global GDP in 2020 is now above 40% for only the 2nd time in 60 years.
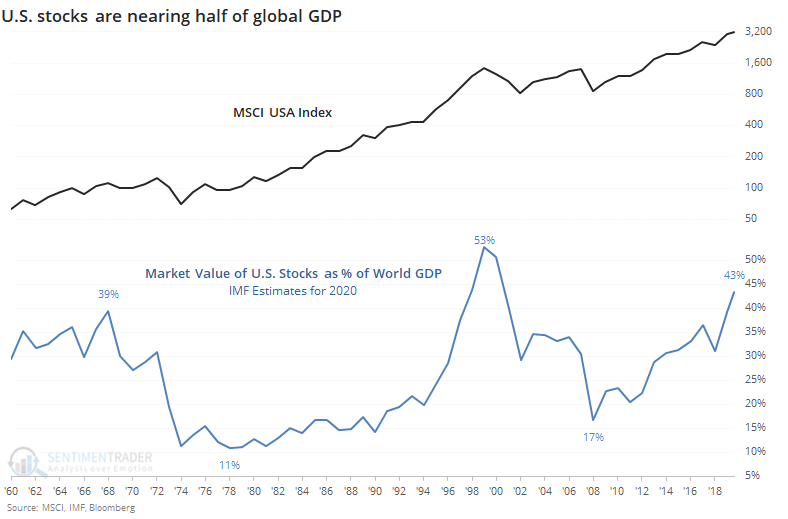
If stocks continue their gains into year-end and GDP craters more than feared, then there's a chance we could eclipse the 1999 peak, but that would be tough to do. Even so, we've already eclipsed the other peak from 1968.
Whatever the theories behind the recent run of American exceptionalism (in stock valuations, anyway), by the time it nears 40% of global GDP, the run in U.S. stocks versus the rest of the world has been near its end, at least judging by the tiny sample size we have.
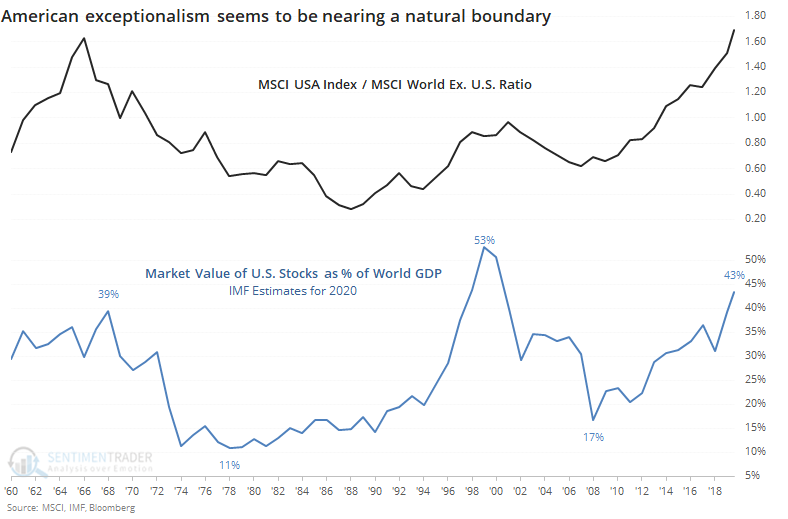
In the late 1960s, U.S. stocks had already started to underperform indexes in other parts of the world by the time this ratio peaked. In 1999, there was a bit more room to go before rolling over. Both times, equity values in the U.S. greatly trailed those outside the U.S. over the next five years at least.
It's hard for some investors to imagine what could knock U.S. stocks off their pedestals, but history is clear that something, somewhere, for some reason, will do it. Relying on the top 5 stocks to continue to carry the rest of the market is getting increasingly risky.
Active Studies
| Time Frame | Bullish | Bearish | | Short-Term | 0 | 1 | | Medium-Term | 8 | 12 | | Long-Term | 46 | 1 |
|
Indicators at Extremes
Portfolio
| Position | Weight % | Added / Reduced | Date | | Stocks | 29.8 | Reduced 9.1% | 2020-06-11 | | Bonds | 0.0 | Reduced 6.7% | 2020-02-28 | | Commodities | 5.2 | Added 2.4%
| 2020-02-28 | | Precious Metals | 0.0 | Reduced 3.6% | 2020-02-28 | | Special Situations | 0.0 | Reduced 31.9% | 2020-03-17 | | Cash | 65.0 | | |
|
Updates (Changes made today are underlined)
After stocks bottomed on March 23rd, they enjoyed a historic buying thrust and retraced a larger amount of the decline than "just a bear market rally" tends to. Through June, there were signs of breadth thrusts, recoveries, and trend changes that have an almost unblemished record at preceding higher prices over a 6-12 month time frame. On a shorter-term basis, our indicators have been showing high optimism, with Dumb Money Confidence recently above 80%, along with signs of reckless speculation during what appears to be an unhealthy market environment, historically a bad combination. While there are certainly some outlier indicators that are showing apathy or even outright pessimism, a weight-of-the-evidence approach suggests high risk over a multi-week to multi-month time frame. I've been carrying a low (too low) level of exposure to stocks, as well as bonds and gold. I don't see a good opportunity to add to any of those currently, with poor prospects pretty much all the way around. As worried as I am over the medium-term, I would only grudgingly reduce my exposure even further given the longer-term positives we spent so much time discussing in the spring. At this point, I would only look seriously at lowering exposure further if the S&P 500 drops below approximately 3220, an initial sign that its recent mini-breakout had failed.
RETURN YTD: -2.7% 2019: 12.6%, 2018: 0.6%, 2017: 3.8%, 2016: 17.1%, 2015: 9.2%, 2014: 14.5%, 2013: 2.2%, 2012: 10.8%, 2011: 16.5%, 2010: 15.3%, 2009: 23.9%, 2008: 16.2%, 2007: 7.8%
|
|
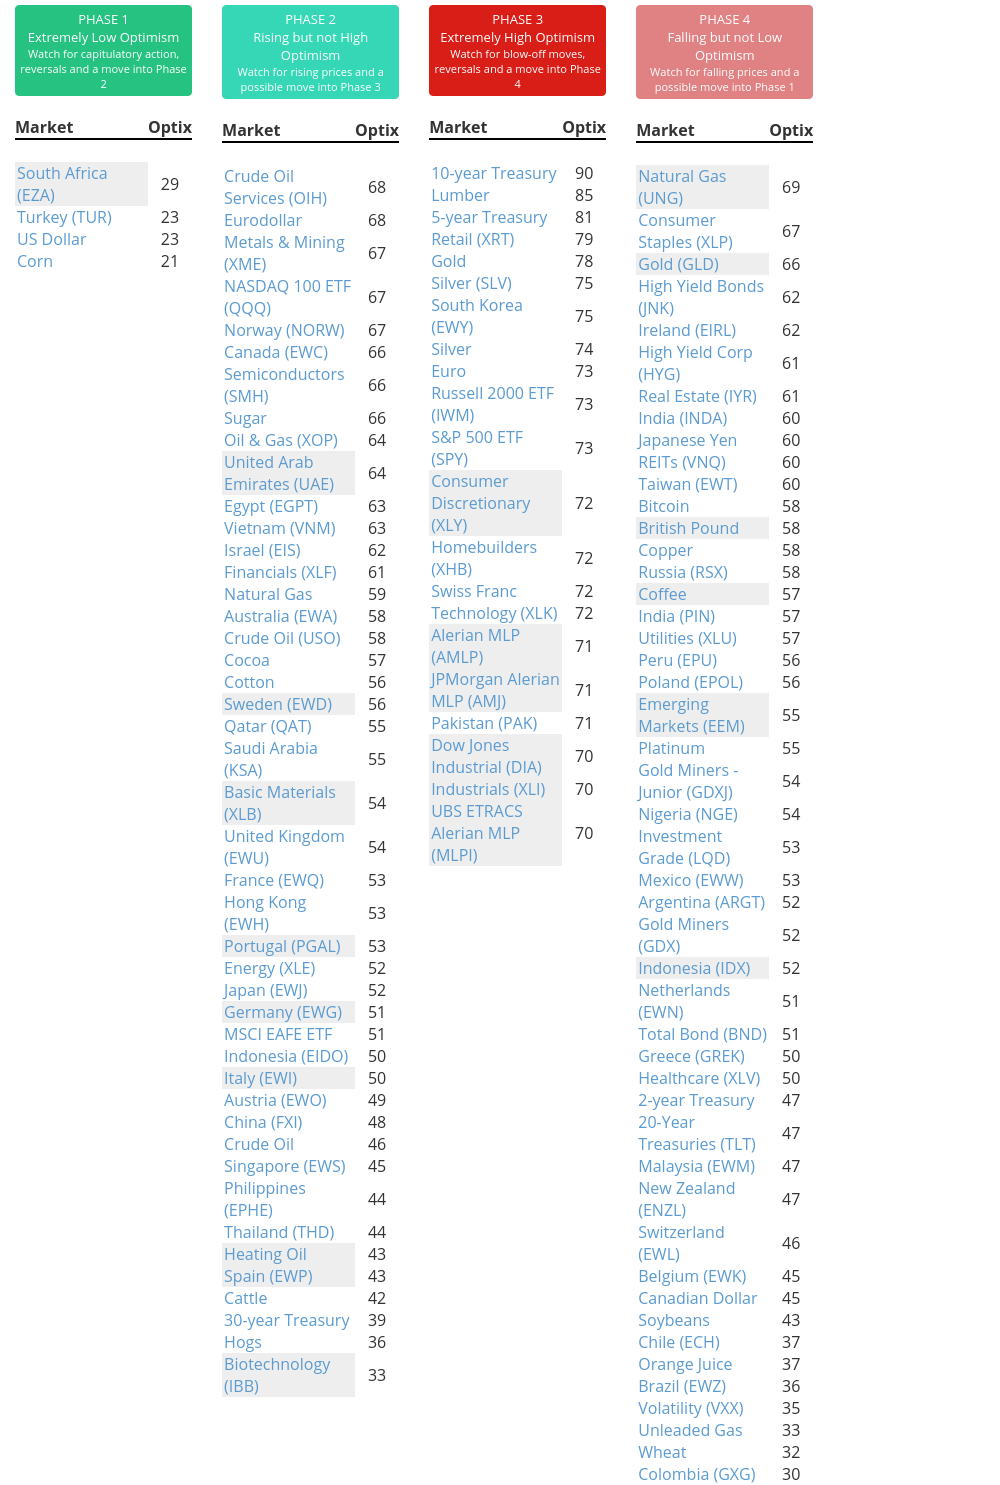
Phase Table
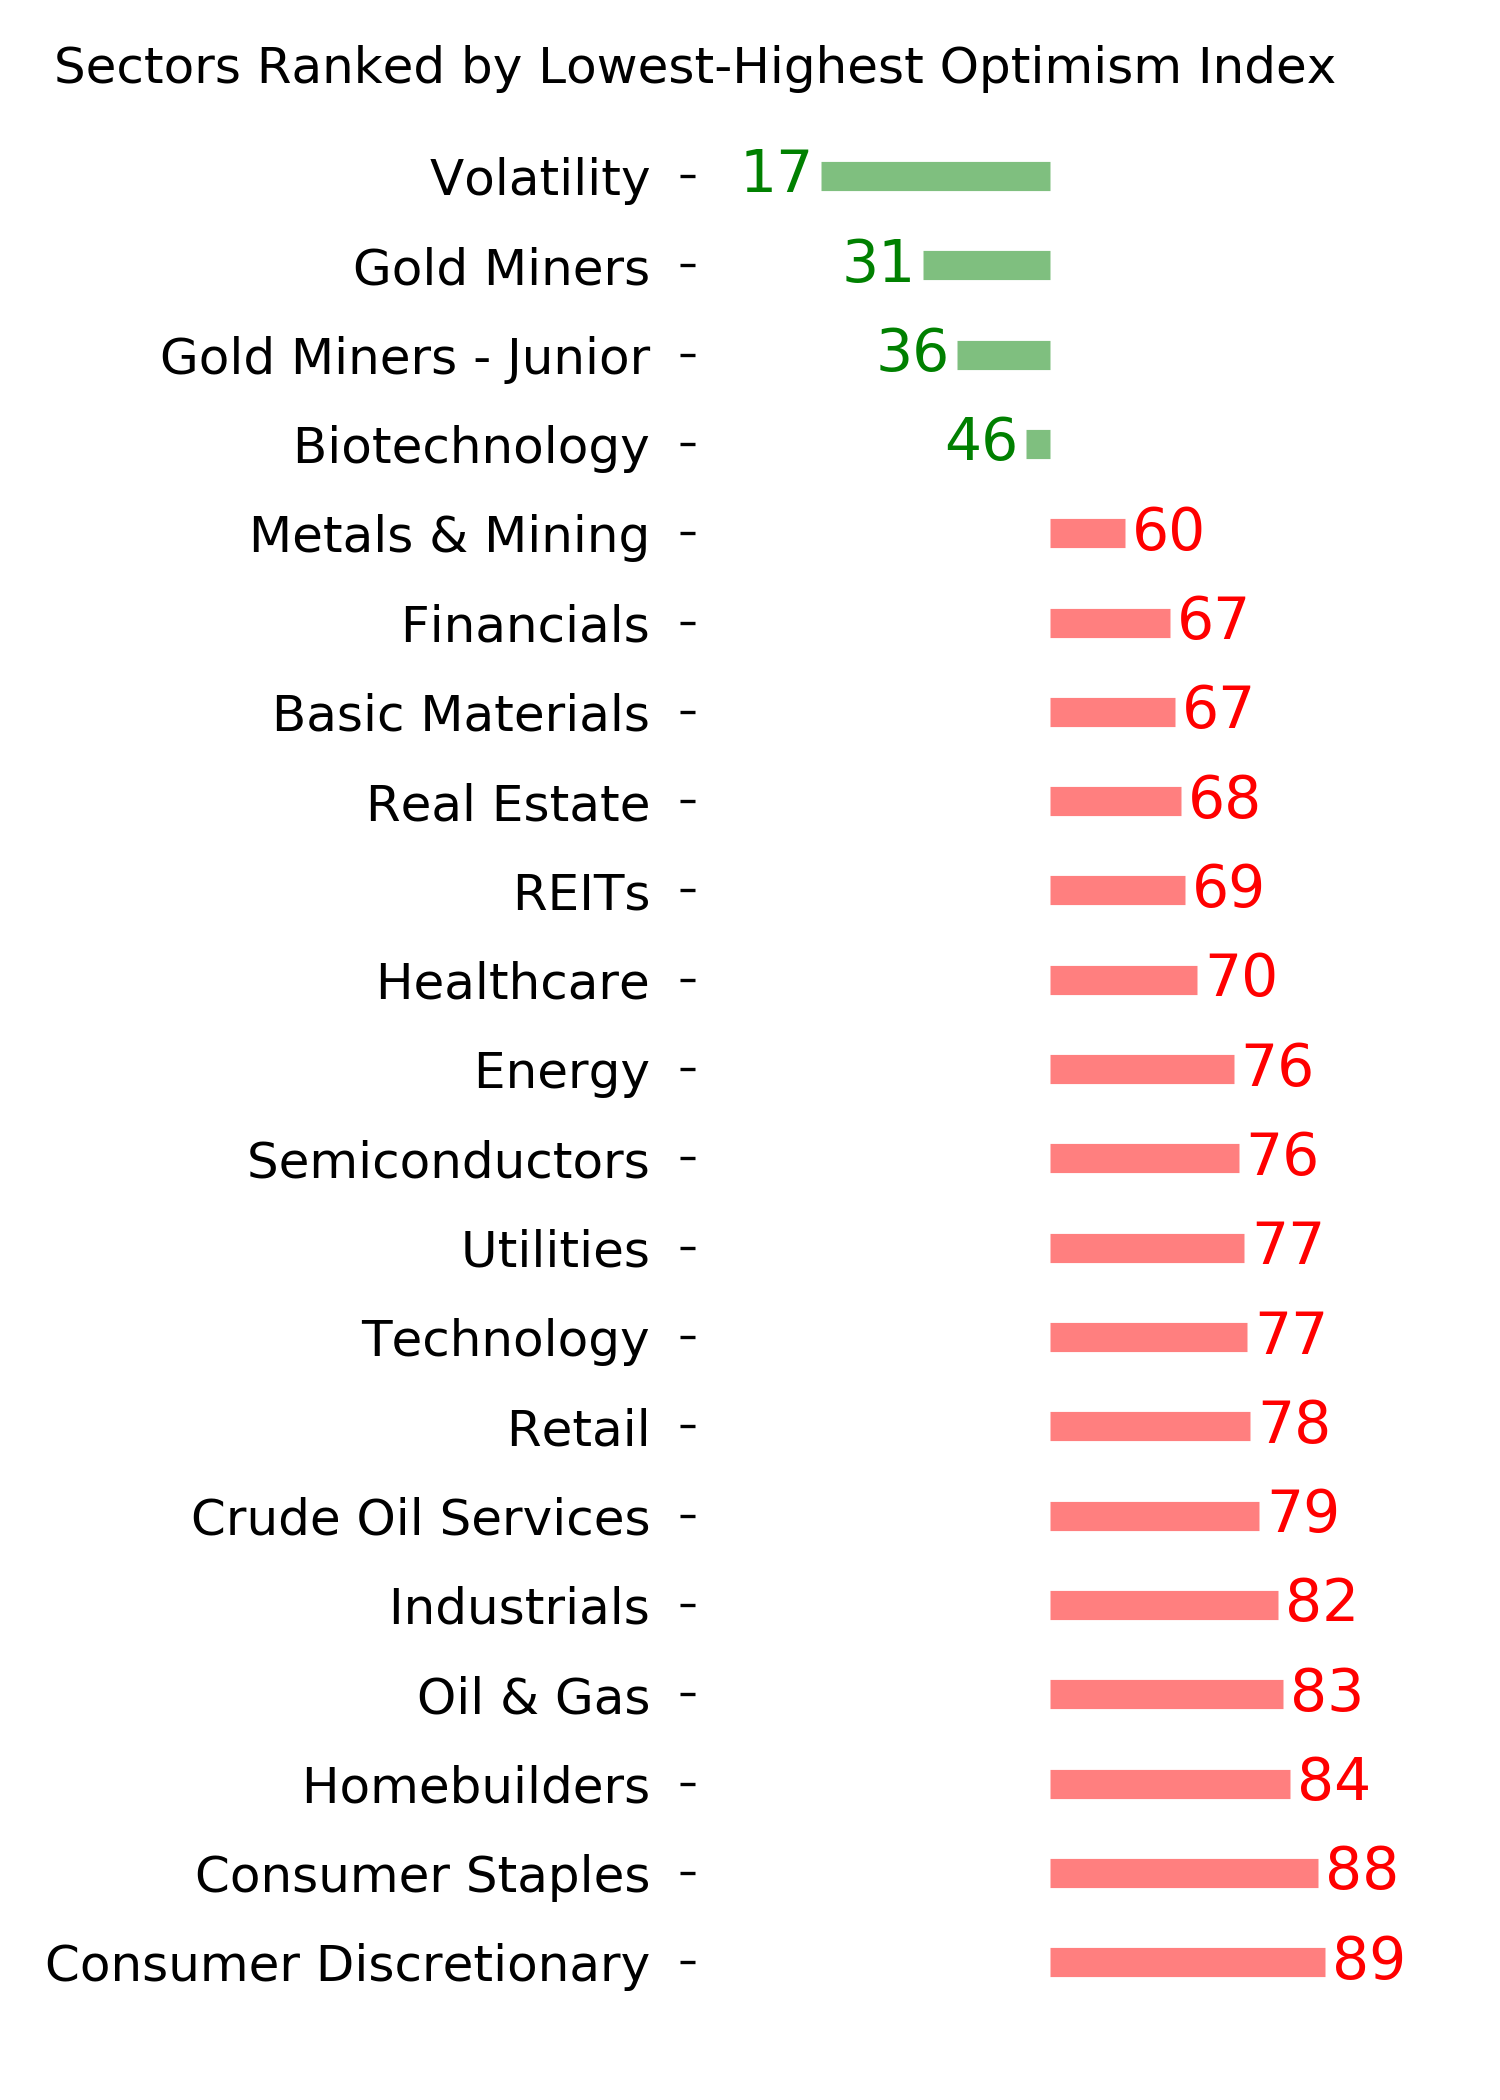
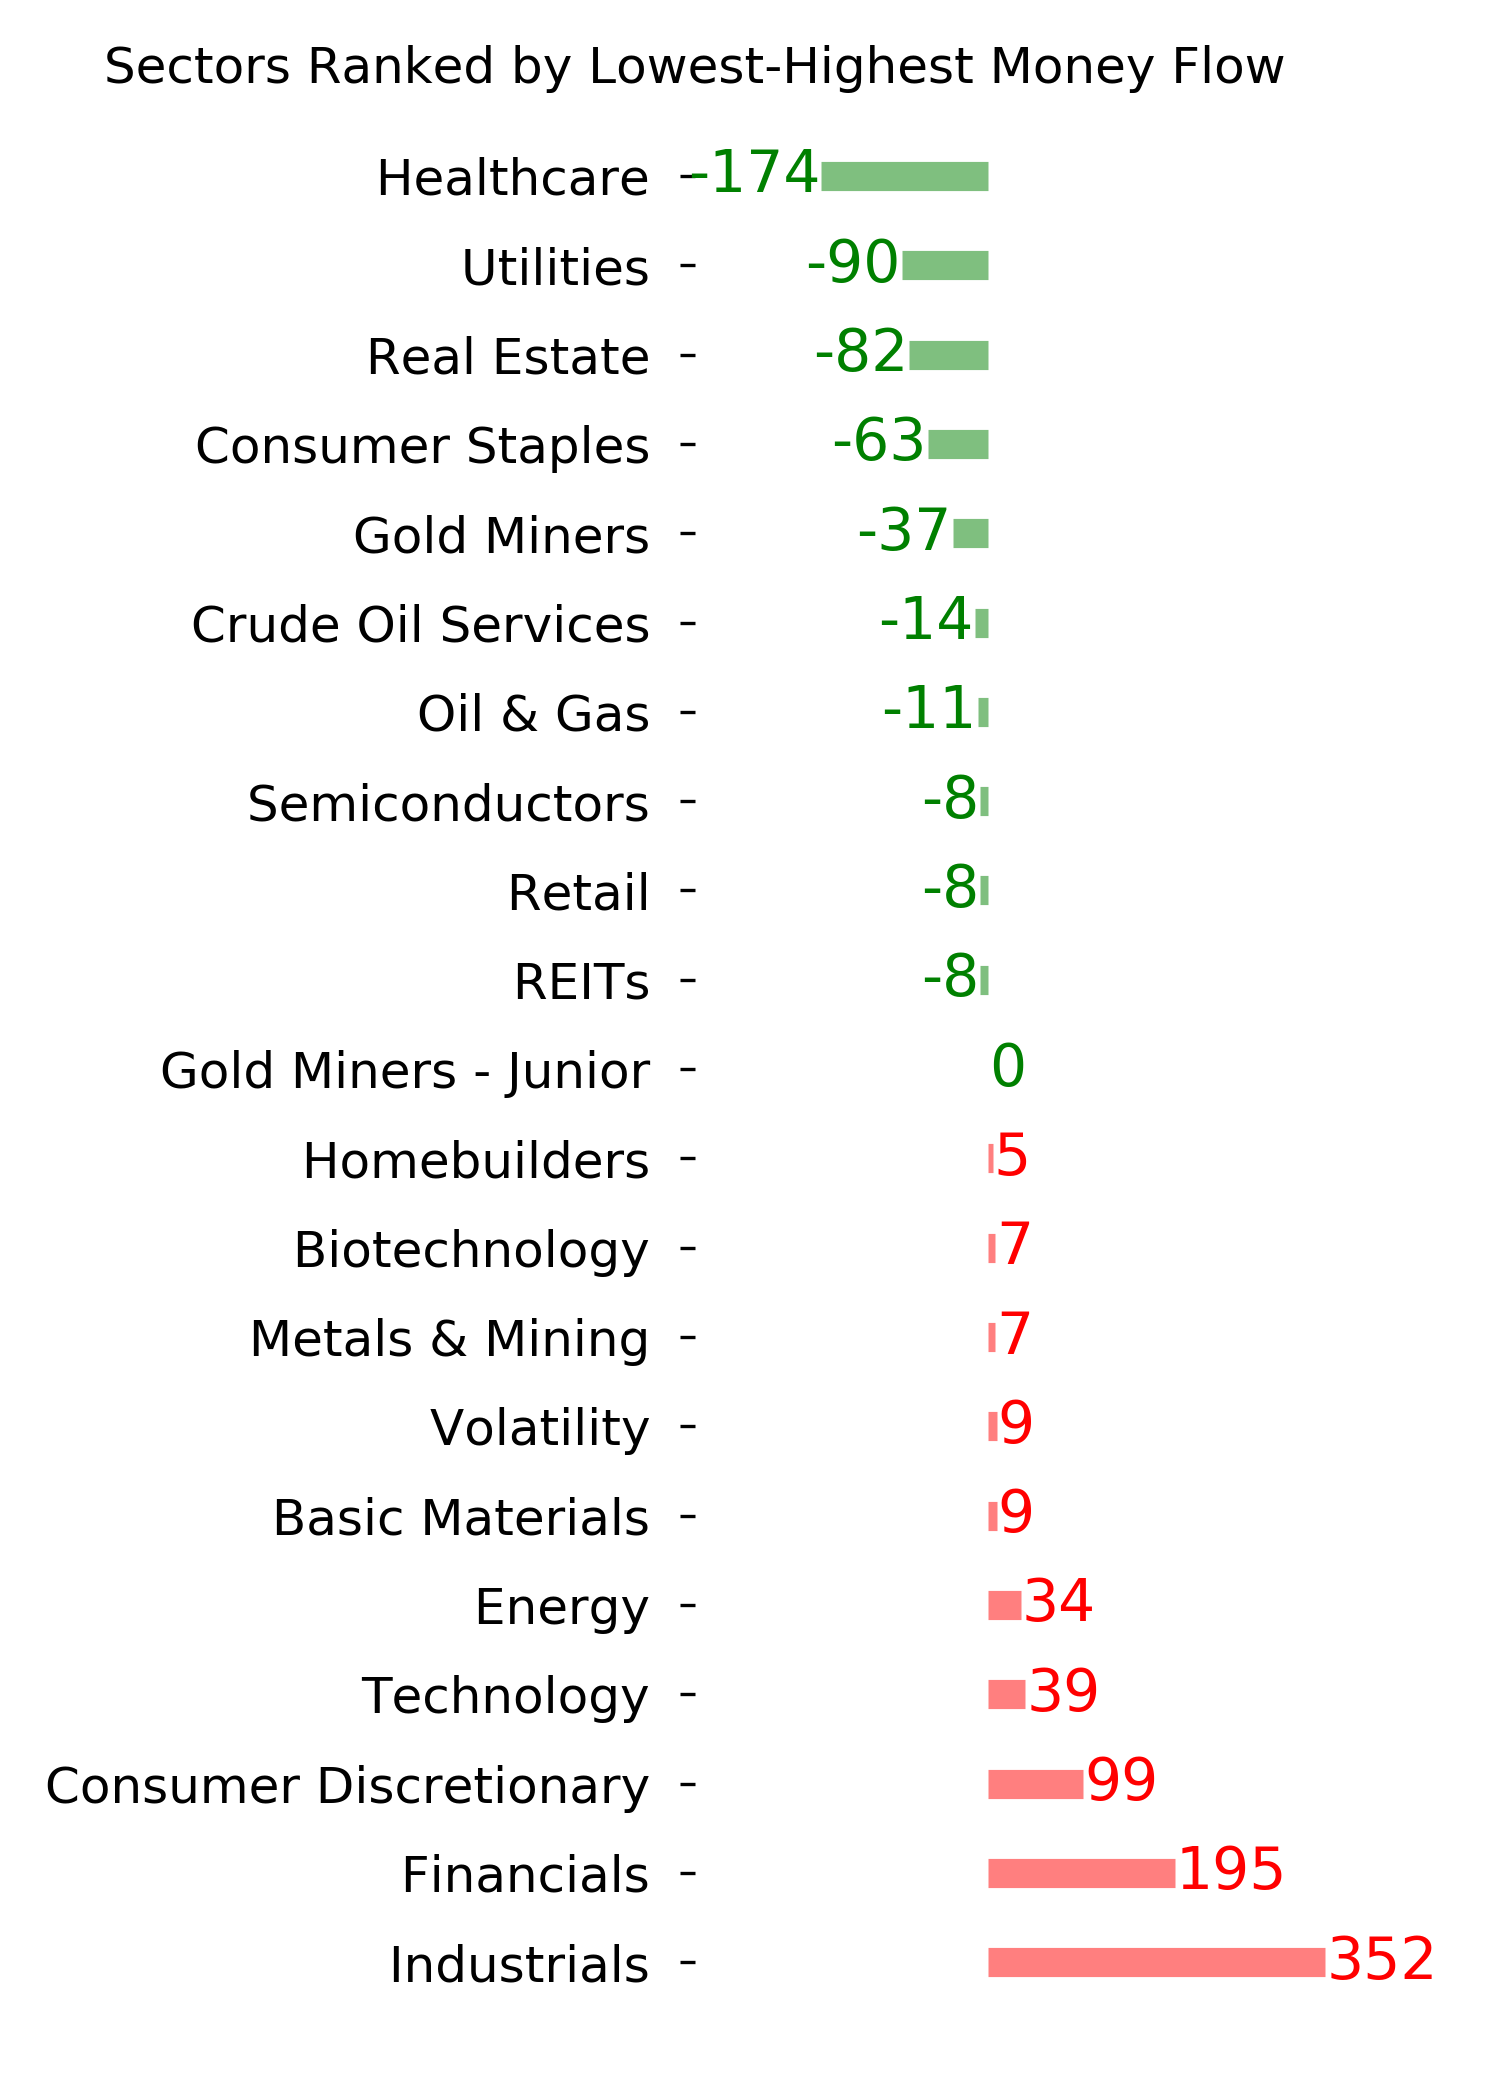
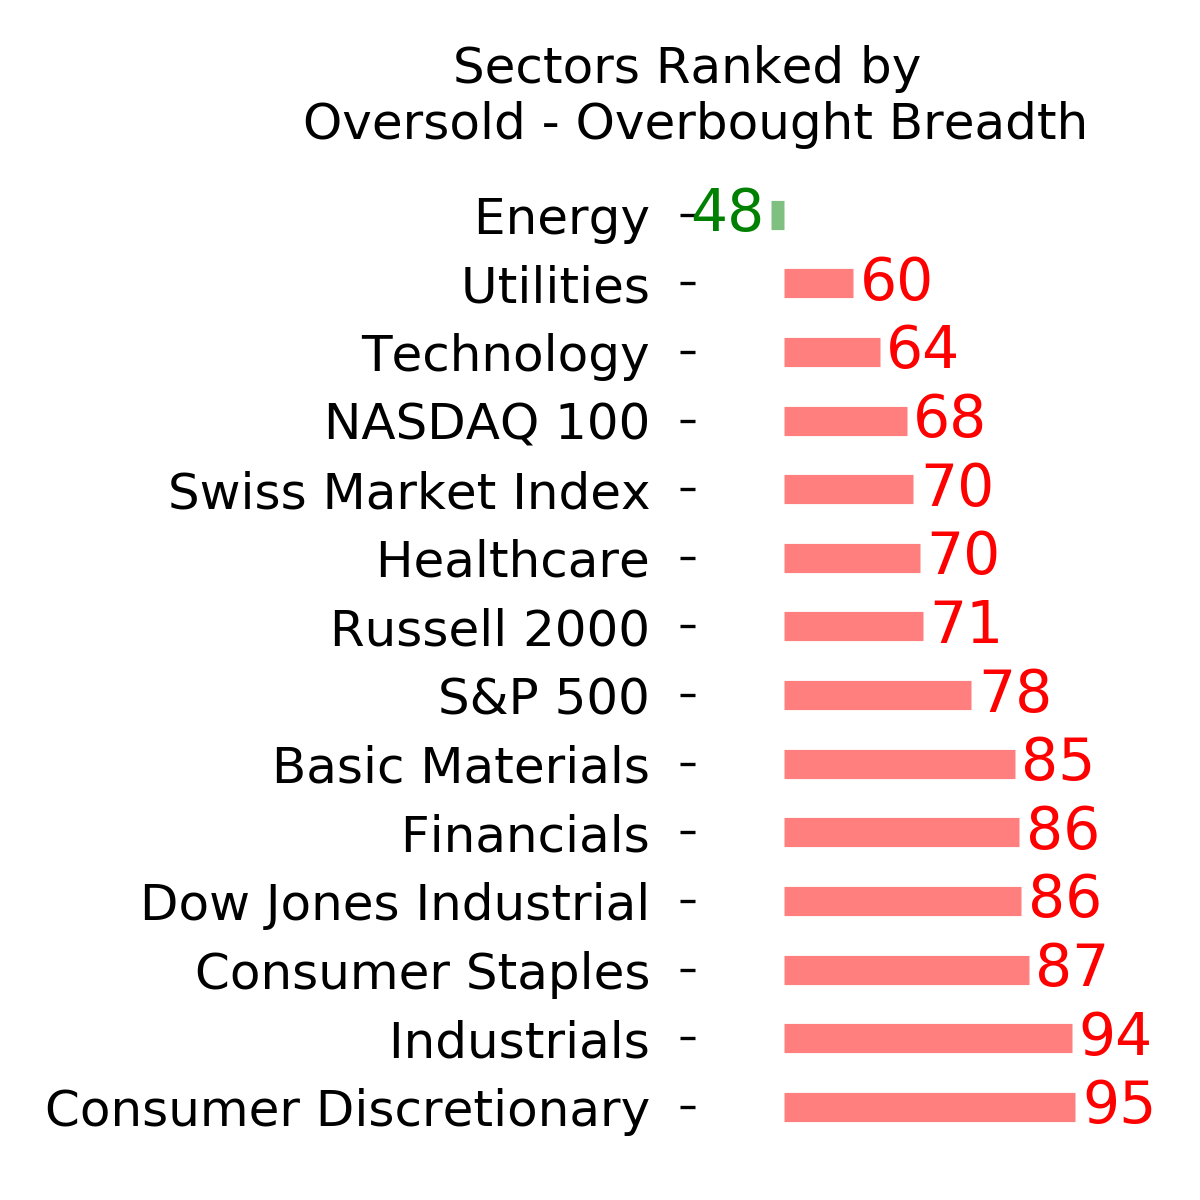
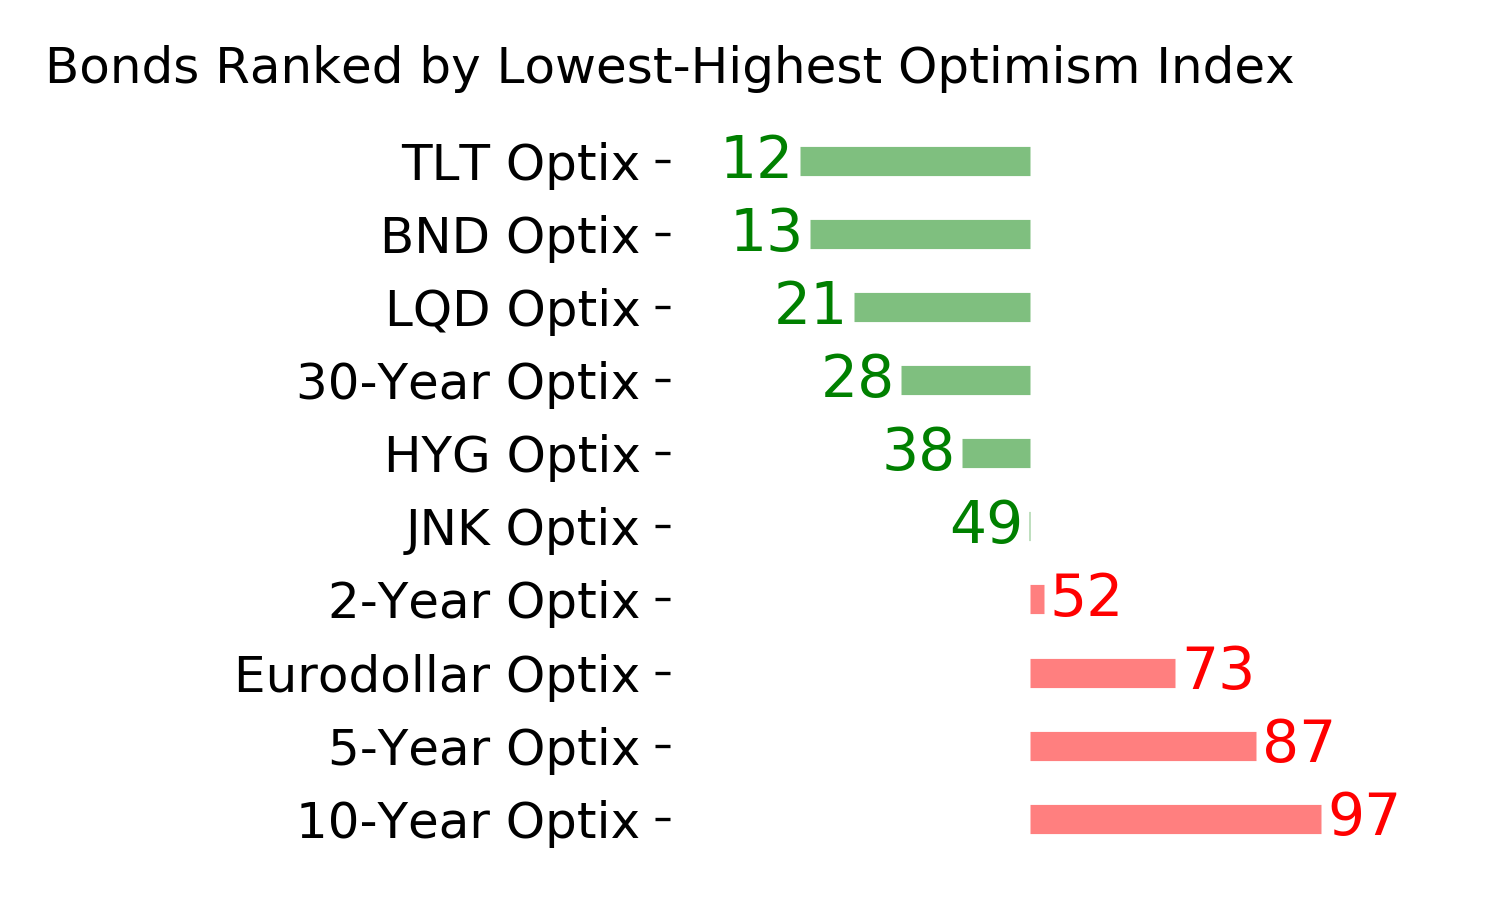
Ranks
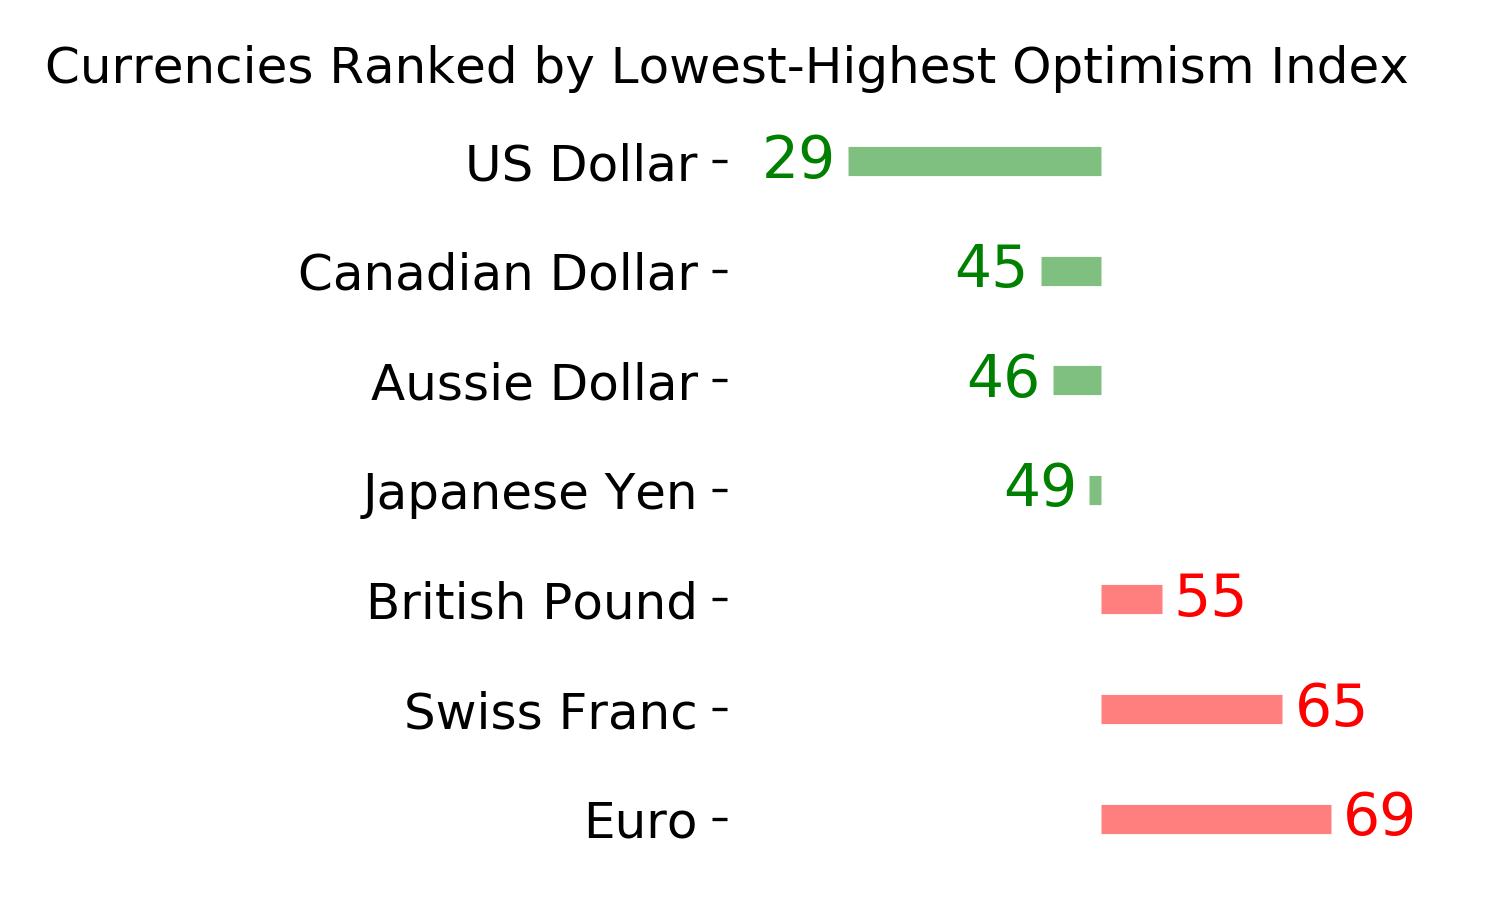
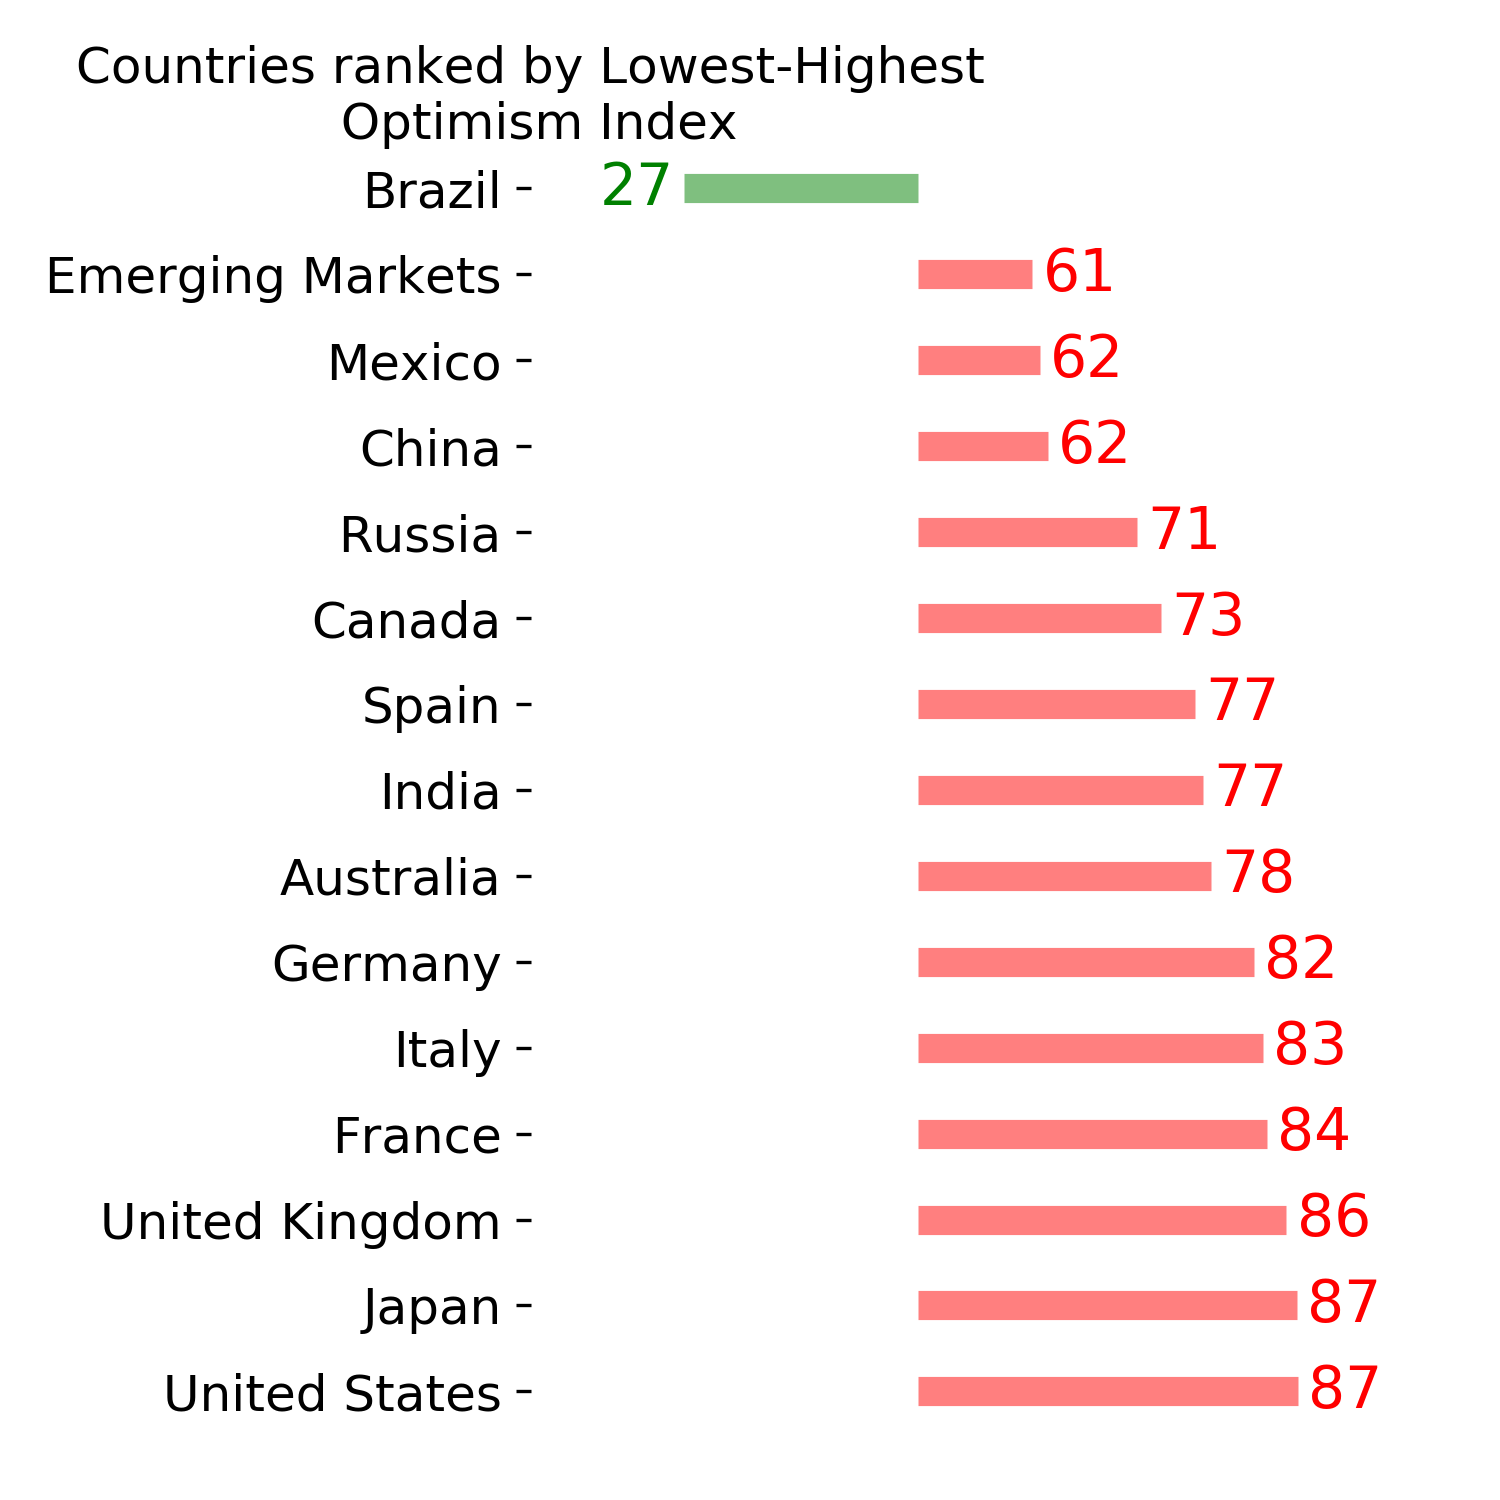
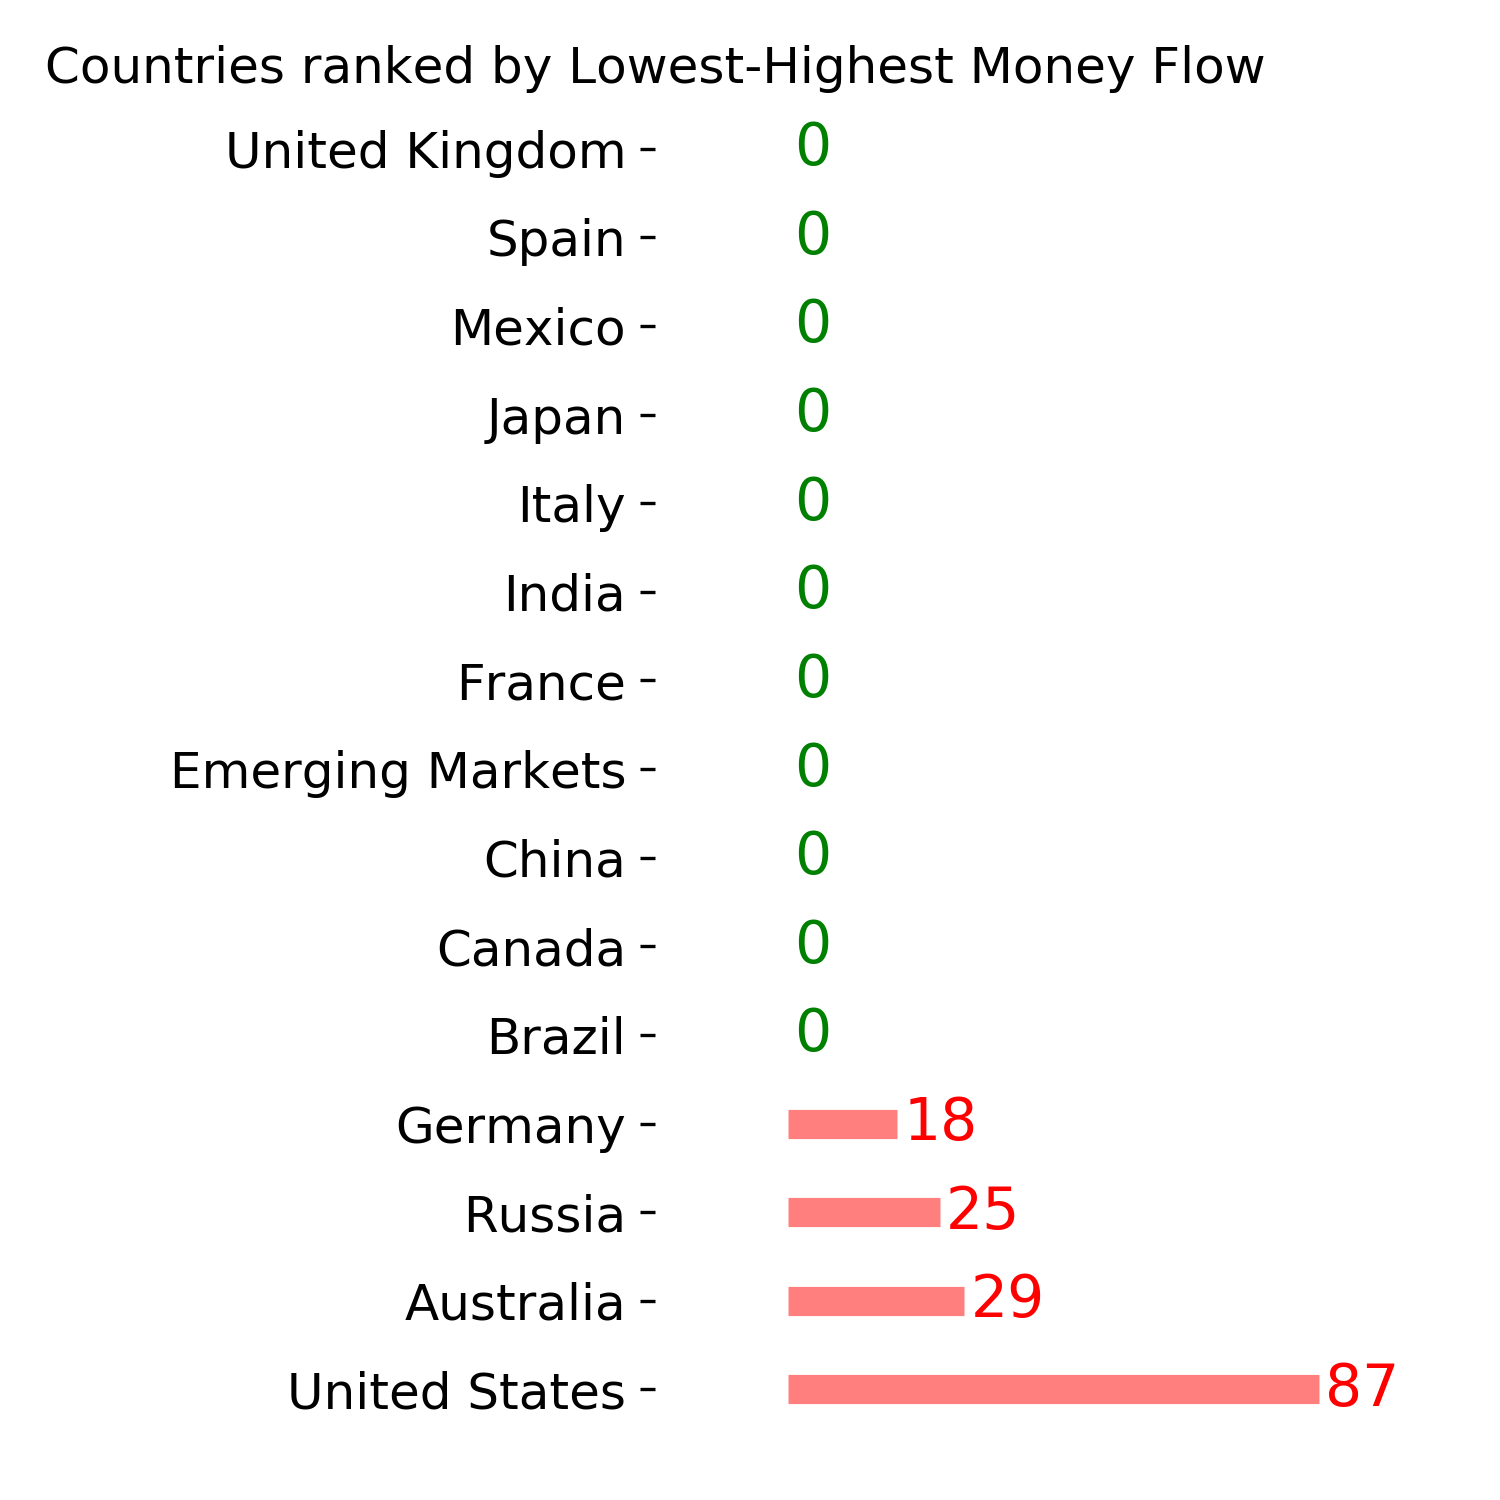
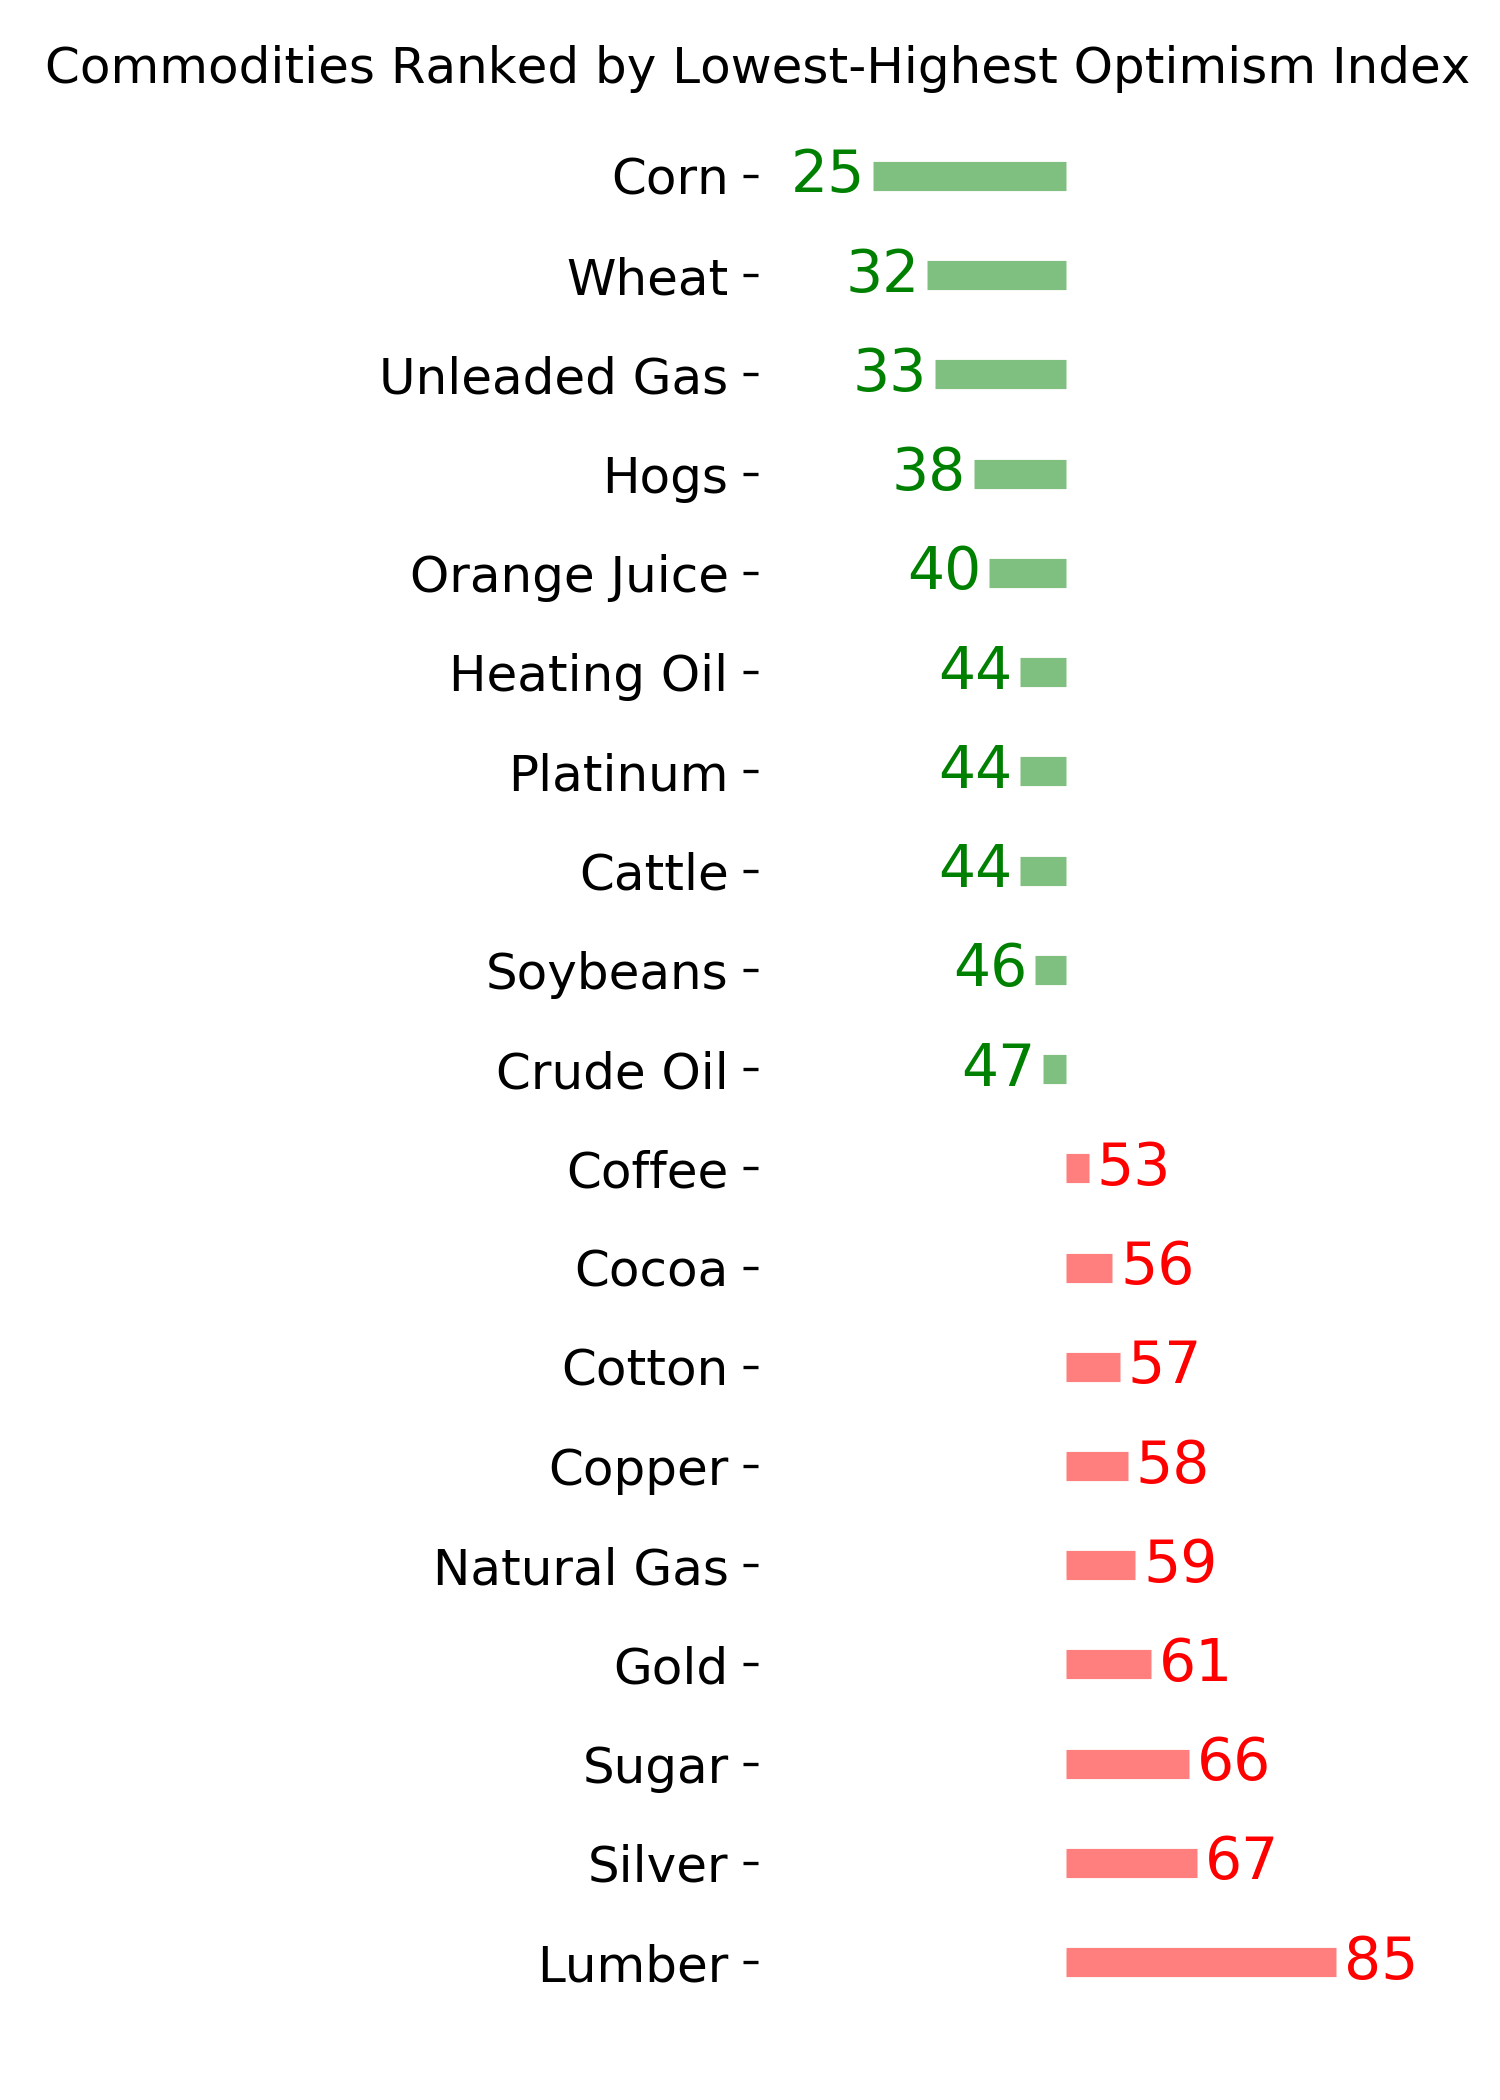
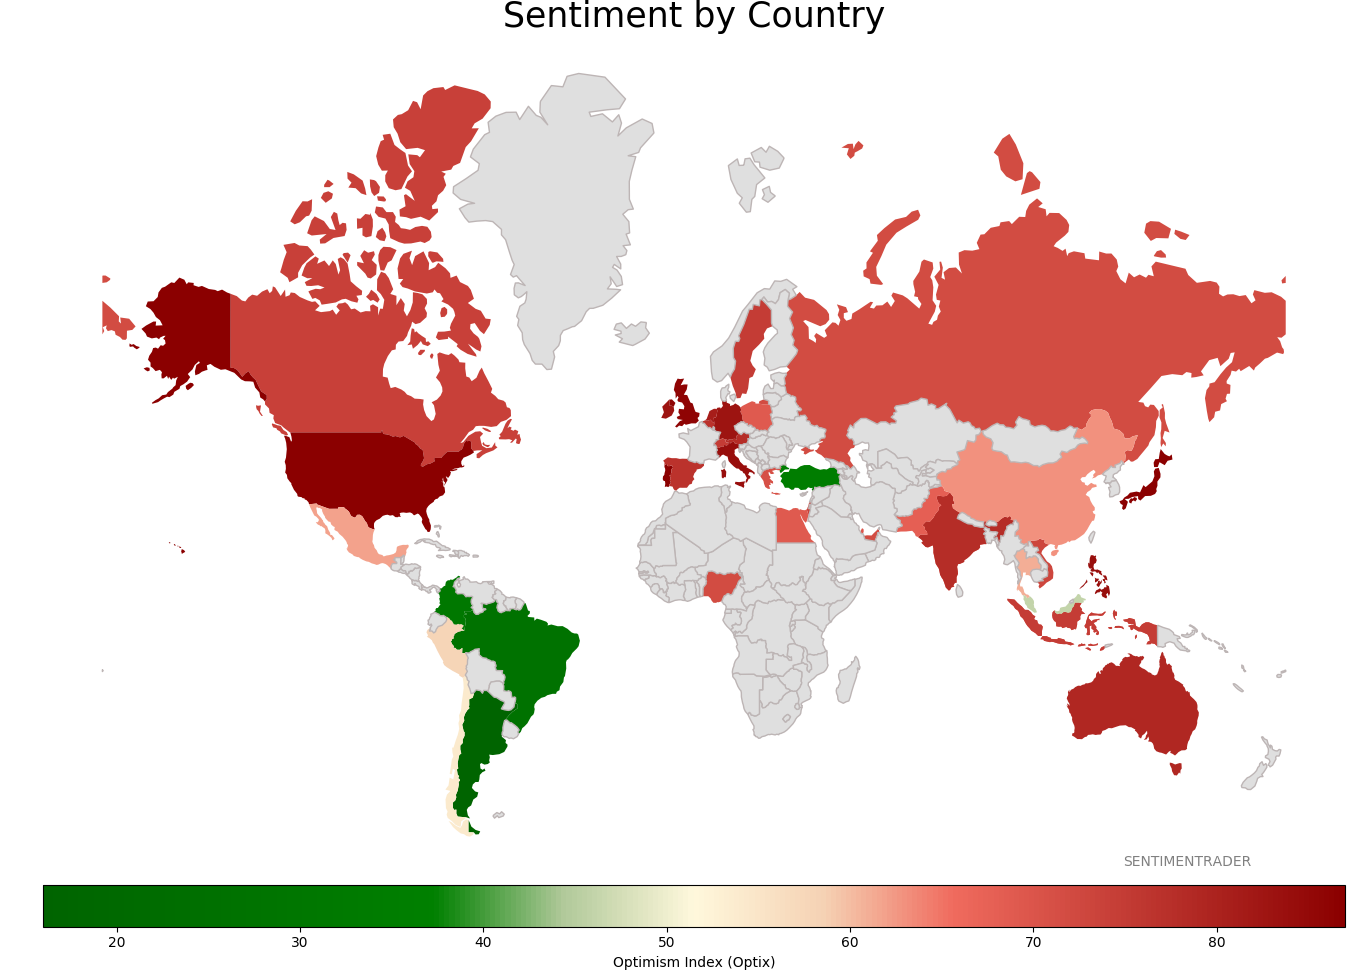
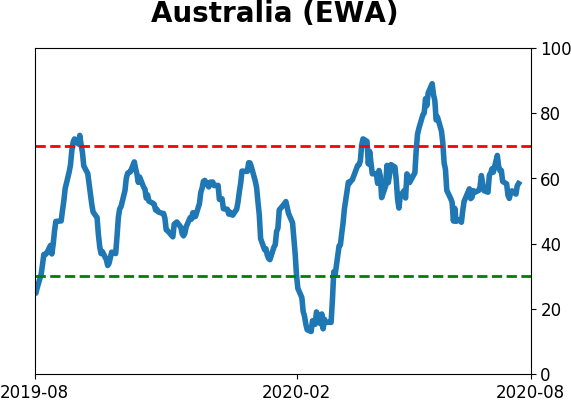
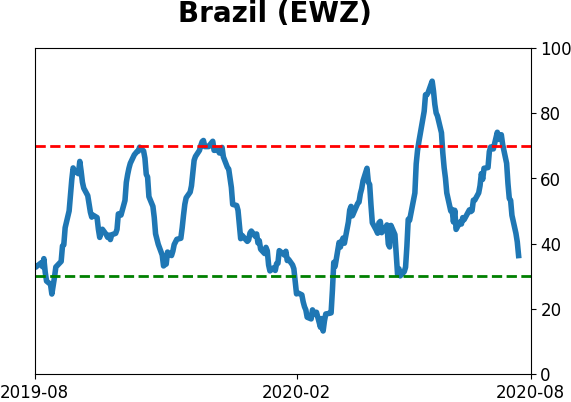
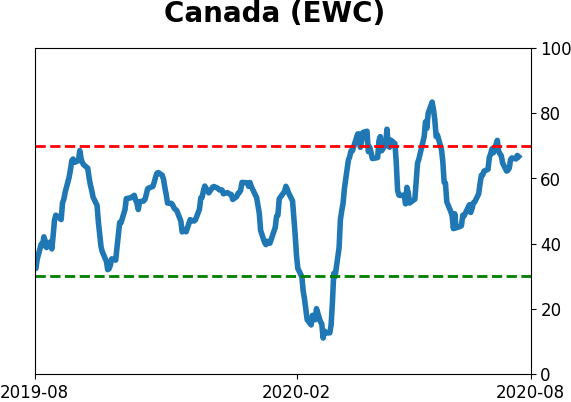
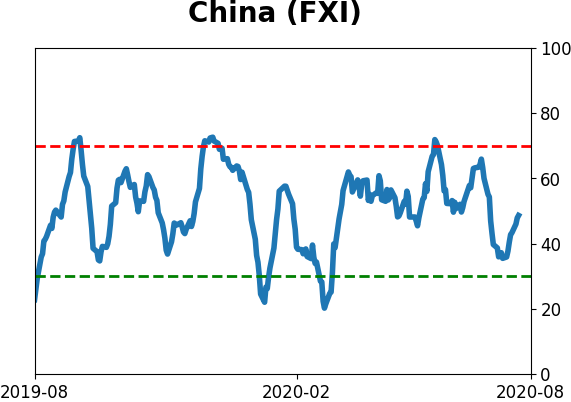
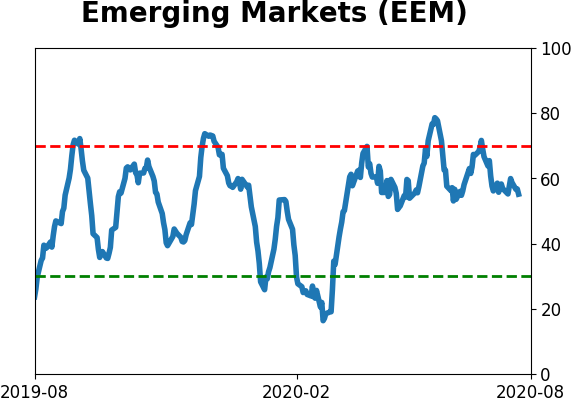
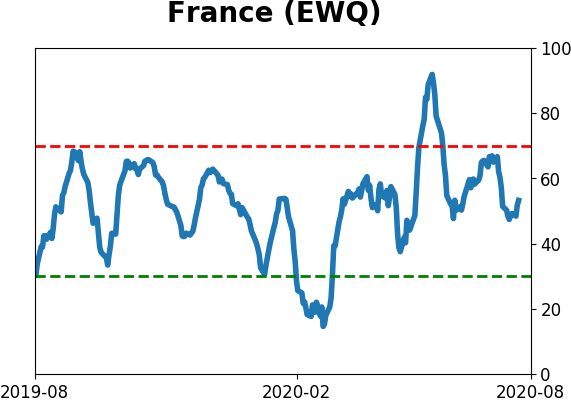
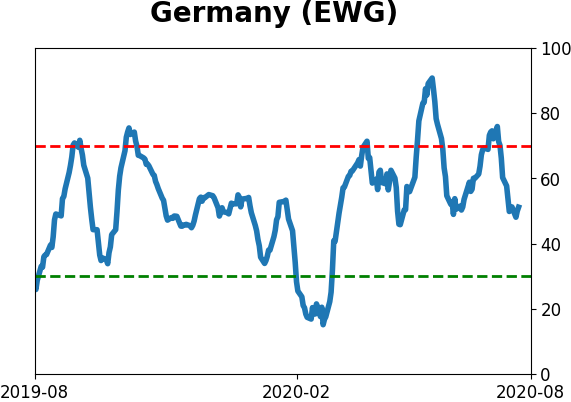
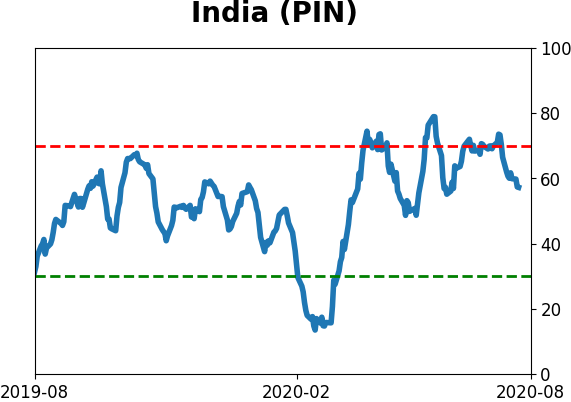
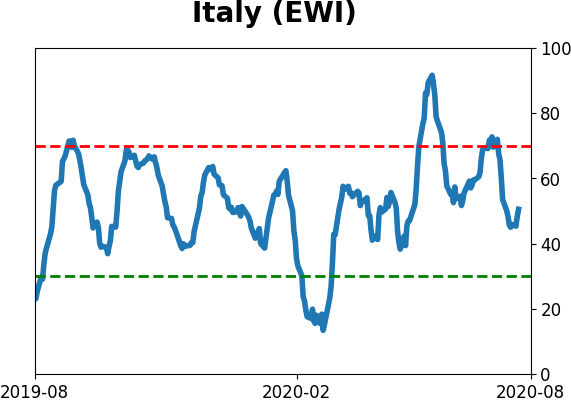
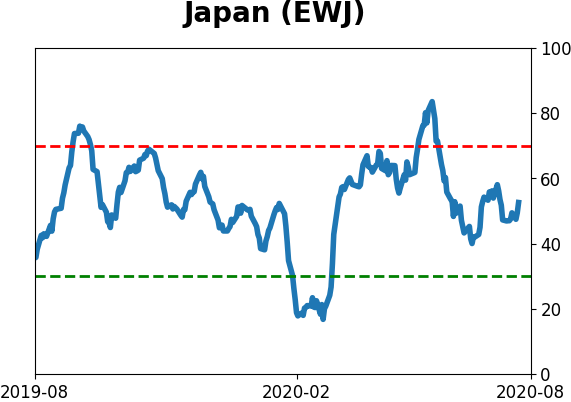
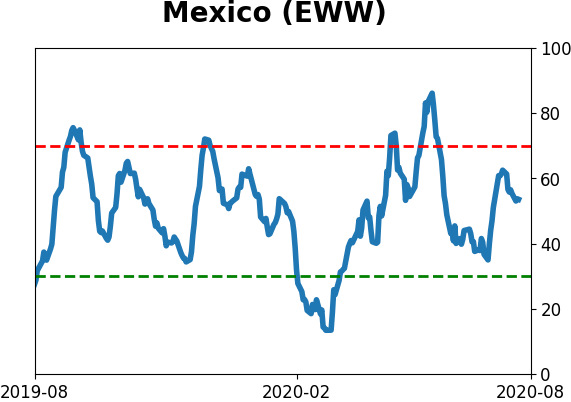
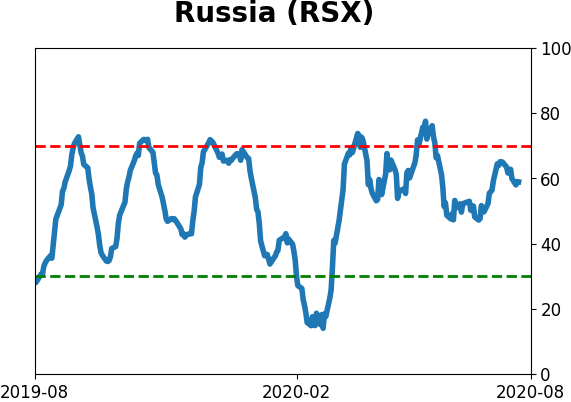
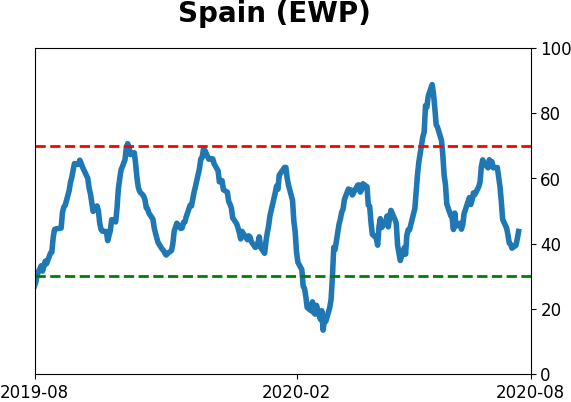
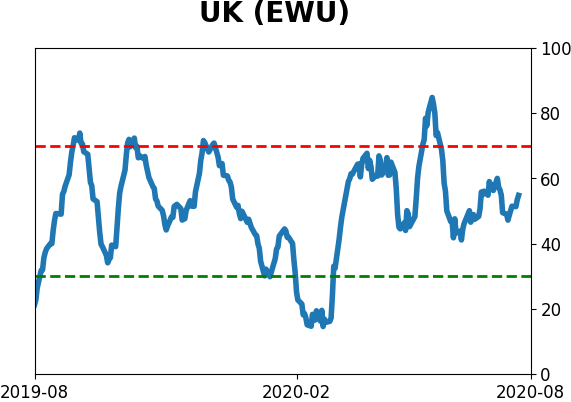
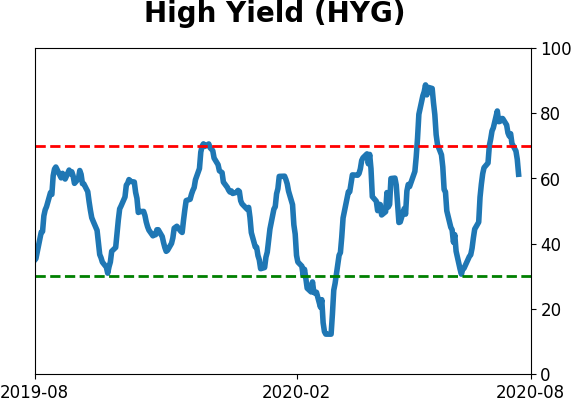
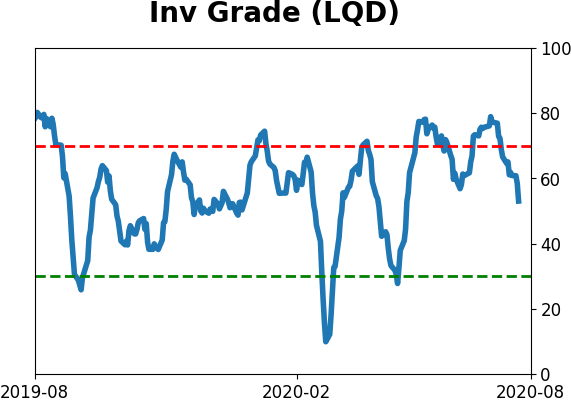
Sentiment Around The World
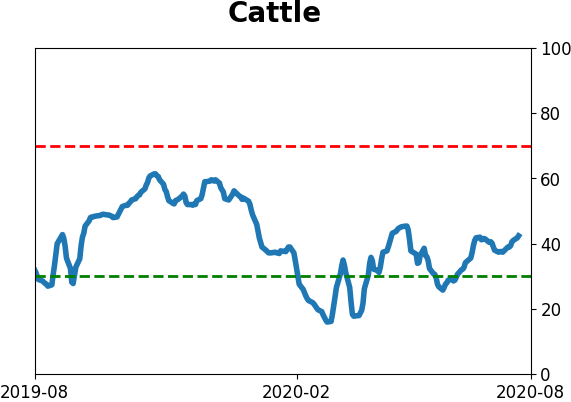
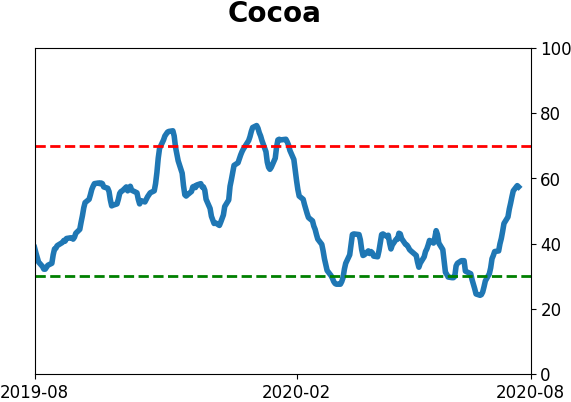
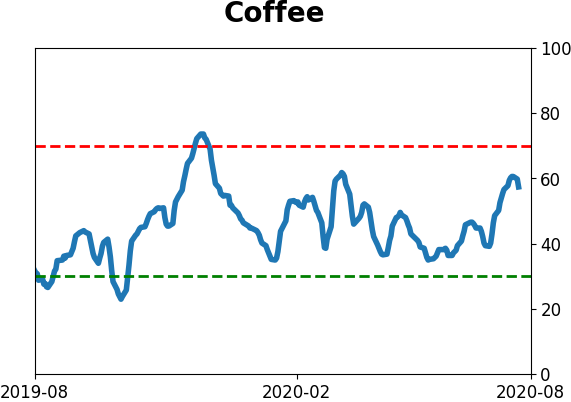
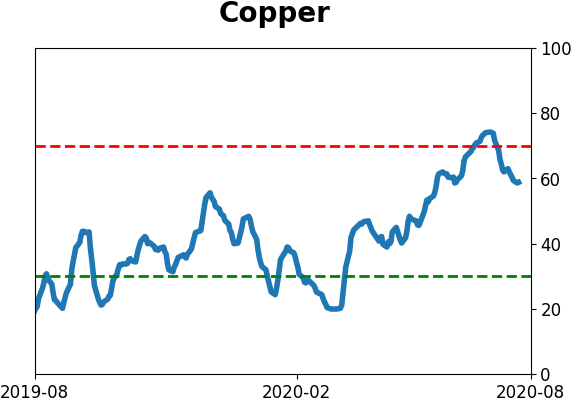
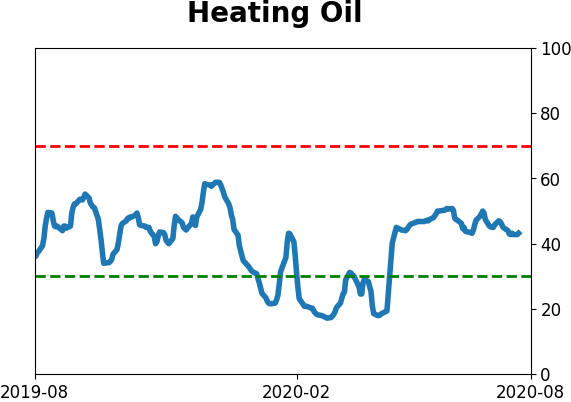
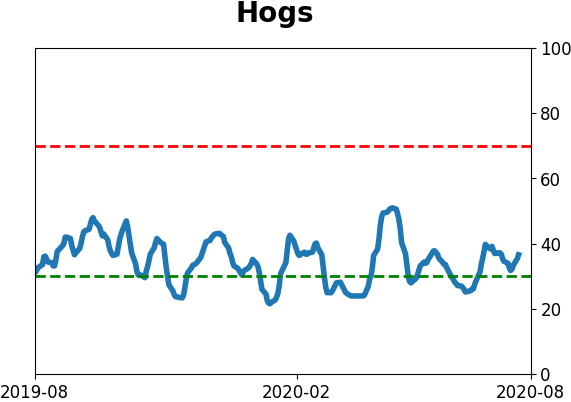
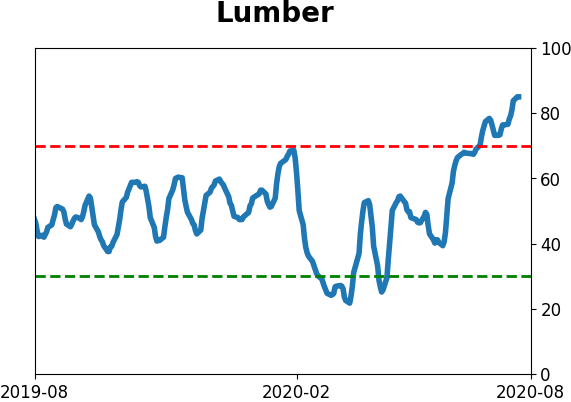
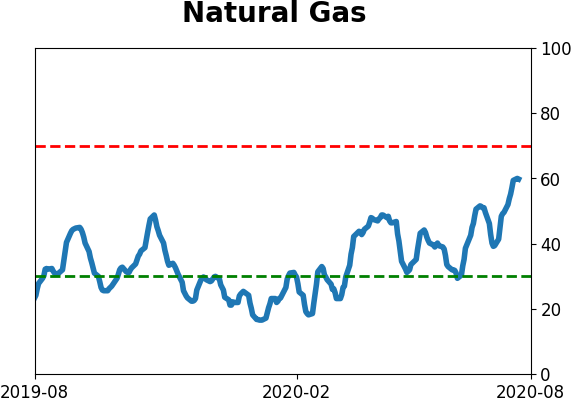
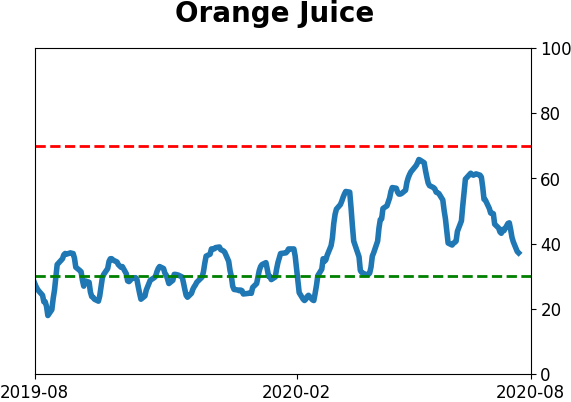
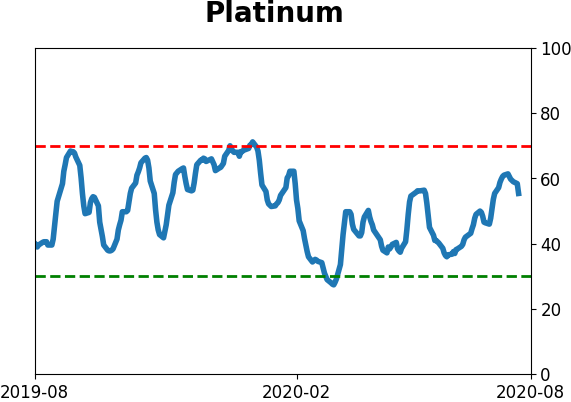
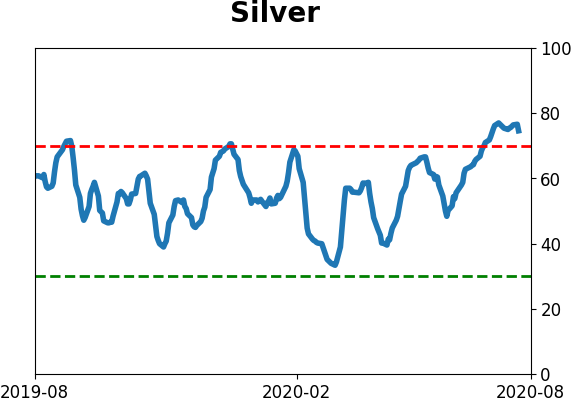
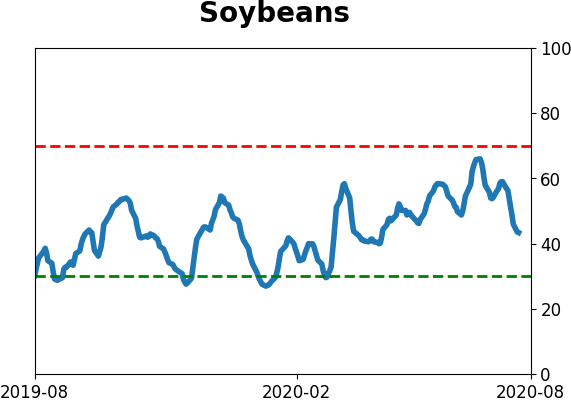
Optimism Index Thumbnails
|
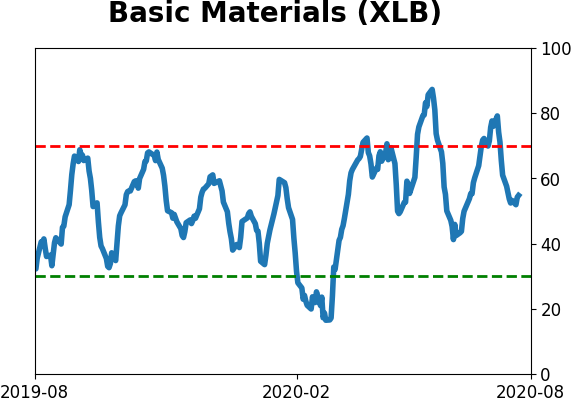
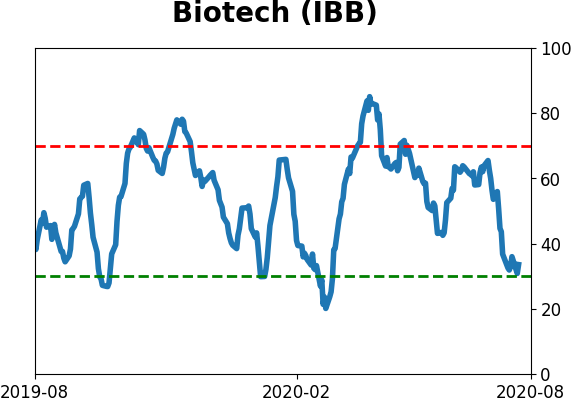
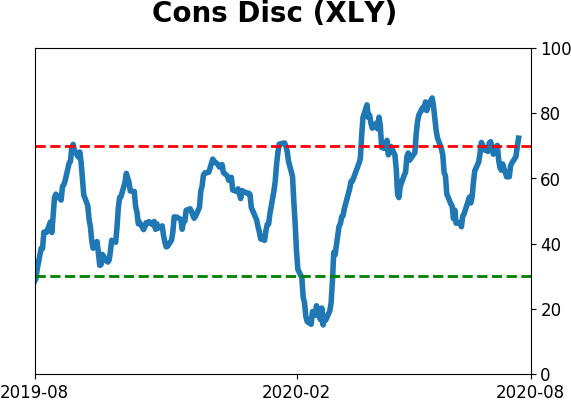
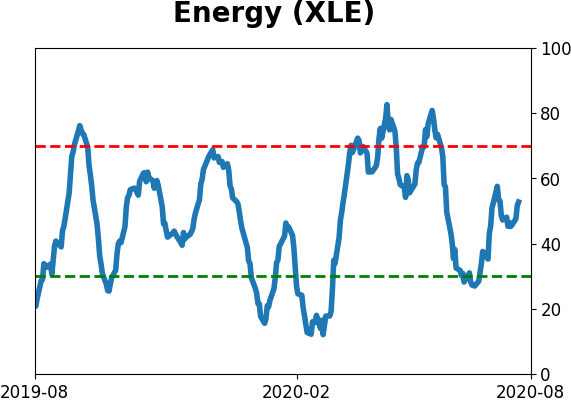
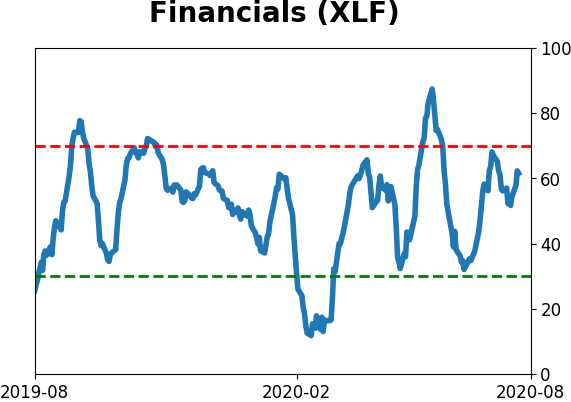
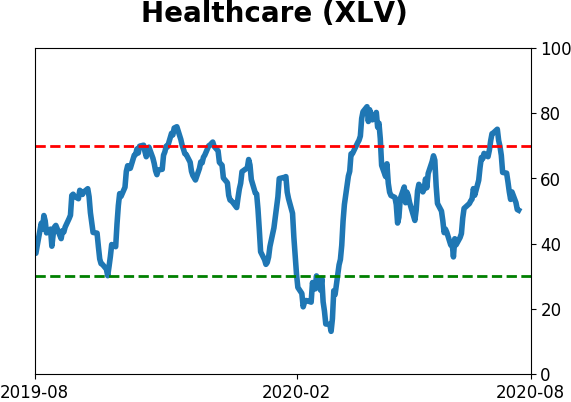
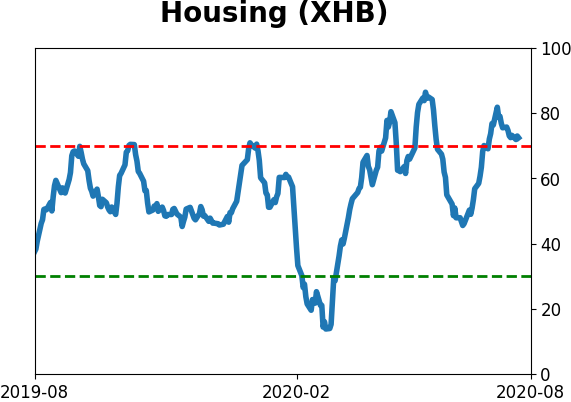
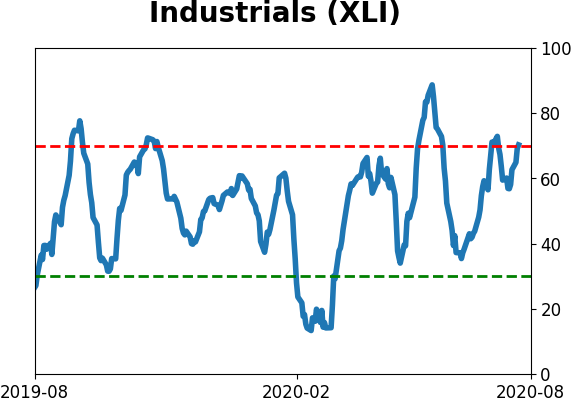
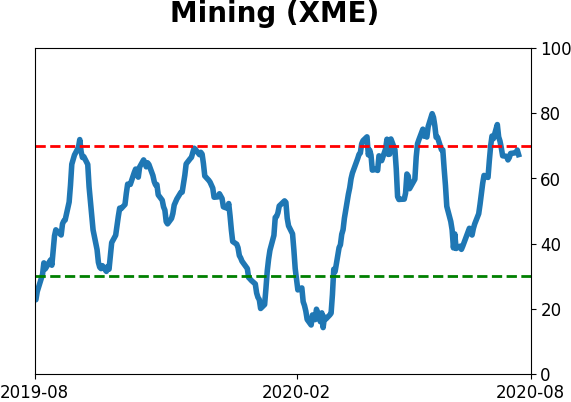
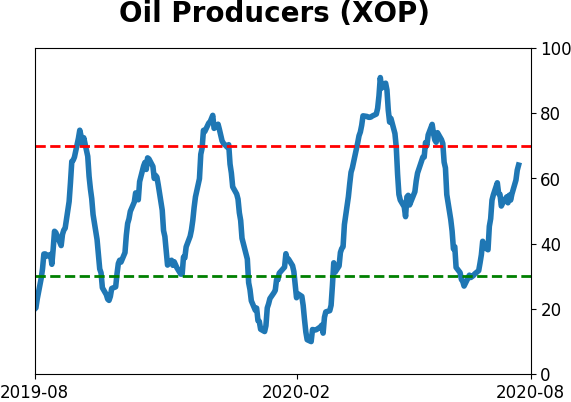
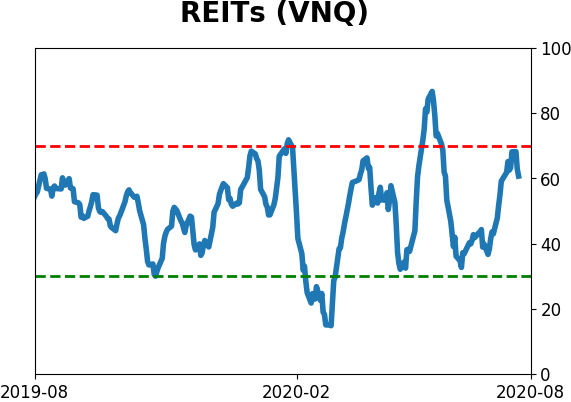
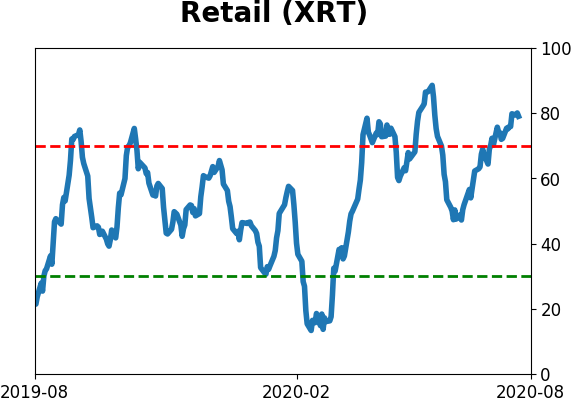
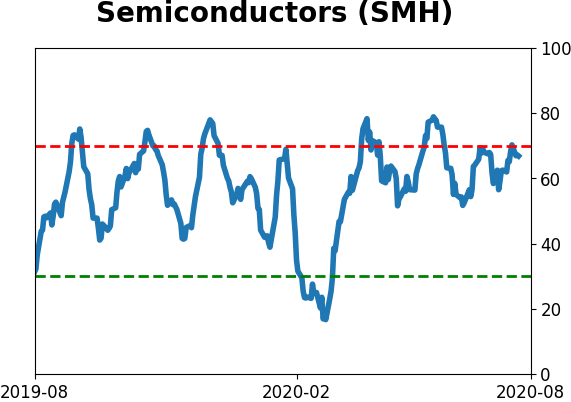
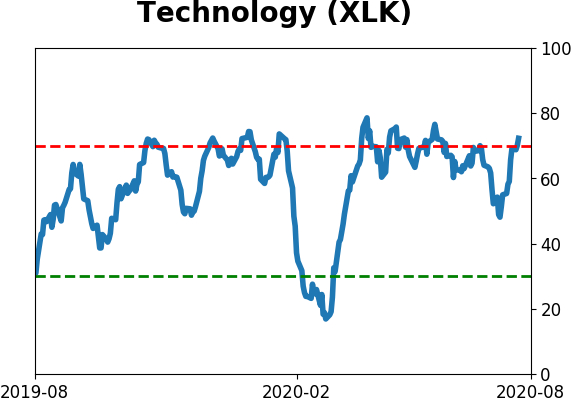
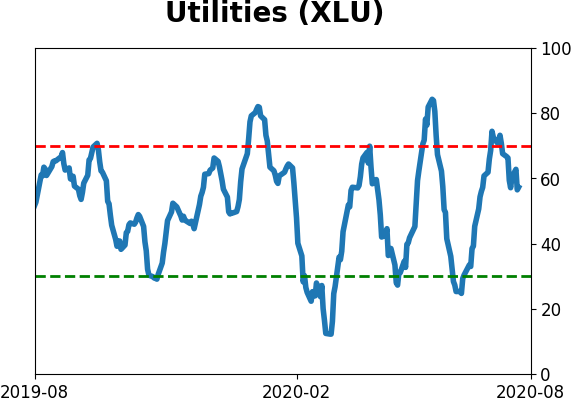
Sector ETF's - 10-Day Moving Average
|
|
|
Country ETF's - 10-Day Moving Average
|
|
|
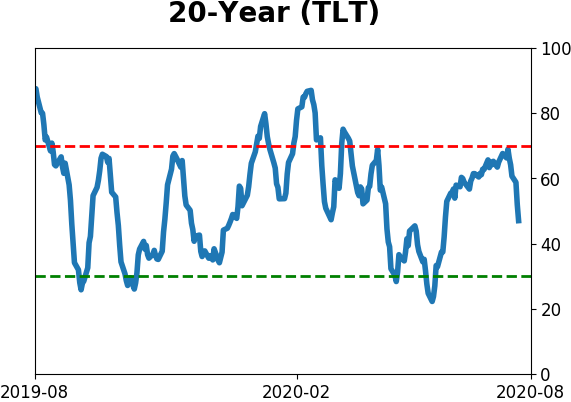
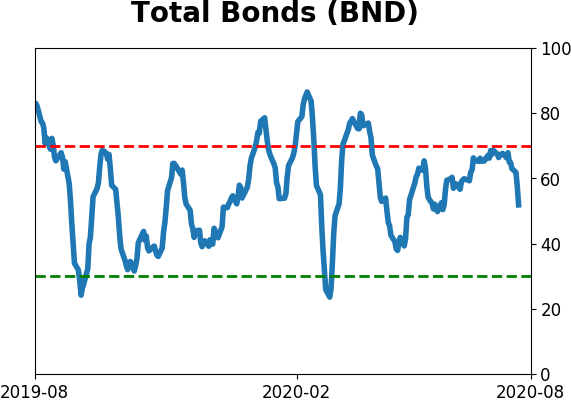
Bond ETF's - 10-Day Moving Average
|
|
|
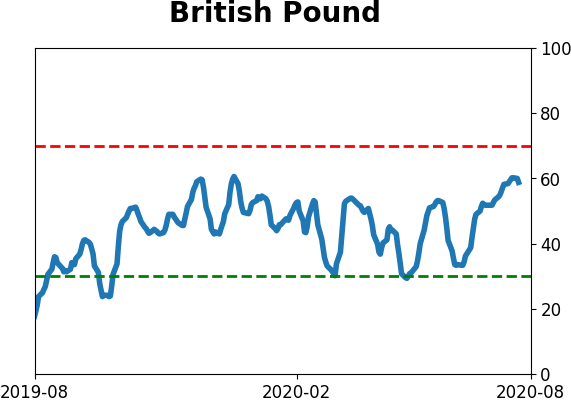
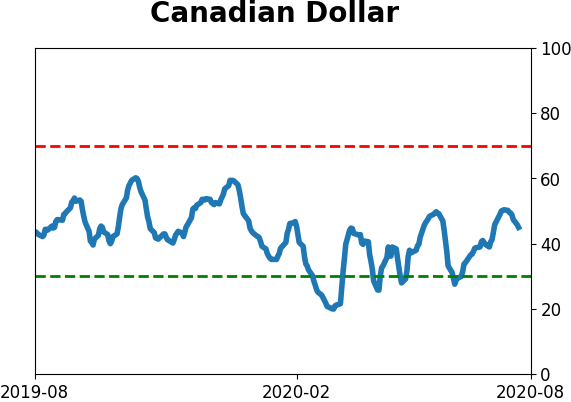
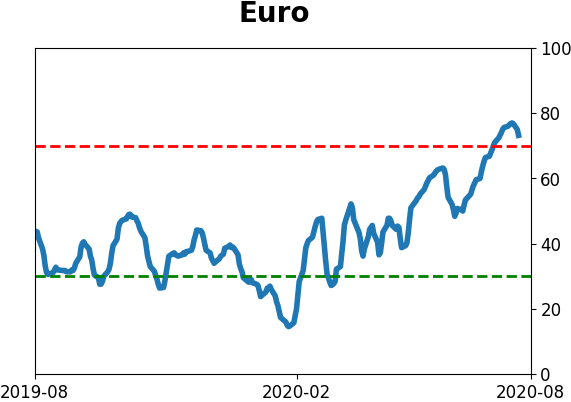
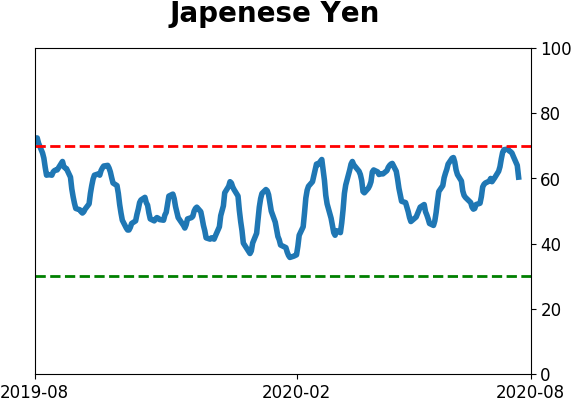
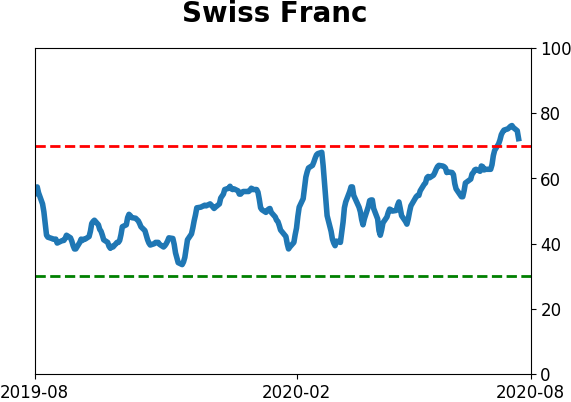
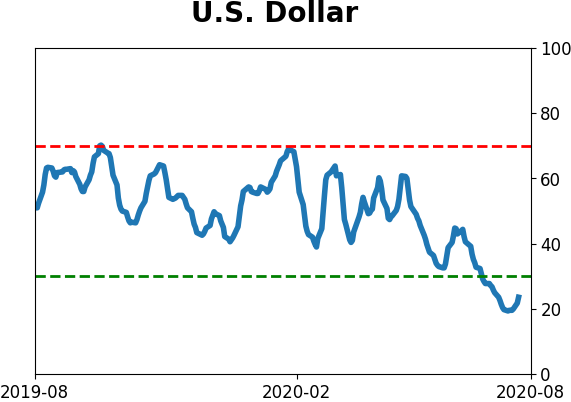
Currency ETF's - 5-Day Moving Average
|
|
|
Commodity ETF's - 5-Day Moving Average
|
|

