Headlines
|
|
Corporations Are Feeding the Ducks but Investors Still Have the Cash:
Investors are holding more than $4.5 trillion in money market funds, but corporations are issuing hundreds of billions of dollars in new stock in supply. The ratio between the two is now the lowest in 20 years.
Bottom Line:
STOCKS: Hold
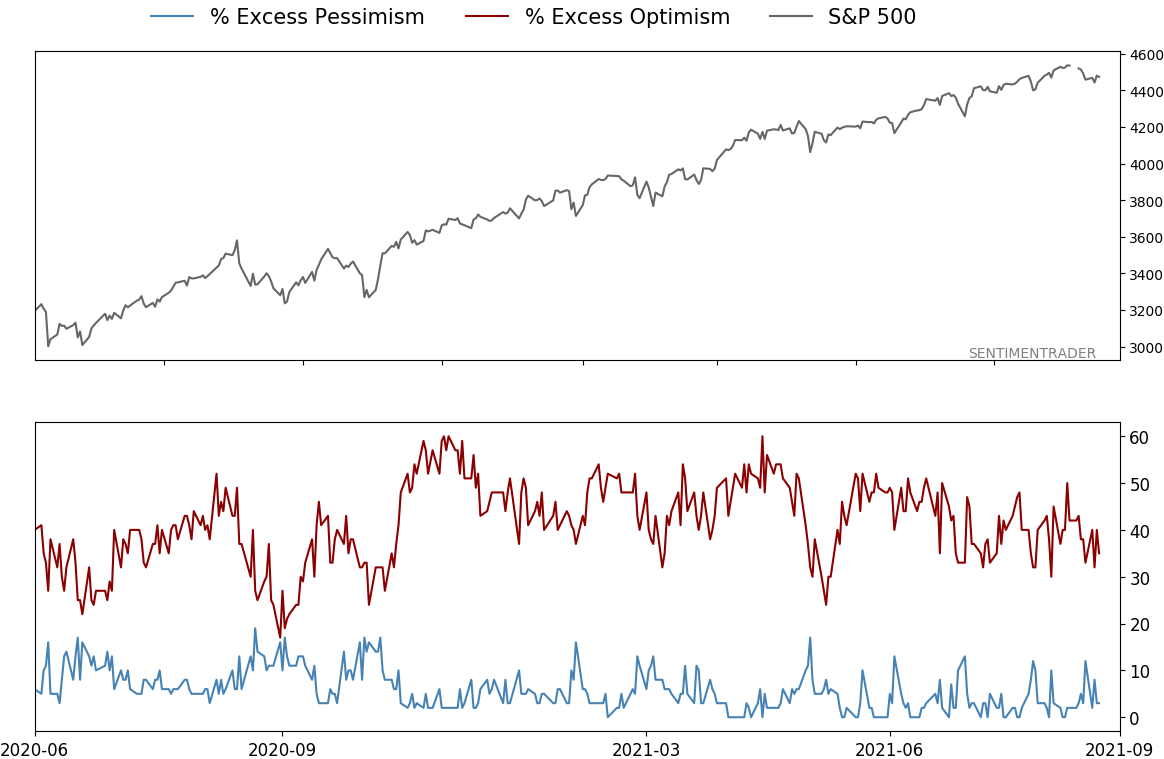
Sentiment continues to decline from the speculative February peak. With deteriorating breadth, this raises the risk of poor short- to medium-term returns until optimism and better breadth returns. See the Outlook & Allocations page for more. BONDS: Hold
Various parts of the market got hit in March, with the lowest Bond Optimism Index we usually see during healthy environments. Bond prices have modest recovered and there is no edge among the data we follow. GOLD: Hold
Gold and miners were rejected after trying to recover above their 200-day averages in May. Lately, some medium-term (not long-term) oversold extremes in breadth measures among miners have triggered.
|
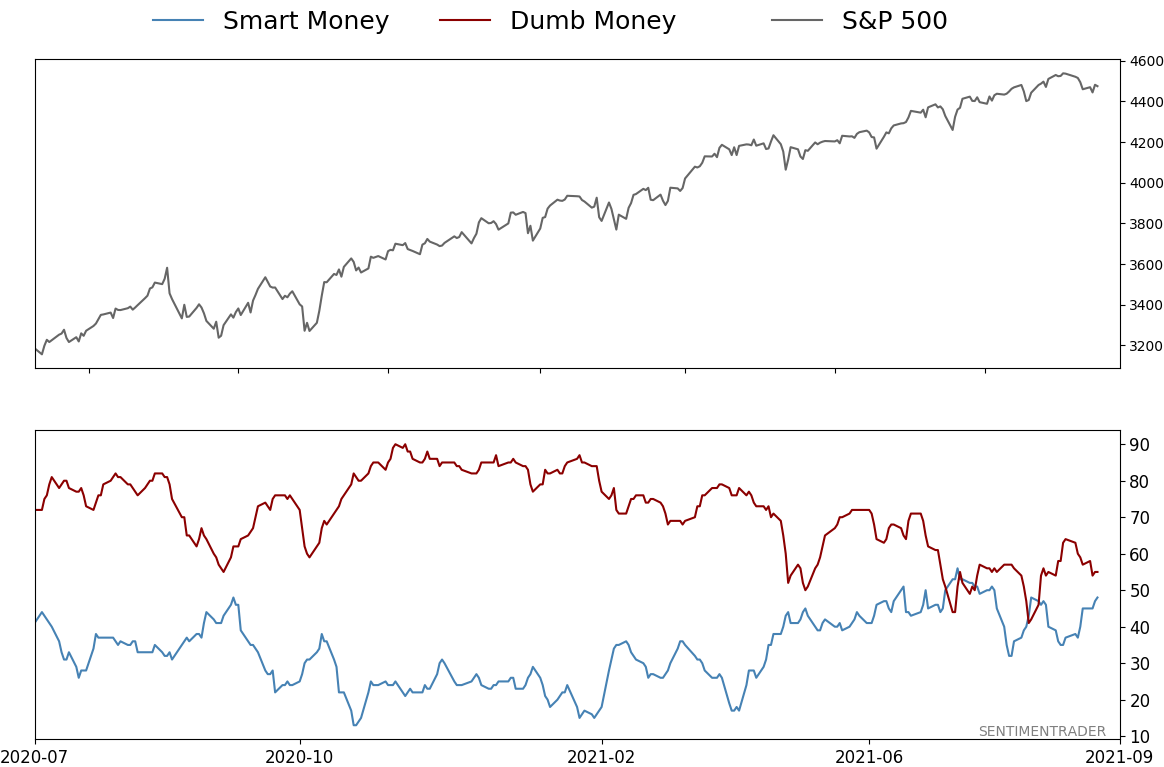
Smart / Dumb Money Confidence
|
Smart Money Confidence: 48%
Dumb Money Confidence: 55%
|
|
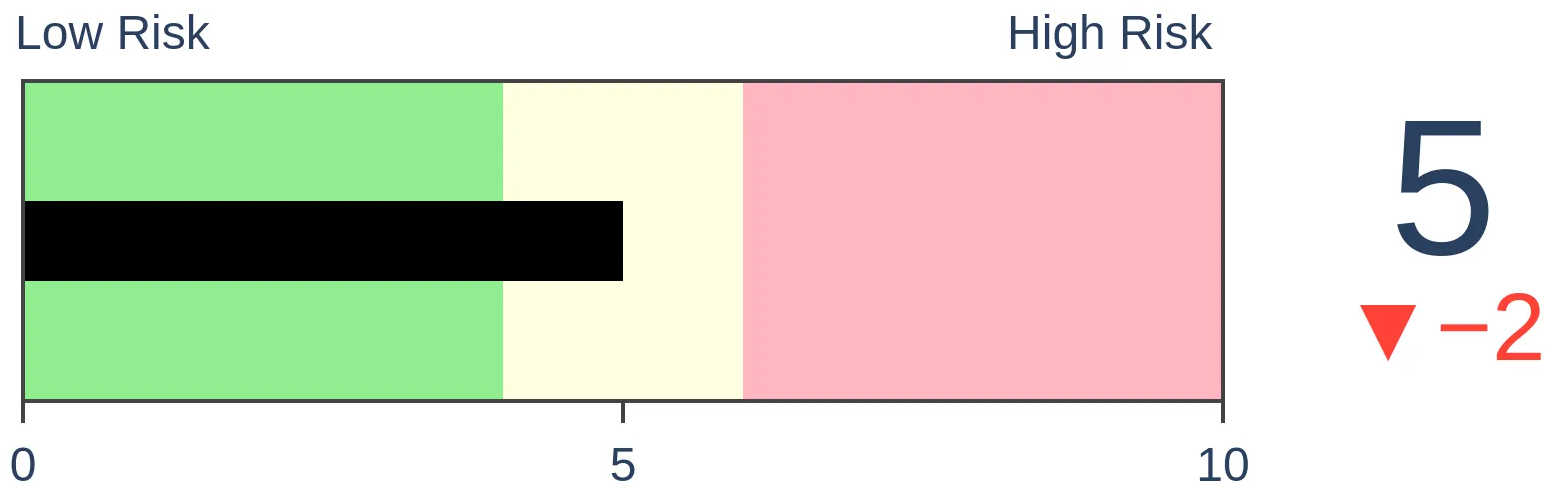
Risk Levels
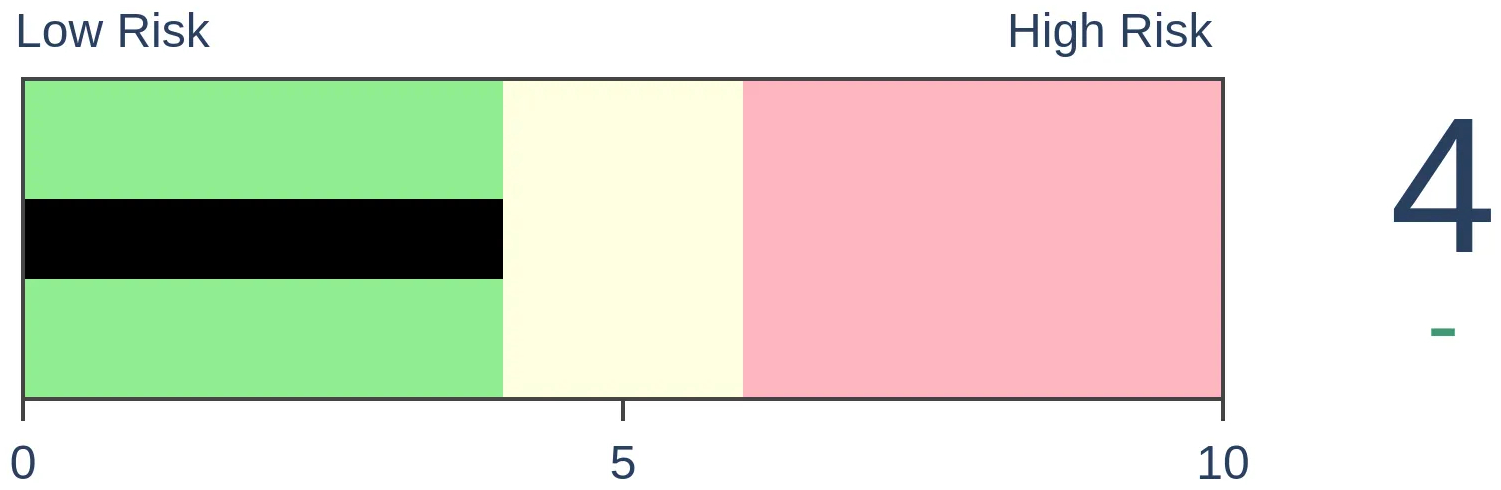
Stocks Short-Term
|
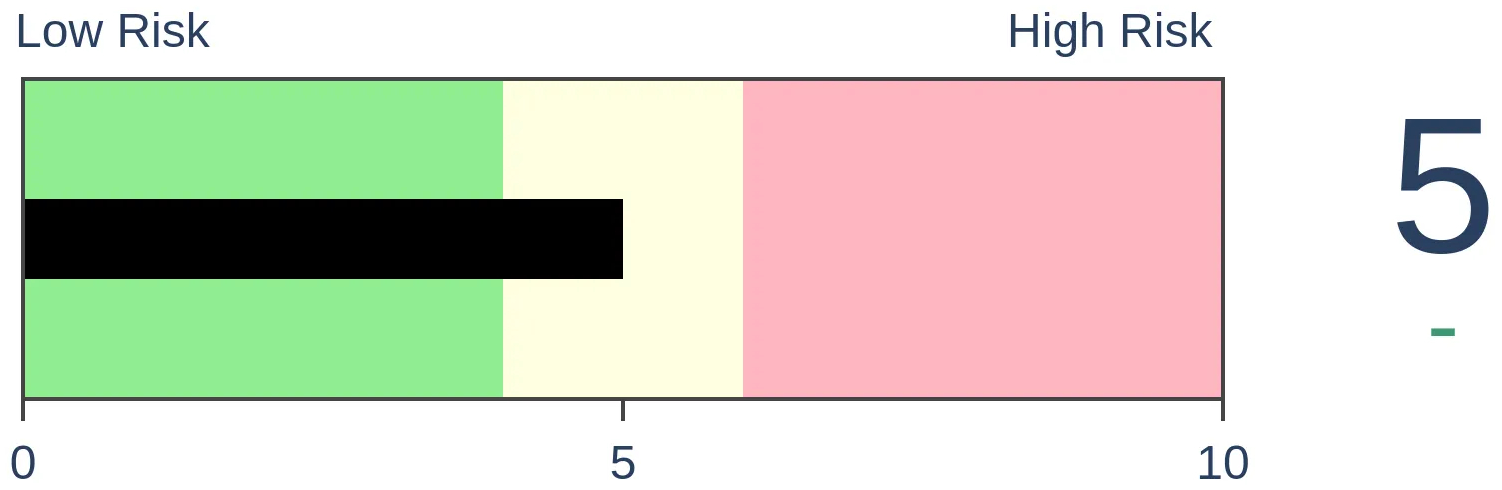
Stocks Medium-Term

|
|
Bonds

|
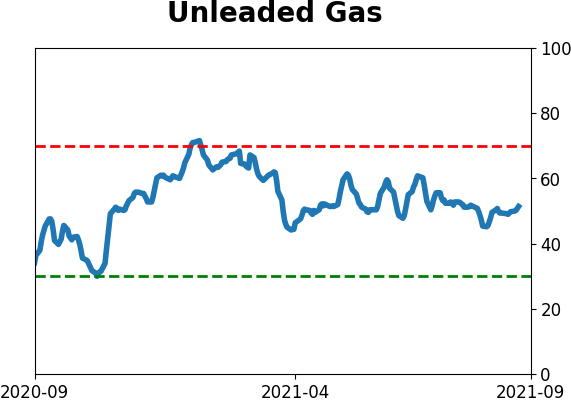
Crude Oil
|
|
Gold
|
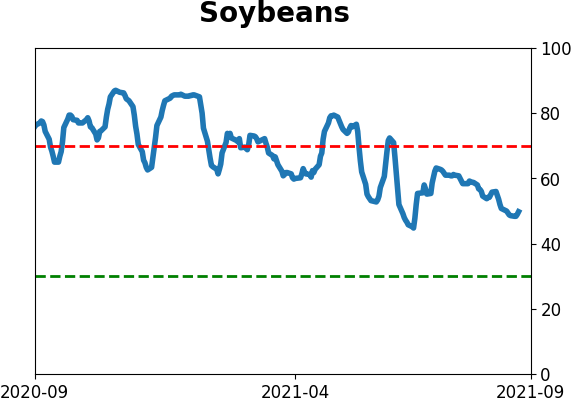
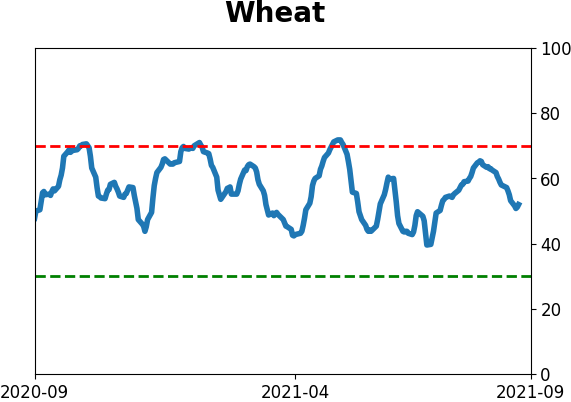
Agriculture

|
|
Research
By Jason Goepfert
BOTTOM LINE
Investors are holding more than $4.5 trillion in money market funds, but corporations are issuing hundreds of billions of dollars in new stock in supply. The ratio between the two is now the lowest in 20 years.
FORECAST / TIMEFRAME
None
|
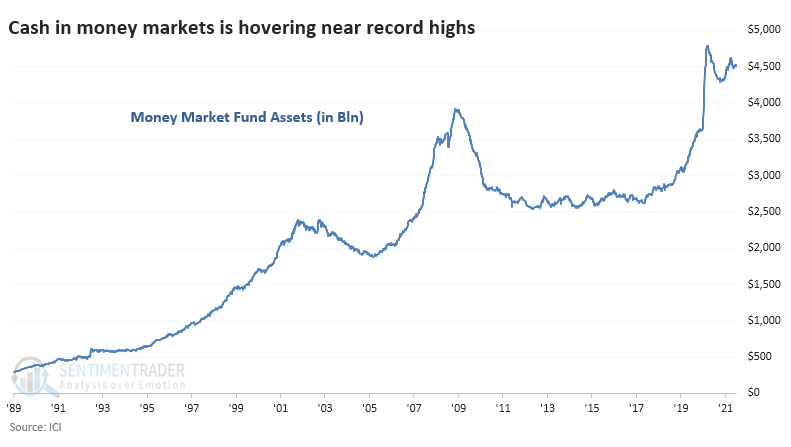
There are near-record amounts of cash ready to be deployed into markets...and corporations are doing their best to drain it.
Investors have a near-record amount of cash ready to invest in stocks (or whatever else), a bullish indication of "cash on the sidelines" as deceptive as that clichè is. According to the Investment Company Institute, investors hold more than $4.5 trillion (with a "t") in money market funds.
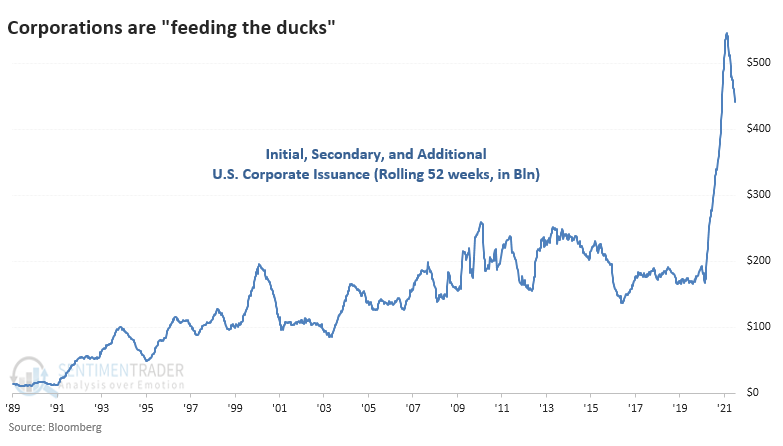
And yet corporations are issuing a record amount of stock, a bearish indication of supply and smart-money selling pressure. Bloomberg data shows that U.S. corporations have issued more than $450 billion in stock via IPOs, secondary, and additional offerings over the past 52 weeks.
Bullish investors will give more credence to the former; bearish investors the latter. There is little question that both are factual, and it's a relatively unusual situation. Usually, when corporations are issuing boatloads of stock, investors have small cash reserves and vice-versa; when corporations can't issue shares due to lack of demand, investors are usually hoarding cash at the time.
It's rare to see such high levels at the same time. If we look at a ratio of the two, then things become a bit clearer. The chart below shows the ratio of money market assets to a rolling 52-week sum of corporate issuance. The higher the ratio, the more cash that investors have relative to the supply of shares.
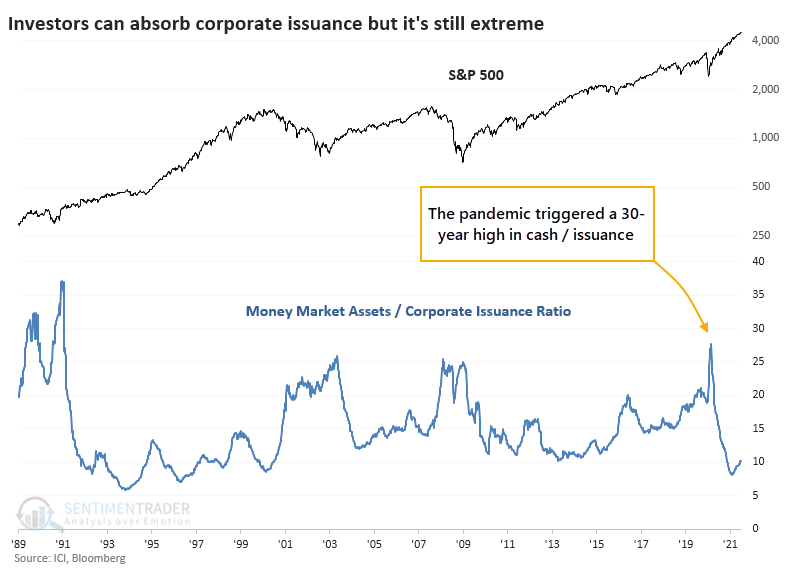
During the pandemic panic, the ratio neared 30 and was the highest in 30 years. In other words, there was 28 times more cash available than shares offered in supply. There are ways to quibble with the technicals, but it's simply meant as a reflection of sentiment.
Over the past year, the ratio has declined steadily as supply ramped up. Corporations are "feeding the ducks," as the saying goes. Even though money market assets haven't been drained much, the skyrocketing supply has caused the ratio to drop below 10 for the first time since the year 2000.
That sounds ominous, but to be fair, the ratio was below 10 for much of the late 1990s as stocks were soaring. So relying on this as a timing mechanism is dubious at best. It would best be used (as many sentiment indicators are) during times of duress when the ratio reaches 25 or more.
Over the past decade, when this ratio dropped close to 10, stocks entered a digestion phase, though it took a long while in 2014-15. We'd place more weight on that than the mid-1990s when it had no impact, simply because we tend to give more credence to recent signals due to changes in market structure, etc. Again, this can't be used very well for timing; it's more of an environmental yellow flag.
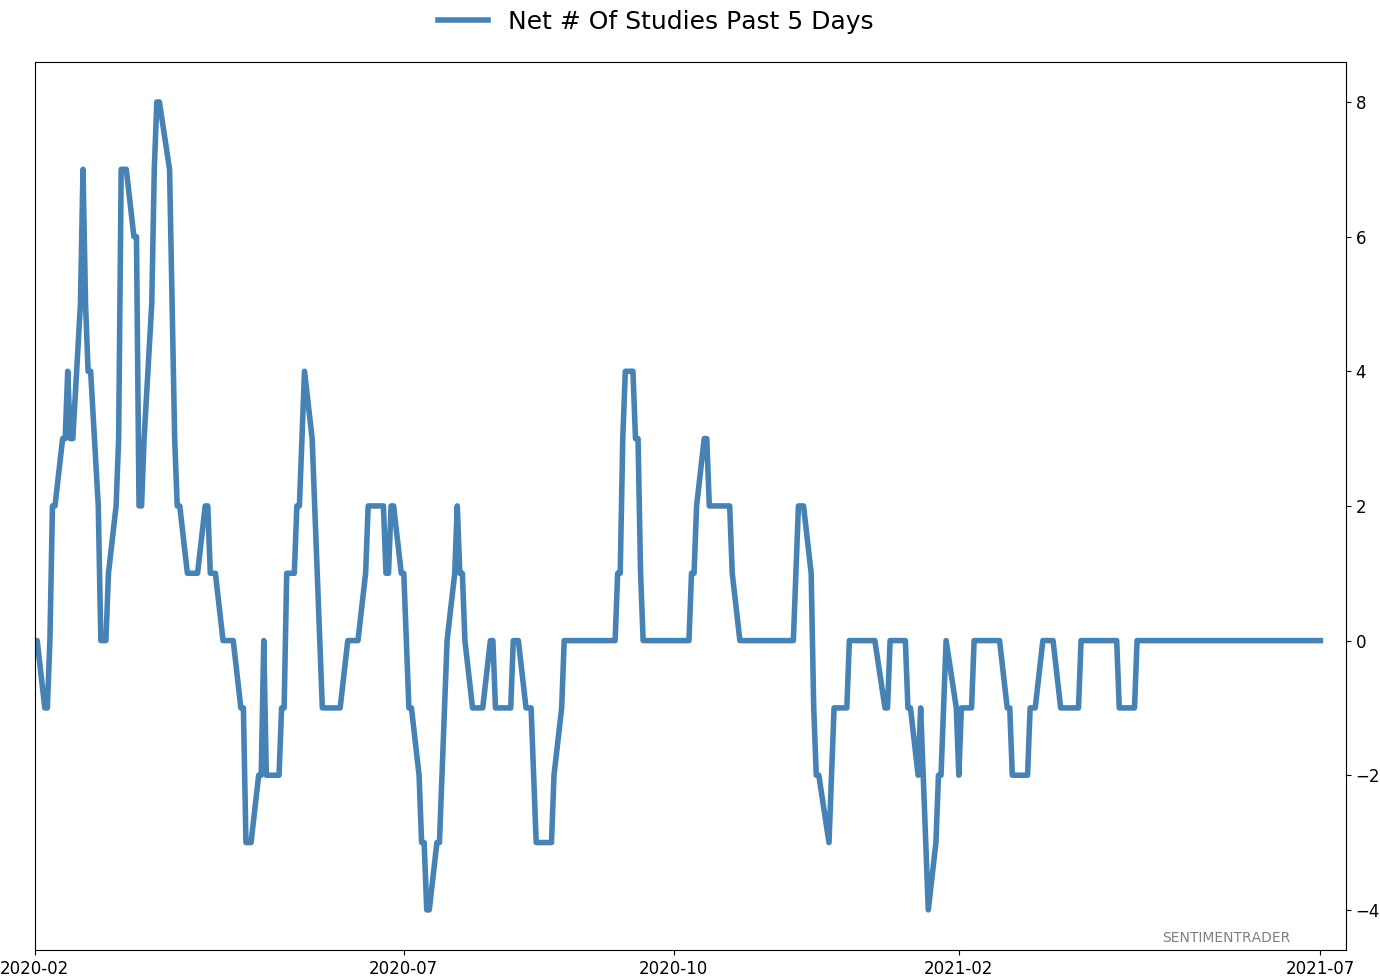
Active Studies
| Time Frame | Bullish | Bearish | | Short-Term | 0 | 6 | | Medium-Term | 5 | 3 | | Long-Term | 11 | 5 |
|
Indicators at Extremes
Portfolio
| Position | Description | Weight % | Added / Reduced | Date | | Stocks | RSP | 4.1 | Added 4.1% | 2021-05-19 | | Bonds | 23.9% BND, 6.9% SCHP | 30.7 | Reduced 7.1% | 2021-05-19 | | Commodities | GCC | 2.6 | Reduced 2.1%
| 2020-09-04 | | Precious Metals | GDX | 5.6 | Reduced 4.2% | 2021-05-19 | | Special Situations | 4.3% XLE, 2.2% PSCE | 7.6 | Reduced 5.6% | 2021-04-22 | | Cash | | 49.4 | | |
|
Updates (Changes made today are underlined)
Much of our momentum and trend work has remained positive for several months, with some scattered exceptions. Almost all sentiment-related work has shown a poor risk/reward ratio for stocks, especially as speculation drove to record highs in exuberance in February. Much of that has worn off, and most of our models are back toward neutral levels. There isn't much to be excited about here. The same goes for bonds and even gold. Gold has been performing well lately and is back above long-term trend lines. The issue is that it has a poor record of holding onto gains when attempting a long-term trend change like this, so we'll take a wait-and-see approach. RETURN YTD: 8.7% 2020: 8.1%, 2019: 12.6%, 2018: 0.6%, 2017: 3.8%, 2016: 17.1%, 2015: 9.2%, 2014: 14.5%, 2013: 2.2%, 2012: 10.8%, 2011: 16.5%, 2010: 15.3%, 2009: 23.9%, 2008: 16.2%, 2007: 7.8%
|
|
Phase Table
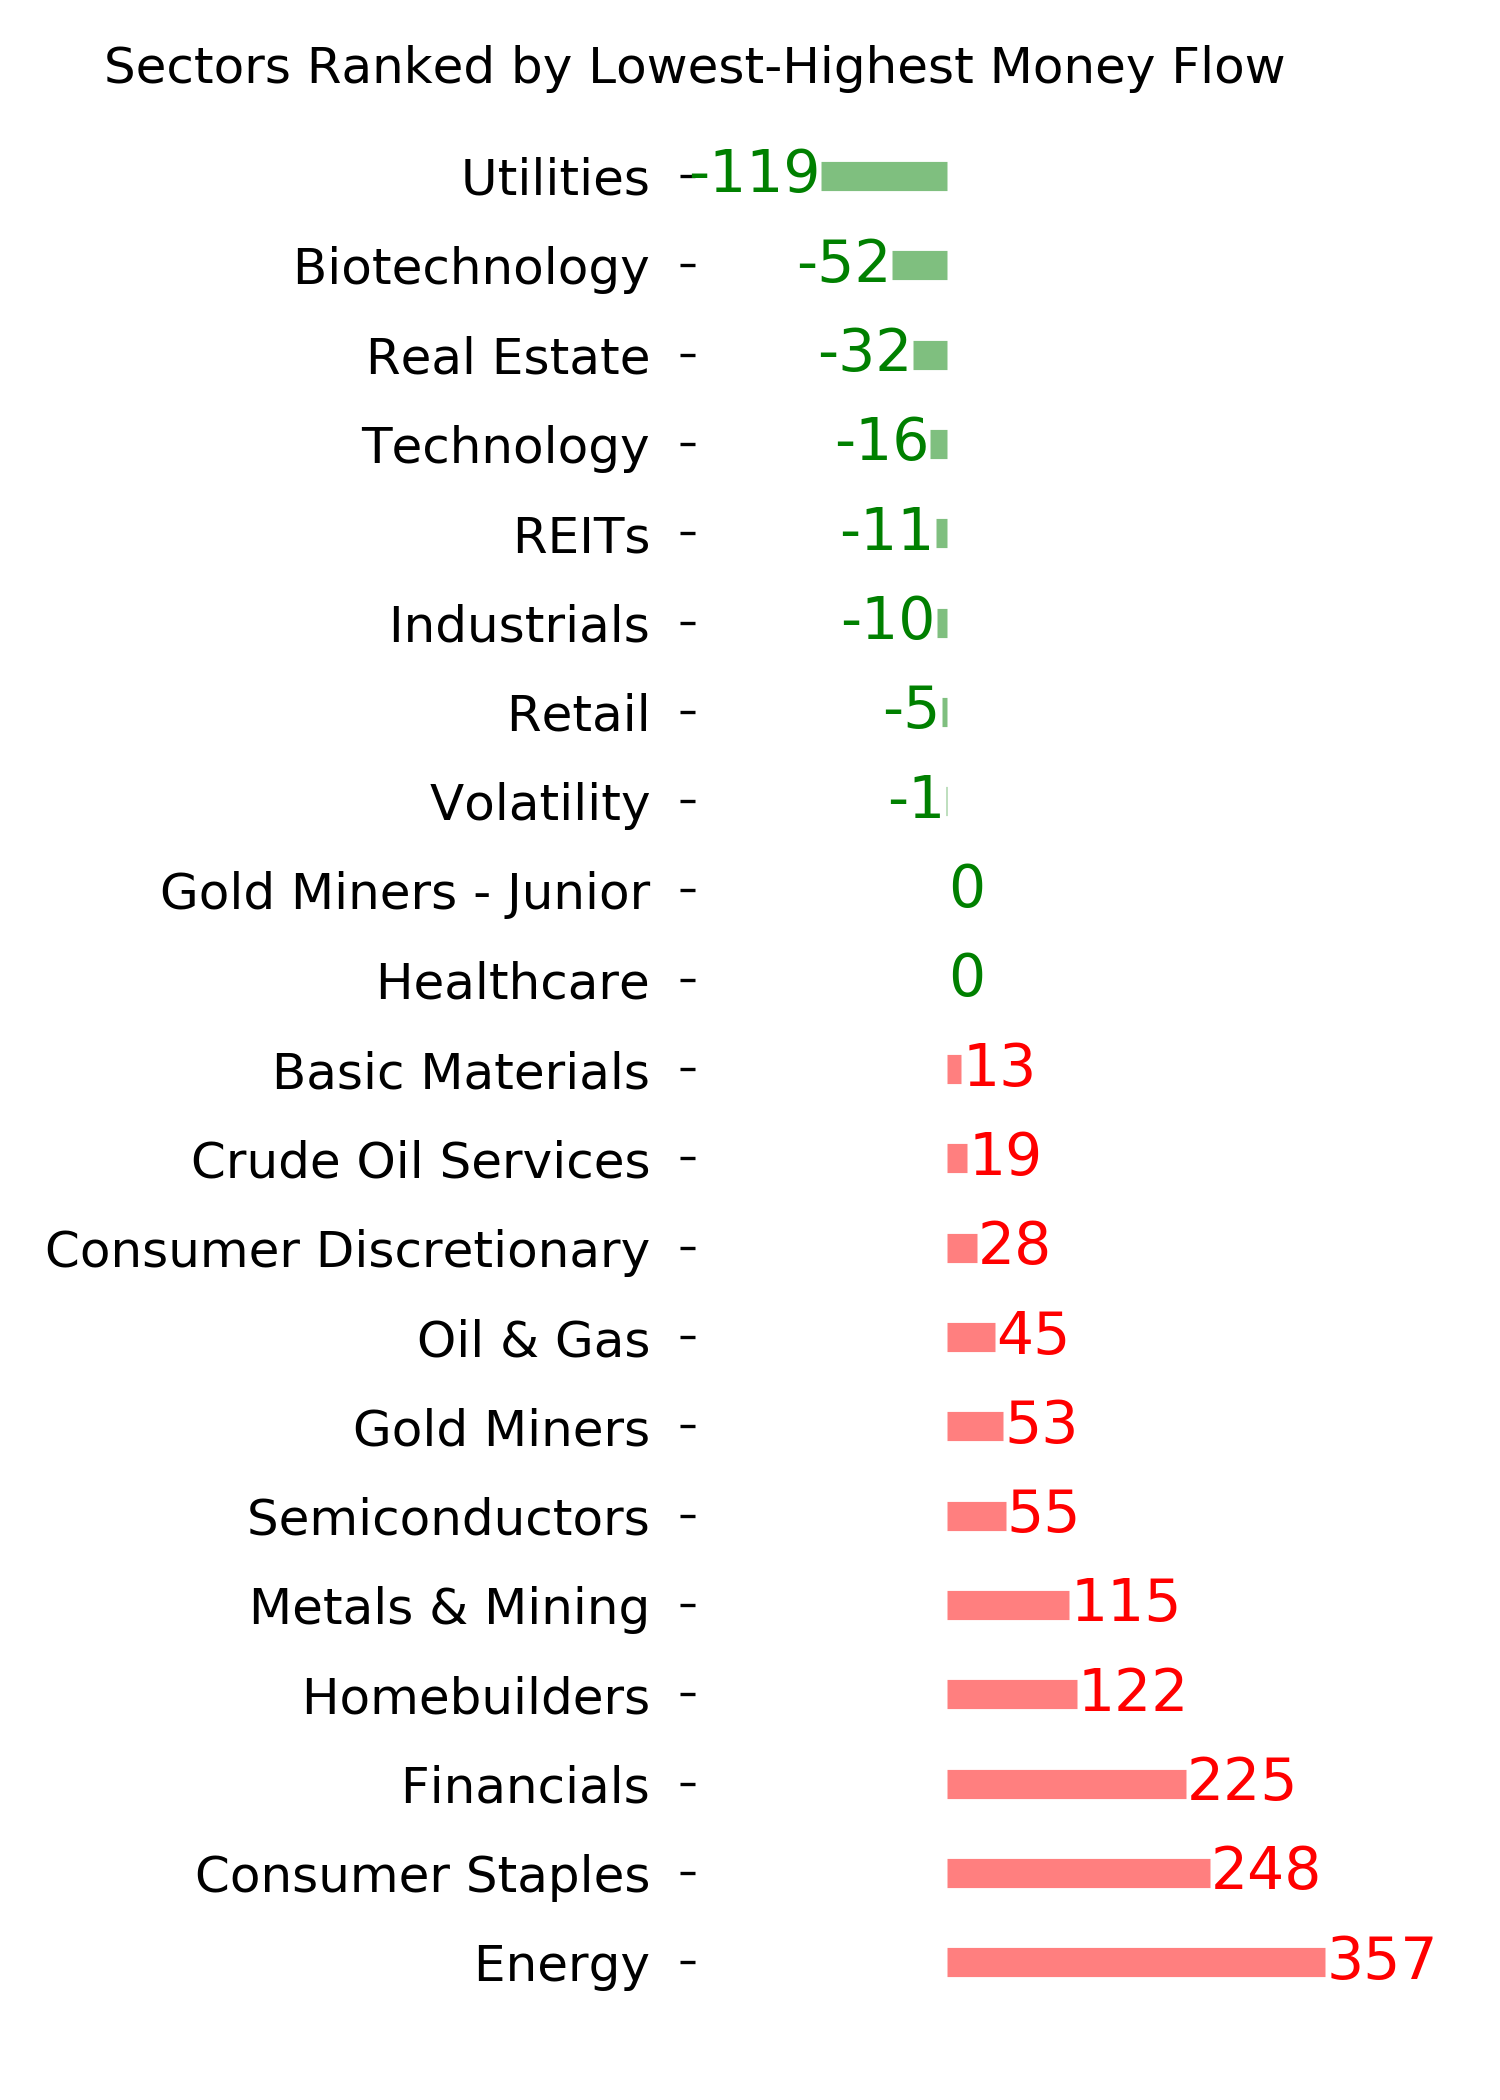
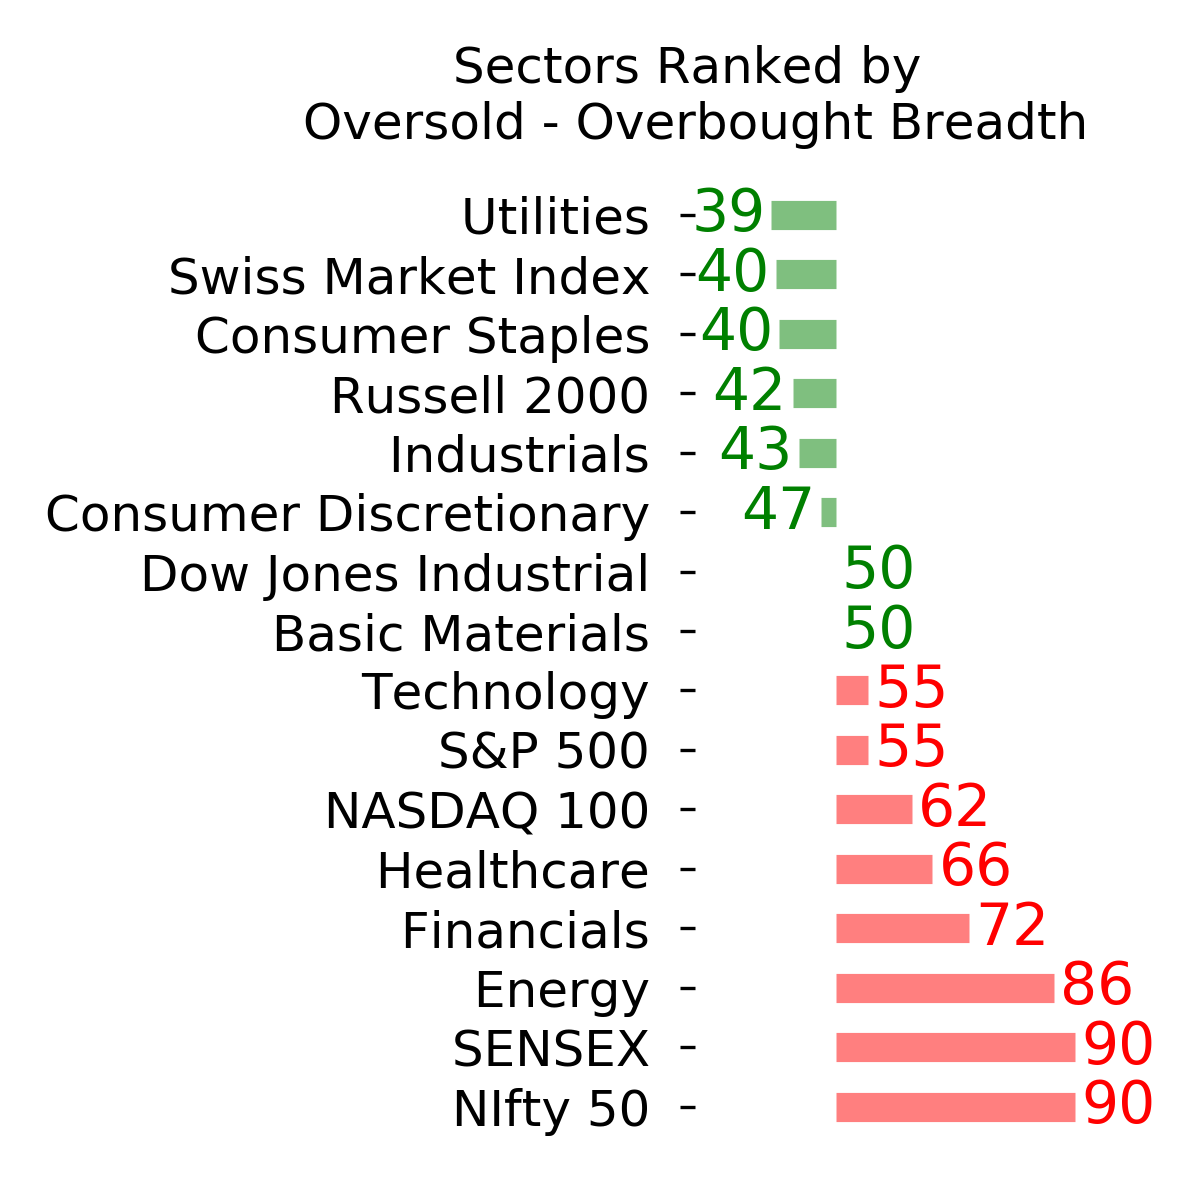
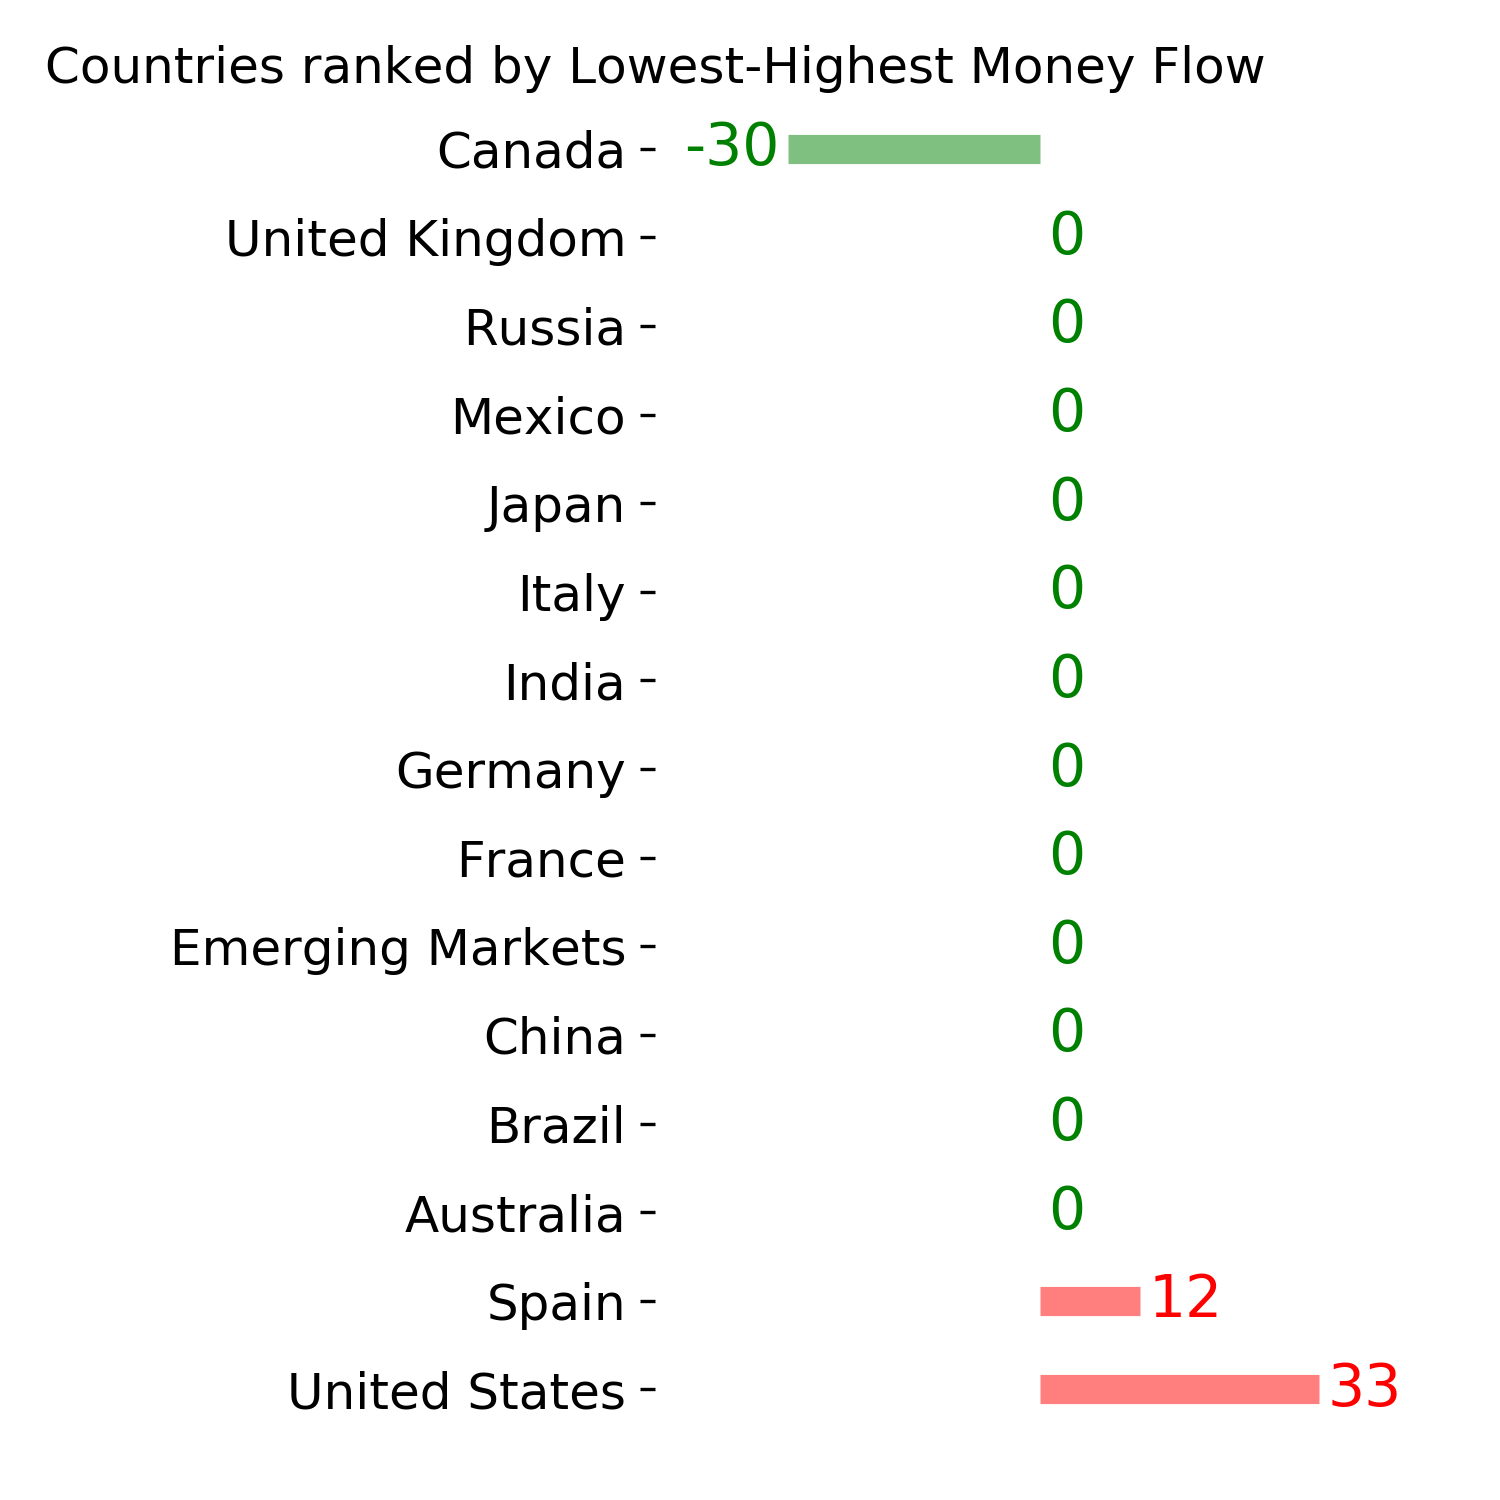
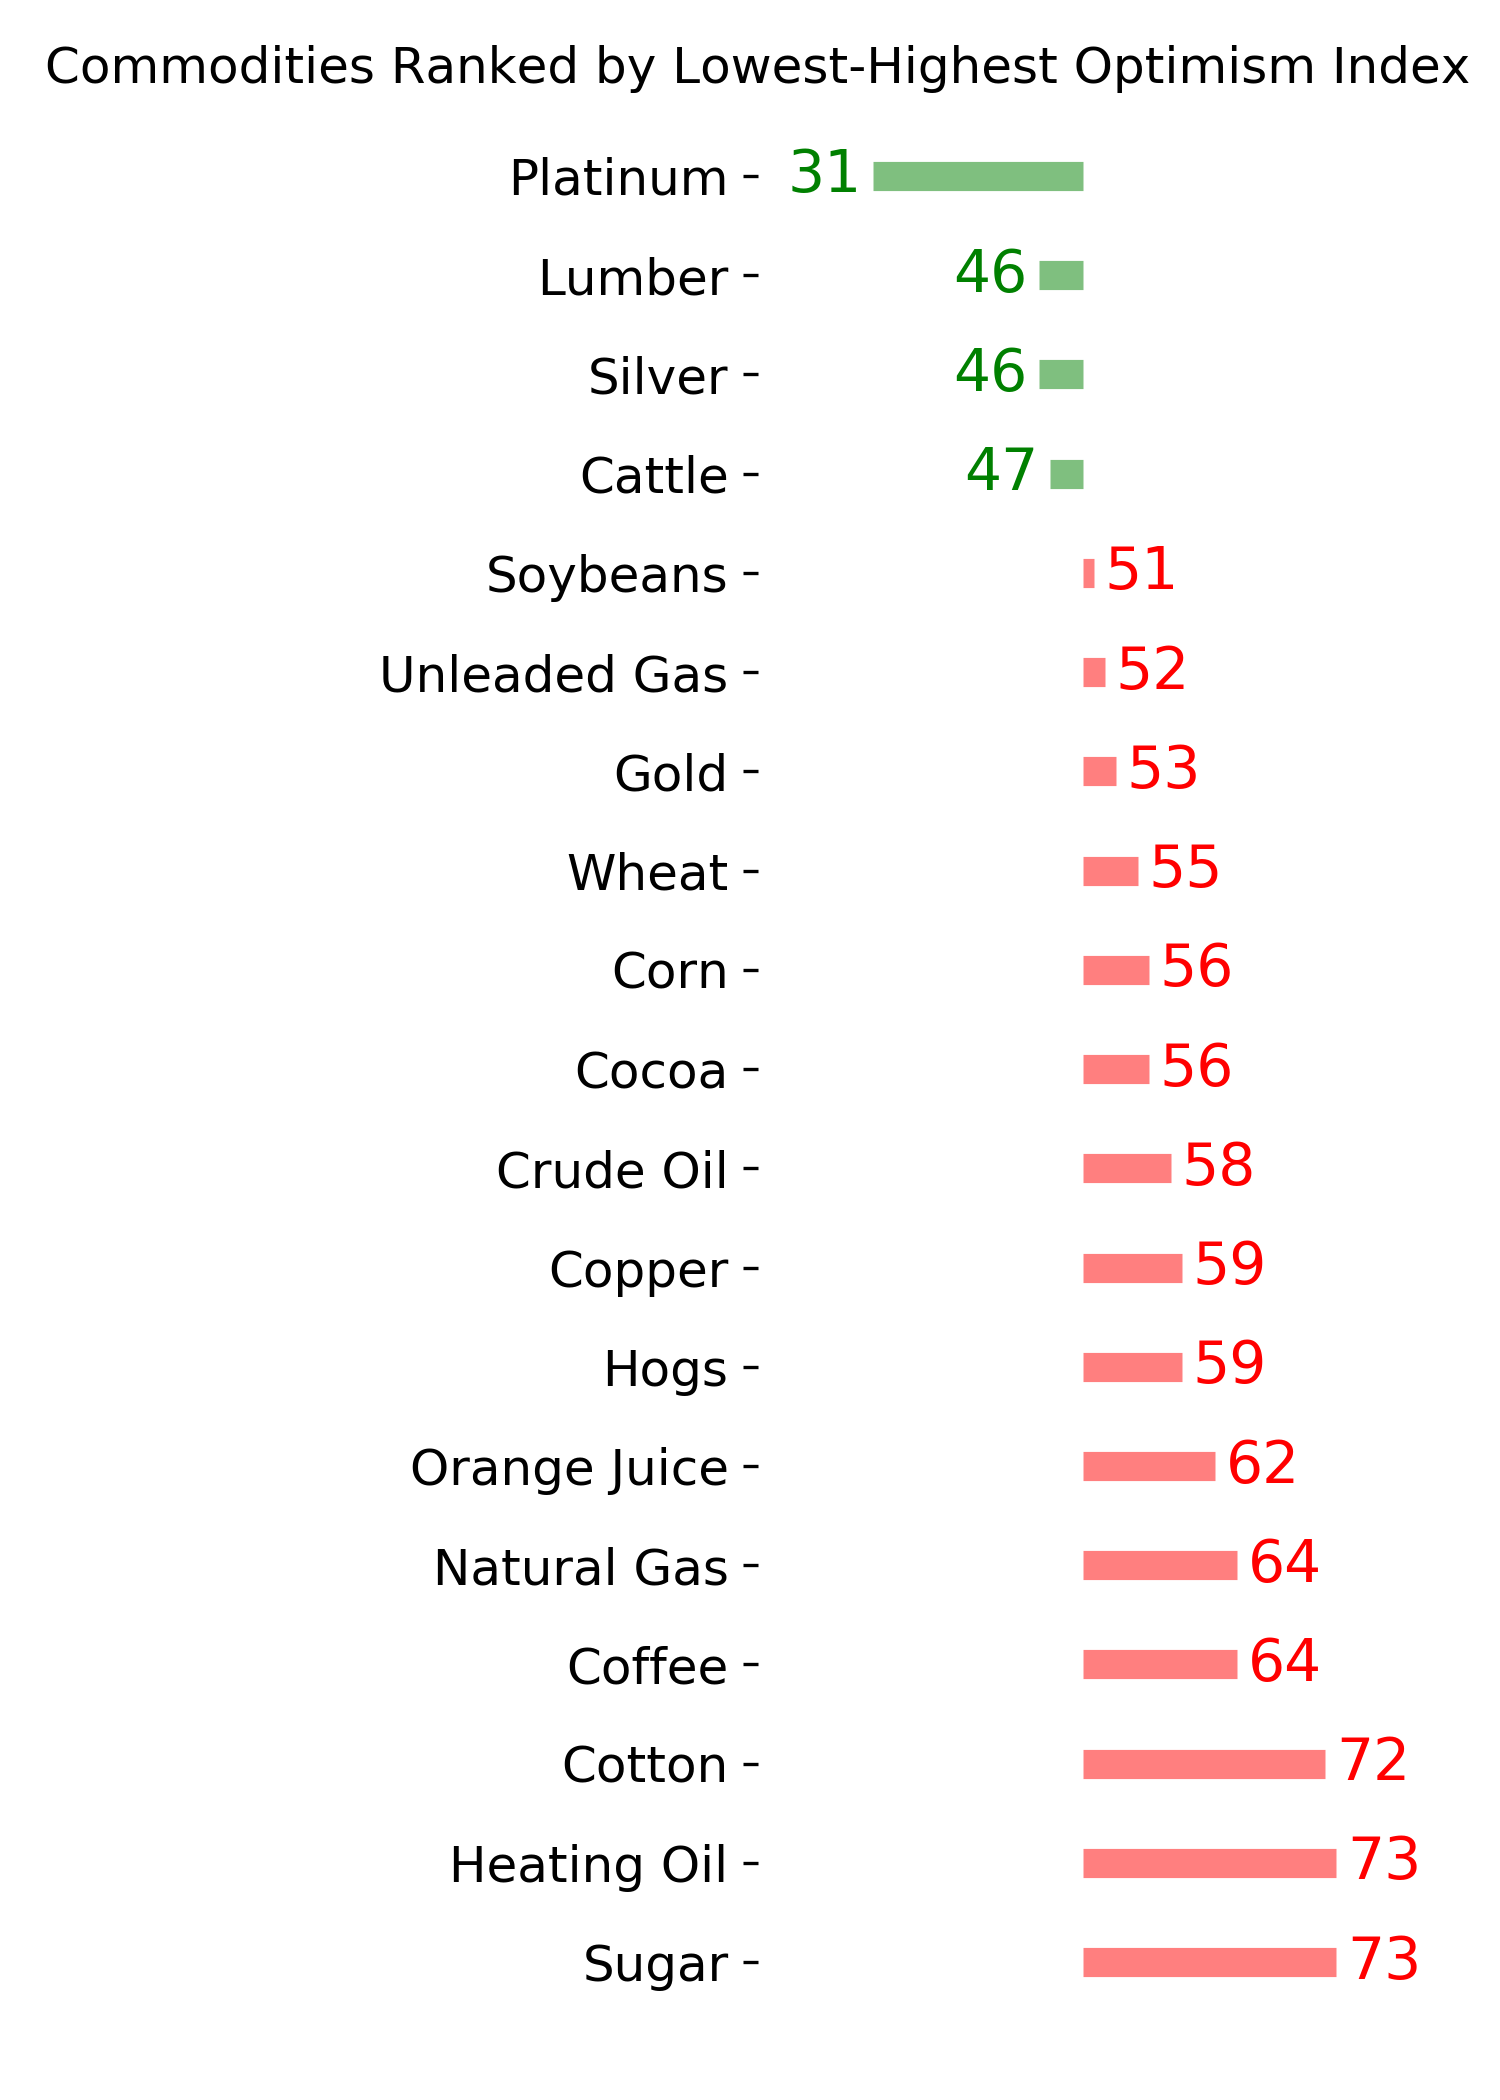
Ranks
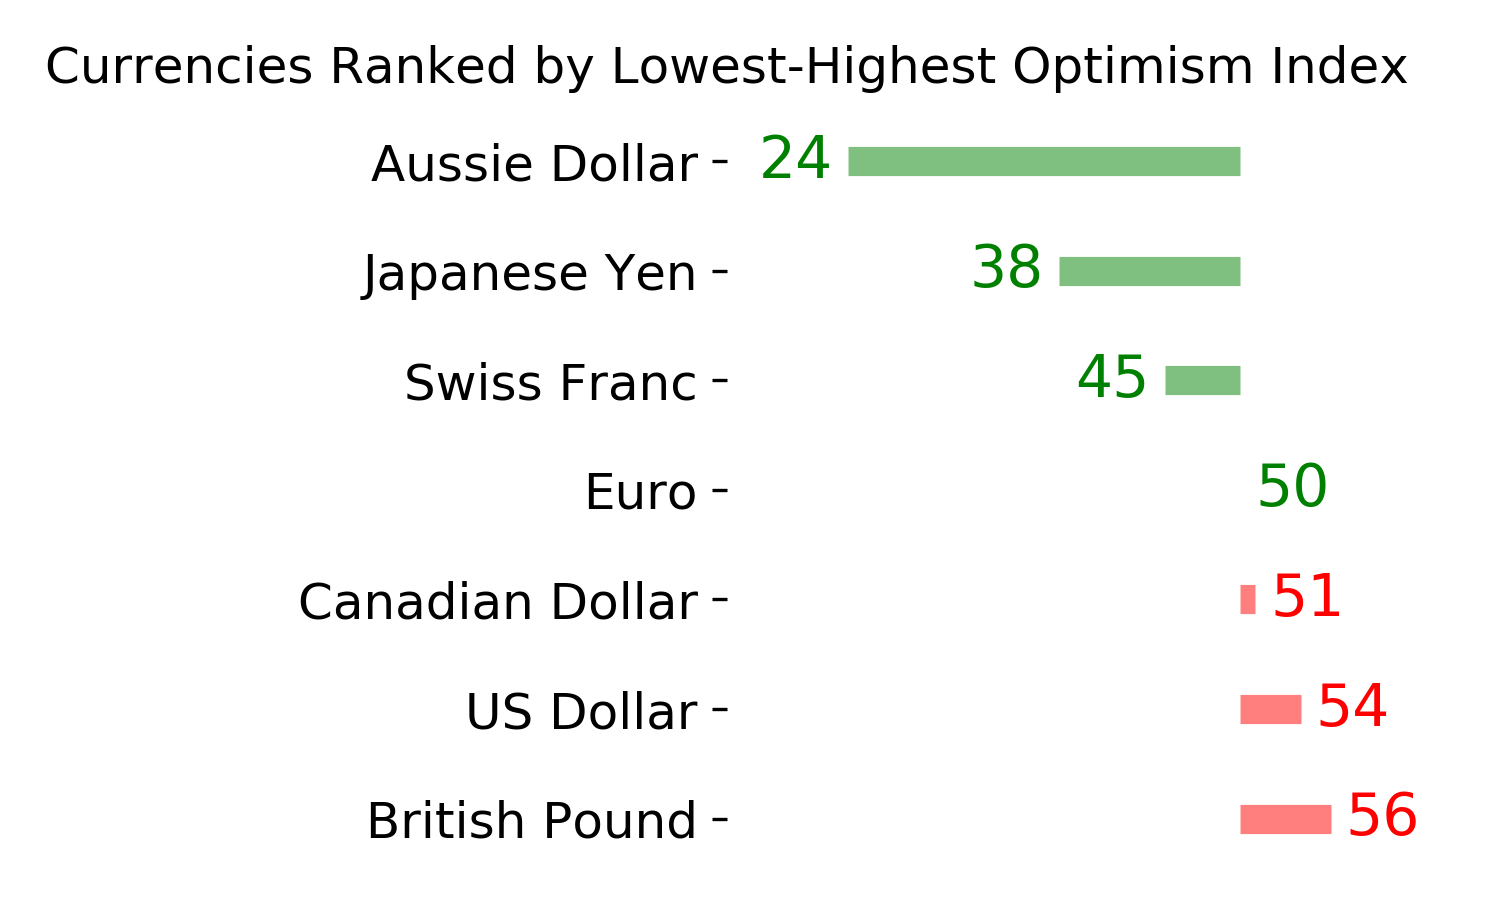
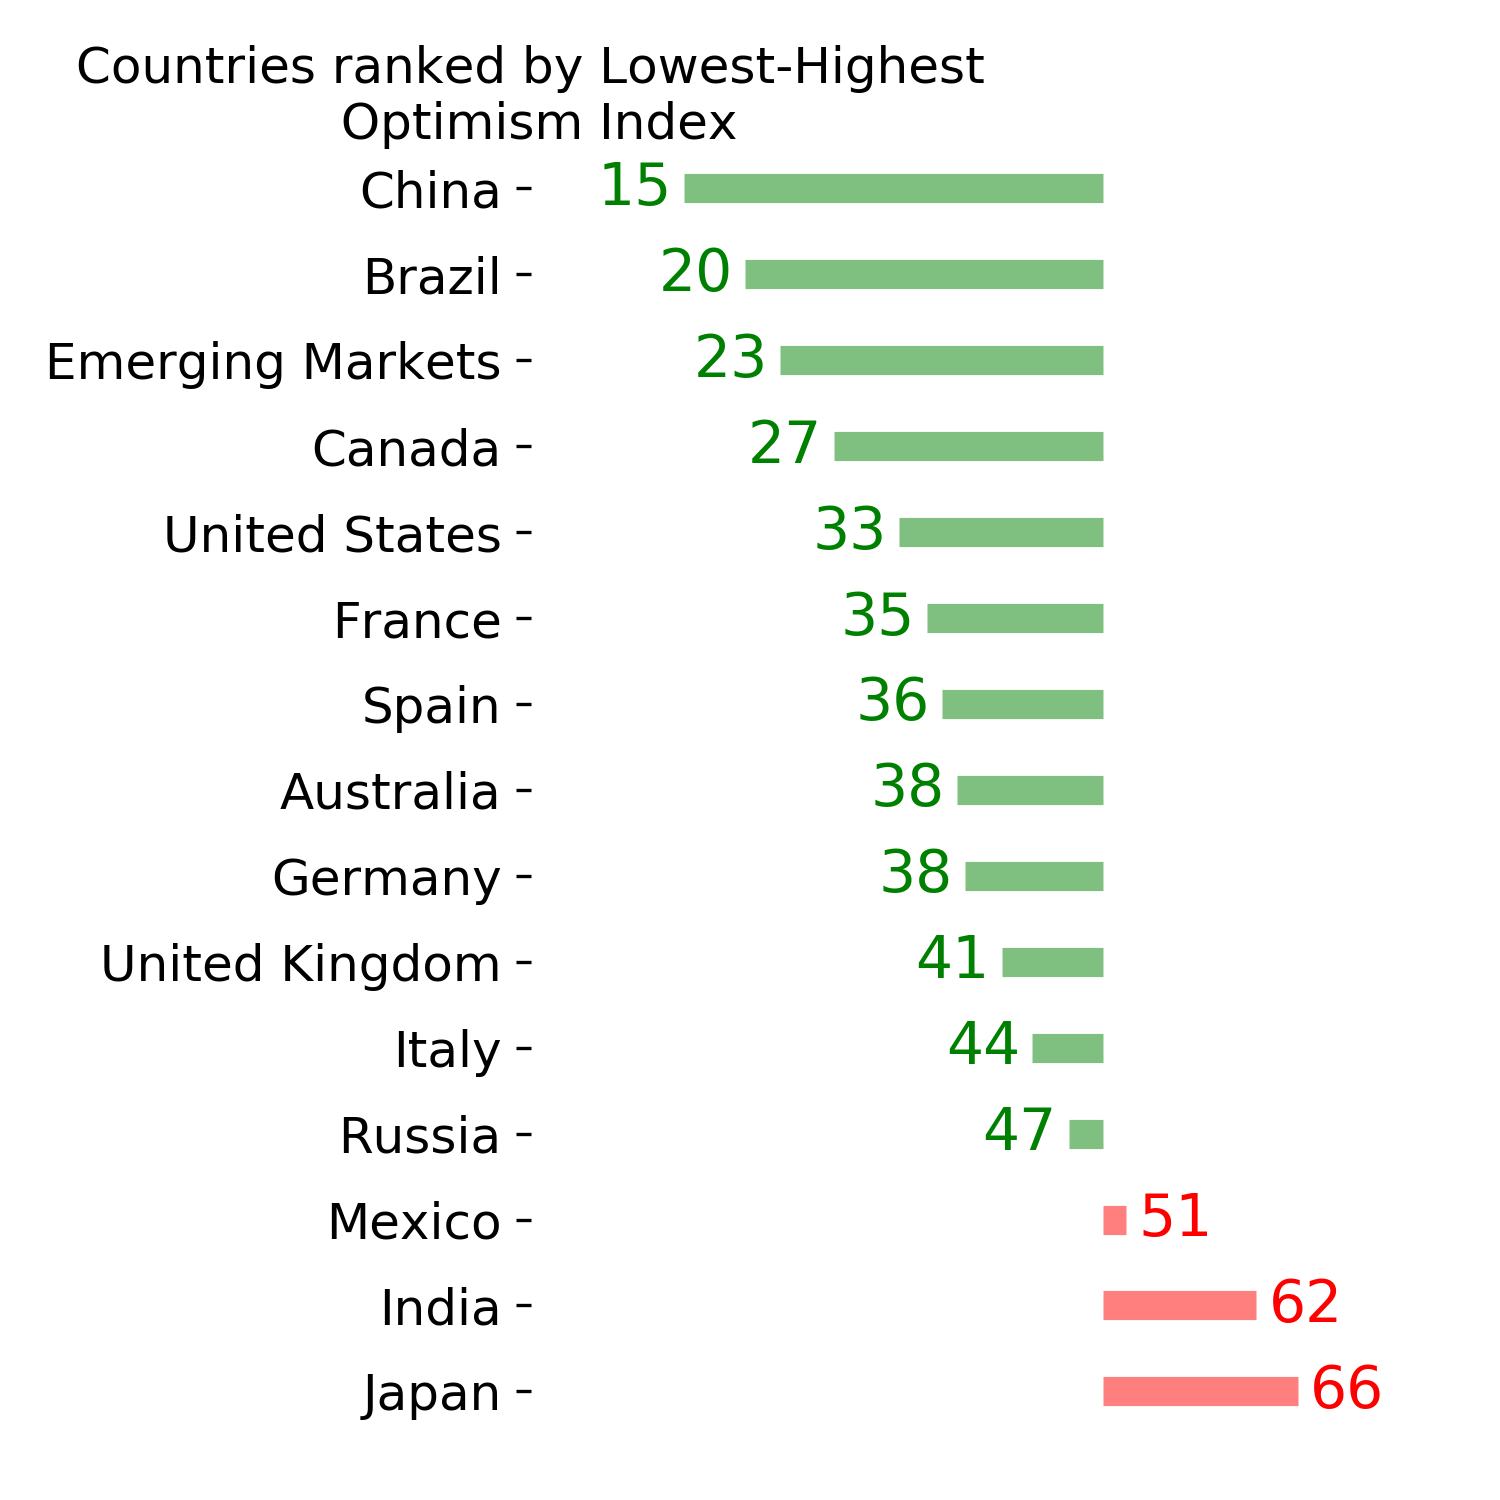
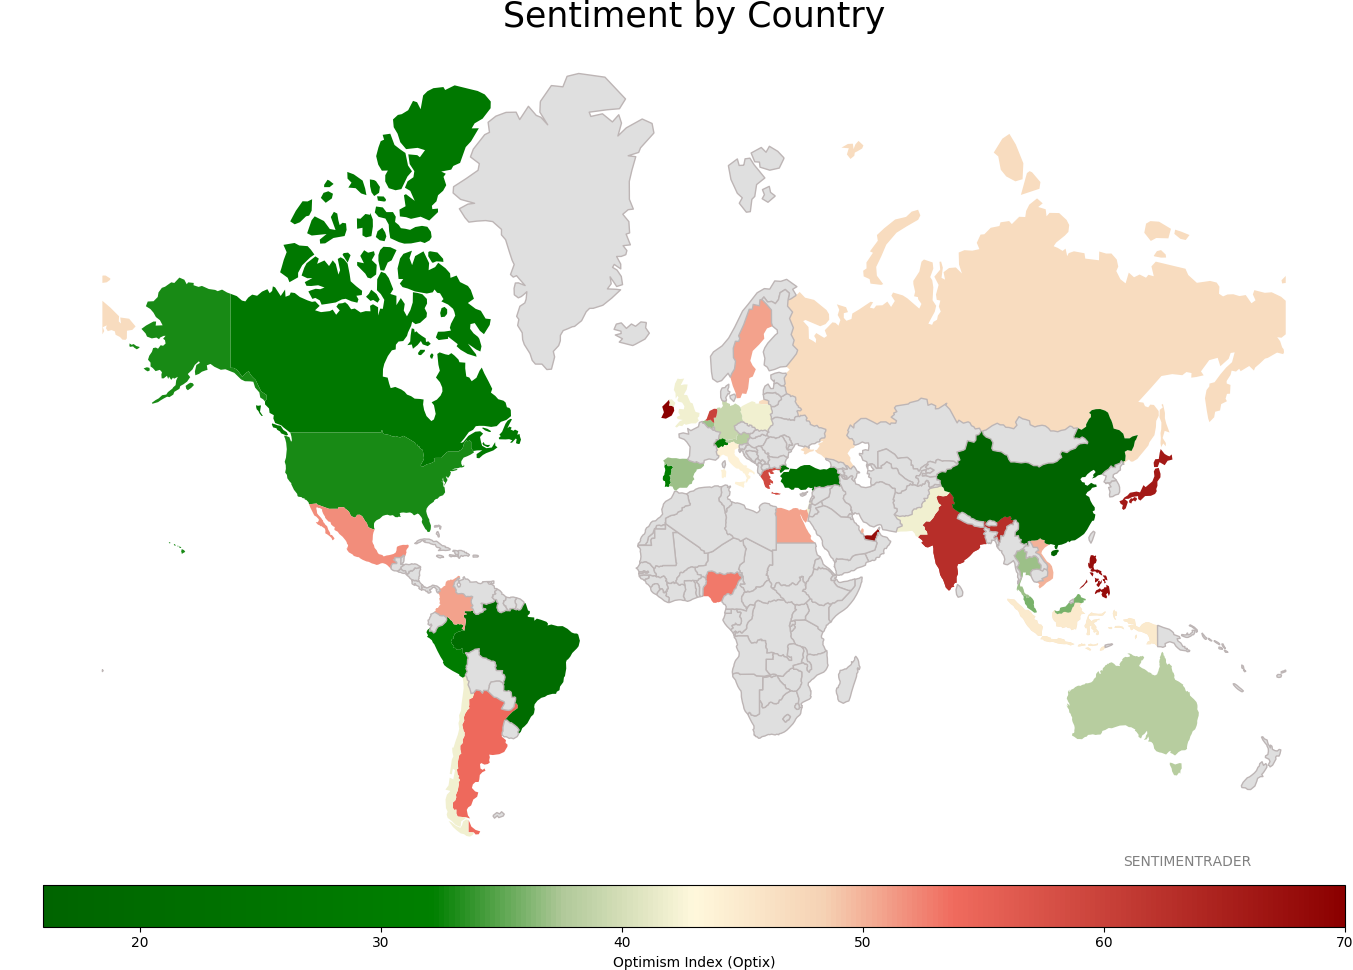
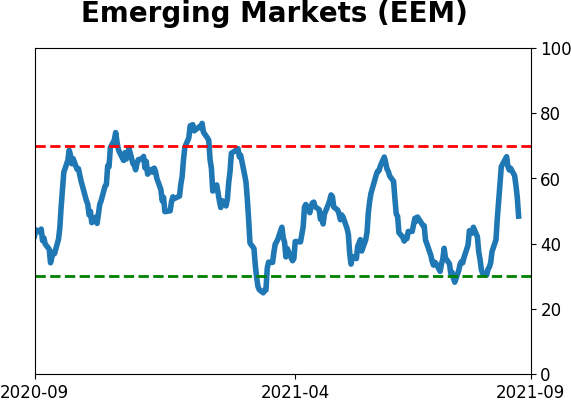
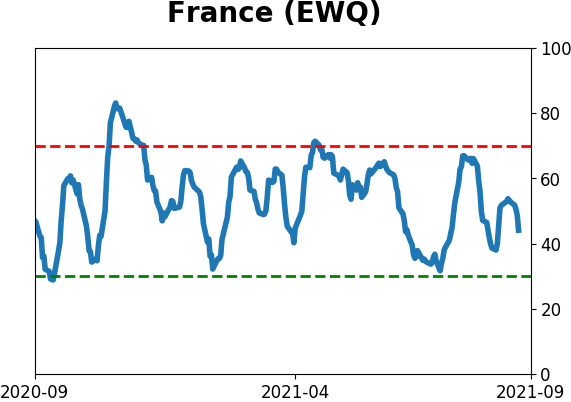
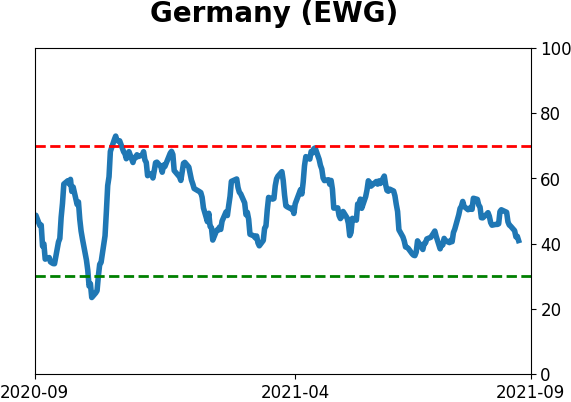
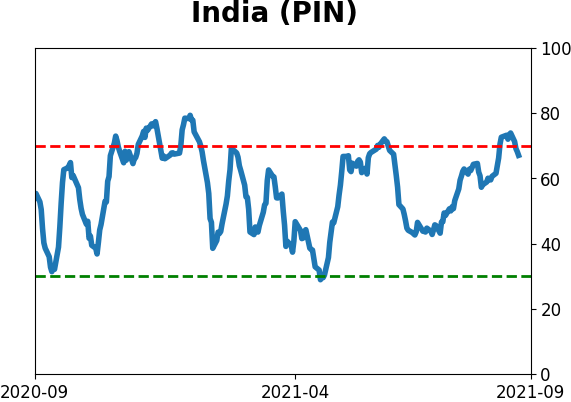
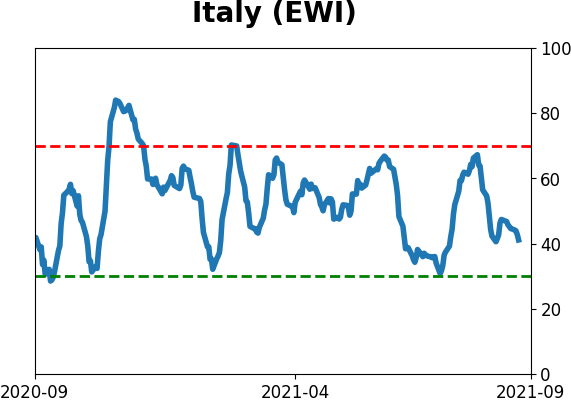
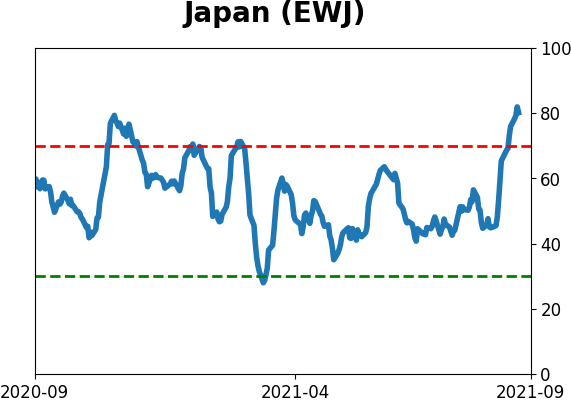
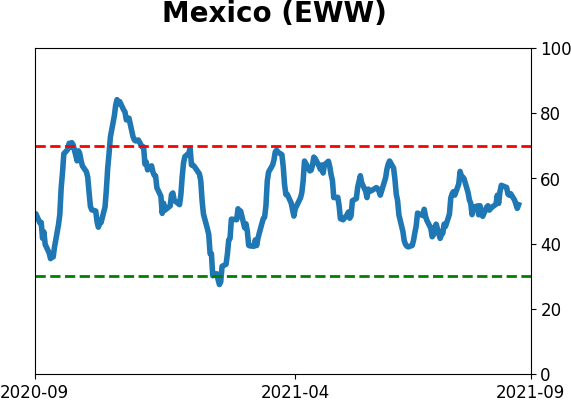
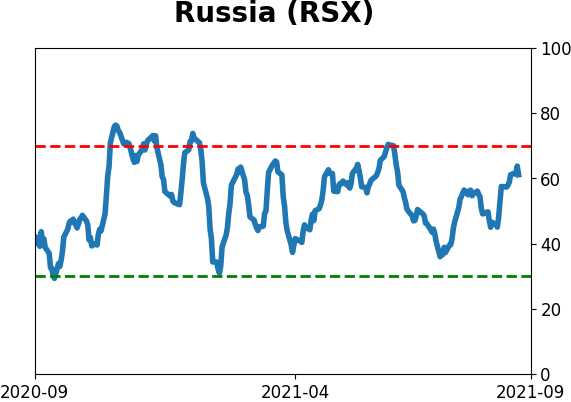
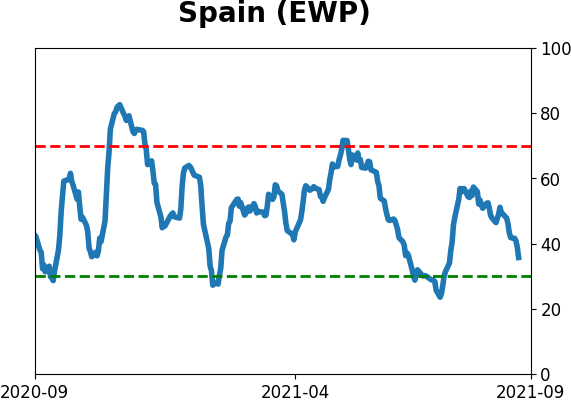
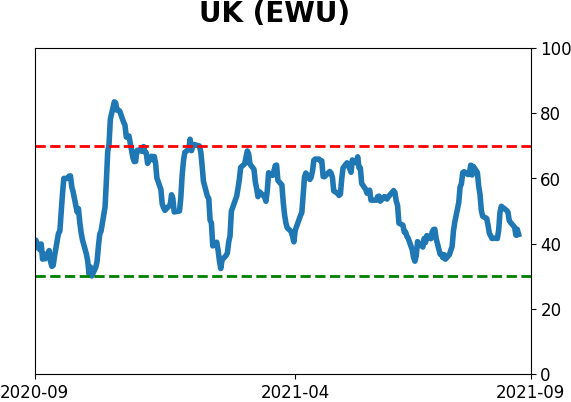
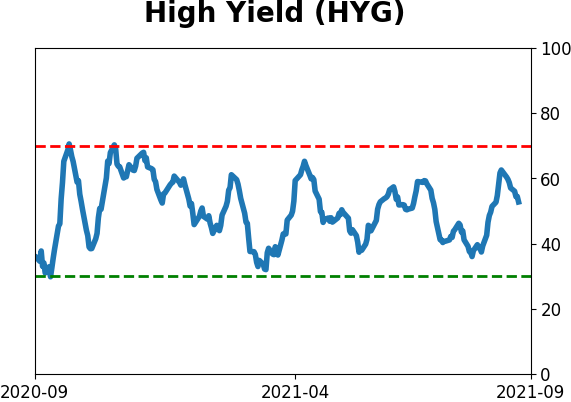
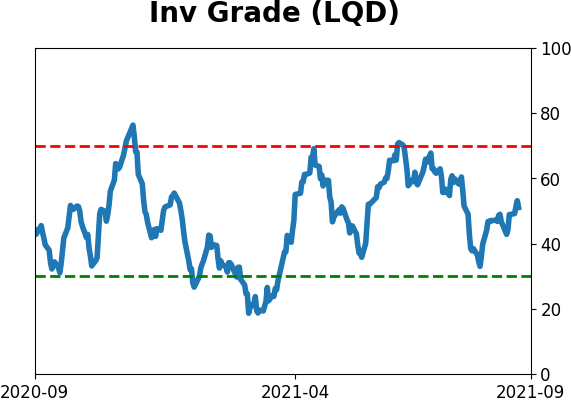
Sentiment Around The World
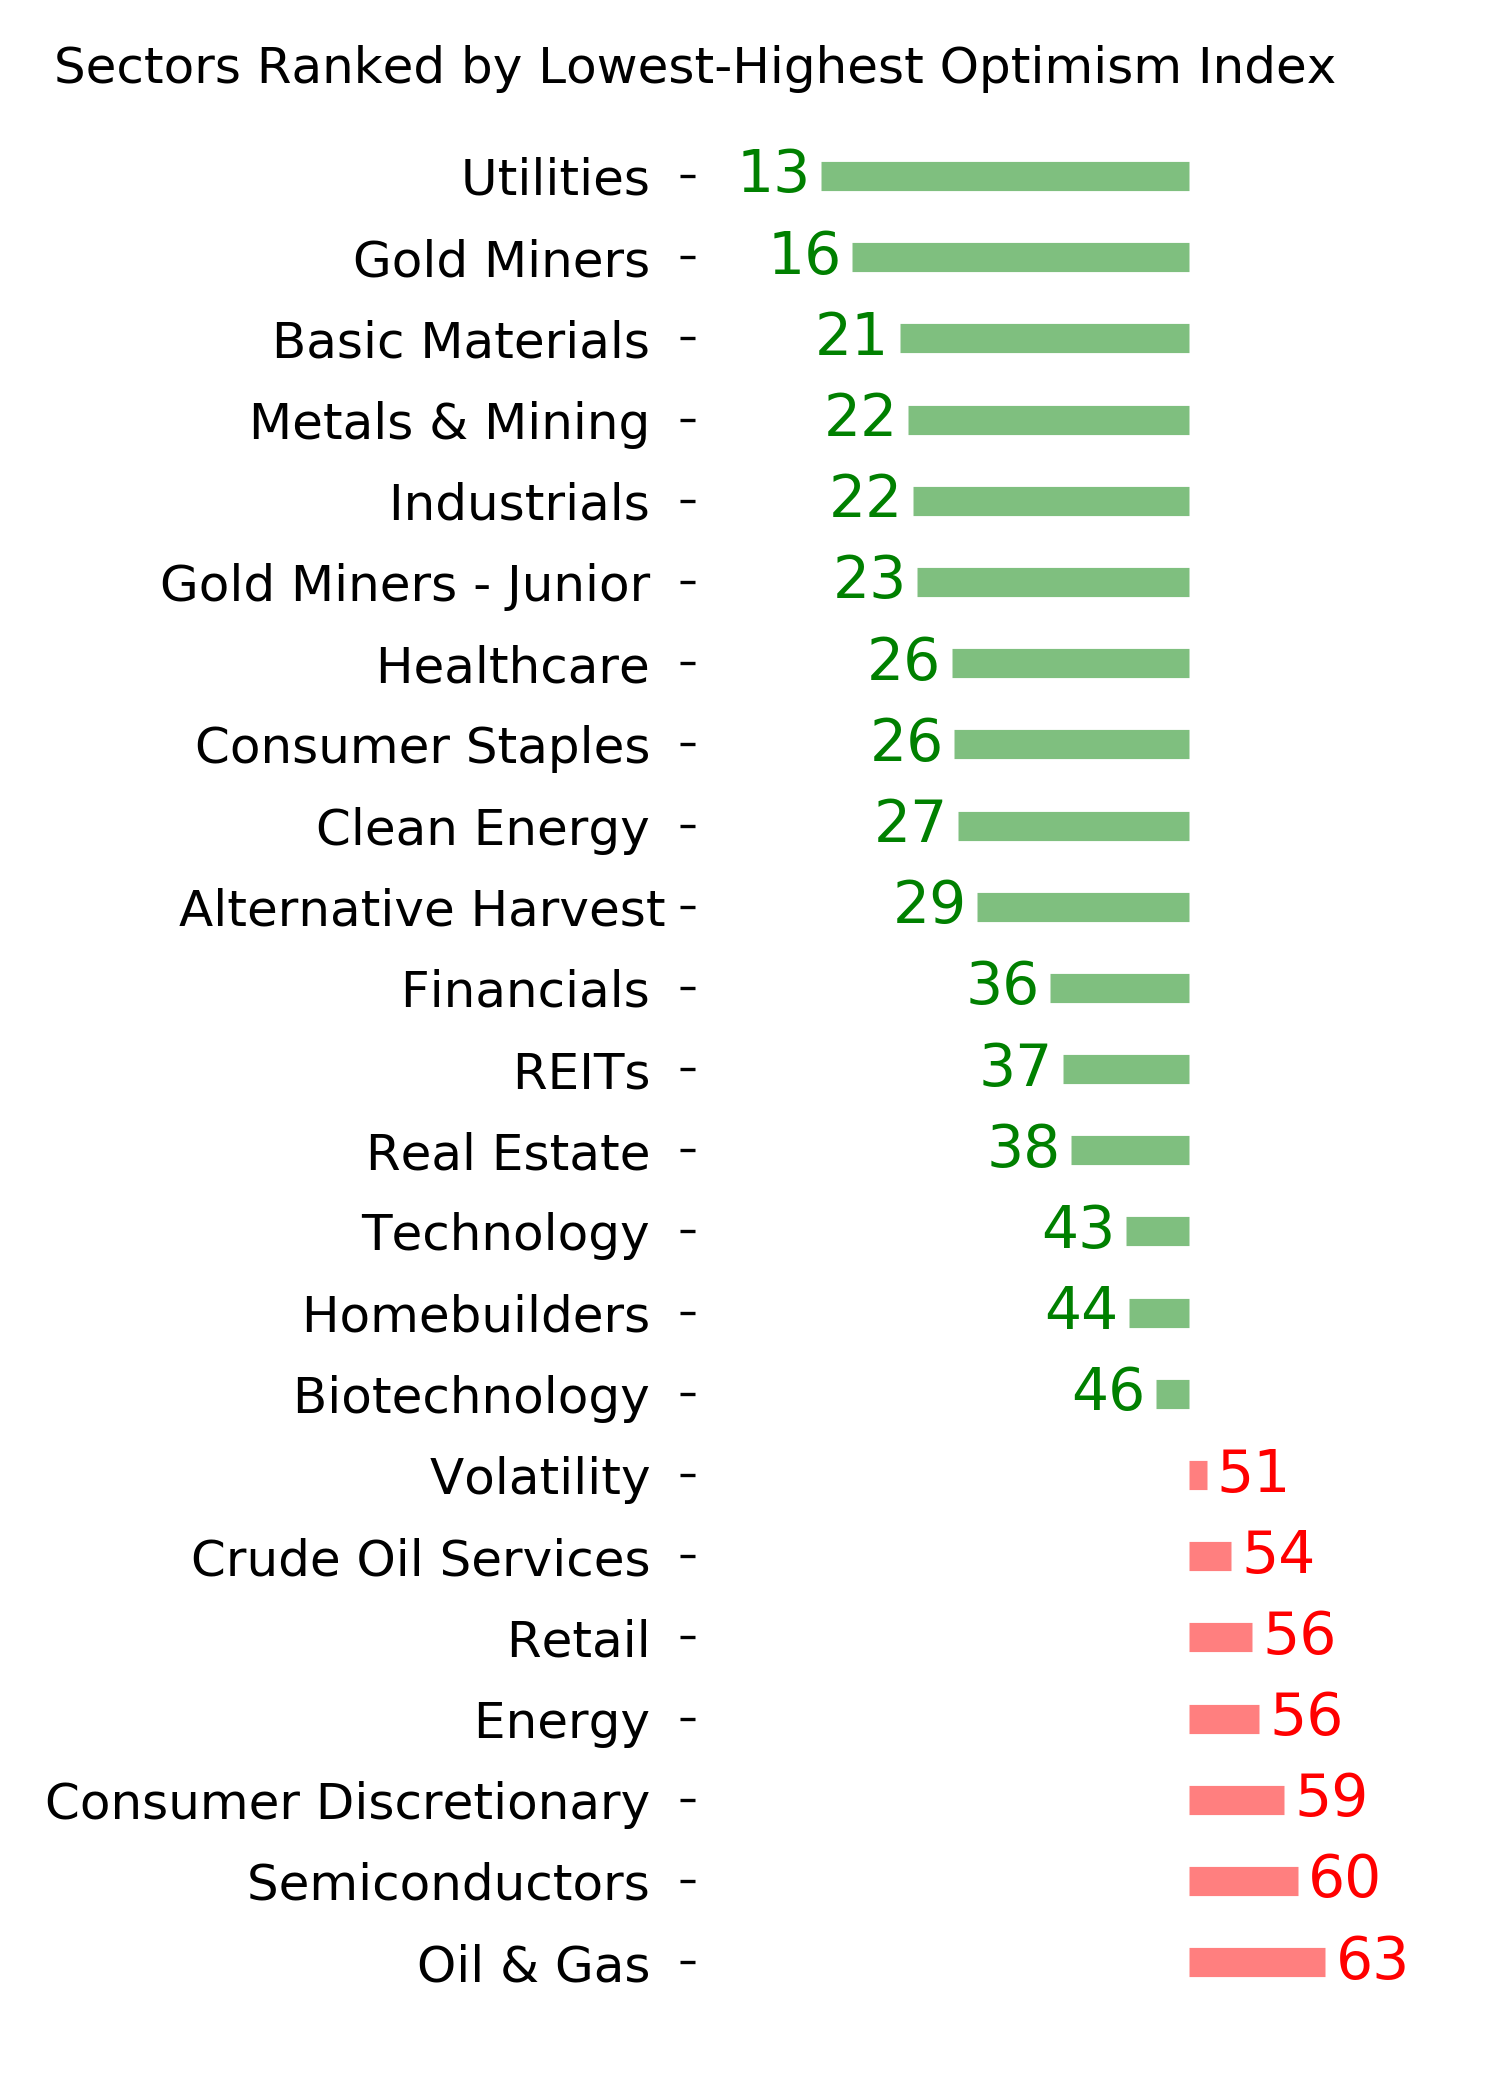
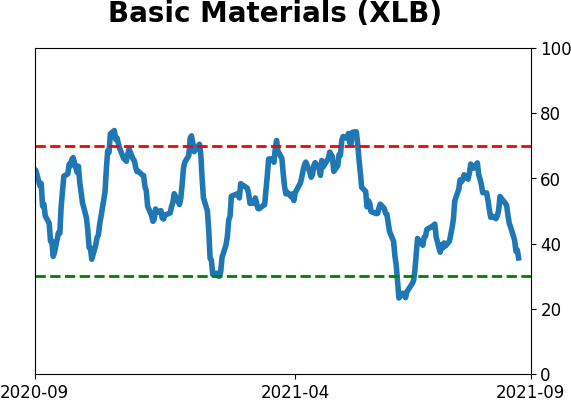
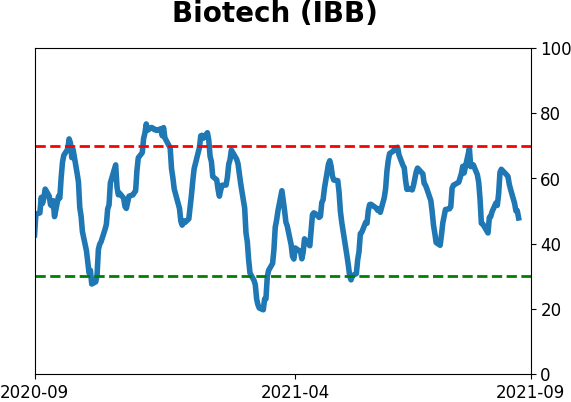
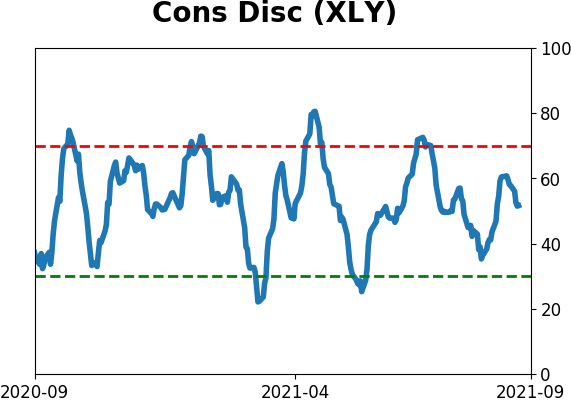
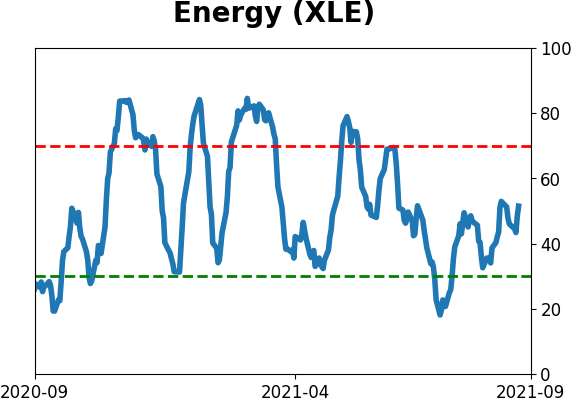
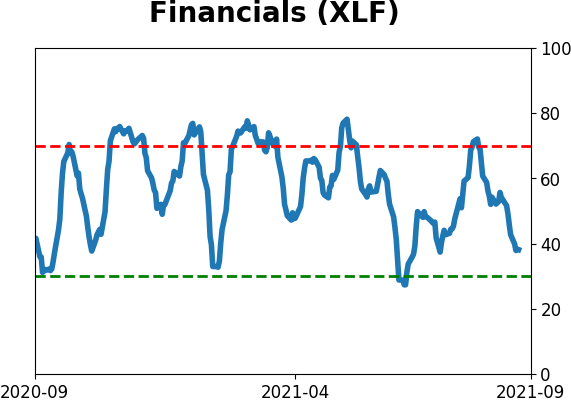
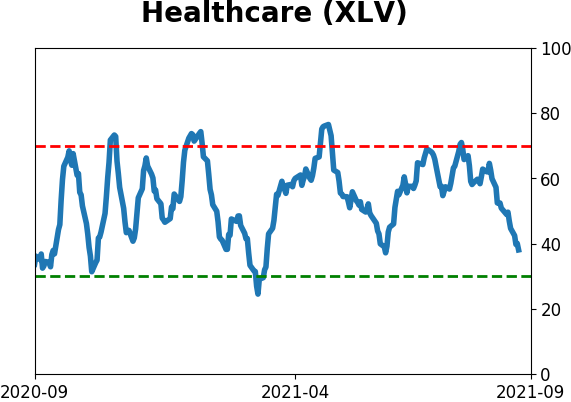
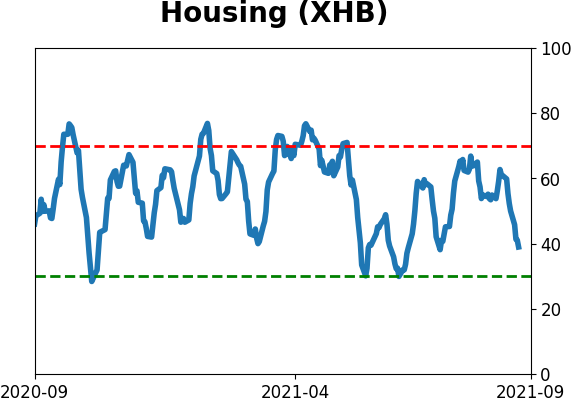
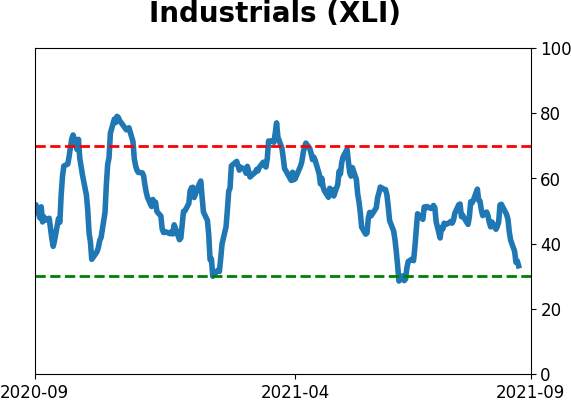
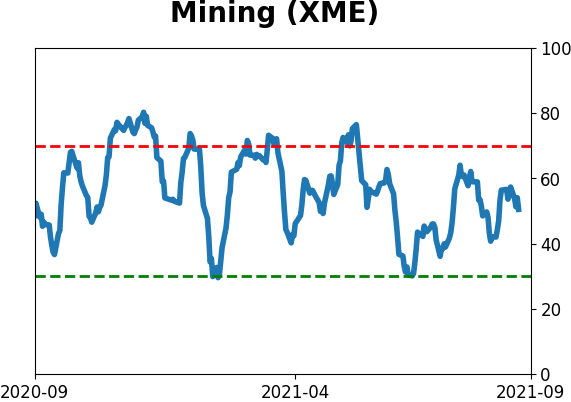
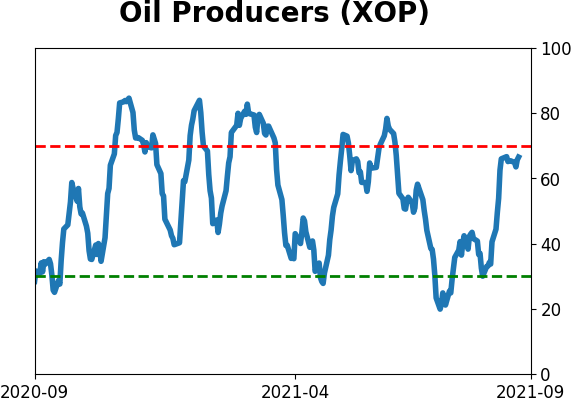
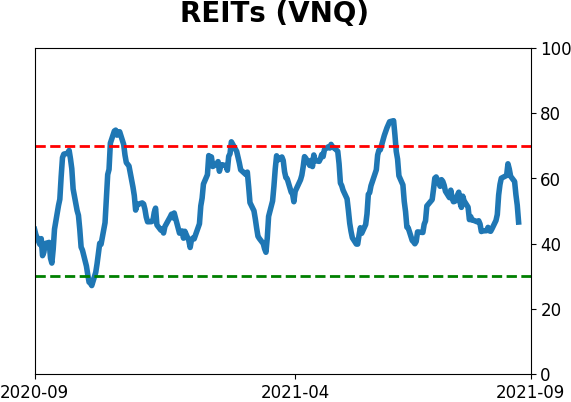
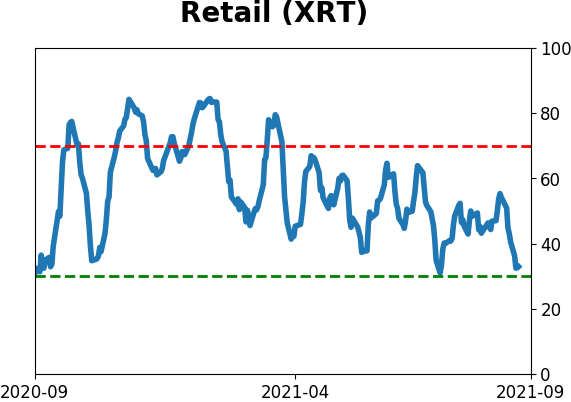
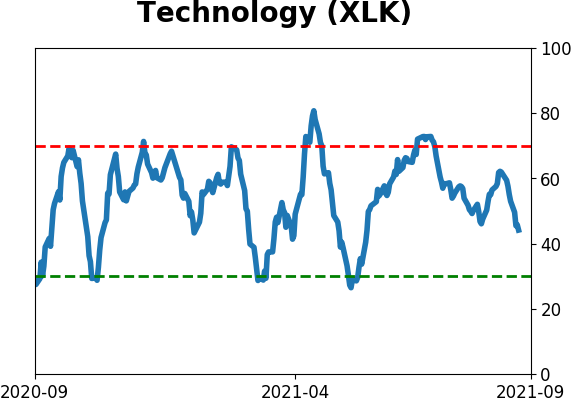
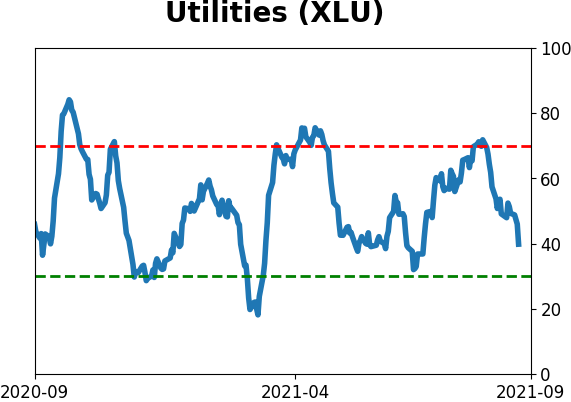
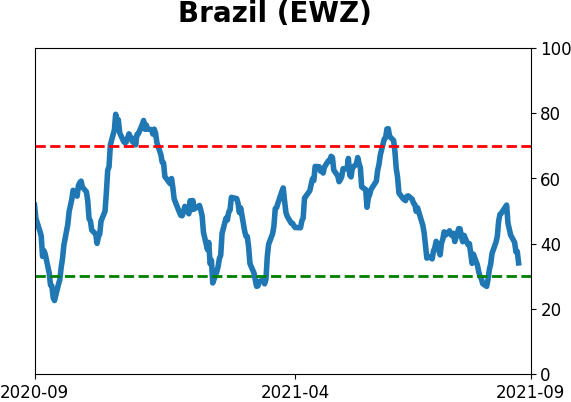
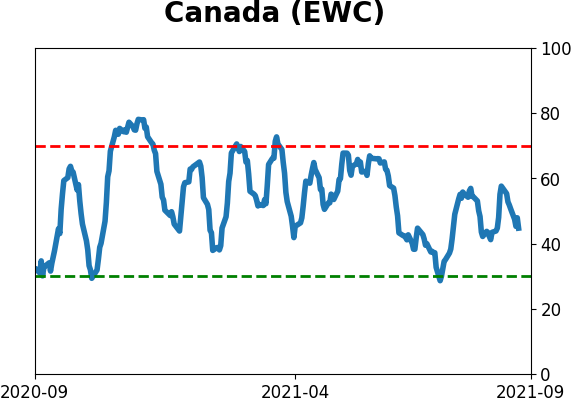
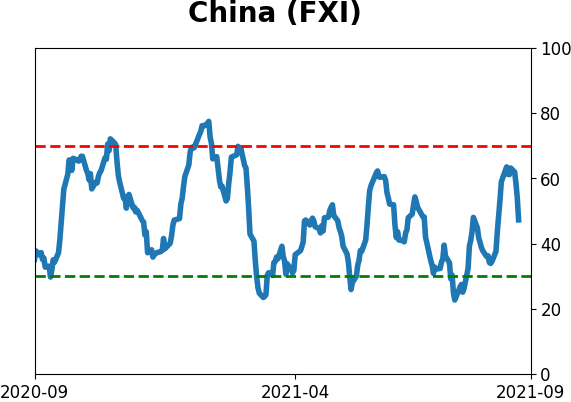
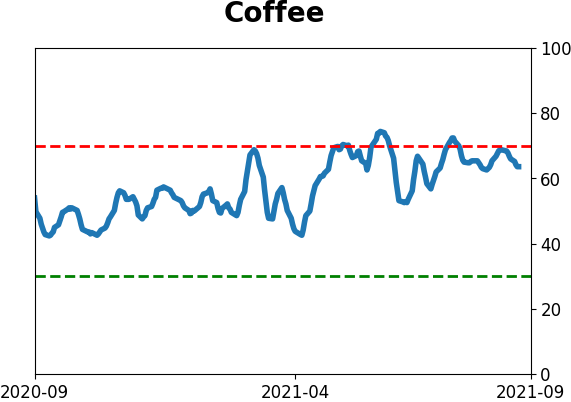
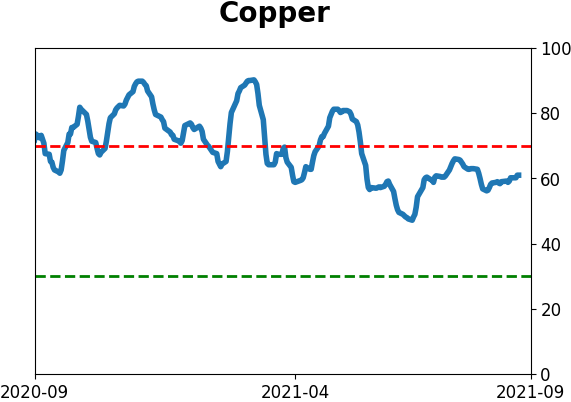
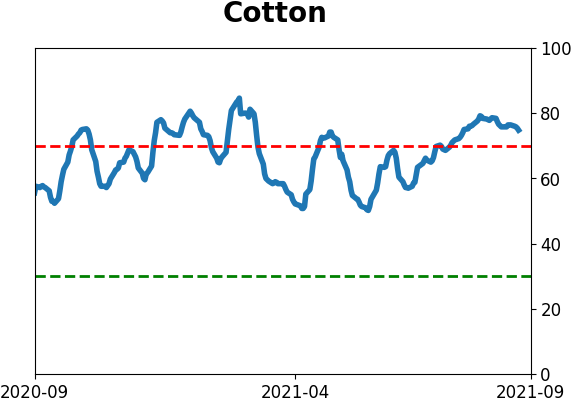
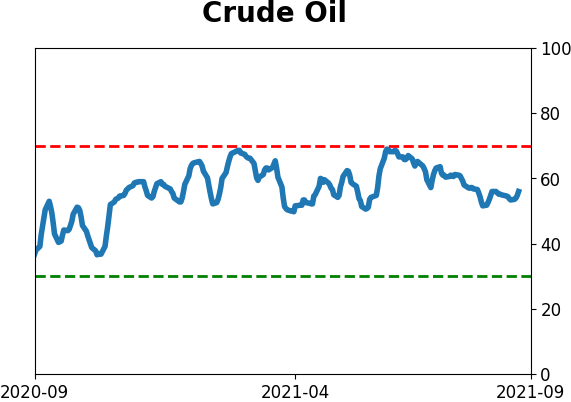
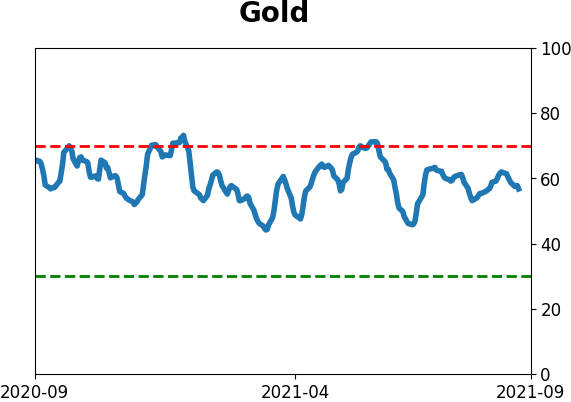
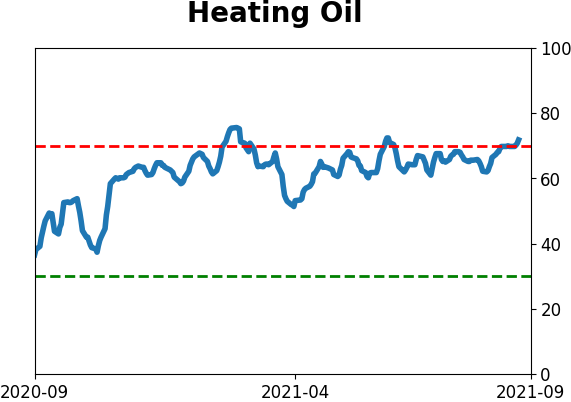
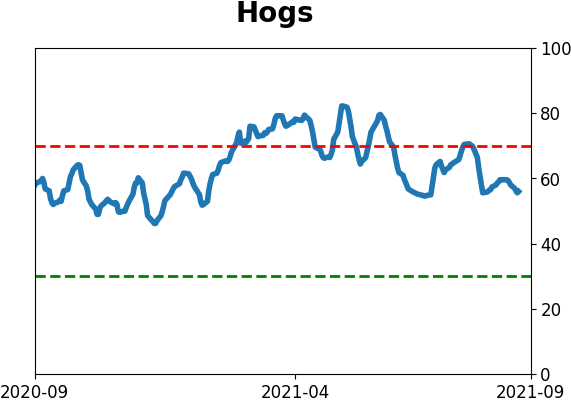
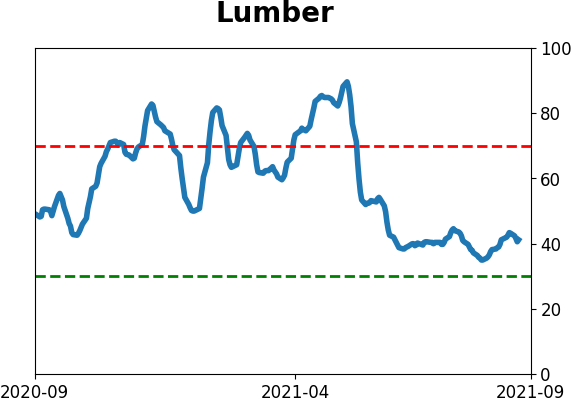
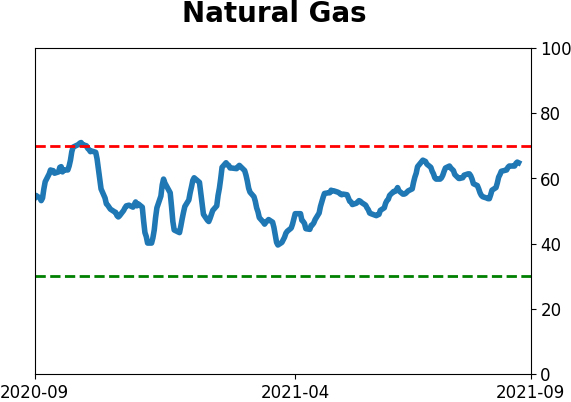
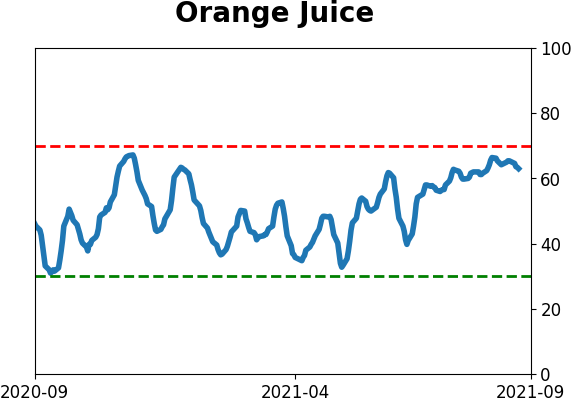
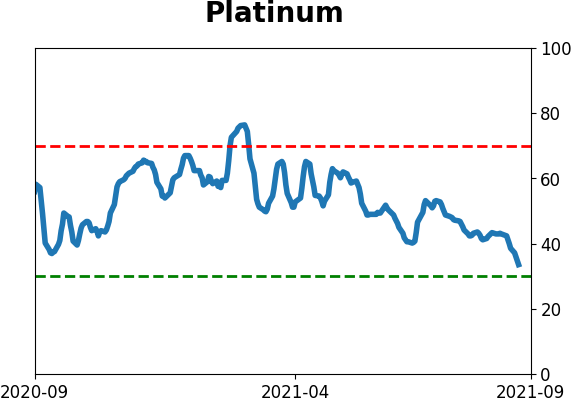
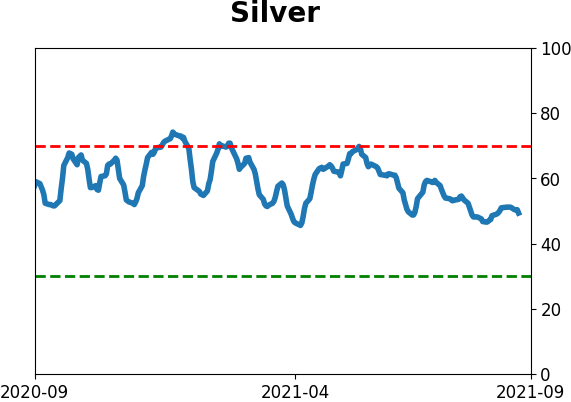
Optimism Index Thumbnails
|
Sector ETF's - 10-Day Moving Average
|
|
|
Country ETF's - 10-Day Moving Average
|
|
|
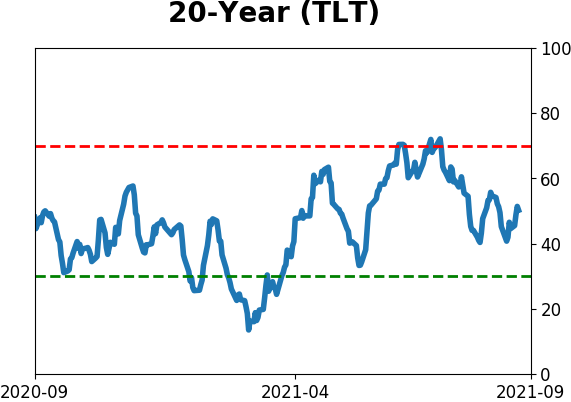
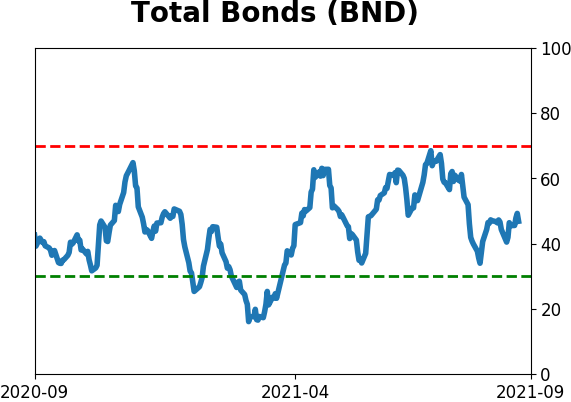
Bond ETF's - 10-Day Moving Average
|
|
|
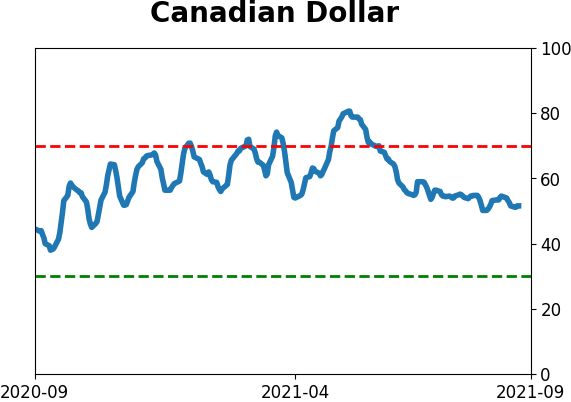
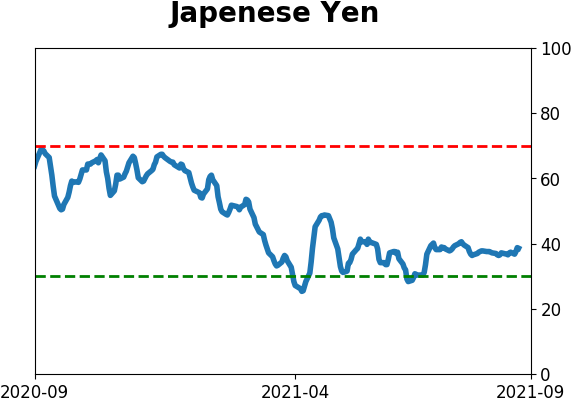
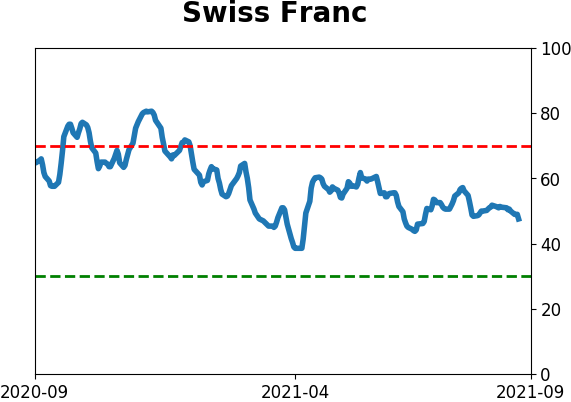
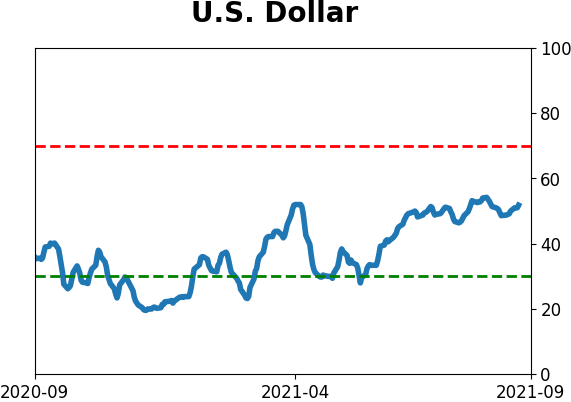
Currency ETF's - 5-Day Moving Average
|
|
|
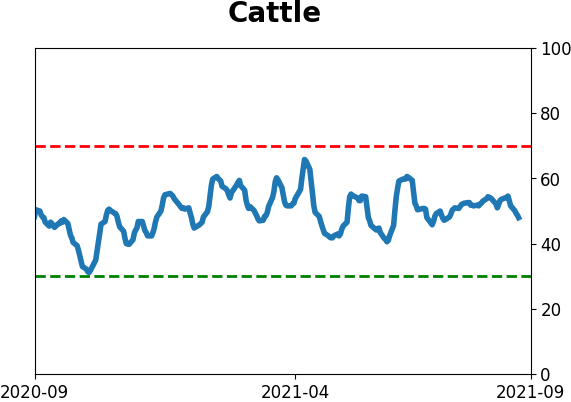
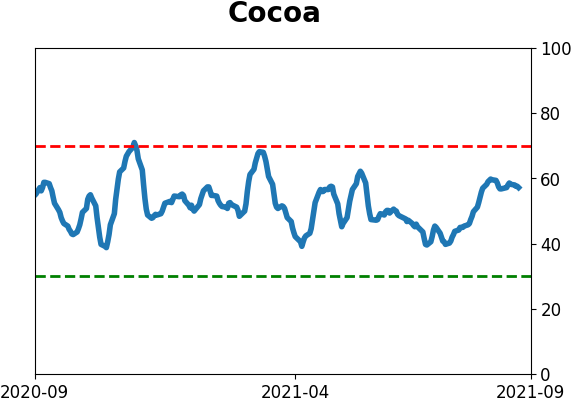
Commodity ETF's - 5-Day Moving Average
|
|