Headlines
|
|
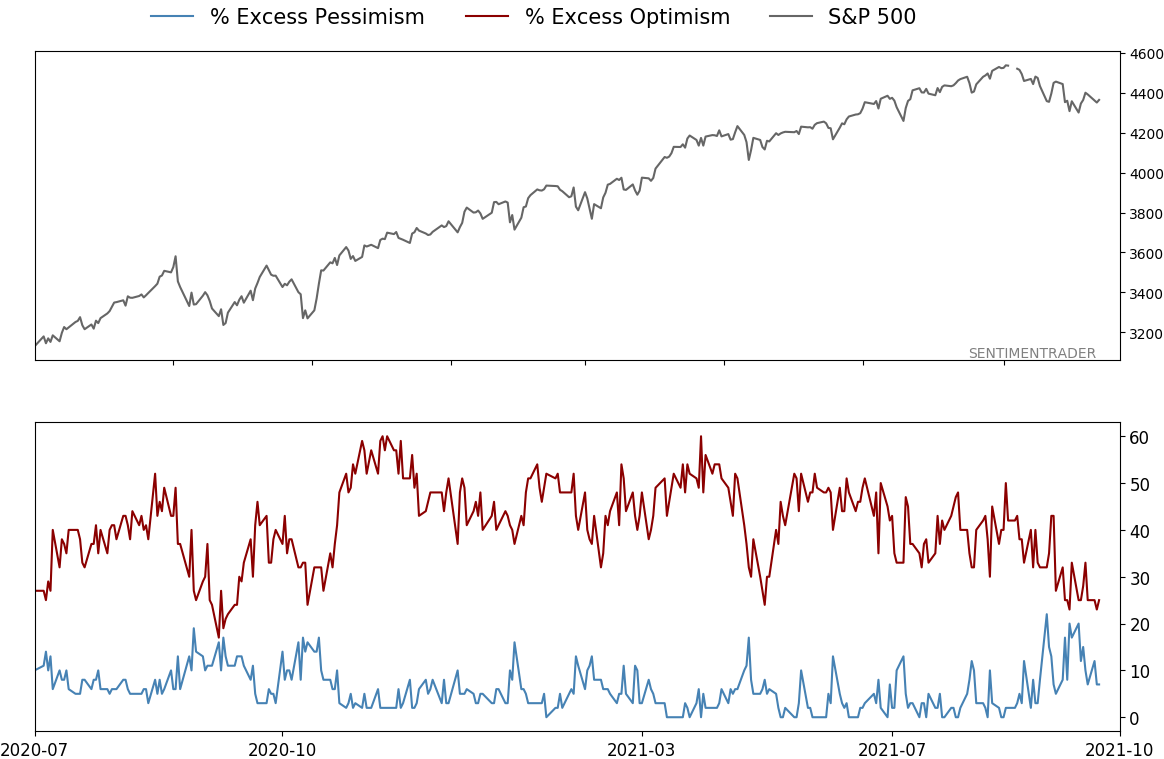
Optimism is Low in Both Stock and Bond Markets:
The Optimism Indexes for the stock and bond markets have declined to low levels. It's unusual to see them decline at the same time, at least to this degree. Other times it happened, a 60/40 balanced portfolio did well and risk parity did even better.
Bottom Line:
STOCKS: Weak buy
The speculative frenzy in February is wrung out. There are some signs of pessimism, but the most compelling data show that buyers consistently tend to return once the first signs of extreme momentum end, especially as we head into a seasonally positive time of year. See the Outlook & Allocations page for more. BONDS: Hold
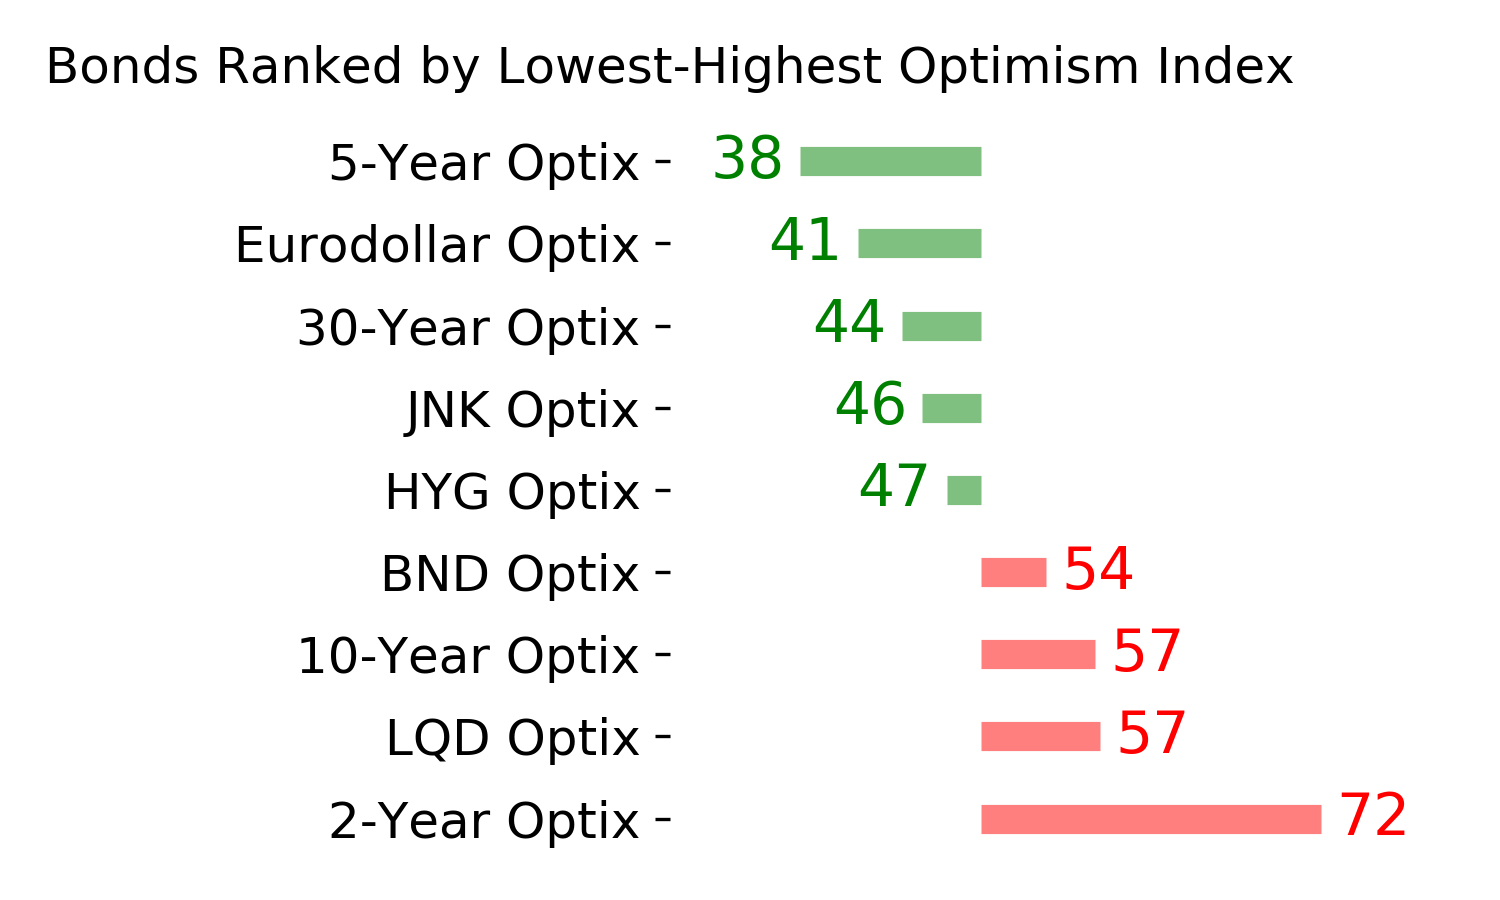
Various parts of the market got hit in March, with the lowest Bond Optimism Index we usually see during healthy environments. Bond prices have modest recovered and there is no edge among the data we follow. GOLD: Hold
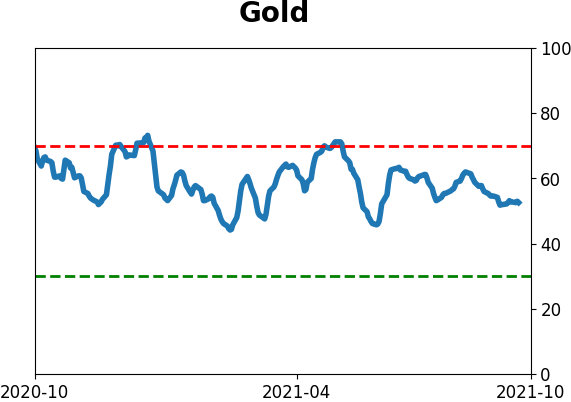
Gold and miners were rejected after trying to recover above their 200-day averages in May. Lately, some medium-term (not long-term) oversold extremes in breadth measures among miners have triggered.
|
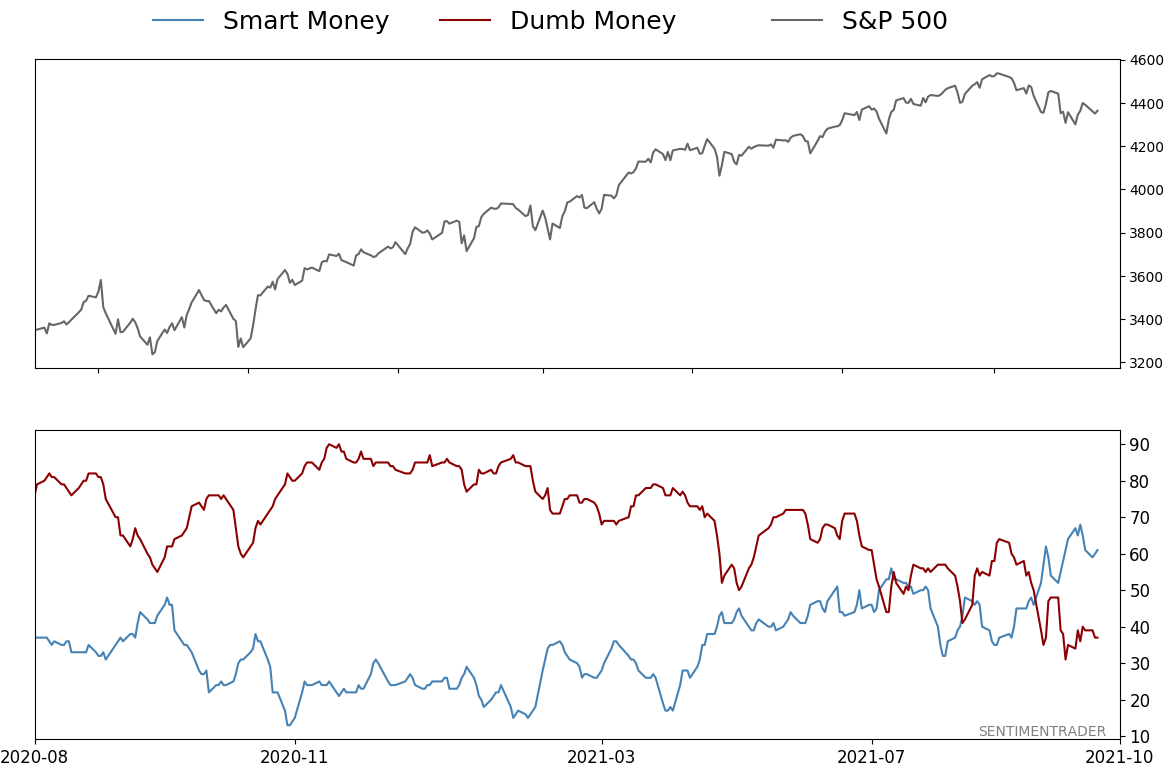
Smart / Dumb Money Confidence
|
Smart Money Confidence: 61%
Dumb Money Confidence: 37%
|
|
Risk Levels
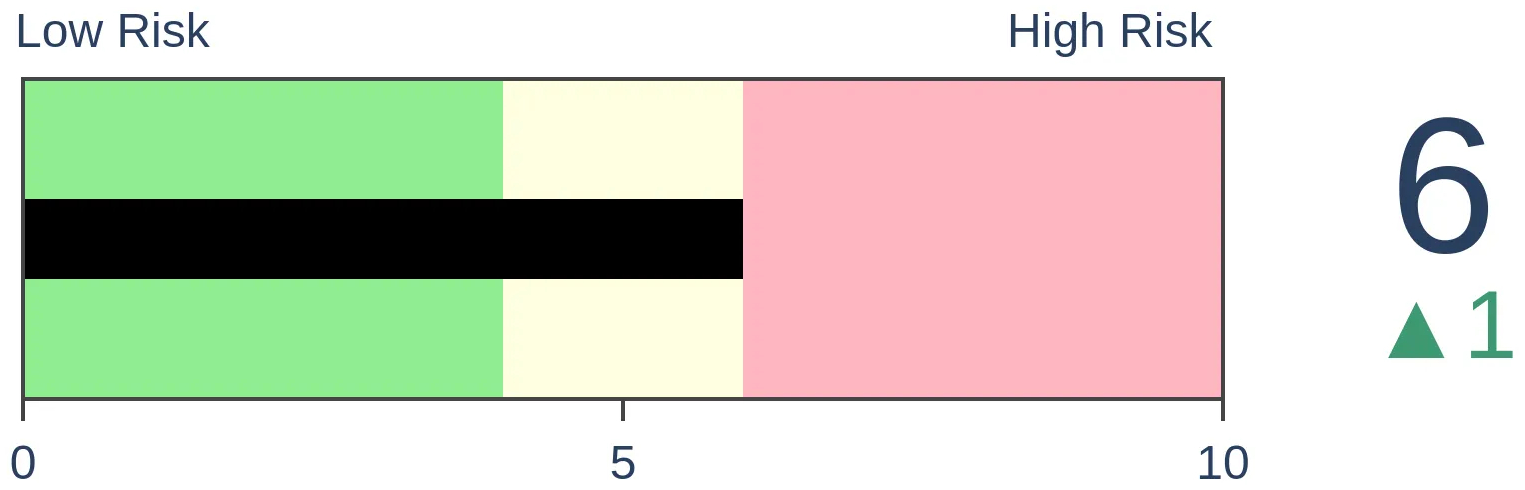
Stocks Short-Term
|
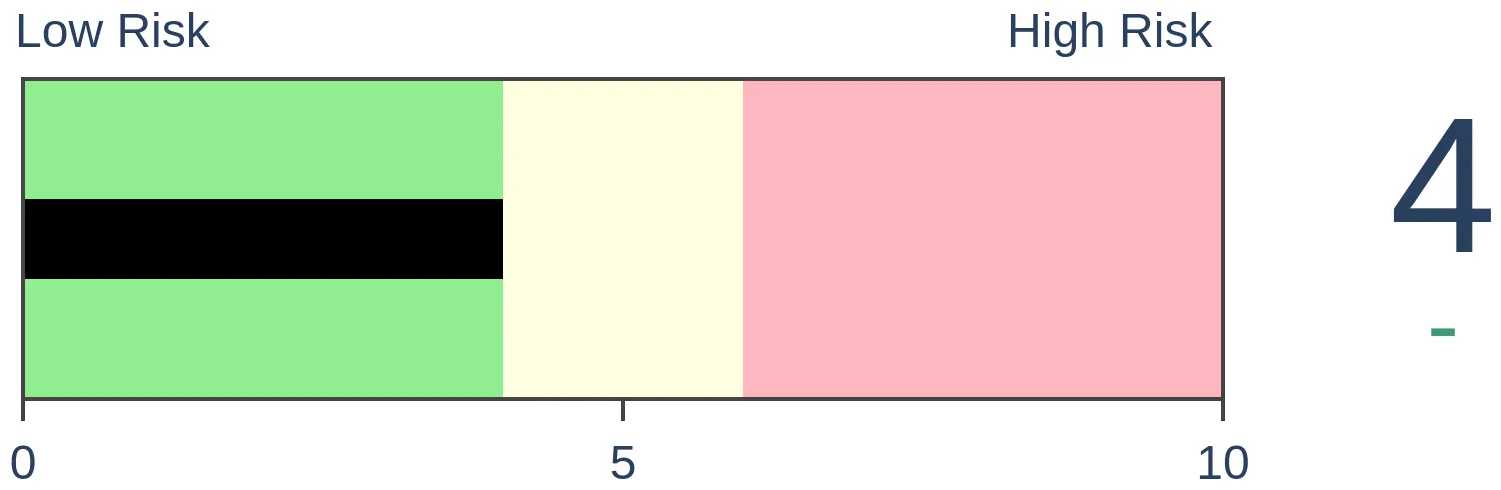
Stocks Medium-Term
|
|
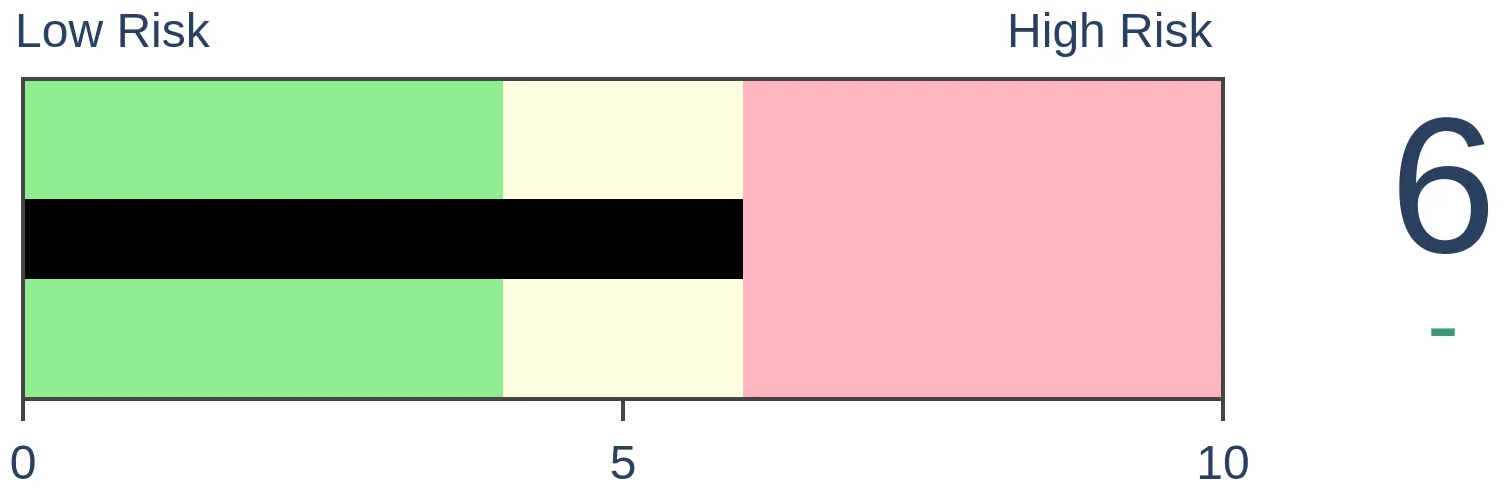
Bonds

|
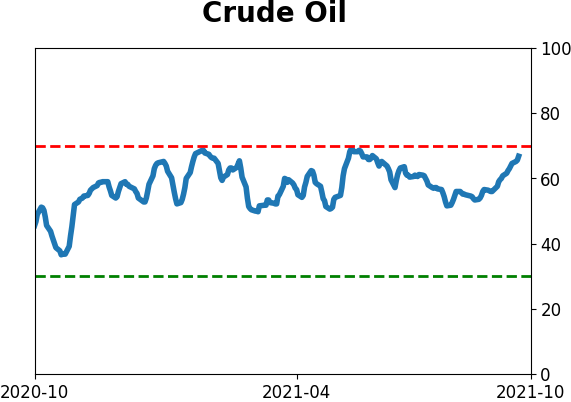
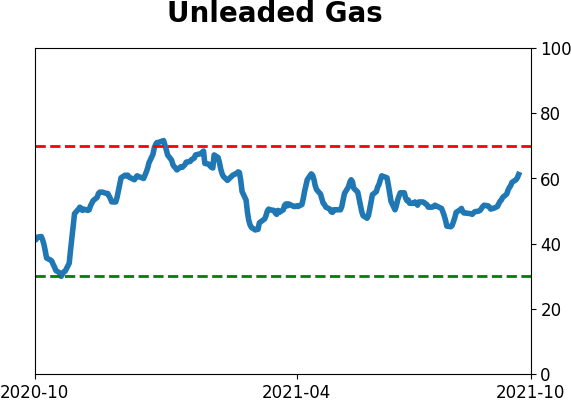
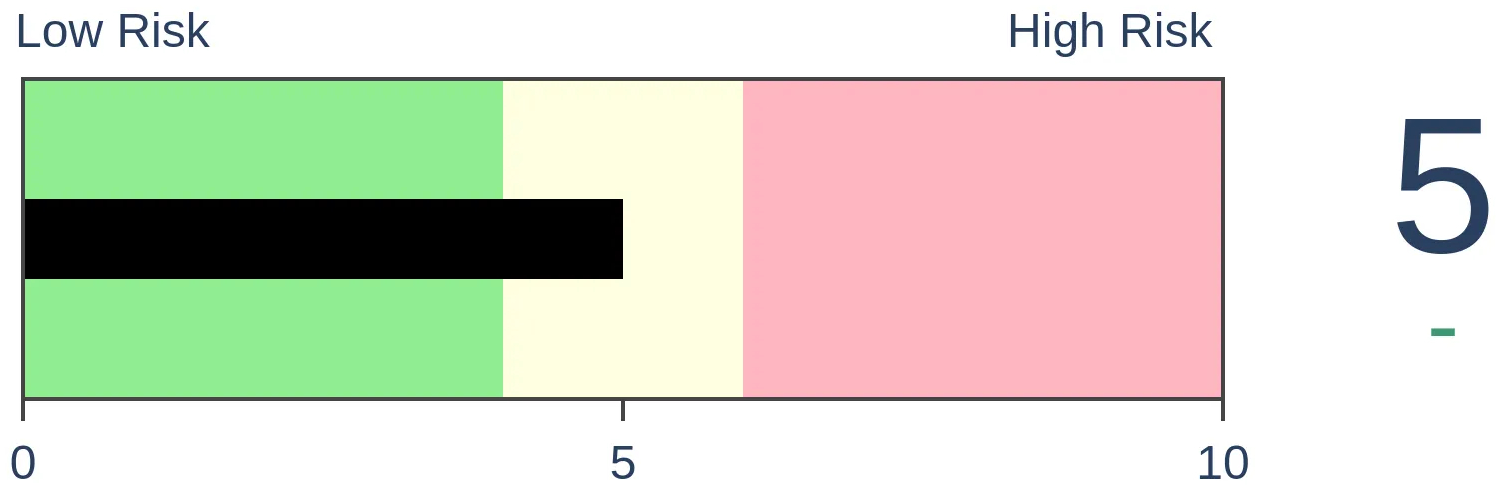
Crude Oil
|
|
Gold
|
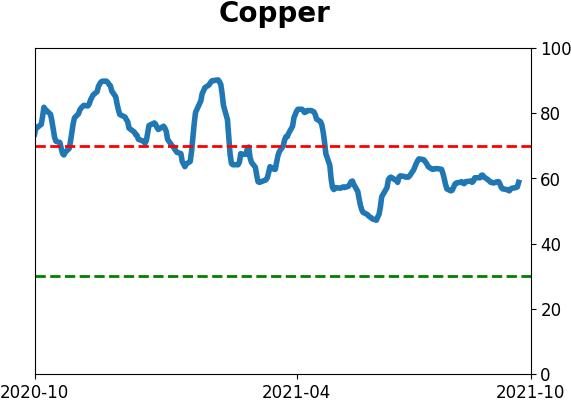
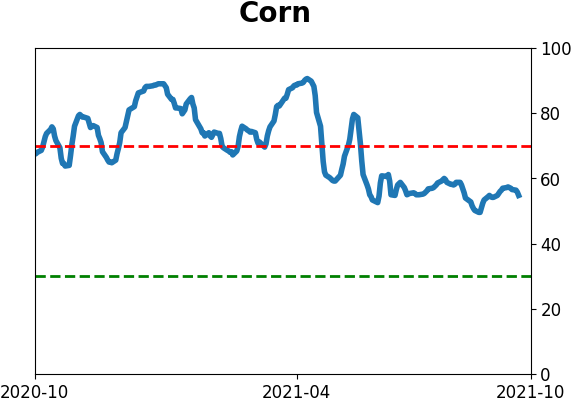
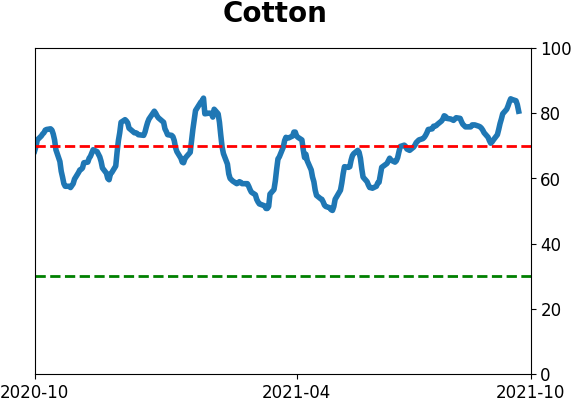
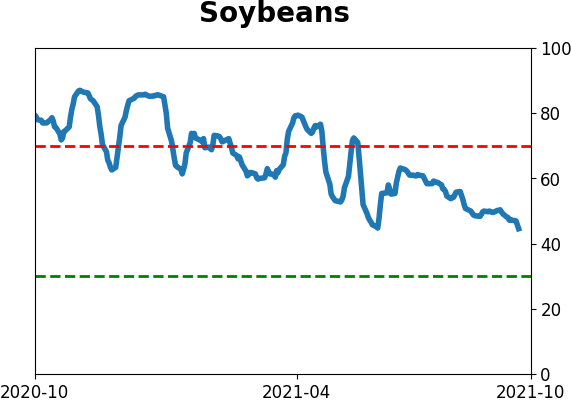
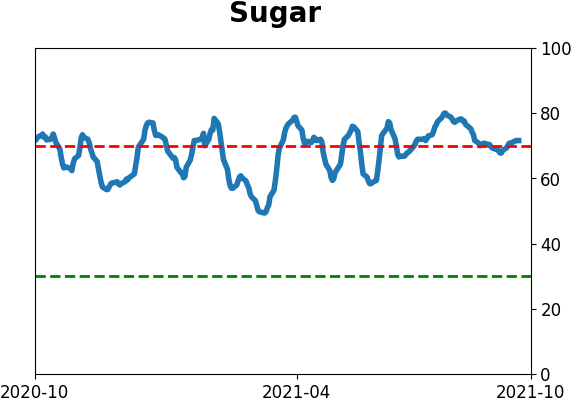
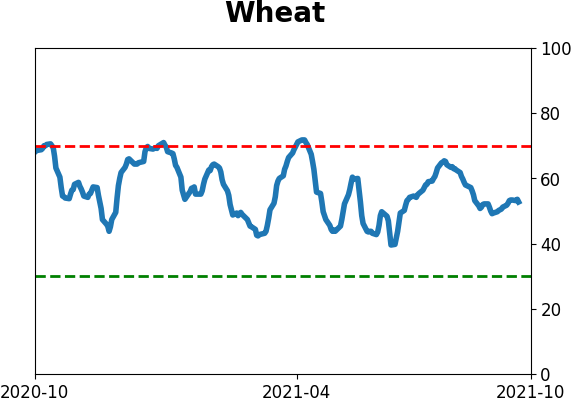
Agriculture

|
|
Research
By Jason Goepfert
BOTTOM LINE
The Optimism Indexes for the stock and bond markets have declined to low levels. It's unusual to see them decline at the same time, at least to this degree. Other times it happened, a 60/40 balanced portfolio did well and risk parity did even better.
FORECAST / TIMEFRAME
None
|
Over the past couple of weeks, volatility has spiked, and optimism has plunged. That's true for stocks, and it's true for bonds. It puts investors in an unusual and uncomfortable place.
The two asset classes are supposed to (mostly) offset each other's worst qualities while not being too much of a drag during the good times. That's the whole concept behind the 60/40 portfolio balancing behemoth.
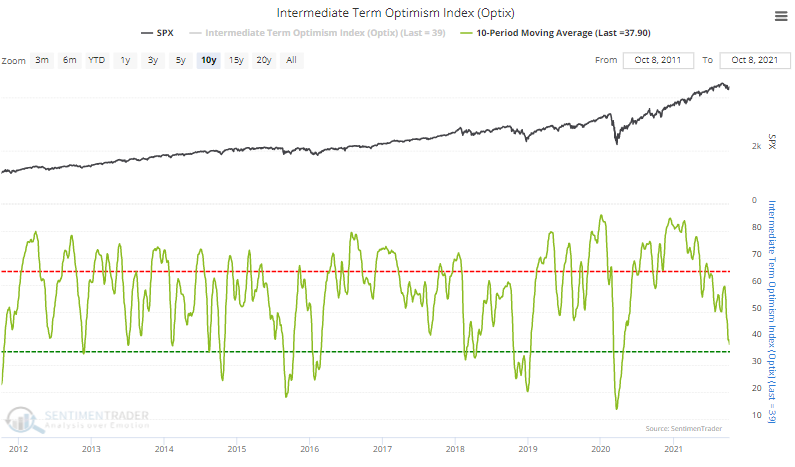
In recent days, sentiment has soured for stocks, and the 10-day average of the Medium-term Optimism Index is nearing a pessimistic extreme.
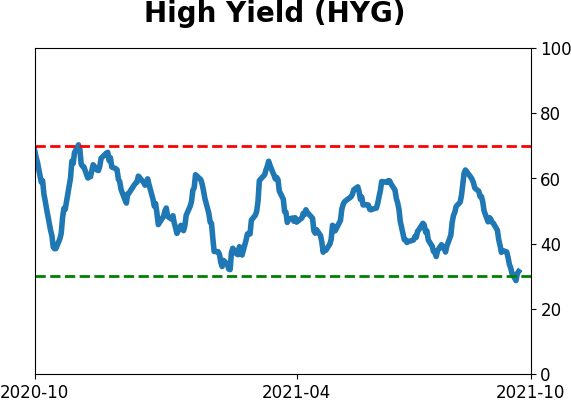
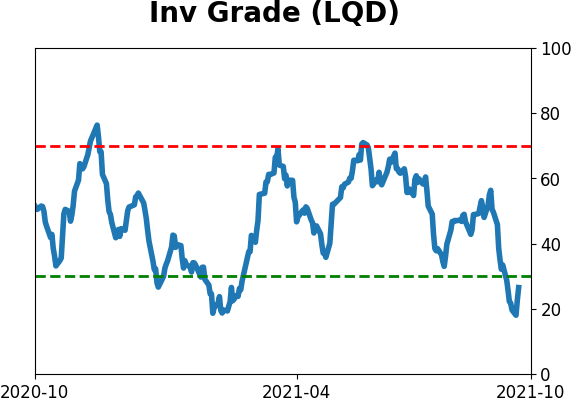
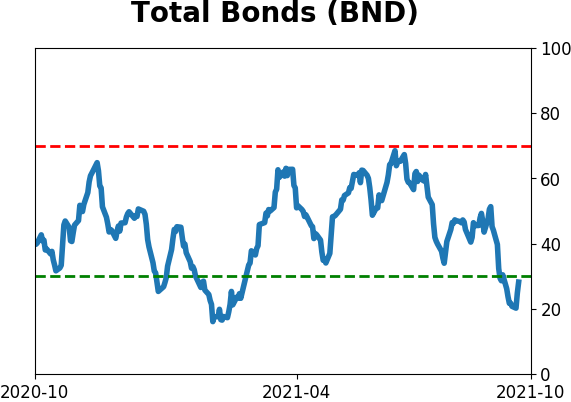
Curiously, investors have not sought the safety of the bond market. The 10-day average Bond Optimism Index has likewise dropped.
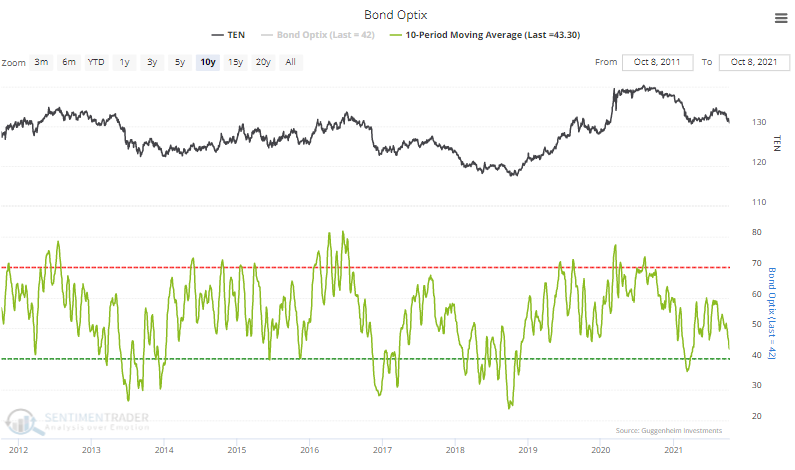
The 10-day average of both stock and bond Optimism Indexes are in the bottom 6% of all readings over the past decade.
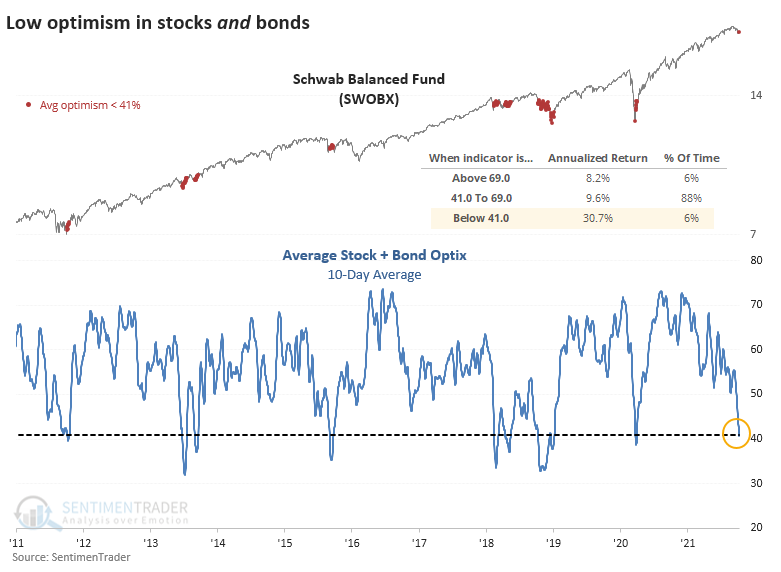
The average combined stock and bond optimism is now approaching 40% for one of the few times in the past 20 years. Typically, the markets balance each other, with investors moving to bonds when they're fearful of stocks and vice-versa. This is only the 2nd time in the past two years when optimism on both markets was so low - the pandemic panic being the other one.
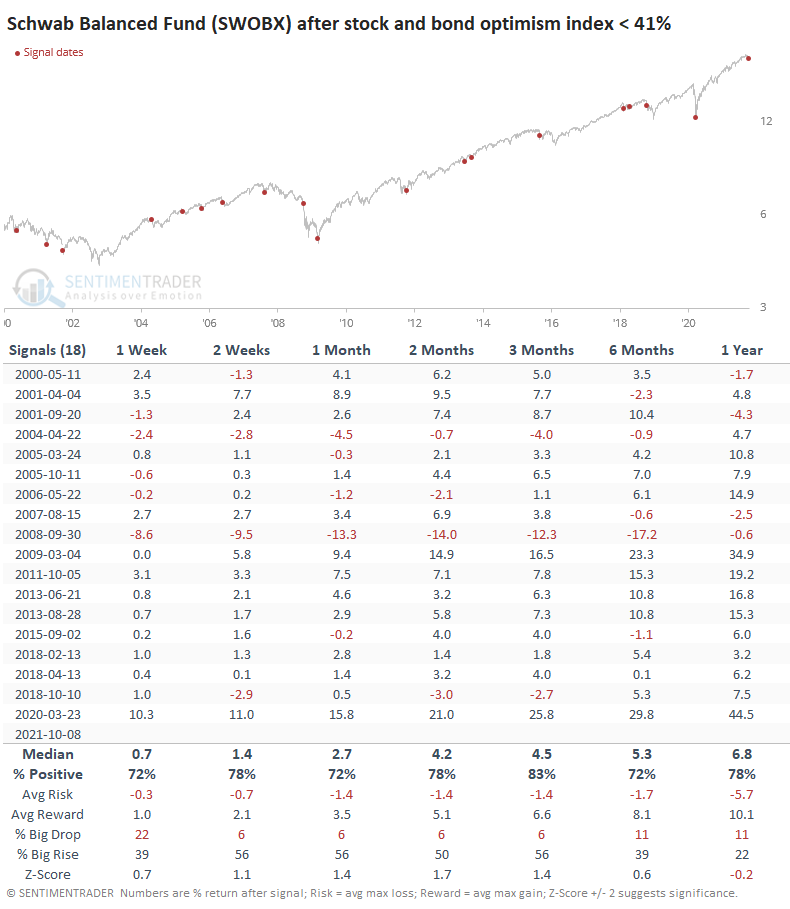
Over the past decade, the annualized return in a balanced equity and bond fund when combined optimism was this low was a hefty +30.7%.
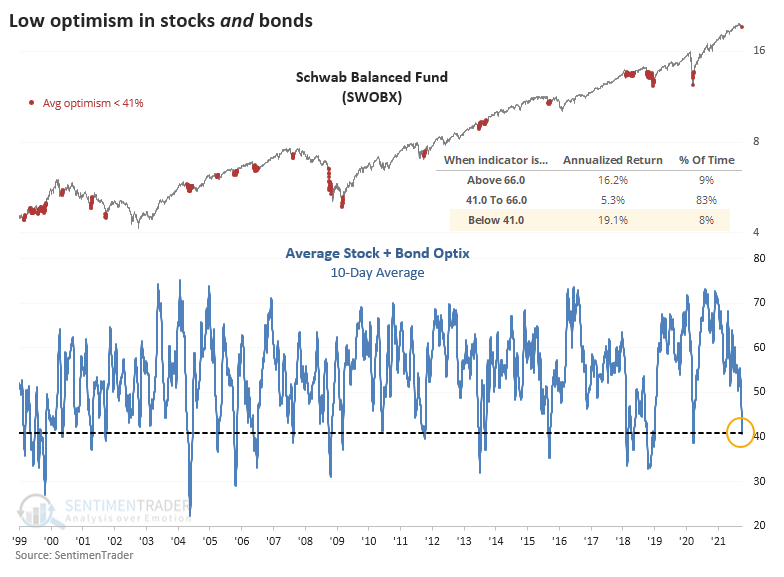
Zooming out to 1999, returns dipped, thanks to being too early during the financial crisis, but were still impressive overall.
There is a lot of talk about whether the bond market will serve as a buffer against stock volatility in the years ahead. Both markets are objectively overvalued, and if they decline together, then it's going to hurt a whole generation of investors raised on the gospel of a 60/40 balanced portfolio.
Schwab's good, low-fee fund that generally adheres to the 60/40 stock/bond allocation shows that such fears were mostly unfounded. Out of the 18 prior signals, only one preceded a large and sustained decline (global financial crisis). Only 3 signals saw a loss of more than -5% at any point over the next three months, while 10 of them saw a maximum gain of more than +5%.
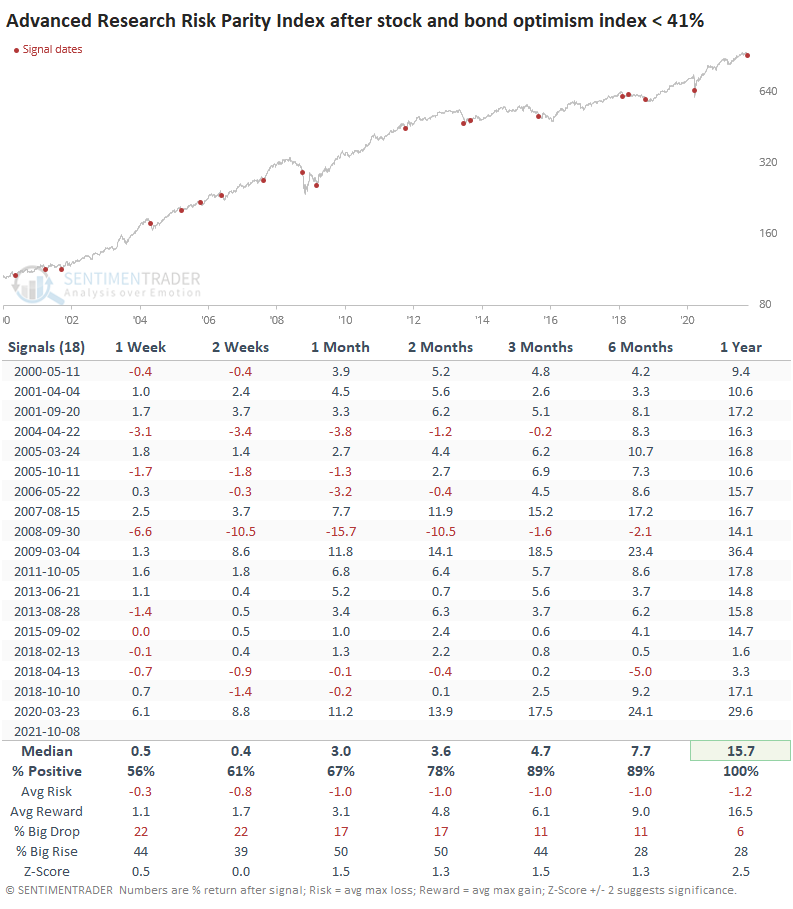
There is also a concern that action like this will trigger systemic issues due to risk parity funds. These obscure funds, which typically use heavy leverage to place bets on stock and bond markets based on their historical volatility, pop up once in a while as a boogeyman.
Their reaction after other periods of stock and bond pessimism made them even less risky than a balanced fund available to everyday investors. In the months after these signals, a risk parity index showed consistent gains, with extremely low risk relative to reward.
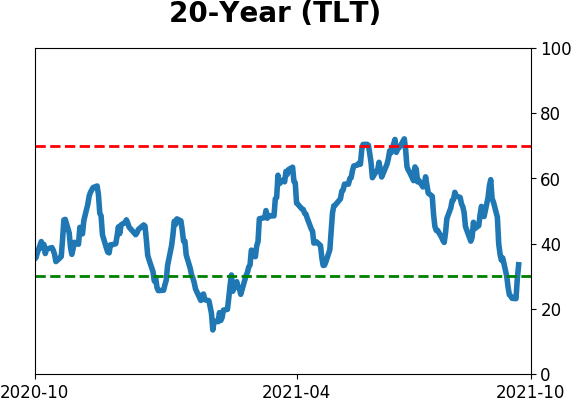
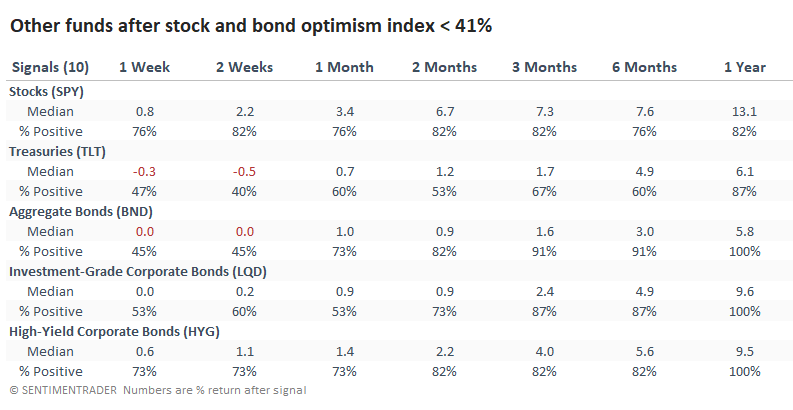
Returns in popular stock and bond ETFs were almost all good outside of the very short-term. The worst-performing of the funds focused on Treasuries.
There aren't very many opportunities for longer-term investors who try to balance their portfolios broadly by stock and bond allocations when investors in aggregate sour on both markets. While pessimism in either market isn't yet extreme, it's pretty stretched. That's curious given the relatively small losses, but maybe some pessimism makes sense when investors haven't suffered nary a blip for a year.
Regardless, when both markets see a lack of optimism as we see now, it's typically been a pretty good time to put money to work, with balanced funds being a good option.
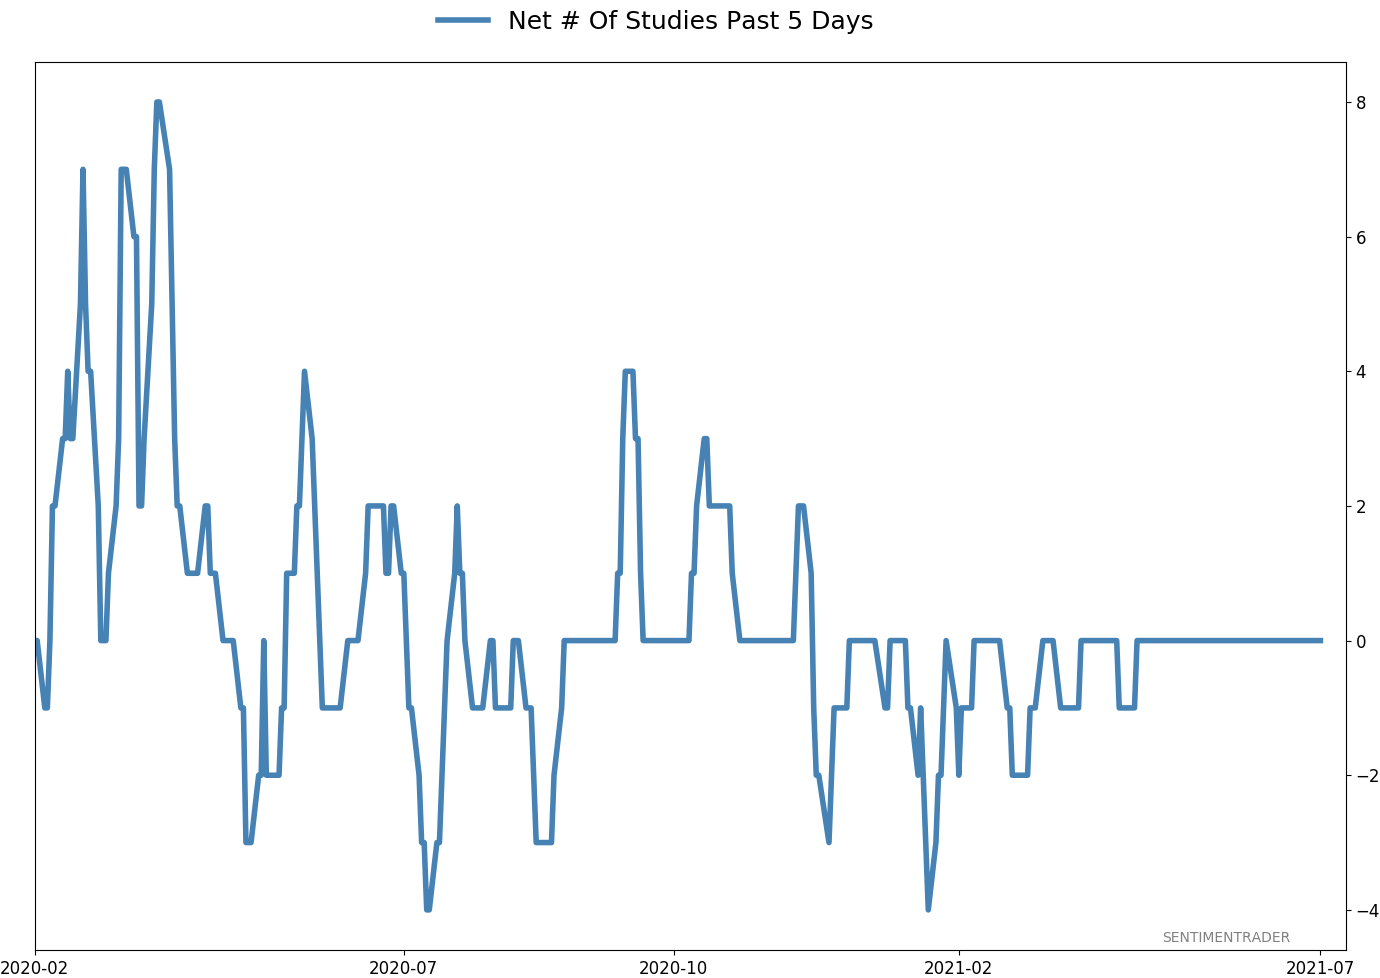
Active Studies
| Time Frame | Bullish | Bearish | | Short-Term | 0 | 0 | | Medium-Term | 7 | 0 | | Long-Term | 11 | 5 |
|
Indicators at Extremes
Portfolio
| Position | Description | Weight % | Added / Reduced | Date | | Stocks | RSP | 10.5 | Added 6.4% | 2021-10-01 | | Bonds | 23.9% BND, 6.9% SCHP | 31.5 | Reduced 7.1% | 2021-05-19 | | Commodities | GCC | 2.6 | Reduced 2.1%
| 2020-09-04 | | Precious Metals | GDX | 4.2 | Reduced 4.2% | 2021-05-19 | | Special Situations | 9.8% KWEB, 4.7% XLE, 2.9% PSCE | 17.3 | Added 9.78% | 2021-10-01 | | Cash | | 34.0 | | |
|
Updates (Changes made today are underlined)
Much of our momentum and trend work has remained positive for several months, with some scattered exceptions. Almost all sentiment-related work has shown a poor risk/reward ratio for stocks, especially as speculation drove to record highs in exuberance in February. Much of that has worn off, and most of our models are back toward neutral levels. There isn't much to be excited about here. The same goes for bonds and even gold. Gold has been performing well lately and is back above long-term trend lines. The issue is that it has a poor record of holding onto gains when attempting a long-term trend change like this, so we'll take a wait-and-see approach. Momentum has ebbed quickly in recent weeks, and nearing oversold levels in some indicators. This can be a dangerous area, with a lot of short-term volatility, but we'd be more inclined to add medium- to long-term exposure rather than sell on much more of a decline, thanks to already rock-bottom exposure. Other areas look more attractive, including some overseas markets. RETURN YTD: 10.6% 2020: 8.1%, 2019: 12.6%, 2018: 0.6%, 2017: 3.8%, 2016: 17.1%, 2015: 9.2%, 2014: 14.5%, 2013: 2.2%, 2012: 10.8%, 2011: 16.5%, 2010: 15.3%, 2009: 23.9%, 2008: 16.2%, 2007: 7.8%
|
|
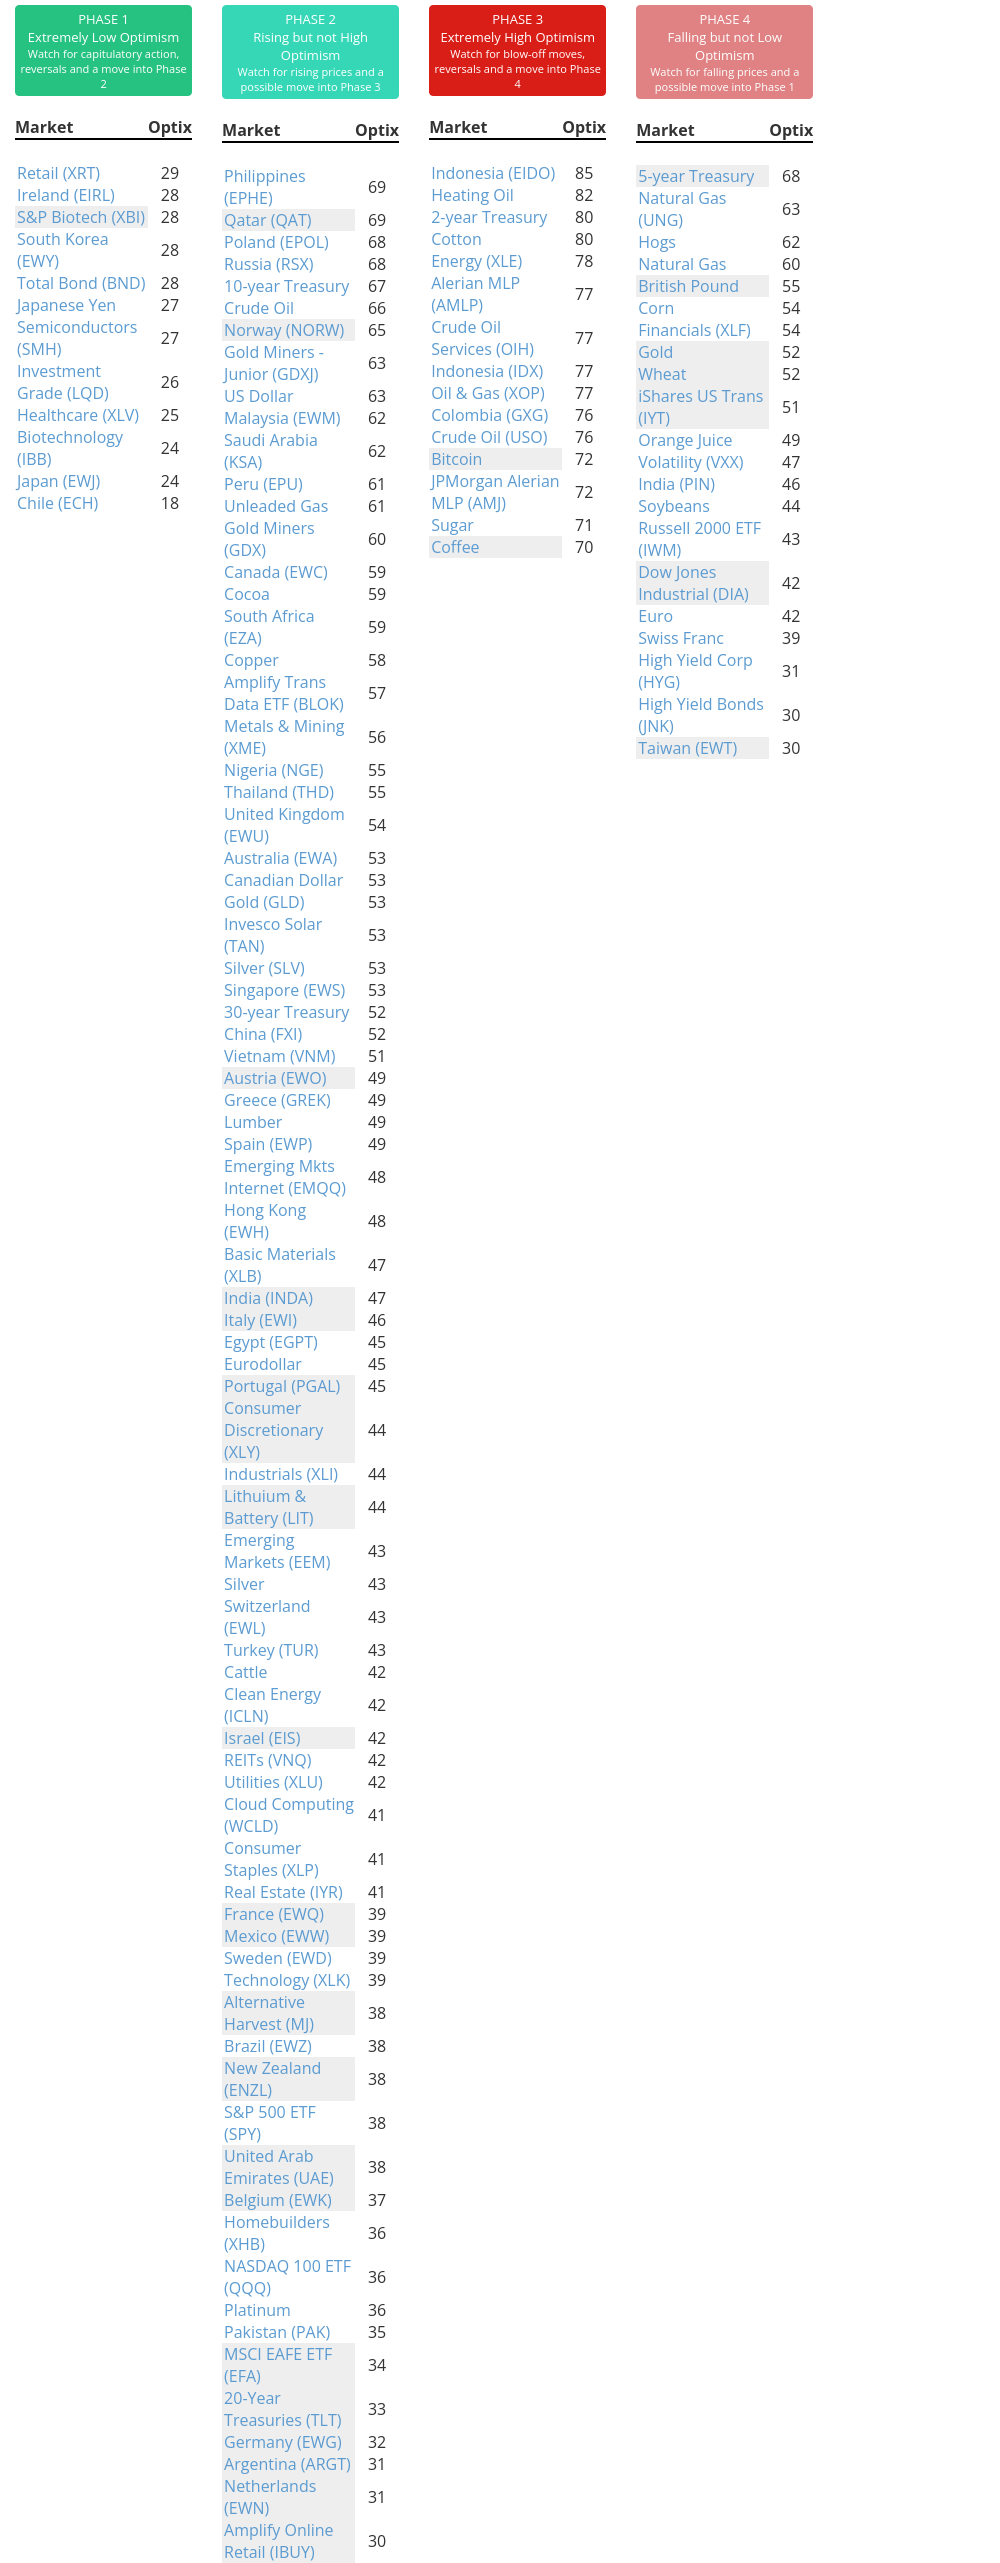
Phase Table
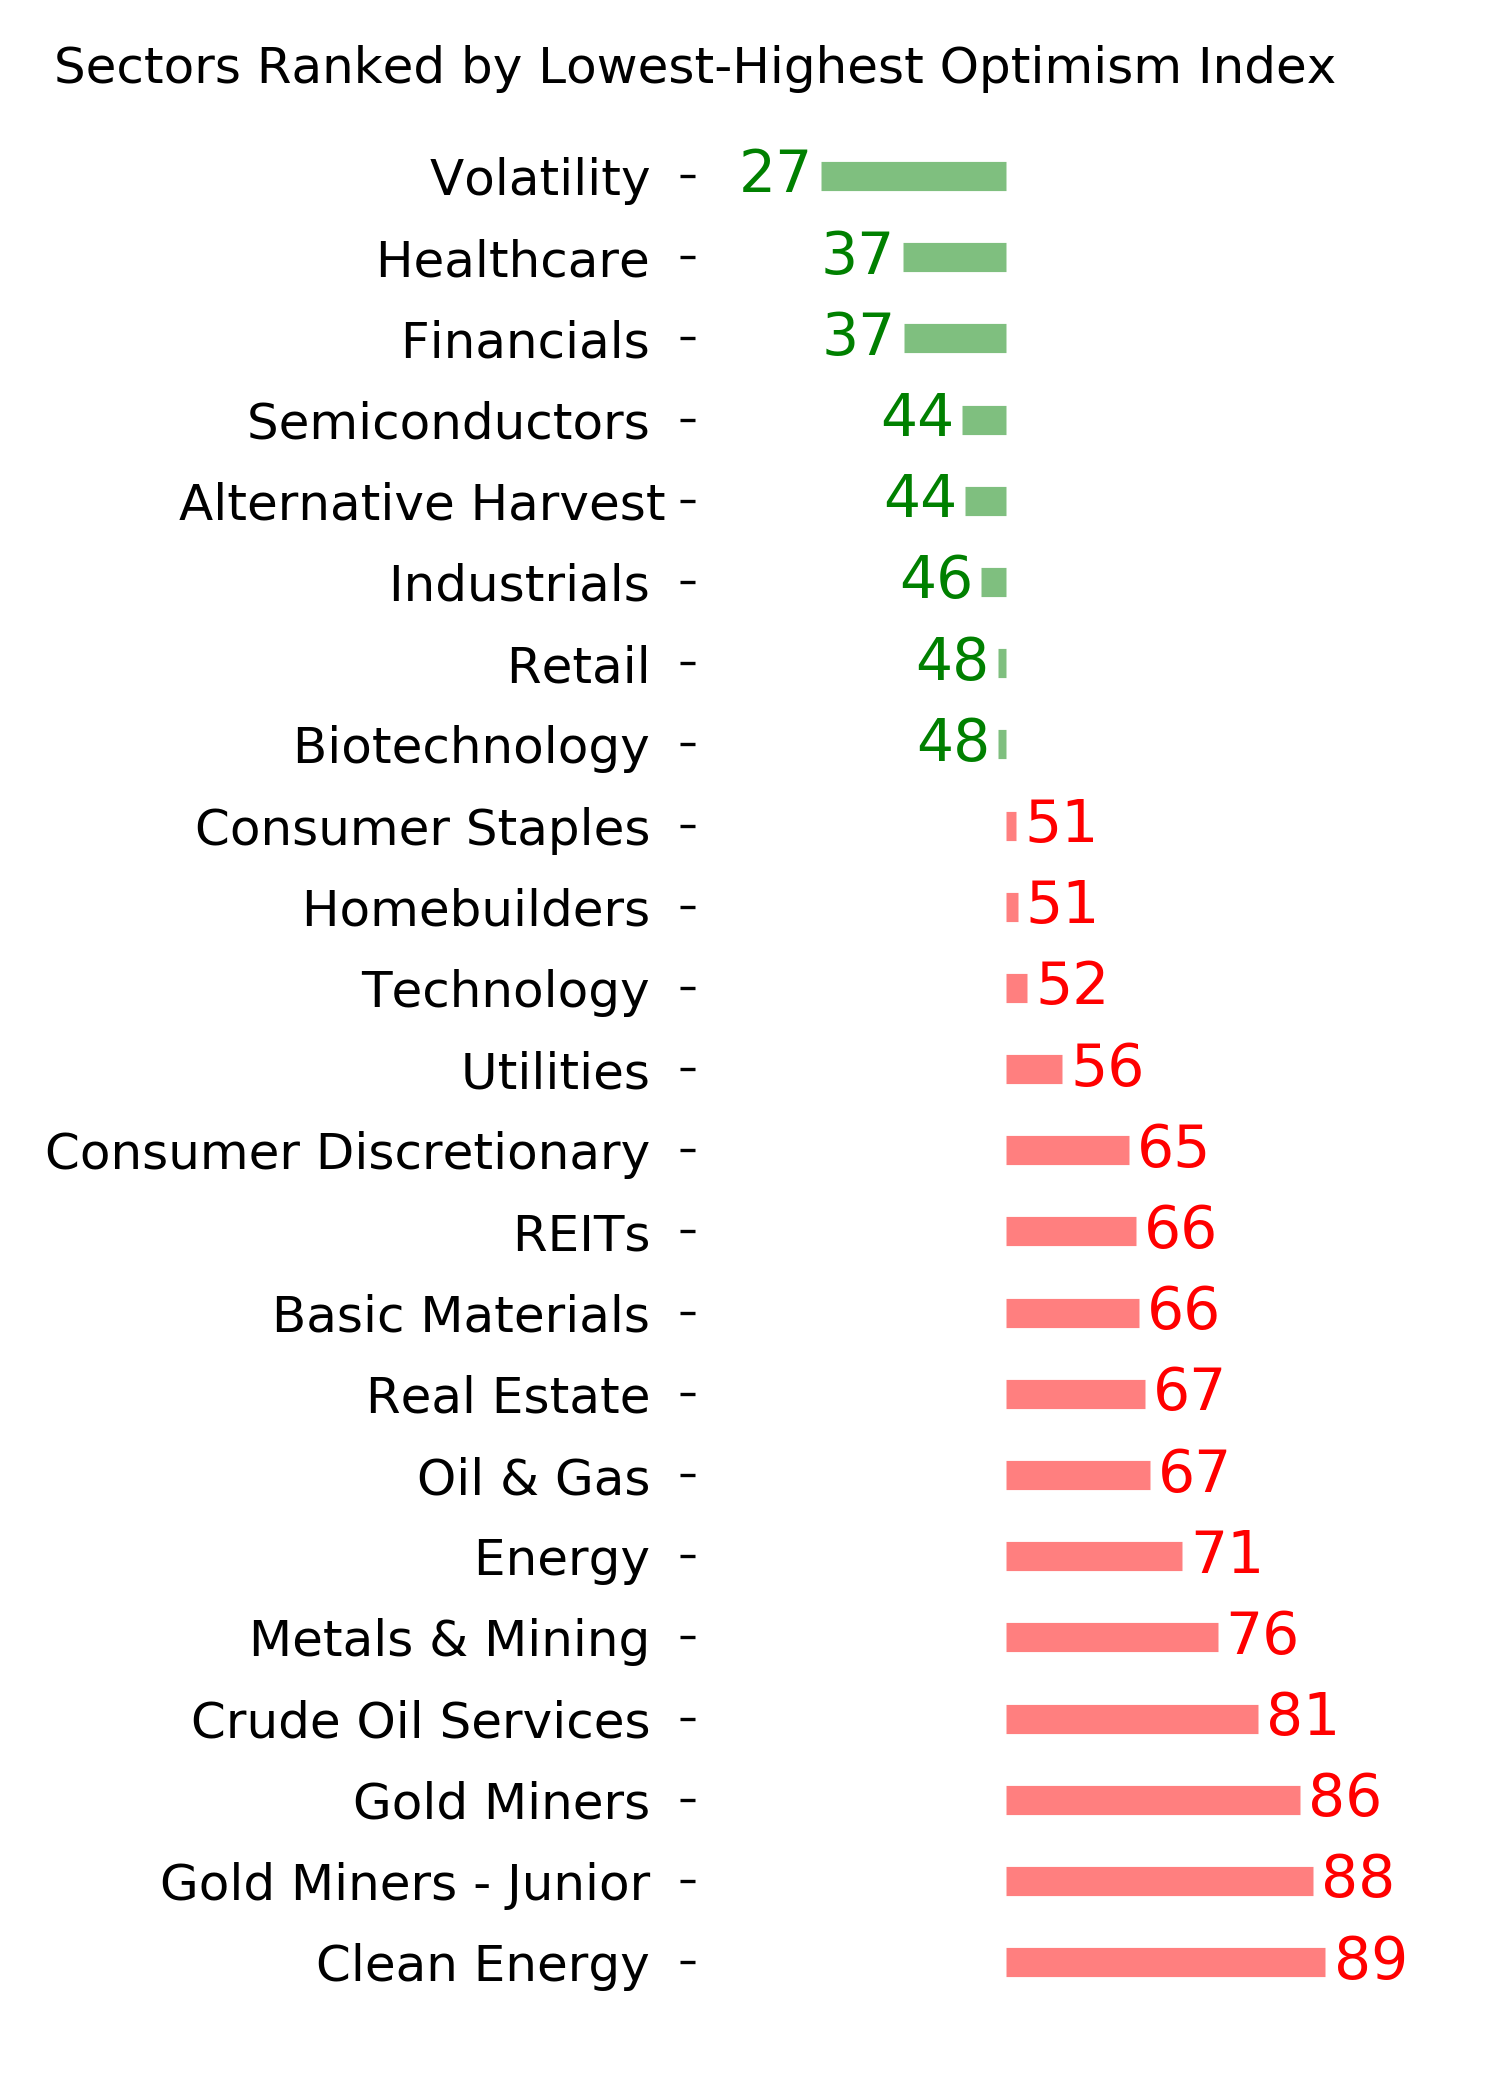
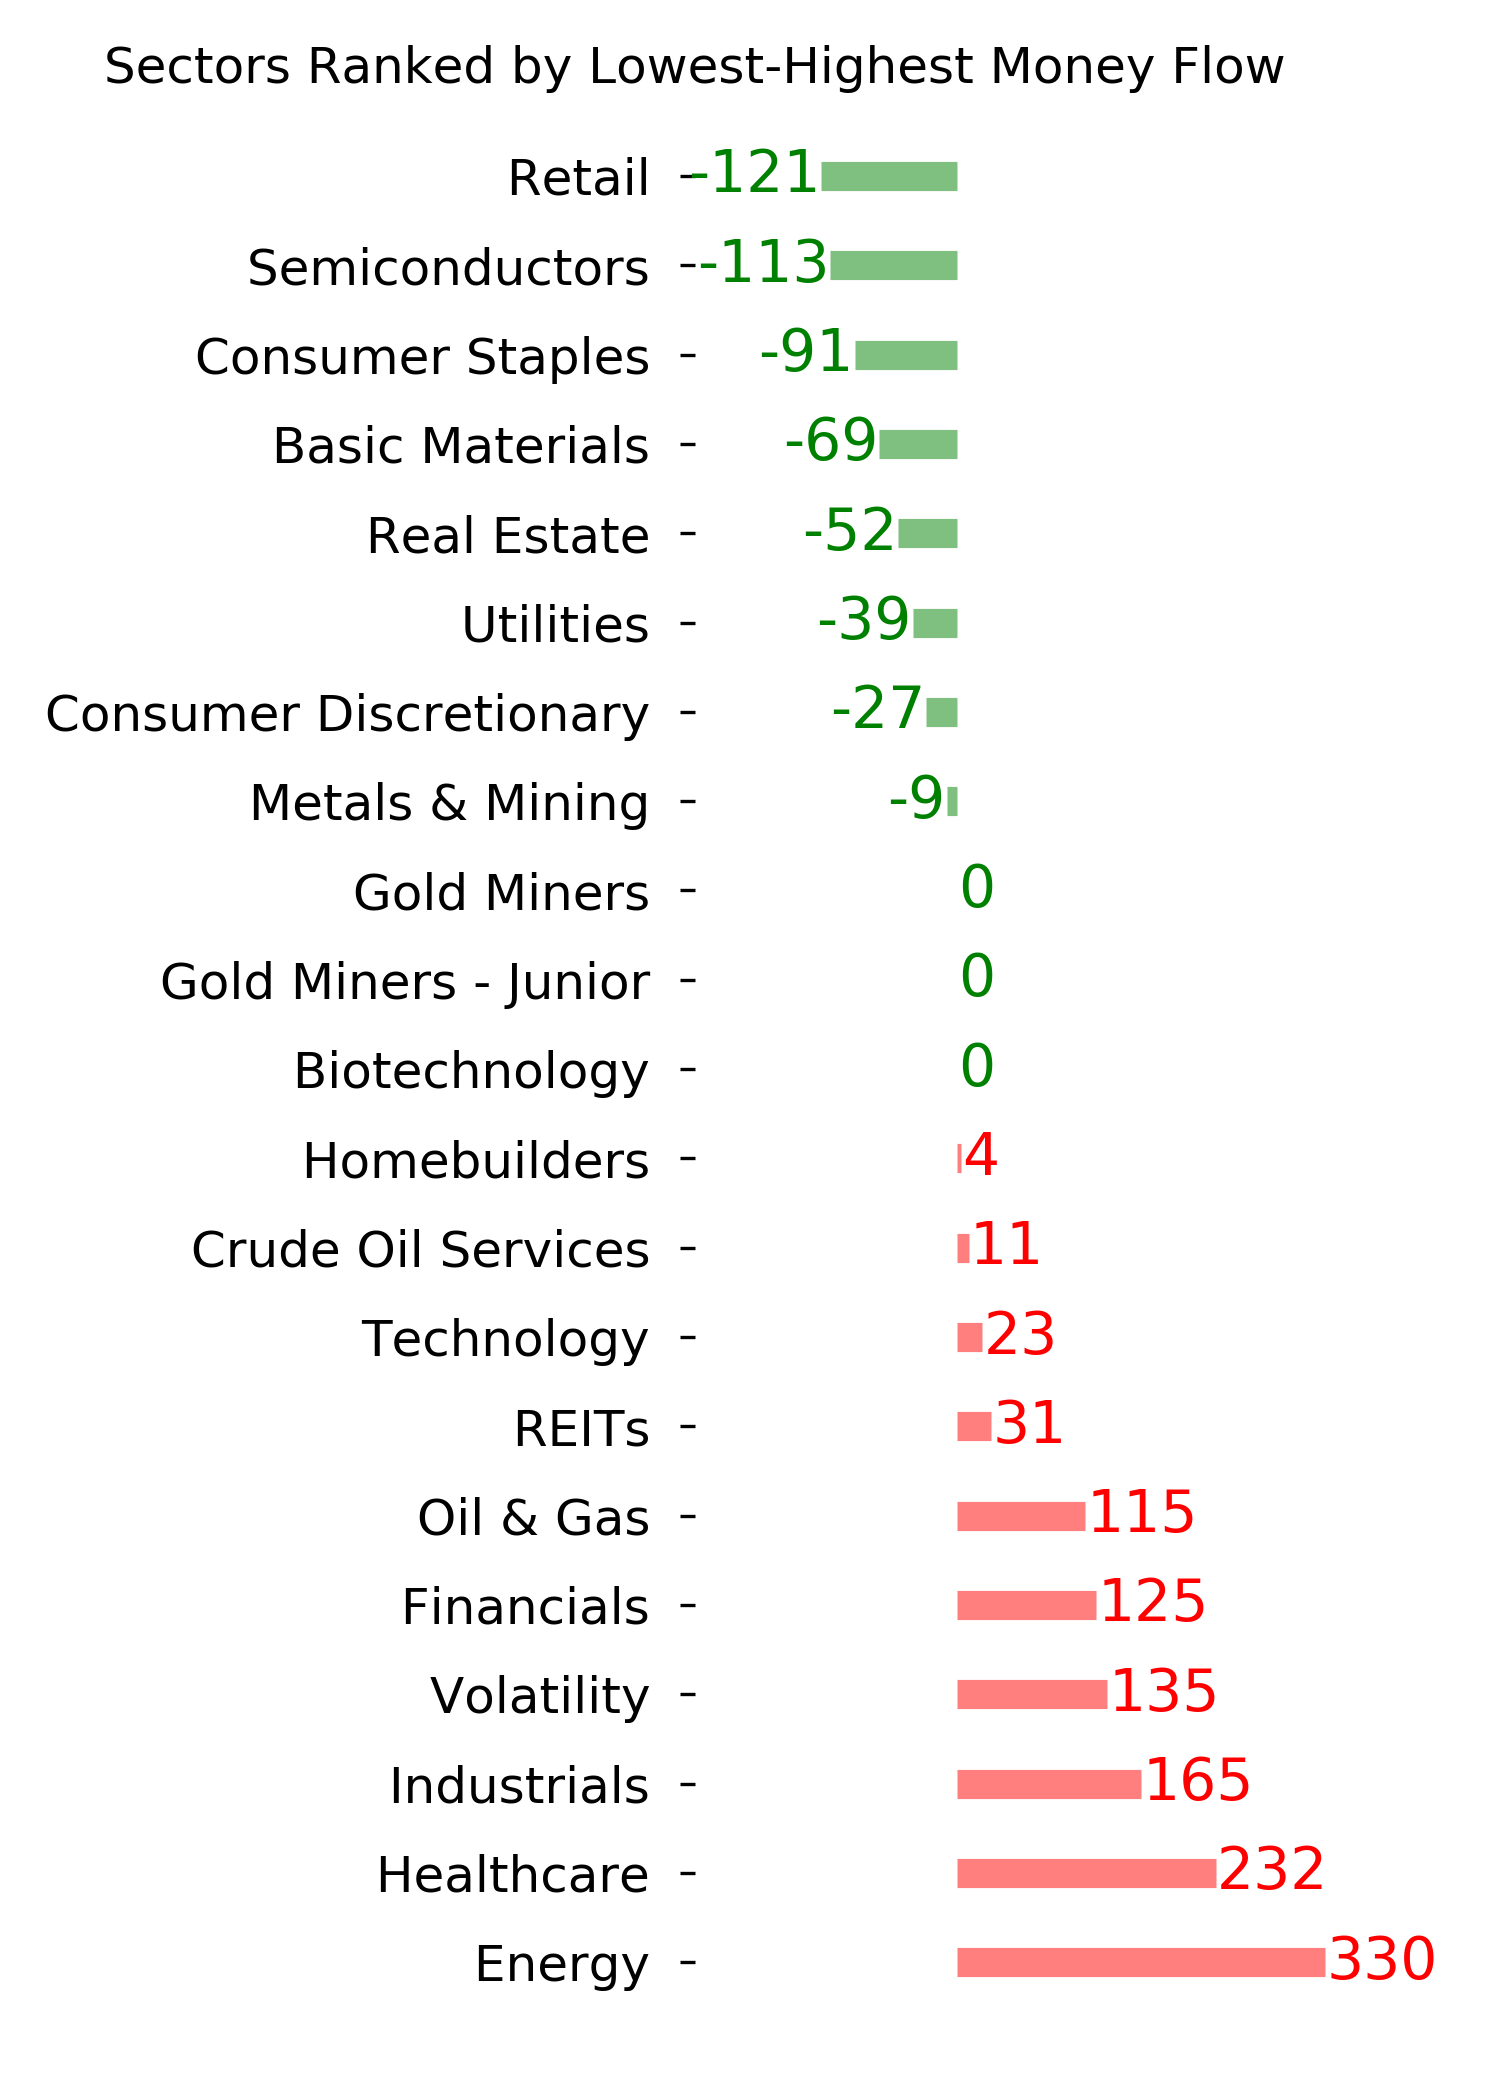
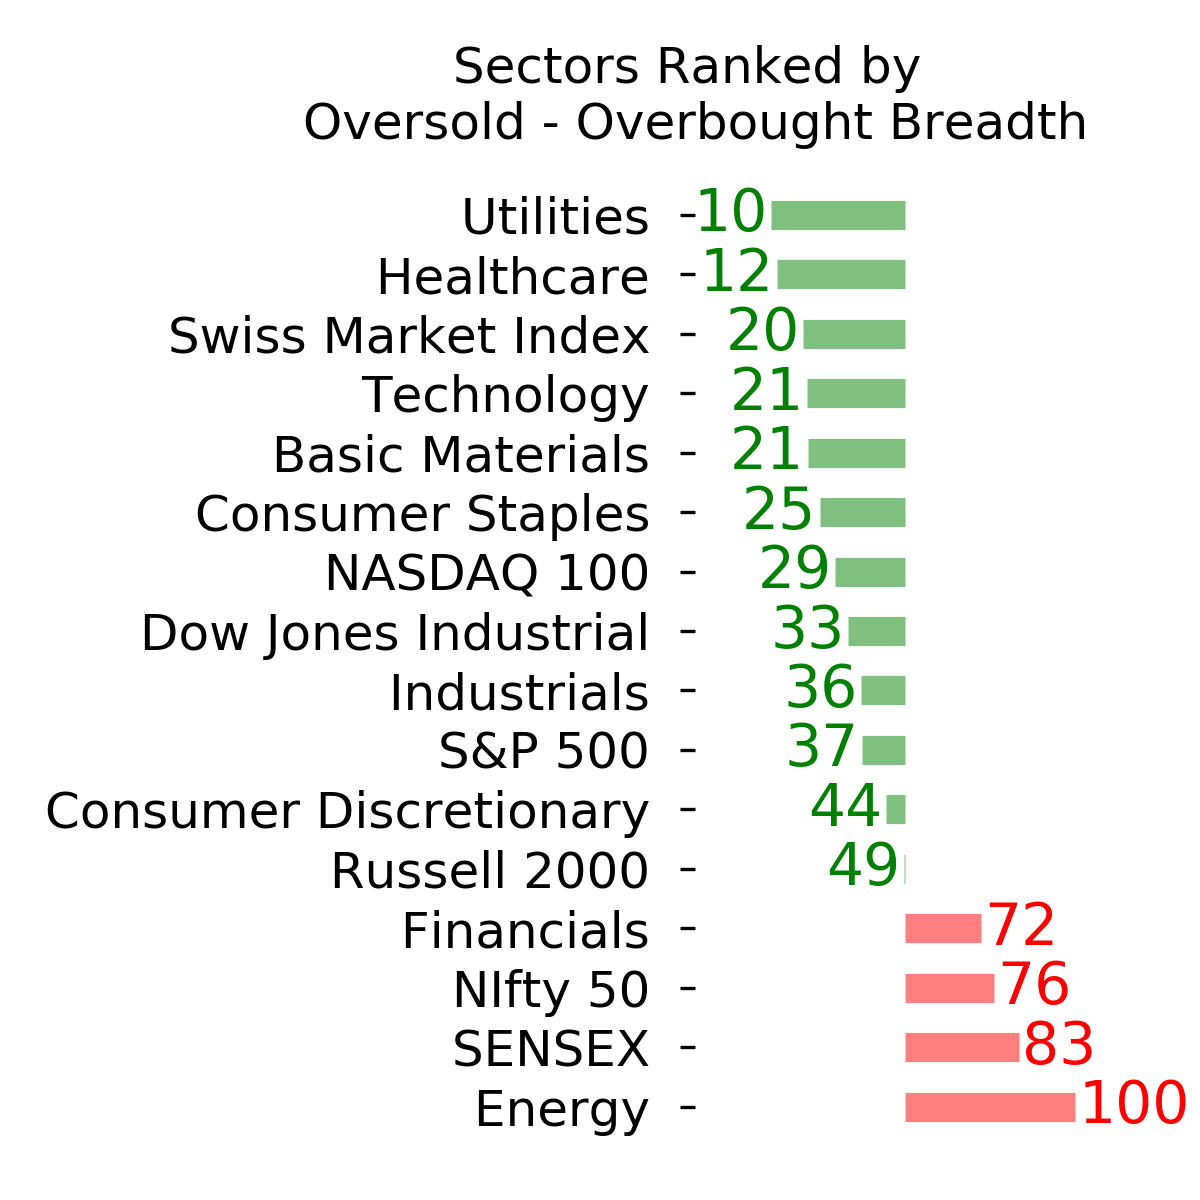
Ranks
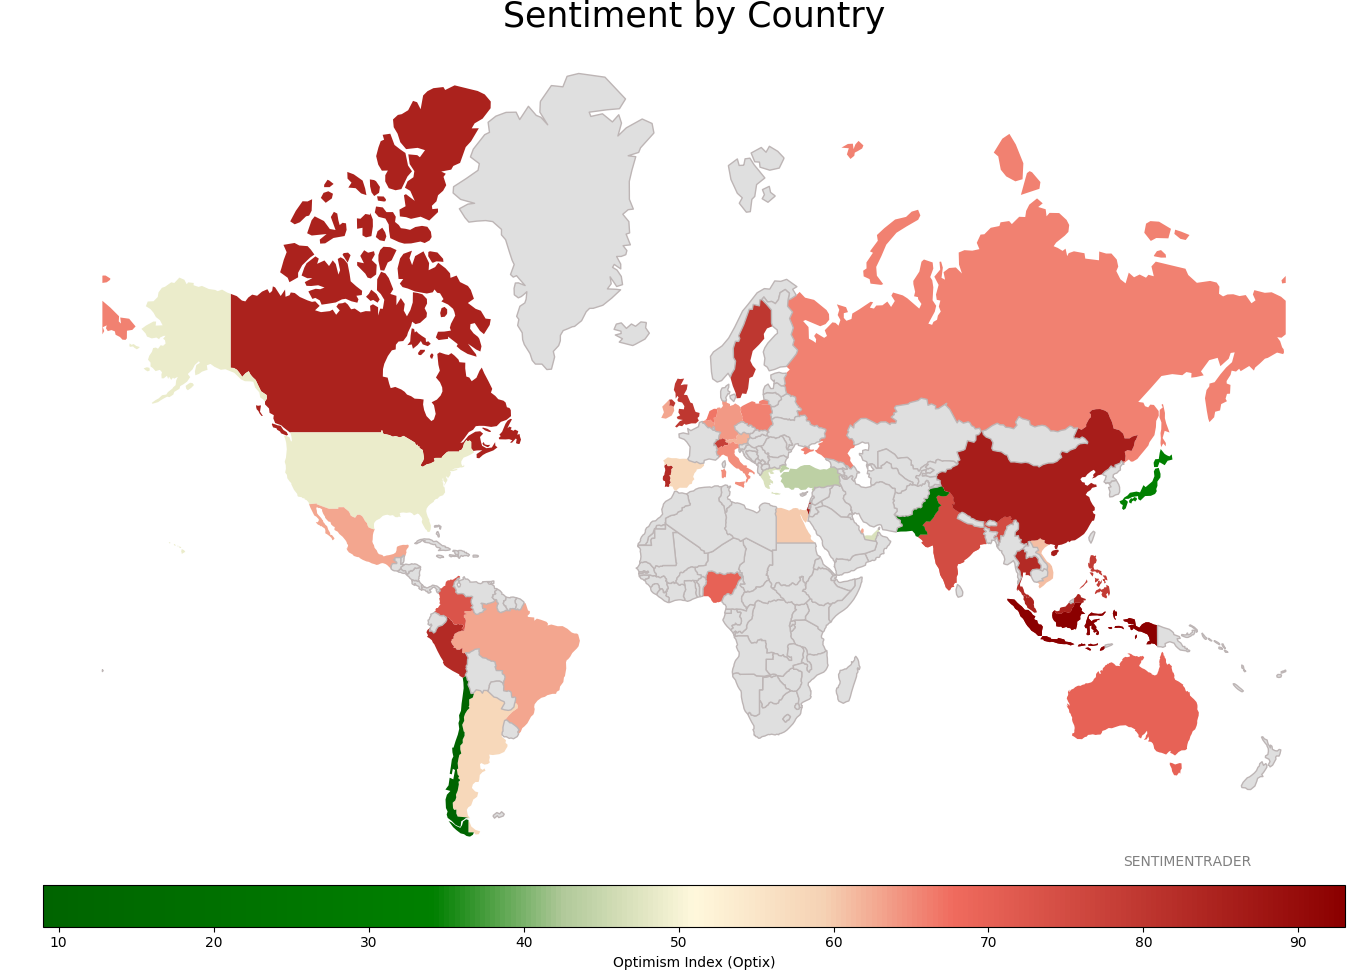
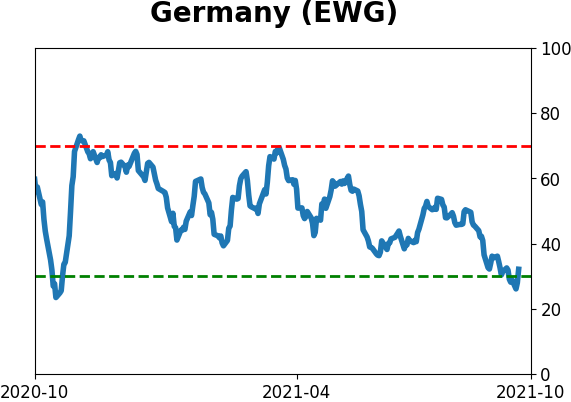
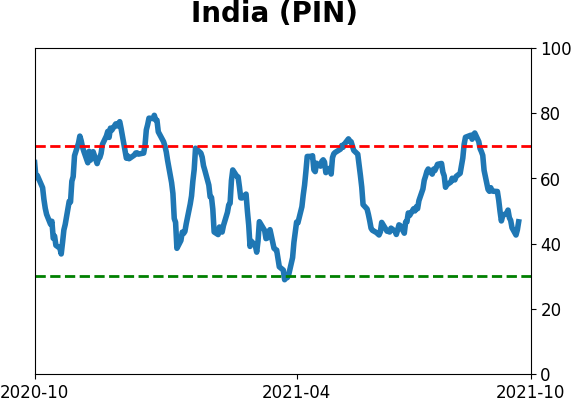
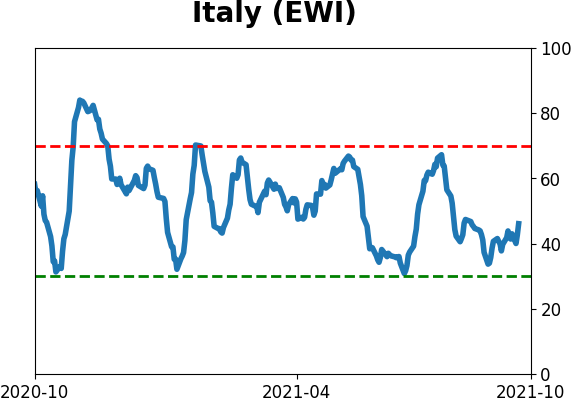
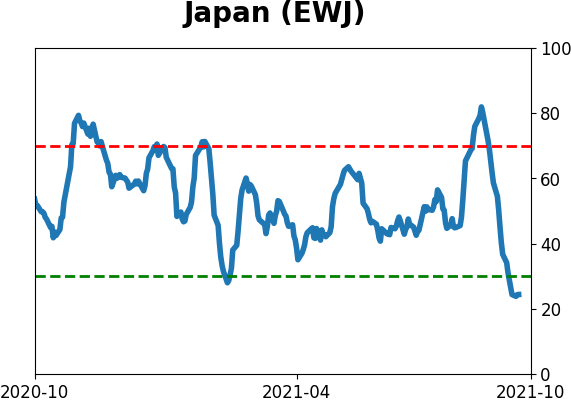
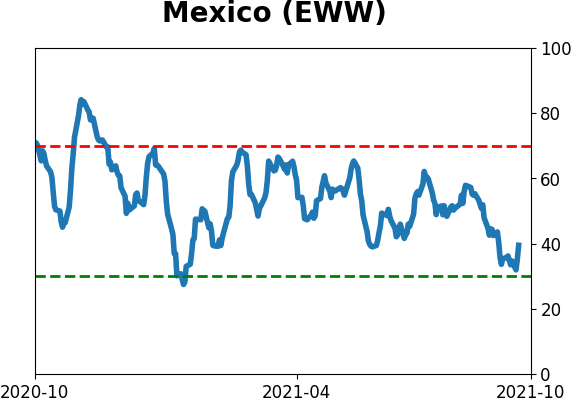
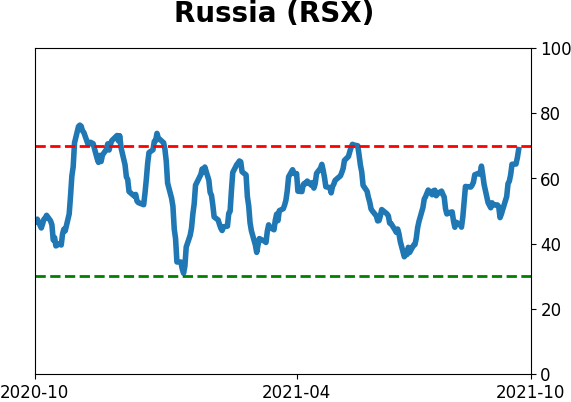
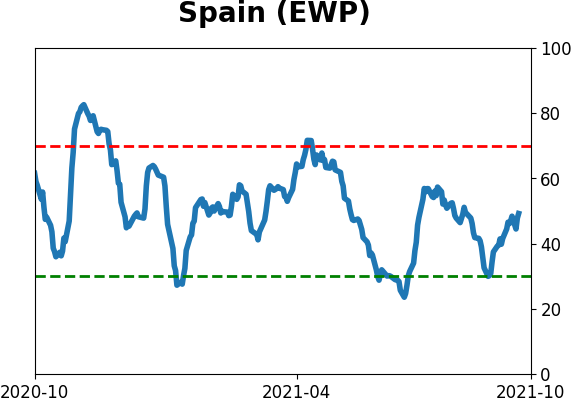
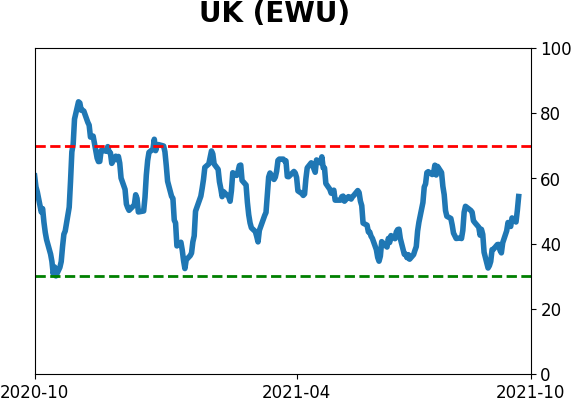
Sentiment Around The World
Optimism Index Thumbnails
|
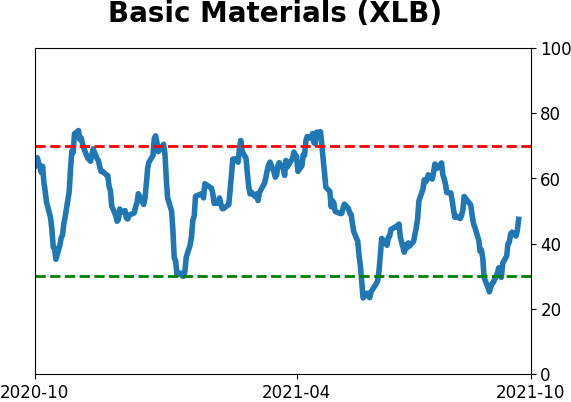
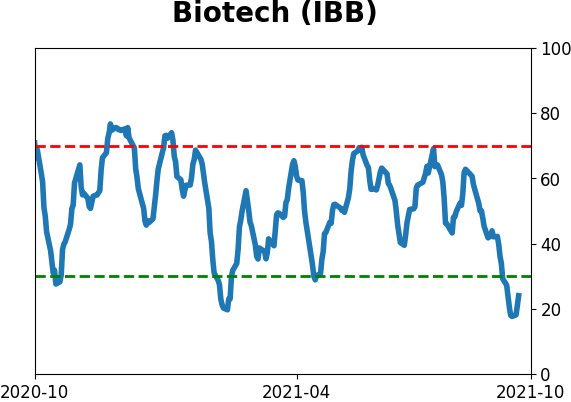
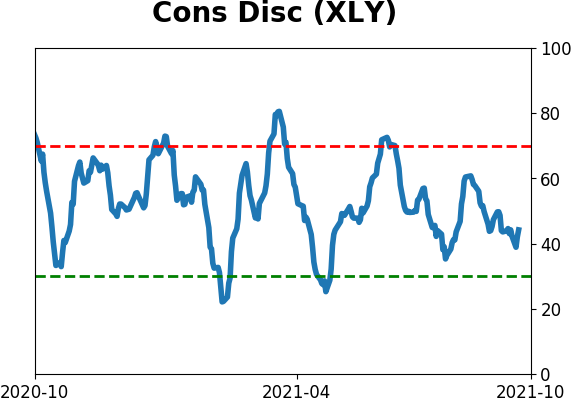
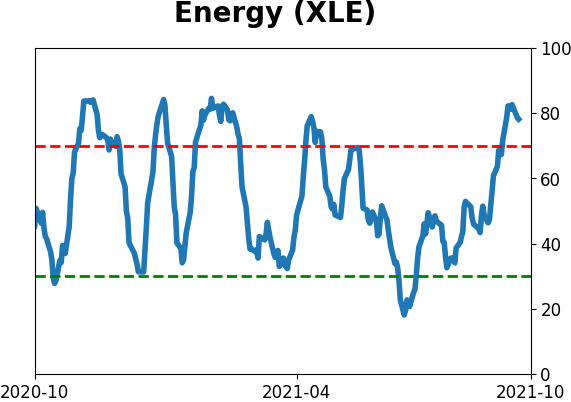
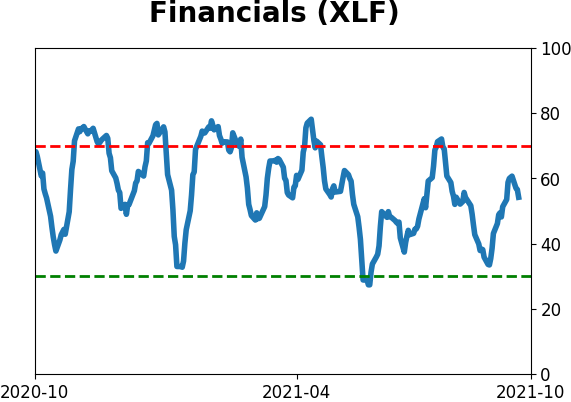
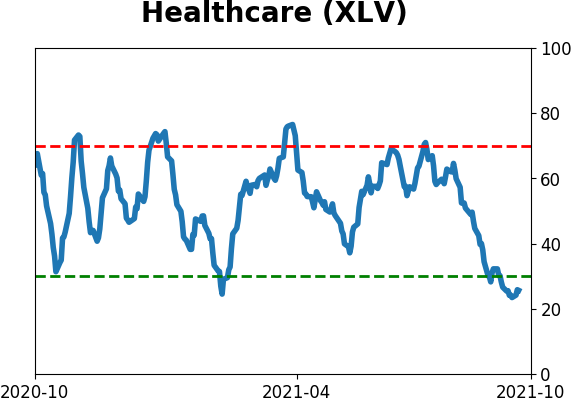
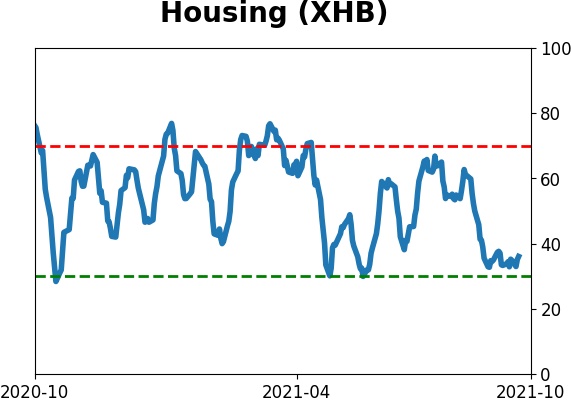
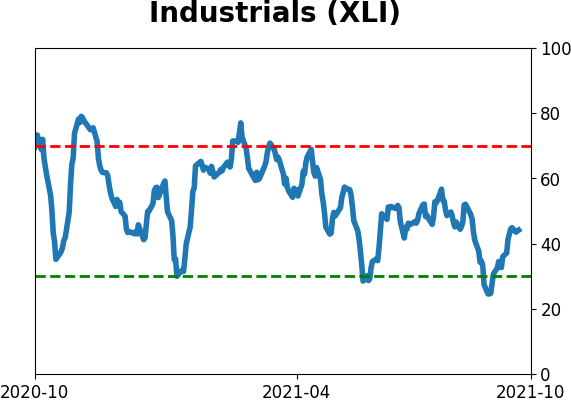
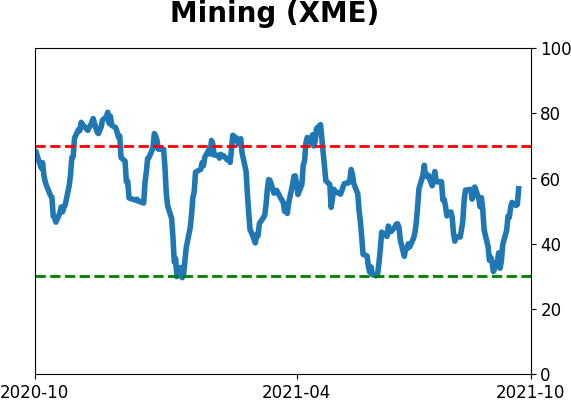
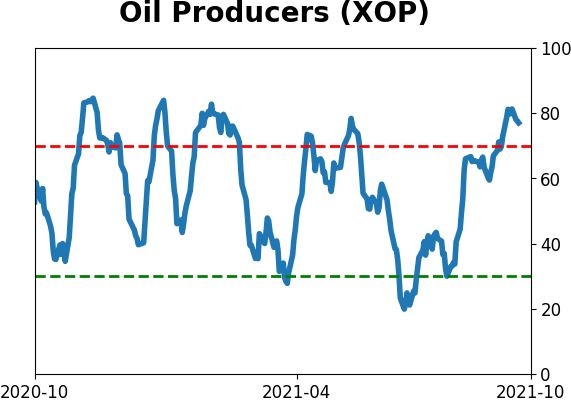
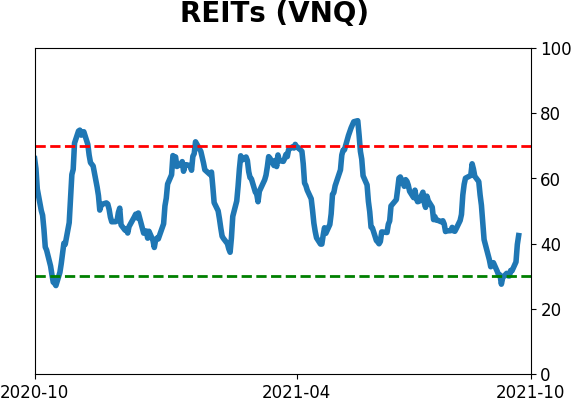
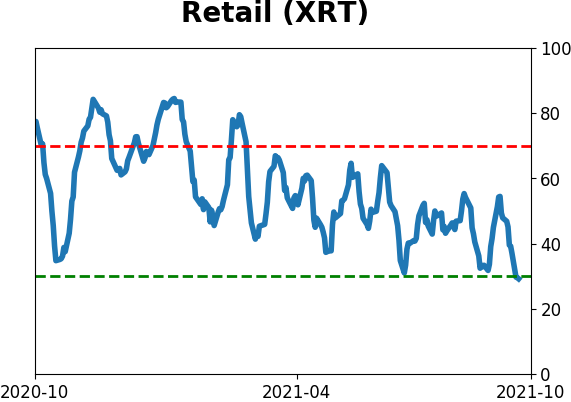
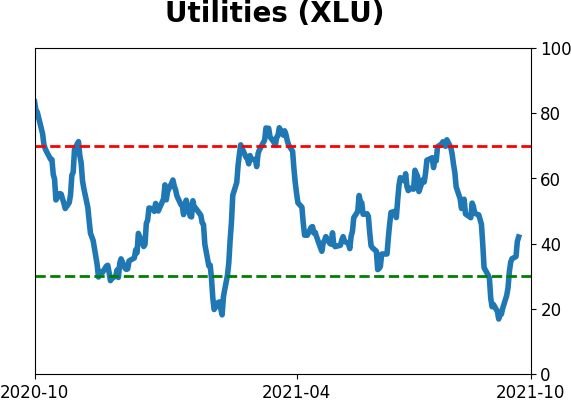
Sector ETF's - 10-Day Moving Average
|
|
|
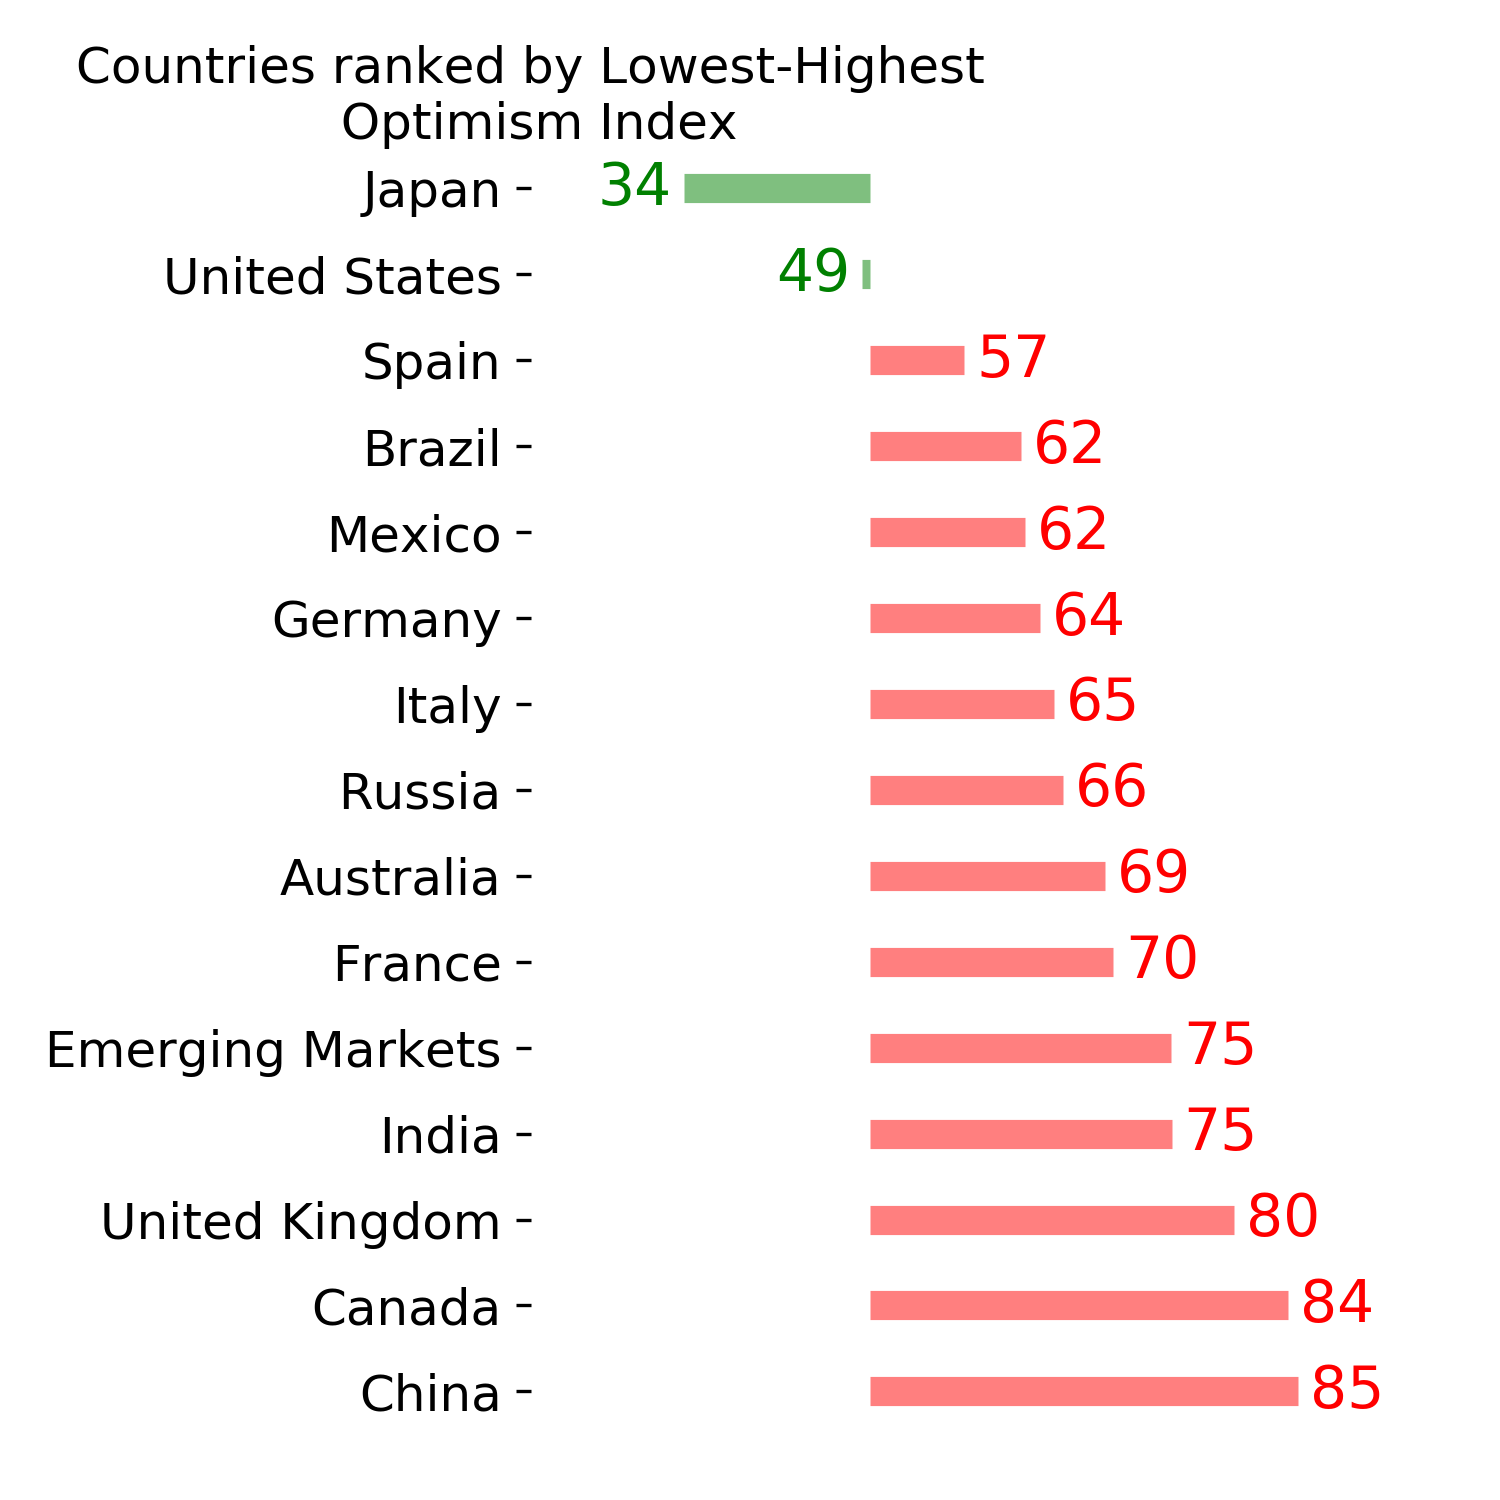
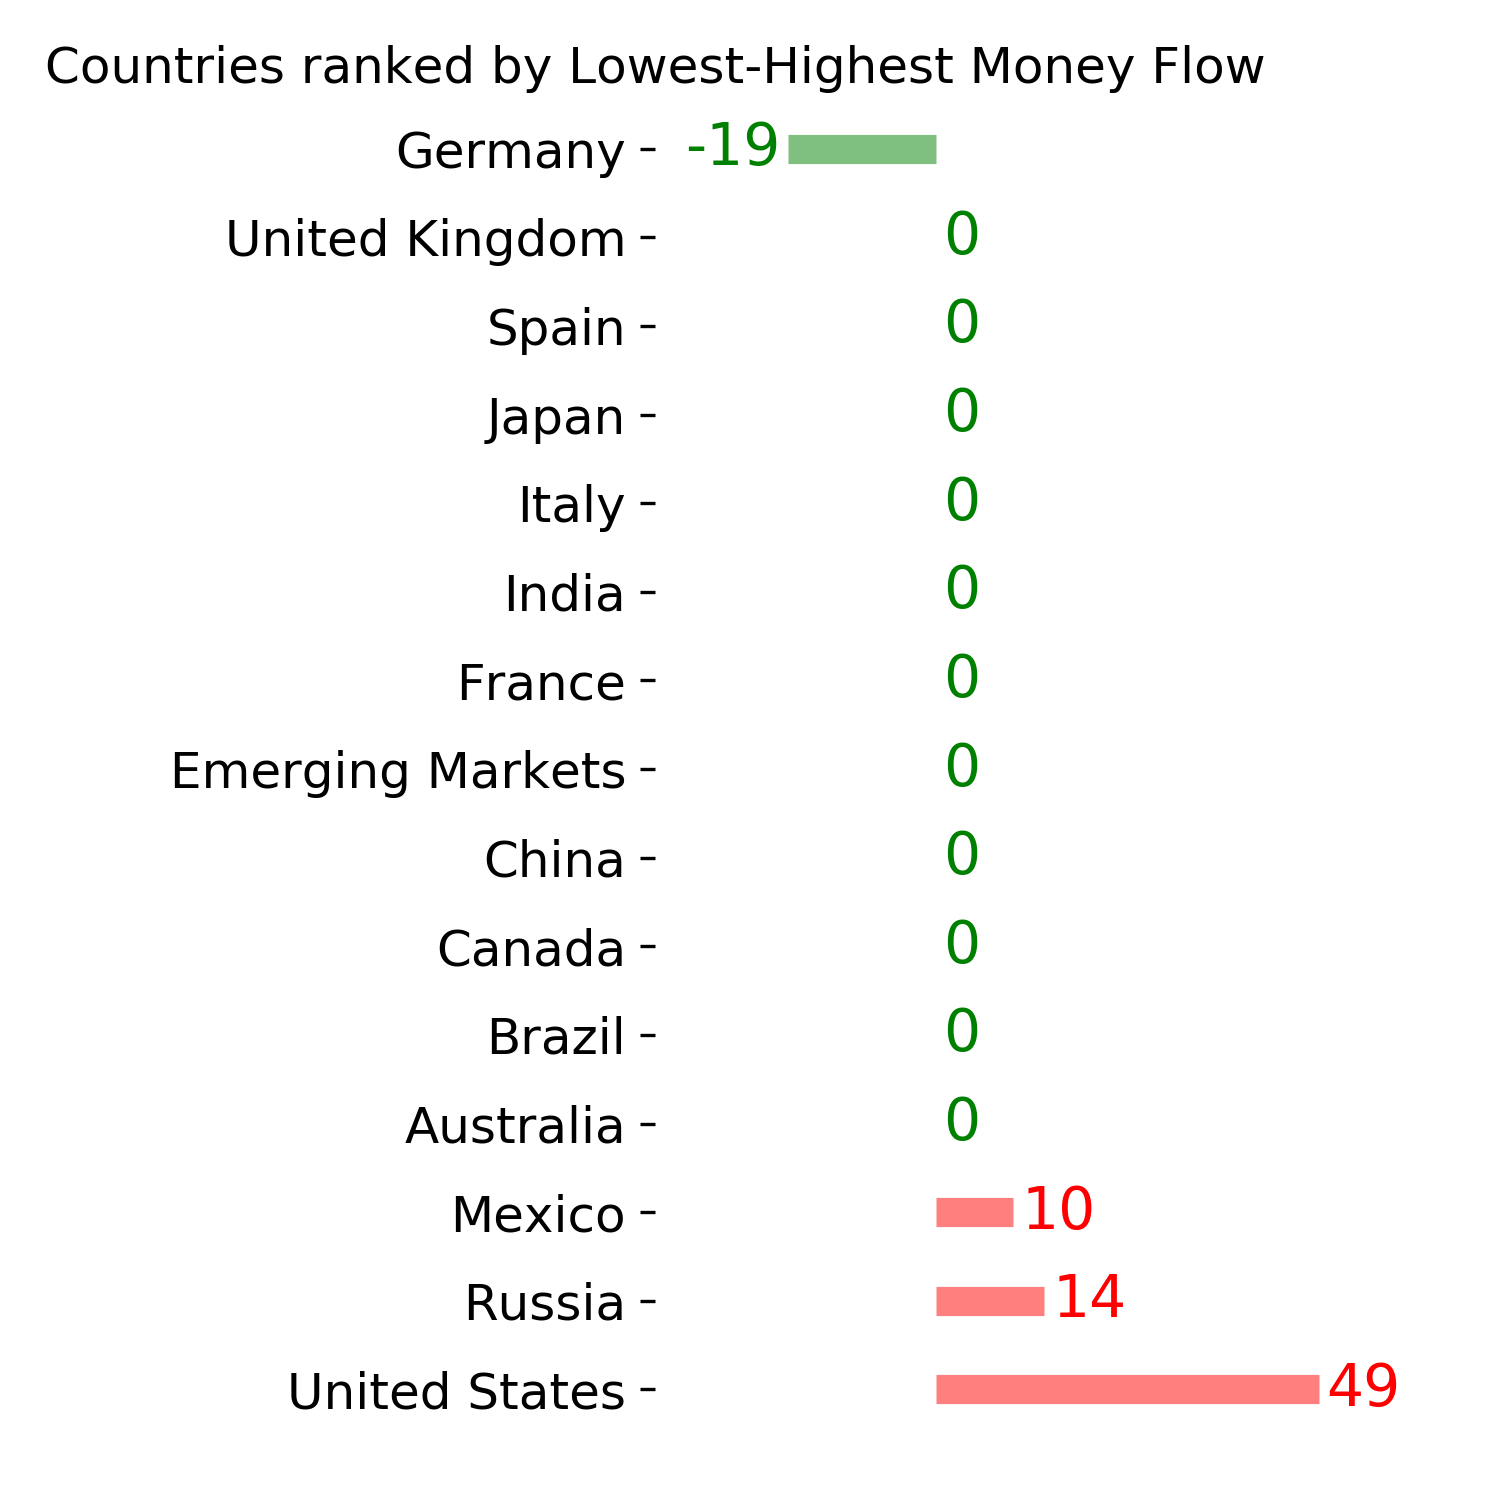
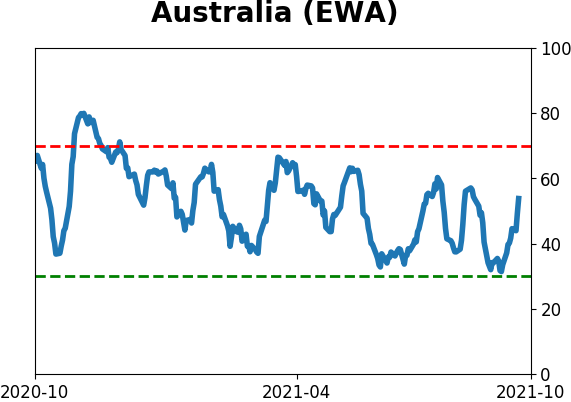
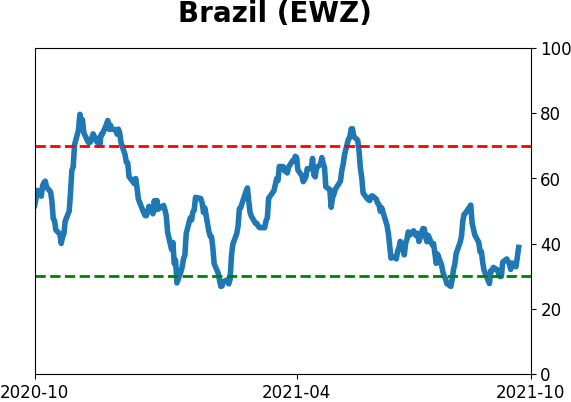
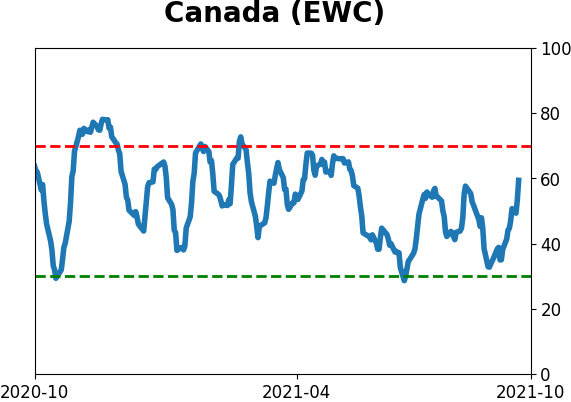
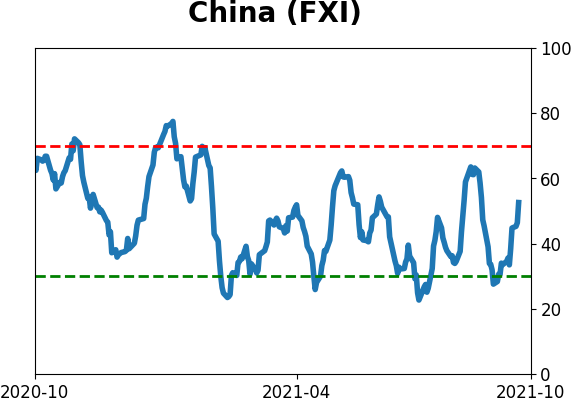
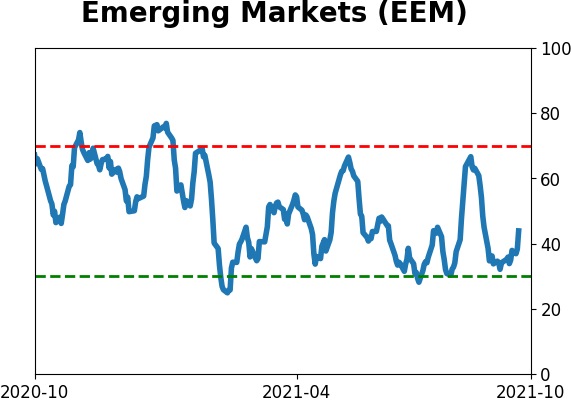
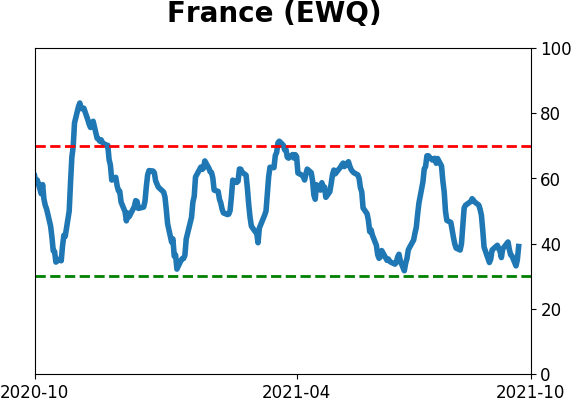
Country ETF's - 10-Day Moving Average
|
|
|
Bond ETF's - 10-Day Moving Average
|
|
|
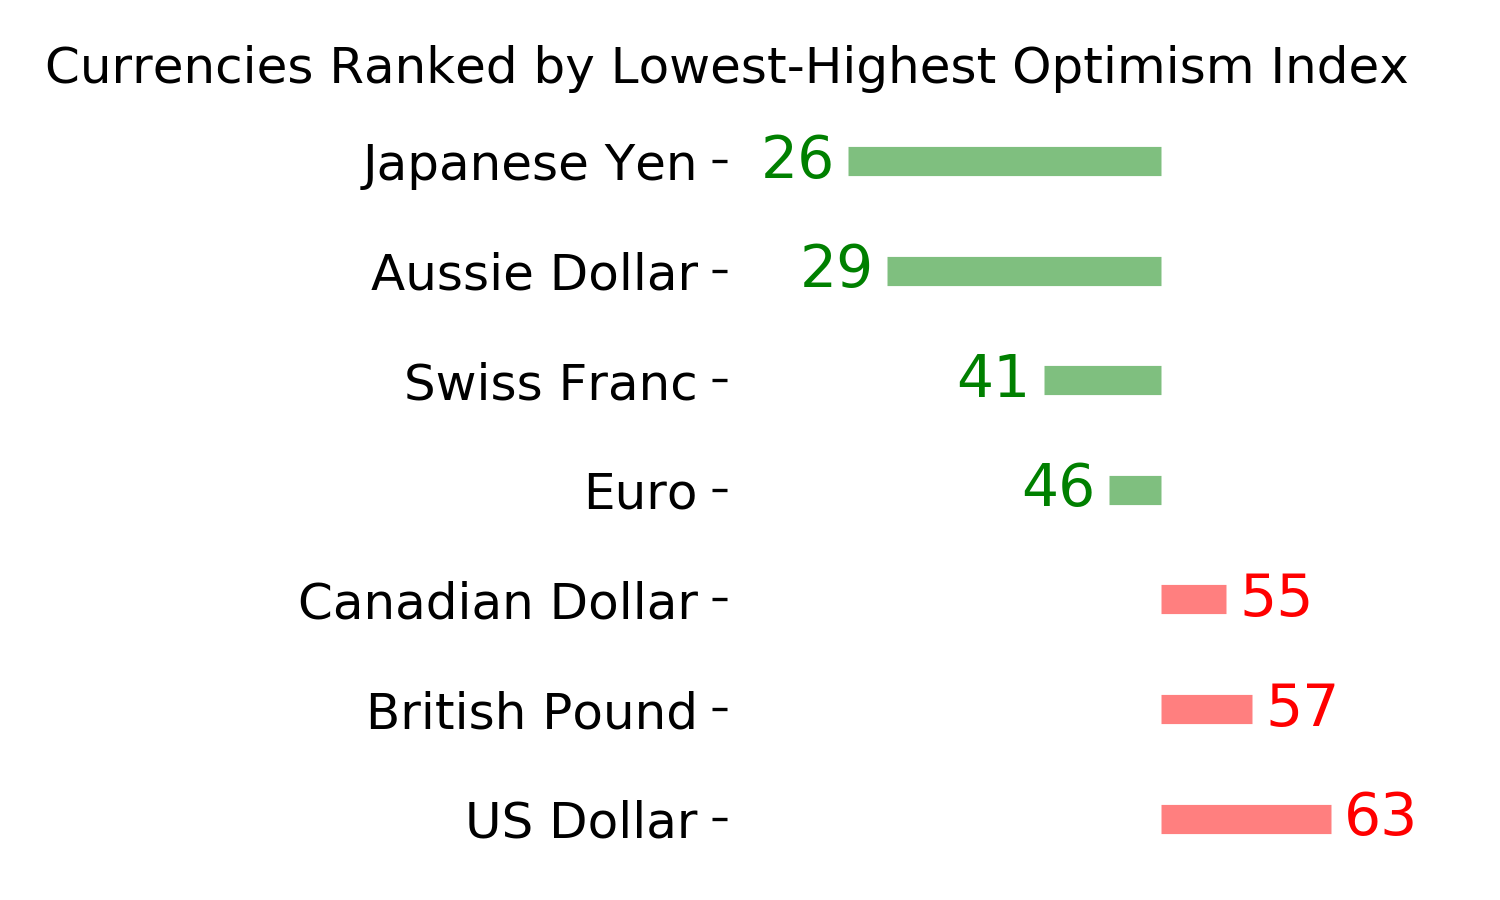
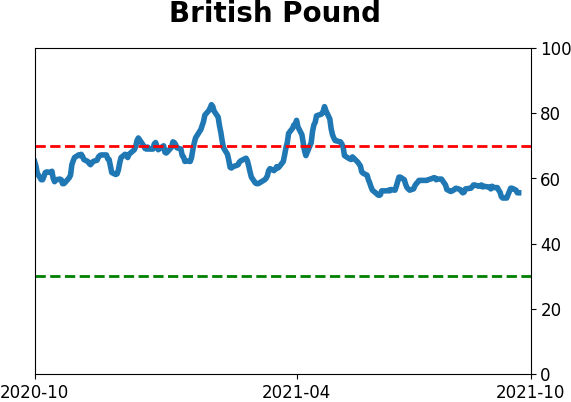
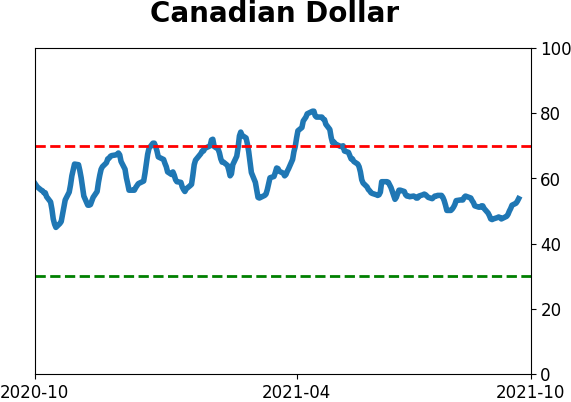
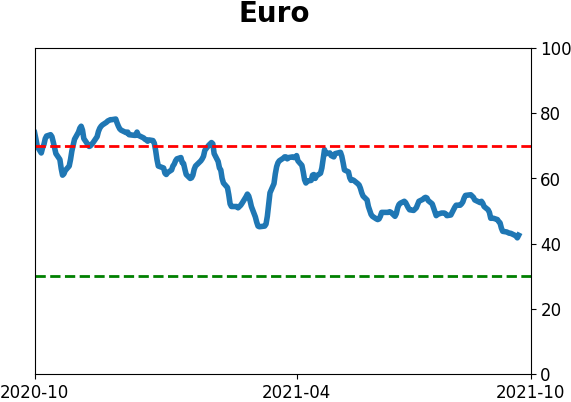
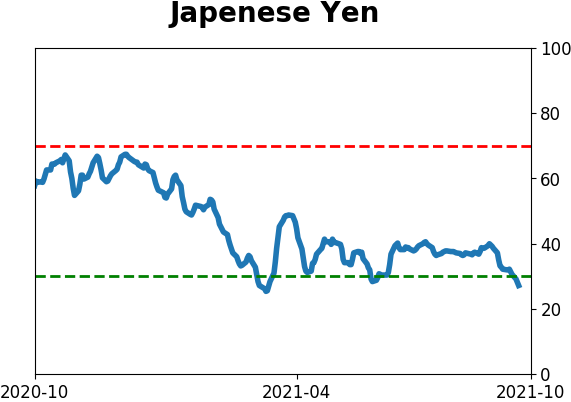
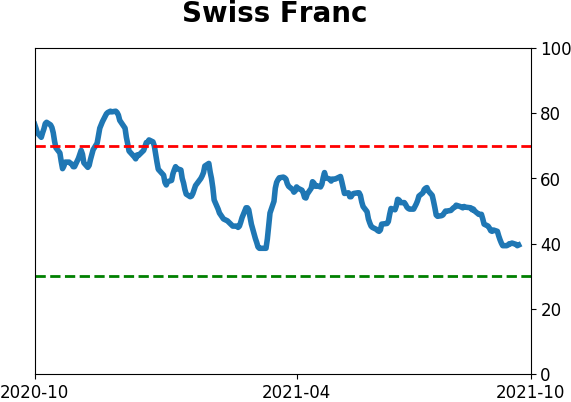
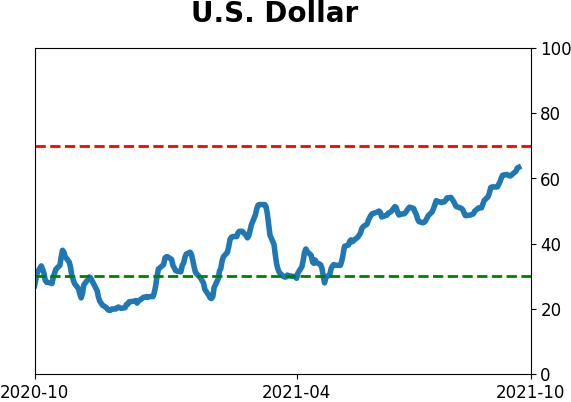
Currency ETF's - 5-Day Moving Average
|
|
|
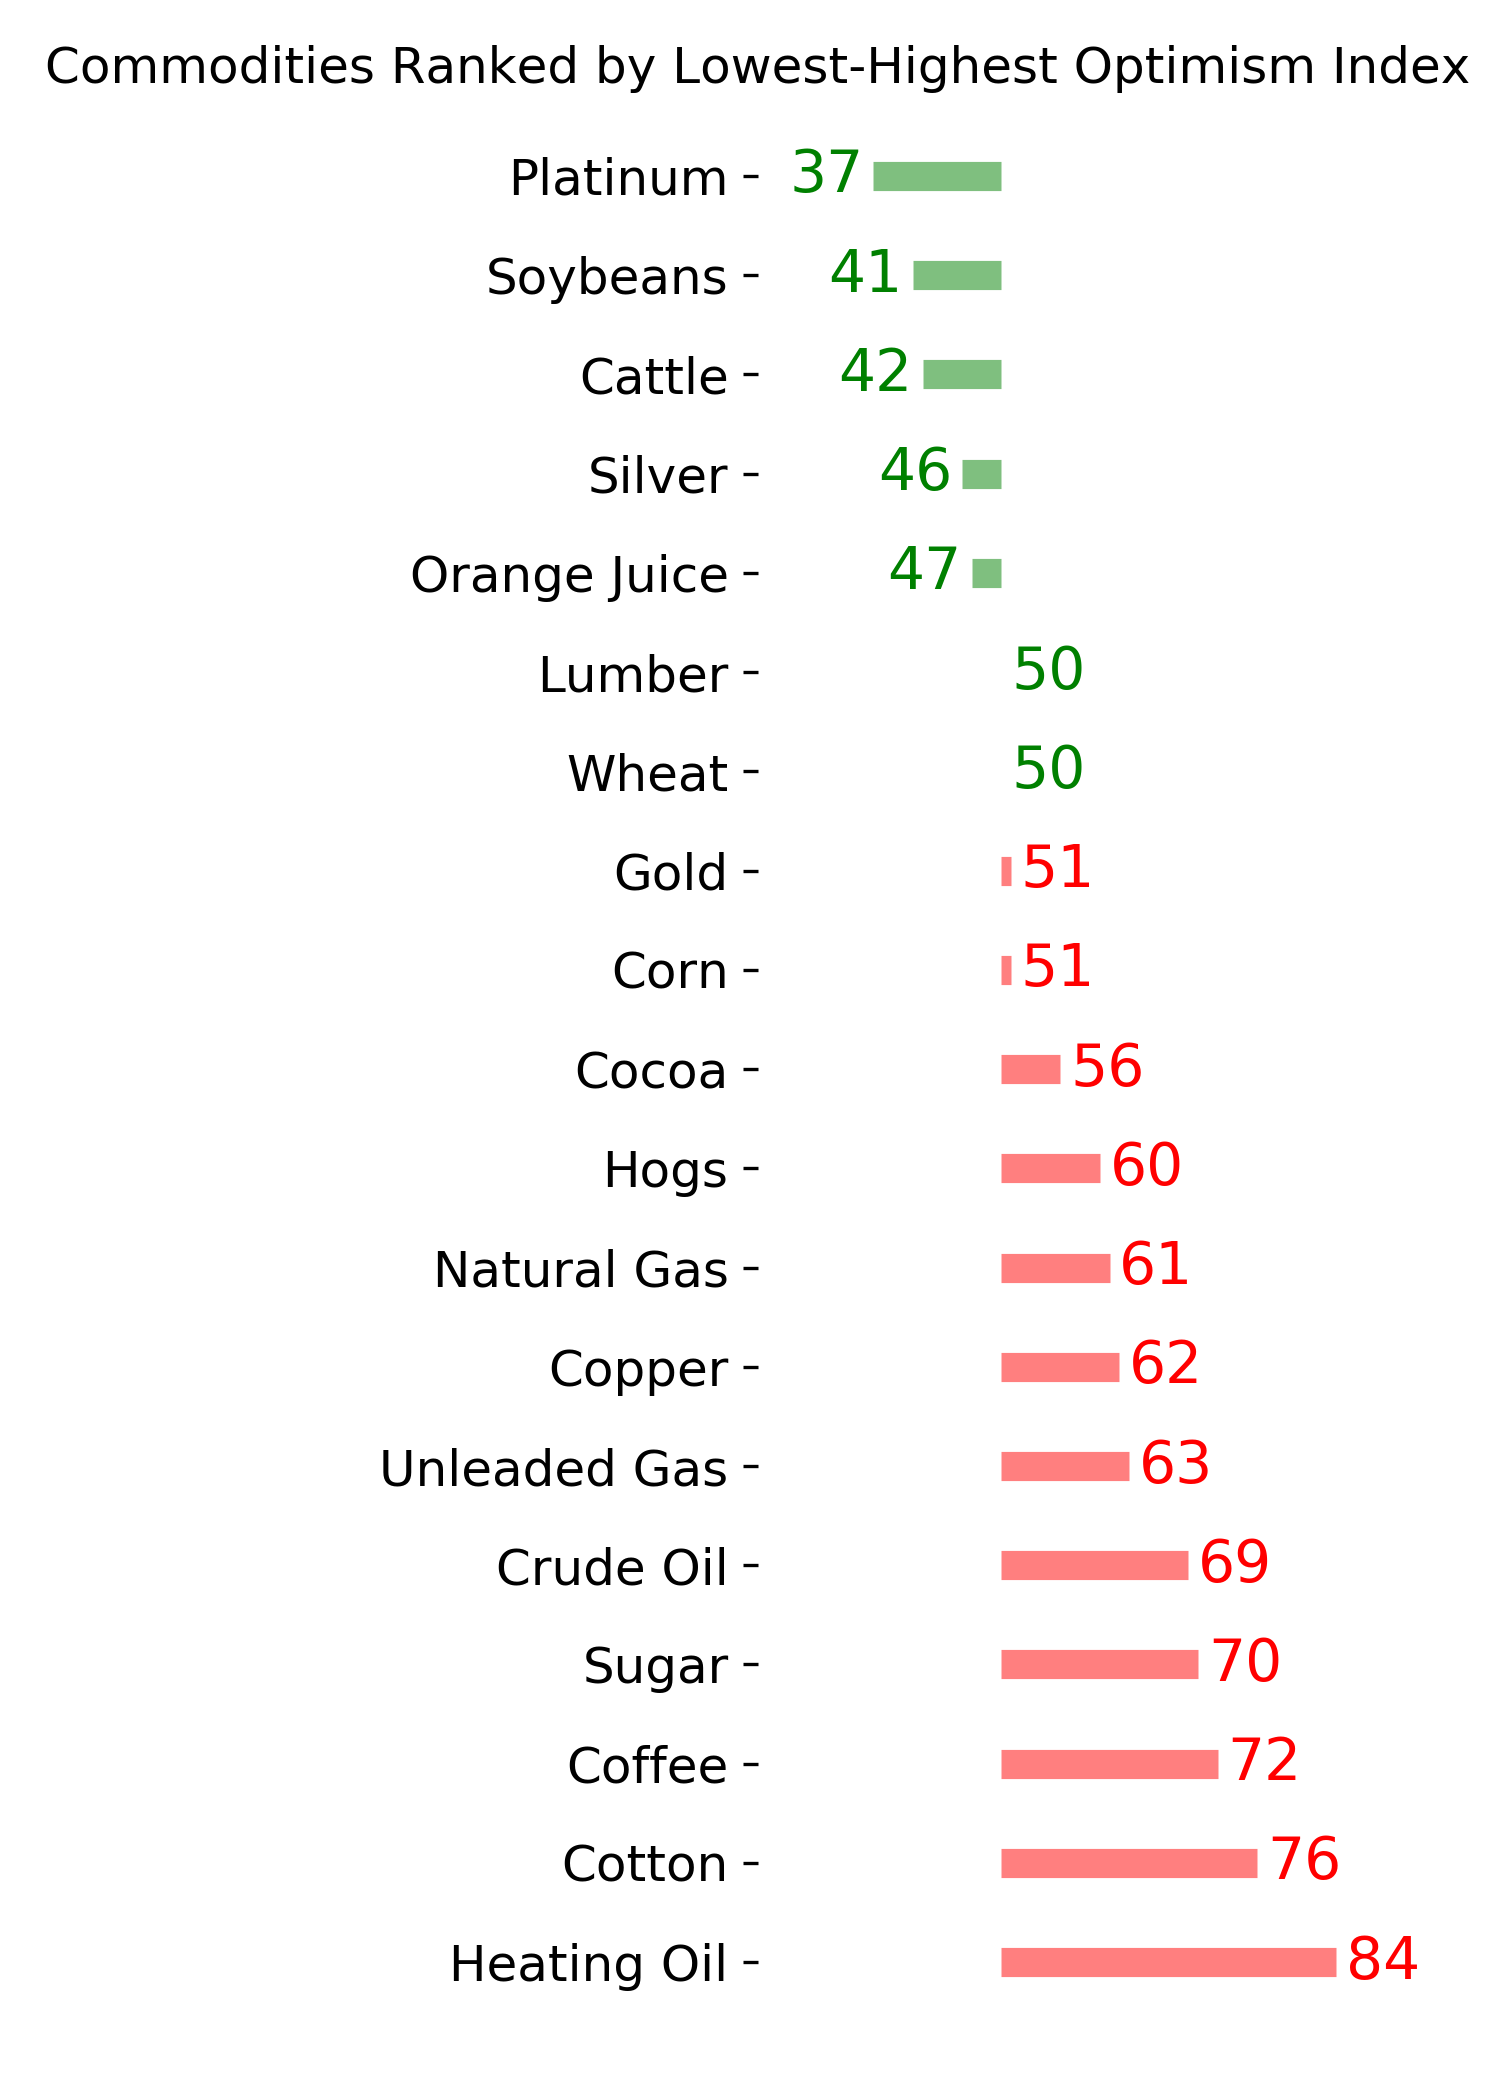
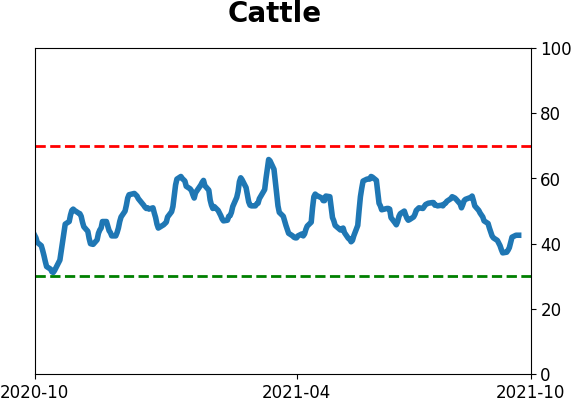
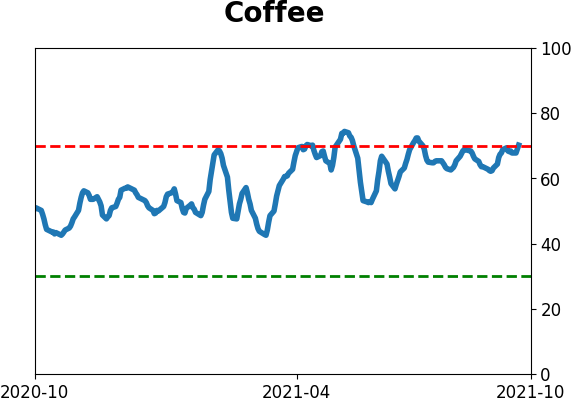
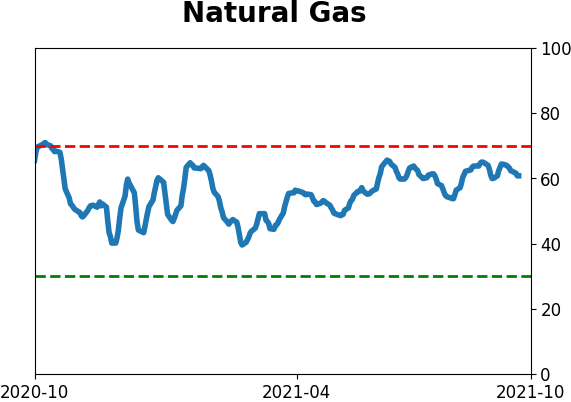
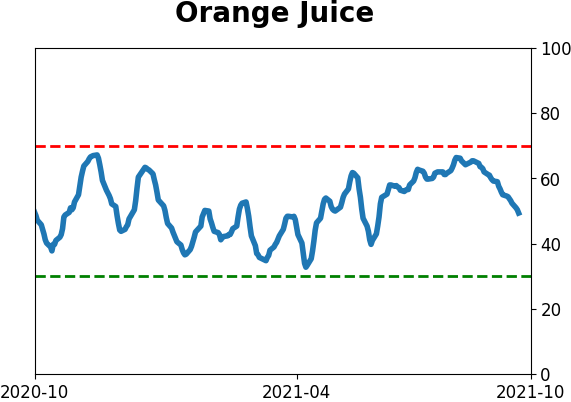
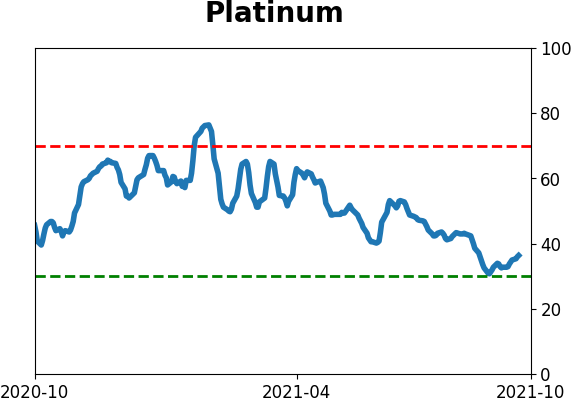
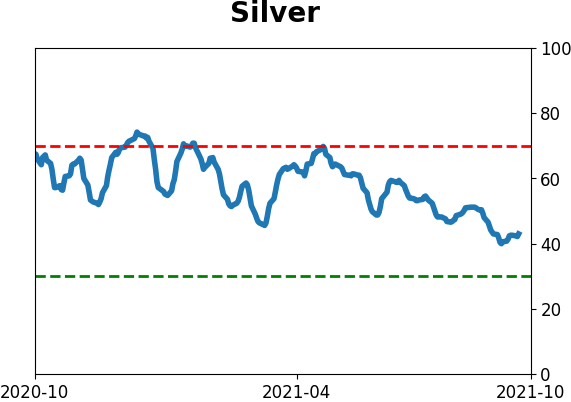
Commodity ETF's - 5-Day Moving Average
|
|