Headlines
|
|
Commodities Continue Rallying Despite Rising Dollar:
Over the past 90 days, the U.S. dollar has jumped more than 4.5%. But commodities have bucked their typical correlation and not only also rallied, but doubled the gain in the dollar. Commodities have tended to have trouble after these correlations break down.
Bottom Line:
STOCKS: Weak buy
The speculative frenzy in February is wrung out. There are some signs of pessimism, but the most compelling data show that buyers consistently tend to return once the first signs of extreme momentum end, especially as we head into a seasonally positive time of year. See the Outlook & Allocations page for more. BONDS: Hold
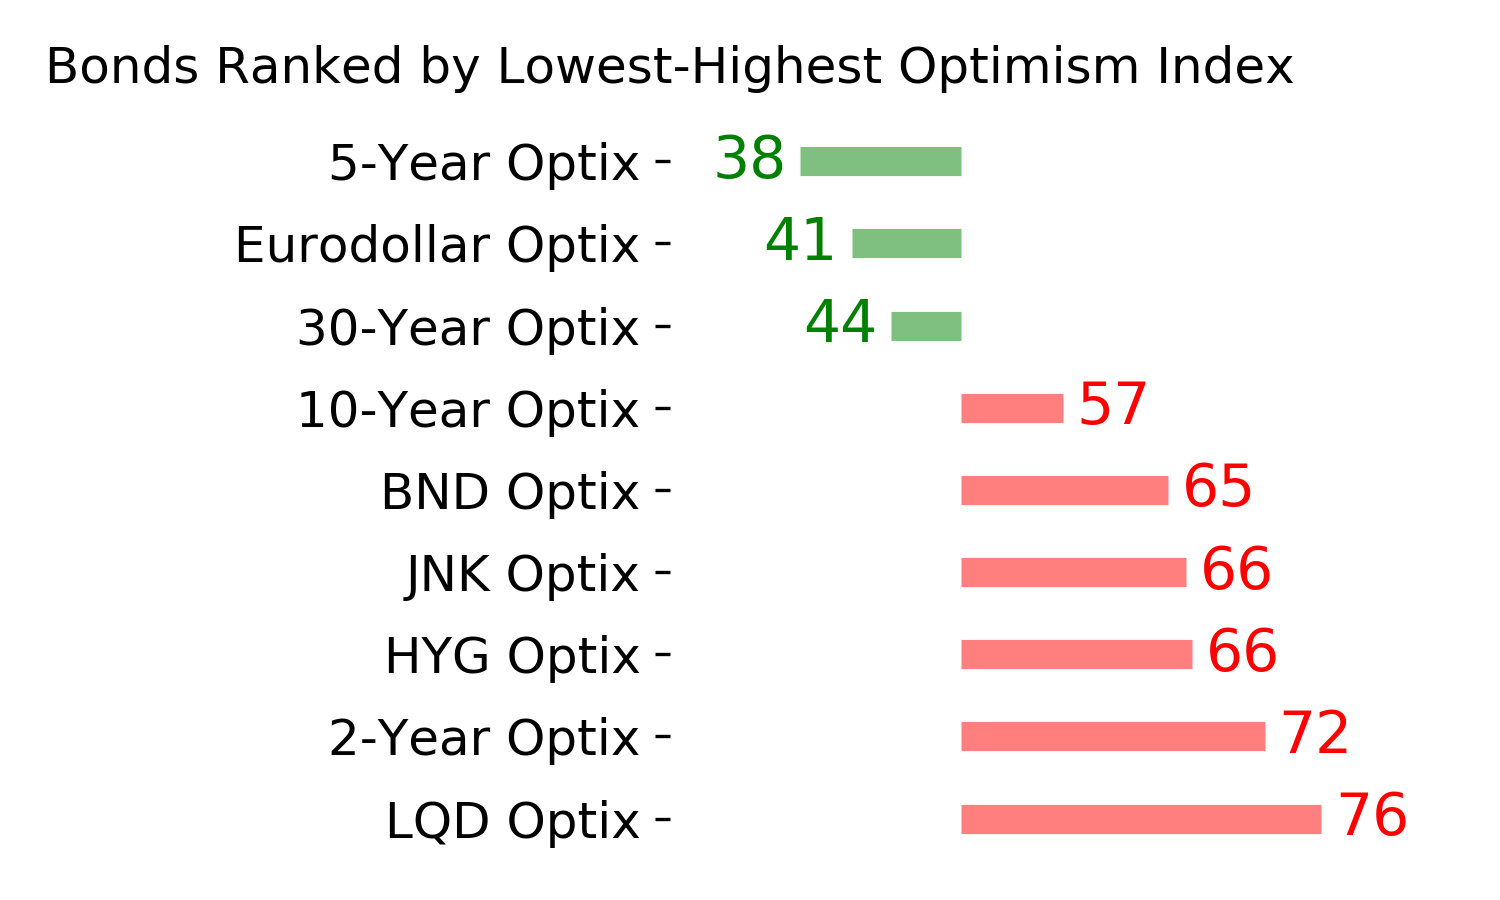
Various parts of the market got hit in March, with the lowest Bond Optimism Index we usually see during healthy environments. Bond prices have modest recovered and there is no edge among the data we follow. GOLD: Hold
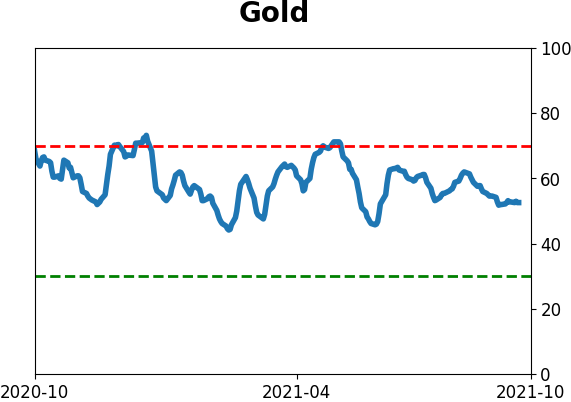
Gold and miners were rejected after trying to recover above their 200-day averages in May. Lately, some medium-term (not long-term) oversold extremes in breadth measures among miners have triggered.
|
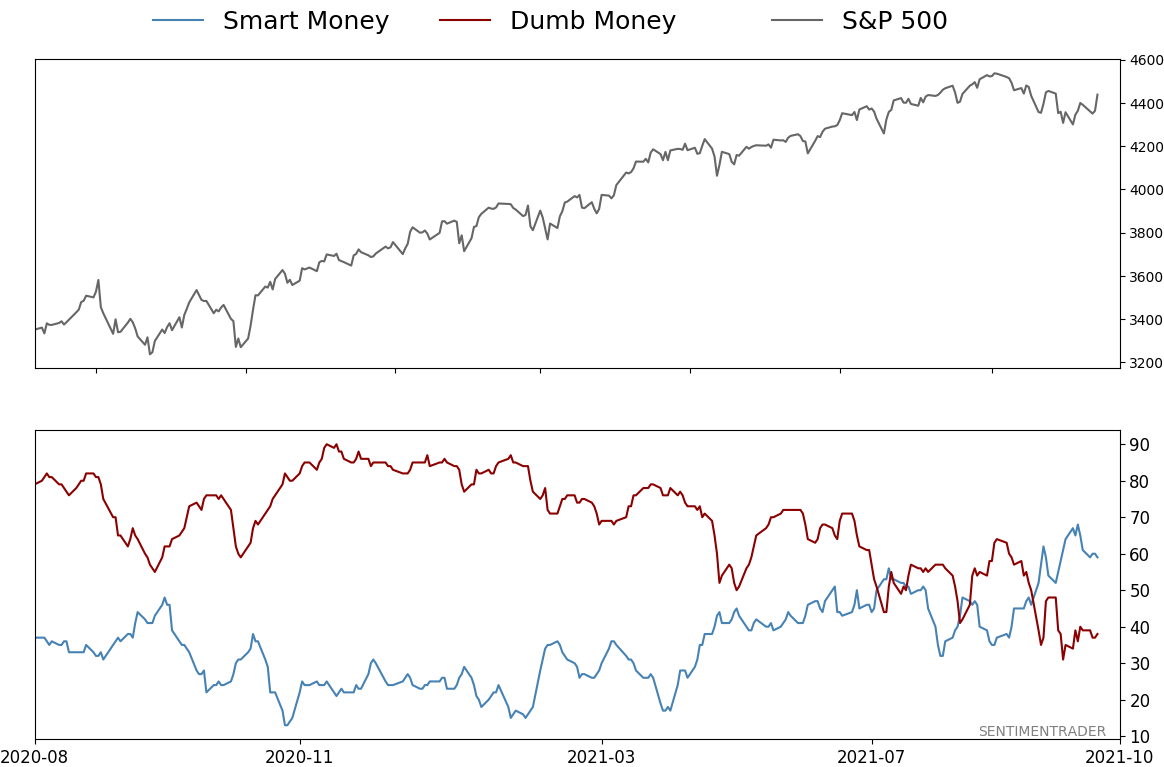
Smart / Dumb Money Confidence
|
Smart Money Confidence: 59%
Dumb Money Confidence: 38%
|
|
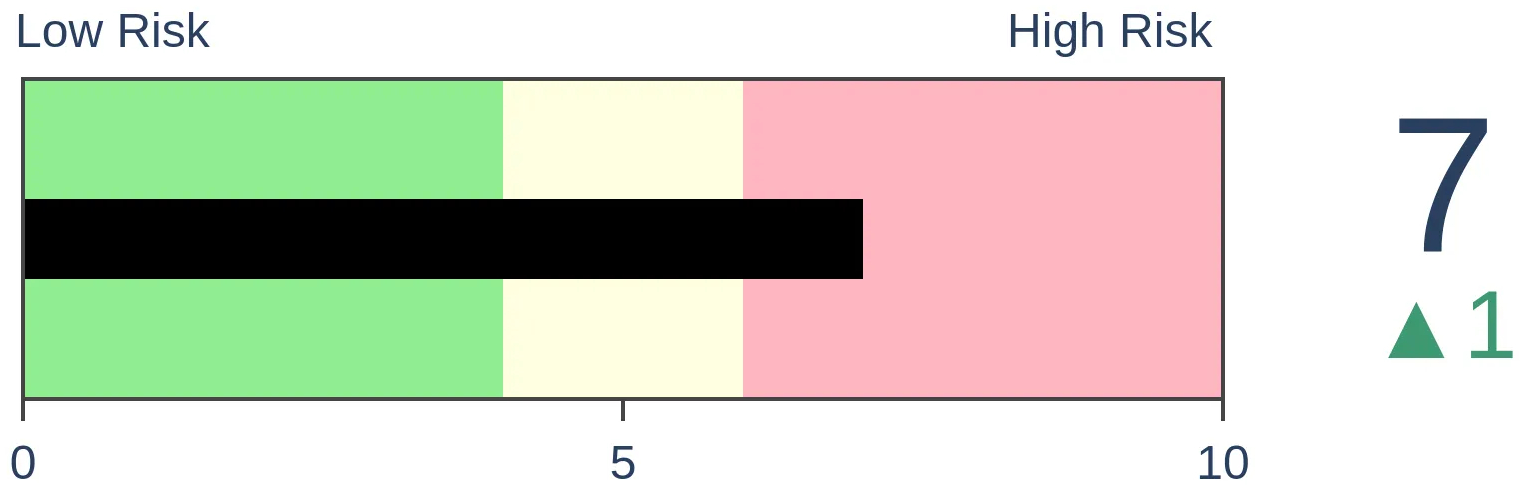
Risk Levels
Stocks Short-Term
|
Stocks Medium-Term
|
|
Bonds
|
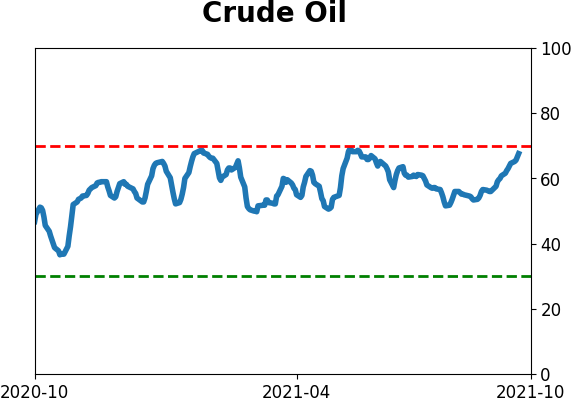
Crude Oil
|
|
Gold

|
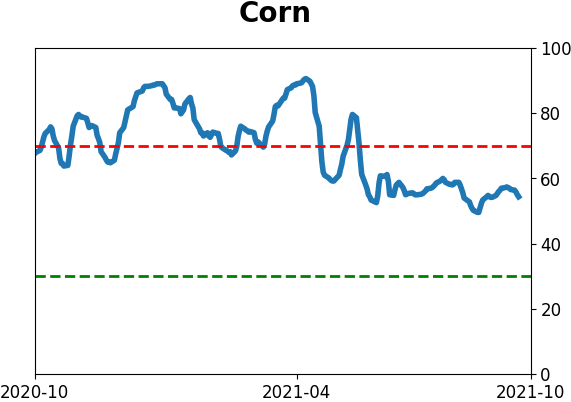
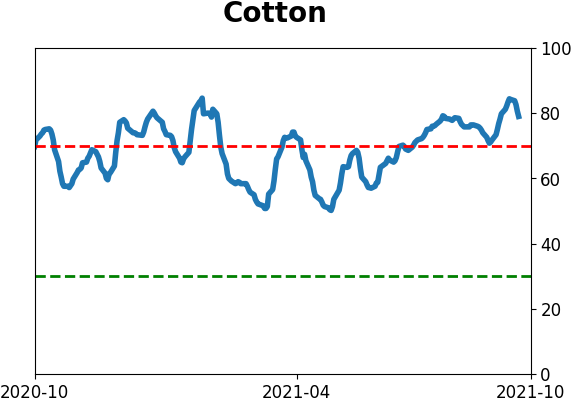
Agriculture

|
|
Research
By Jason Goepfert
BOTTOM LINE
Over the past 90 days, the U.S. dollar has jumped more than 4.5%. But commodities have bucked their typical correlation and not only also rallied, but doubled the gain in the dollar. Commodities have tended to have trouble after these correlations break down.
FORECAST / TIMEFRAME
None
|
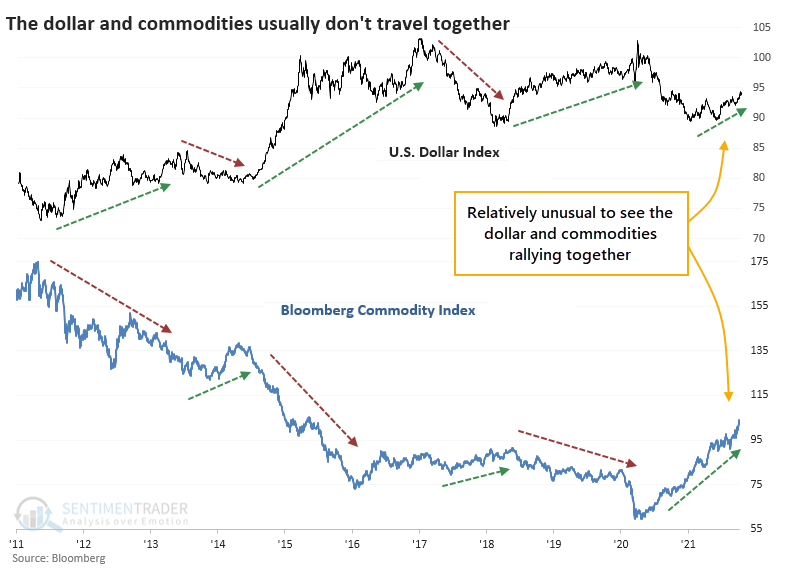
Among all the breakdowns in historical relationships during 2021, one of the most unusual is that commodities continue to scream higher despite a rising U.S. dollar.
That's not the usual relationship between the two assets. Over the past decade, the two have roughly traveled in opposite directions during big trend swings. A rising dollar has typically meant falling commodities, and vice-versa. At least, that was the case until 2021.
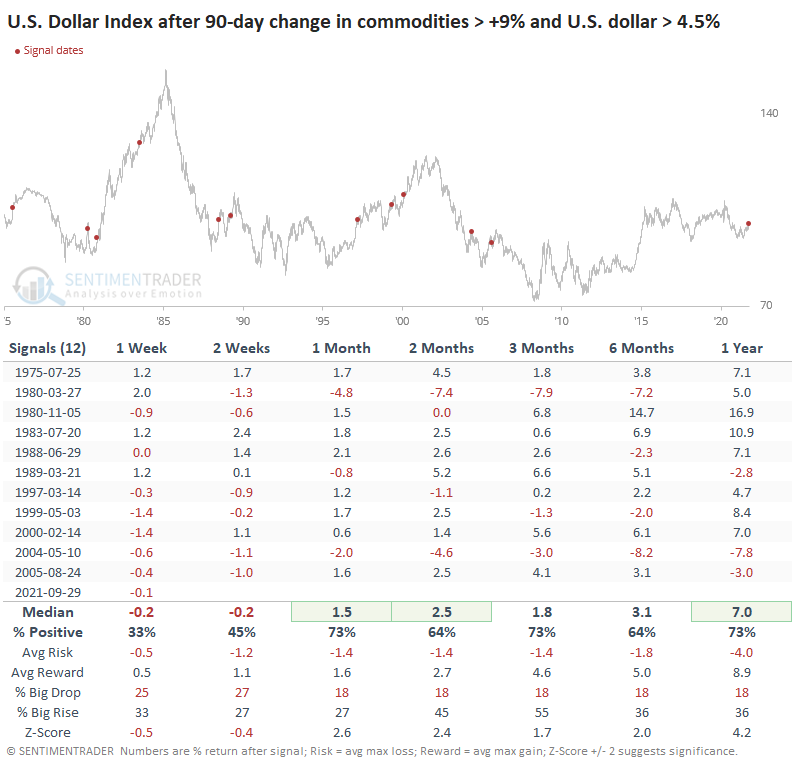
Going back to 1975, there have been a dozen instances when the dollar rallied at least 4.5% over a 90-day window and the Bloomberg Commodity Index more than doubled that return, rallying at least 9%.
Despite a trend that mostly points down over the decades, the dollar tended to rise after these periods, with well-above-average returns.
It was a different sign for commodities. They had a much more difficult time continuing to buck the headwind of a rising dollar.
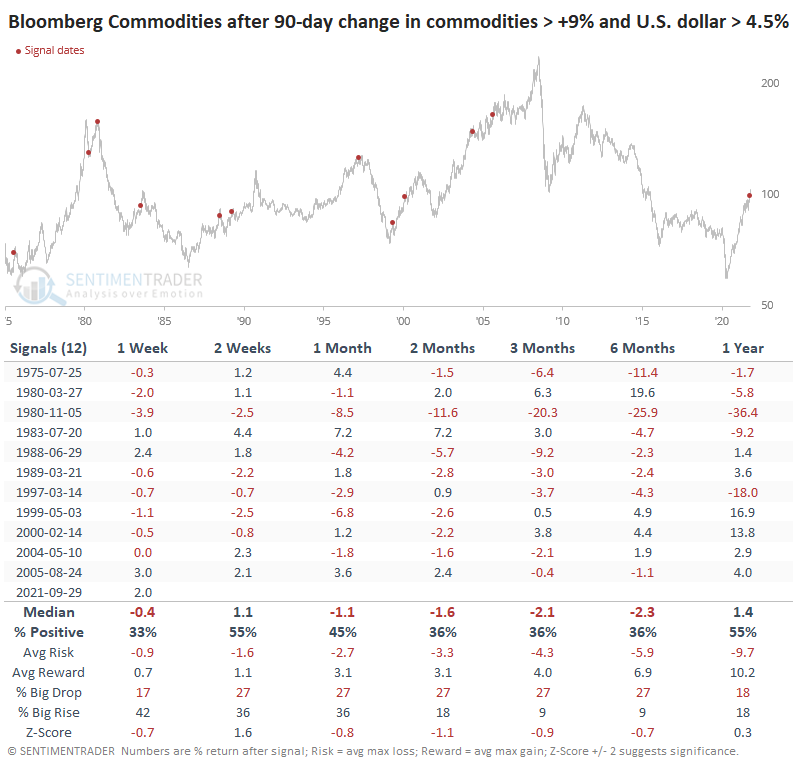
Dean noted earlier this week that commodities have accomplished something they have never done during a bear market, which is to rise more than 50% over a rolling 2-year period. So, there are some signs that this time is different in terms of the commodity environment and if that continues then they should be able to shrug off the rising dollar headwind.
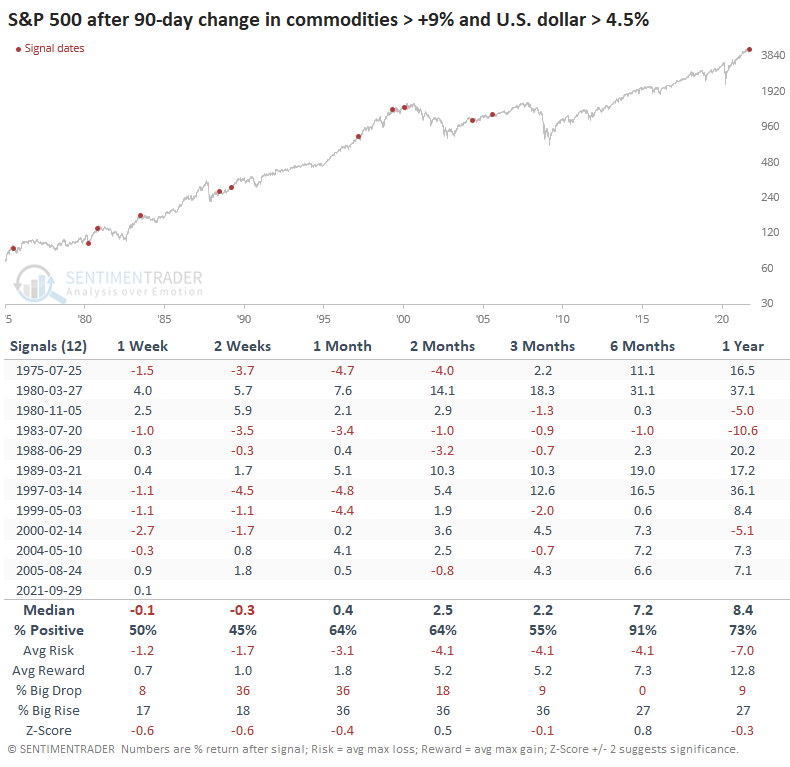
For what it's worth, stocks held up fine after these joint dollar-and-commodity rallies, with the S&P 500 rising over the next six months 91% of the time.
The next couple of weeks should tell us a lot about the trends in the dollar and commodities. Usually, when both have rallied as much as they have lately, how investors behave in the weeks ahead says quite a bit about their appetite for the long-term trends in each. If they keep pushing into the dollar, it will likely mean a much tougher row to hoe for commodities in the months ahead.
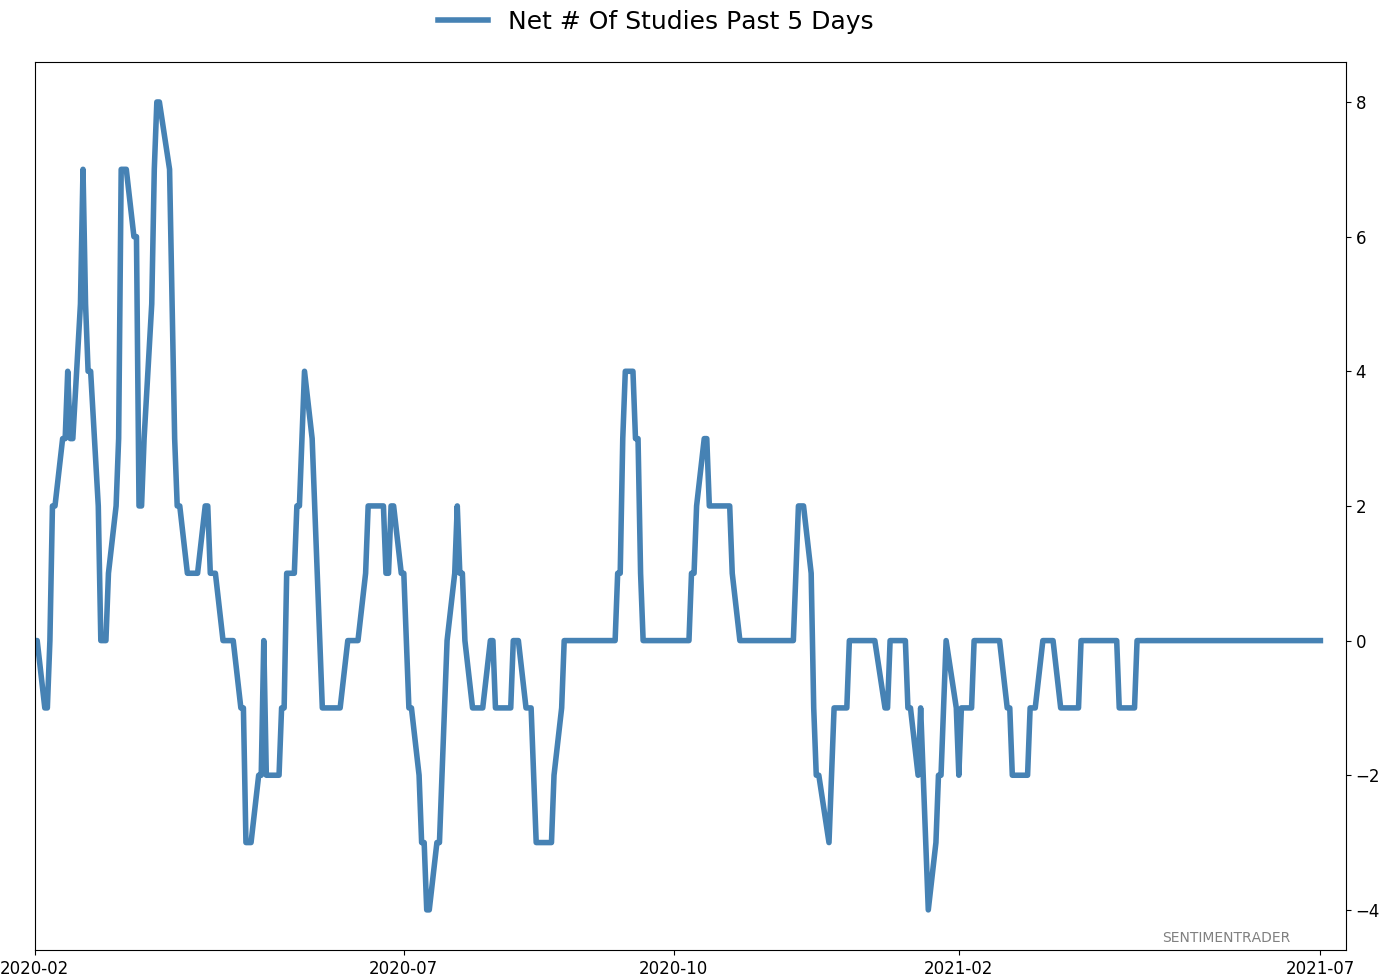
Active Studies
| Time Frame | Bullish | Bearish | | Short-Term | 0 | 0 | | Medium-Term | 7 | 0 | | Long-Term | 11 | 5 |
|
Indicators at Extremes
Portfolio
| Position | Description | Weight % | Added / Reduced | Date | | Stocks | RSP | 10.5 | Added 6.4% | 2021-10-01 | | Bonds | 23.9% BND, 6.9% SCHP | 31.5 | Reduced 7.1% | 2021-05-19 | | Commodities | GCC | 2.6 | Reduced 2.1%
| 2020-09-04 | | Precious Metals | GDX | 4.2 | Reduced 4.2% | 2021-05-19 | | Special Situations | 9.8% KWEB, 4.7% XLE, 2.9% PSCE | 17.3 | Added 9.78% | 2021-10-01 | | Cash | | 34.0 | | |
|
Updates (Changes made today are underlined)
Much of our momentum and trend work has remained positive for several months, with some scattered exceptions. Almost all sentiment-related work has shown a poor risk/reward ratio for stocks, especially as speculation drove to record highs in exuberance in February. Much of that has worn off, and most of our models are back toward neutral levels. There isn't much to be excited about here. The same goes for bonds and even gold. Gold has been performing well lately and is back above long-term trend lines. The issue is that it has a poor record of holding onto gains when attempting a long-term trend change like this, so we'll take a wait-and-see approach. Momentum has ebbed quickly in recent weeks, and nearing oversold levels in some indicators. This can be a dangerous area, with a lot of short-term volatility, but we'd be more inclined to add medium- to long-term exposure rather than sell on much more of a decline, thanks to already rock-bottom exposure. Other areas look more attractive, including some overseas markets. RETURN YTD: 11.0% 2020: 8.1%, 2019: 12.6%, 2018: 0.6%, 2017: 3.8%, 2016: 17.1%, 2015: 9.2%, 2014: 14.5%, 2013: 2.2%, 2012: 10.8%, 2011: 16.5%, 2010: 15.3%, 2009: 23.9%, 2008: 16.2%, 2007: 7.8%
|
|
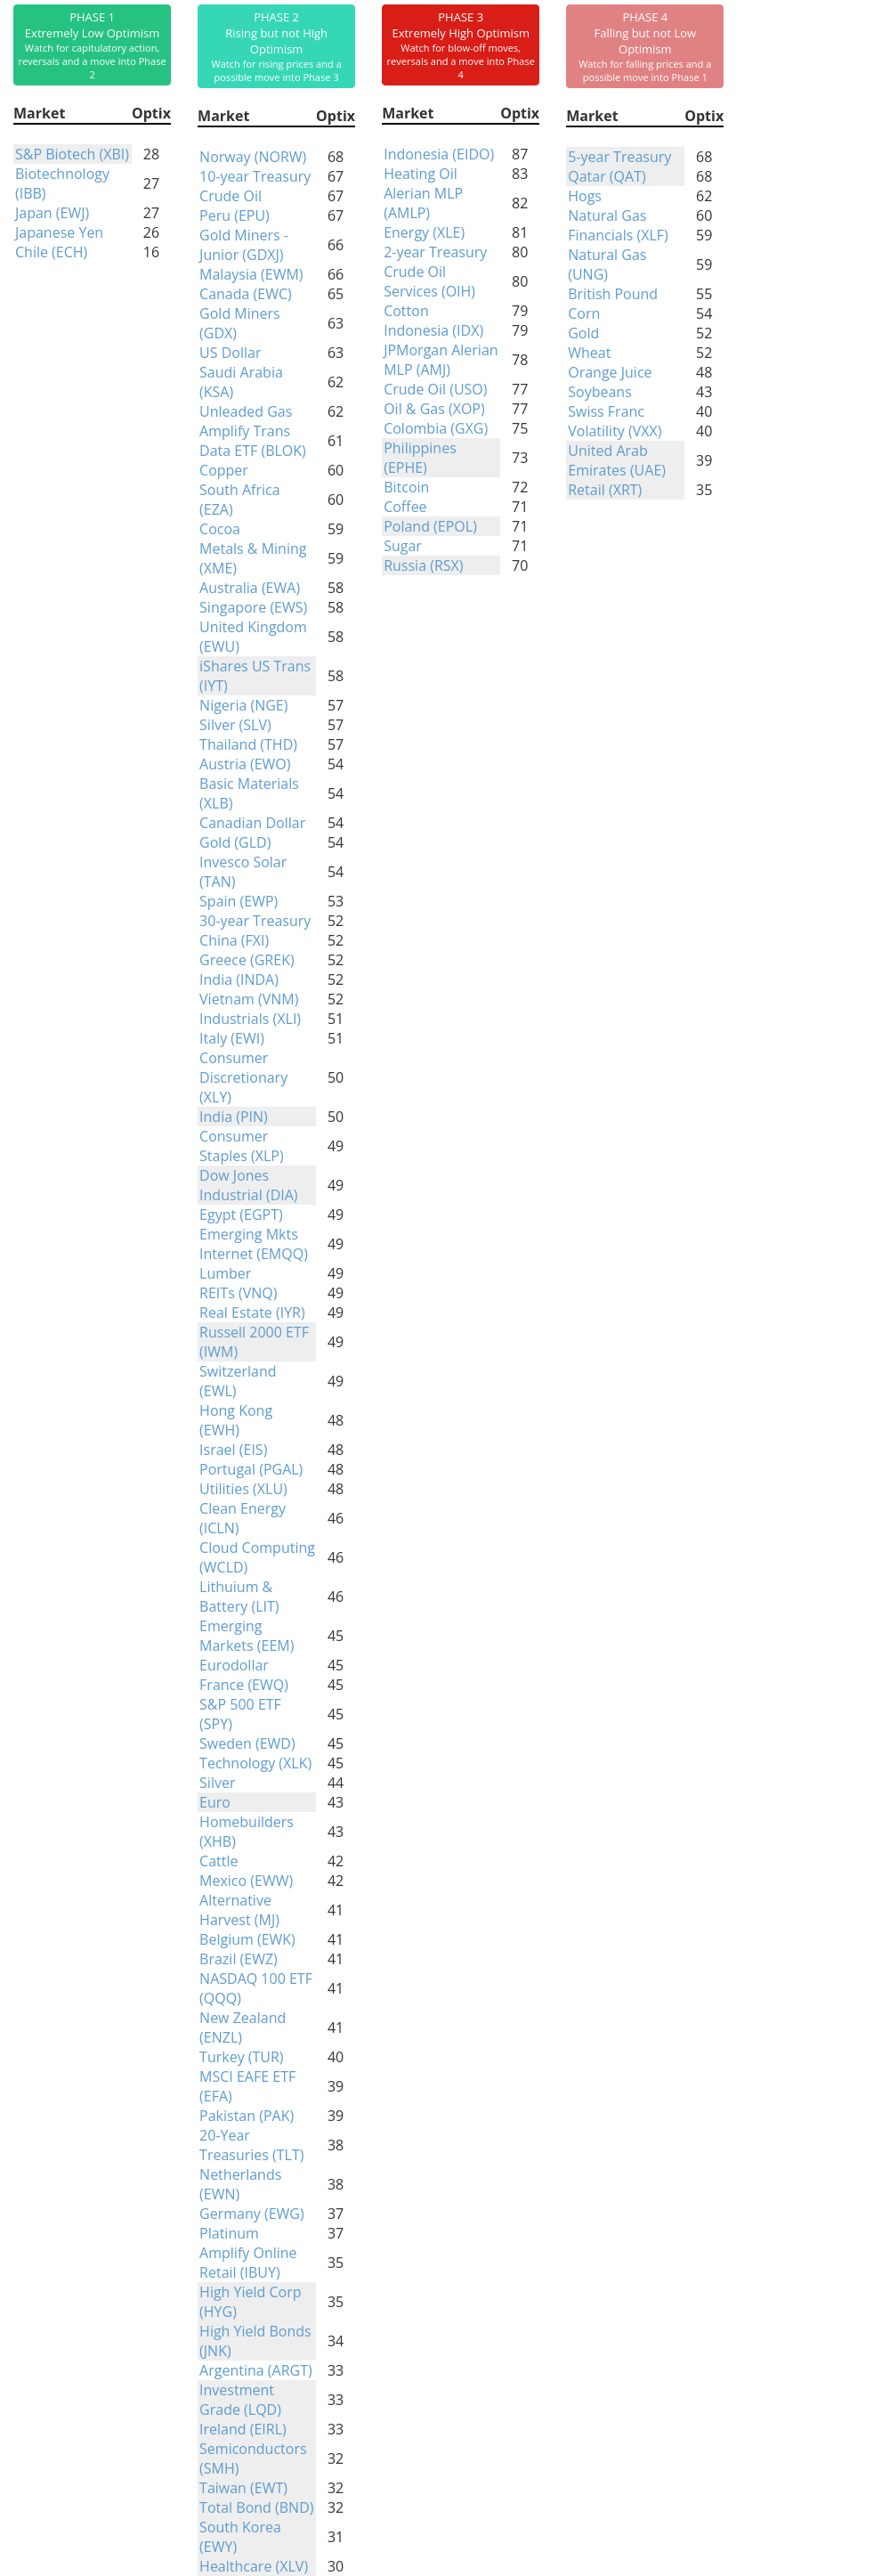
Phase Table
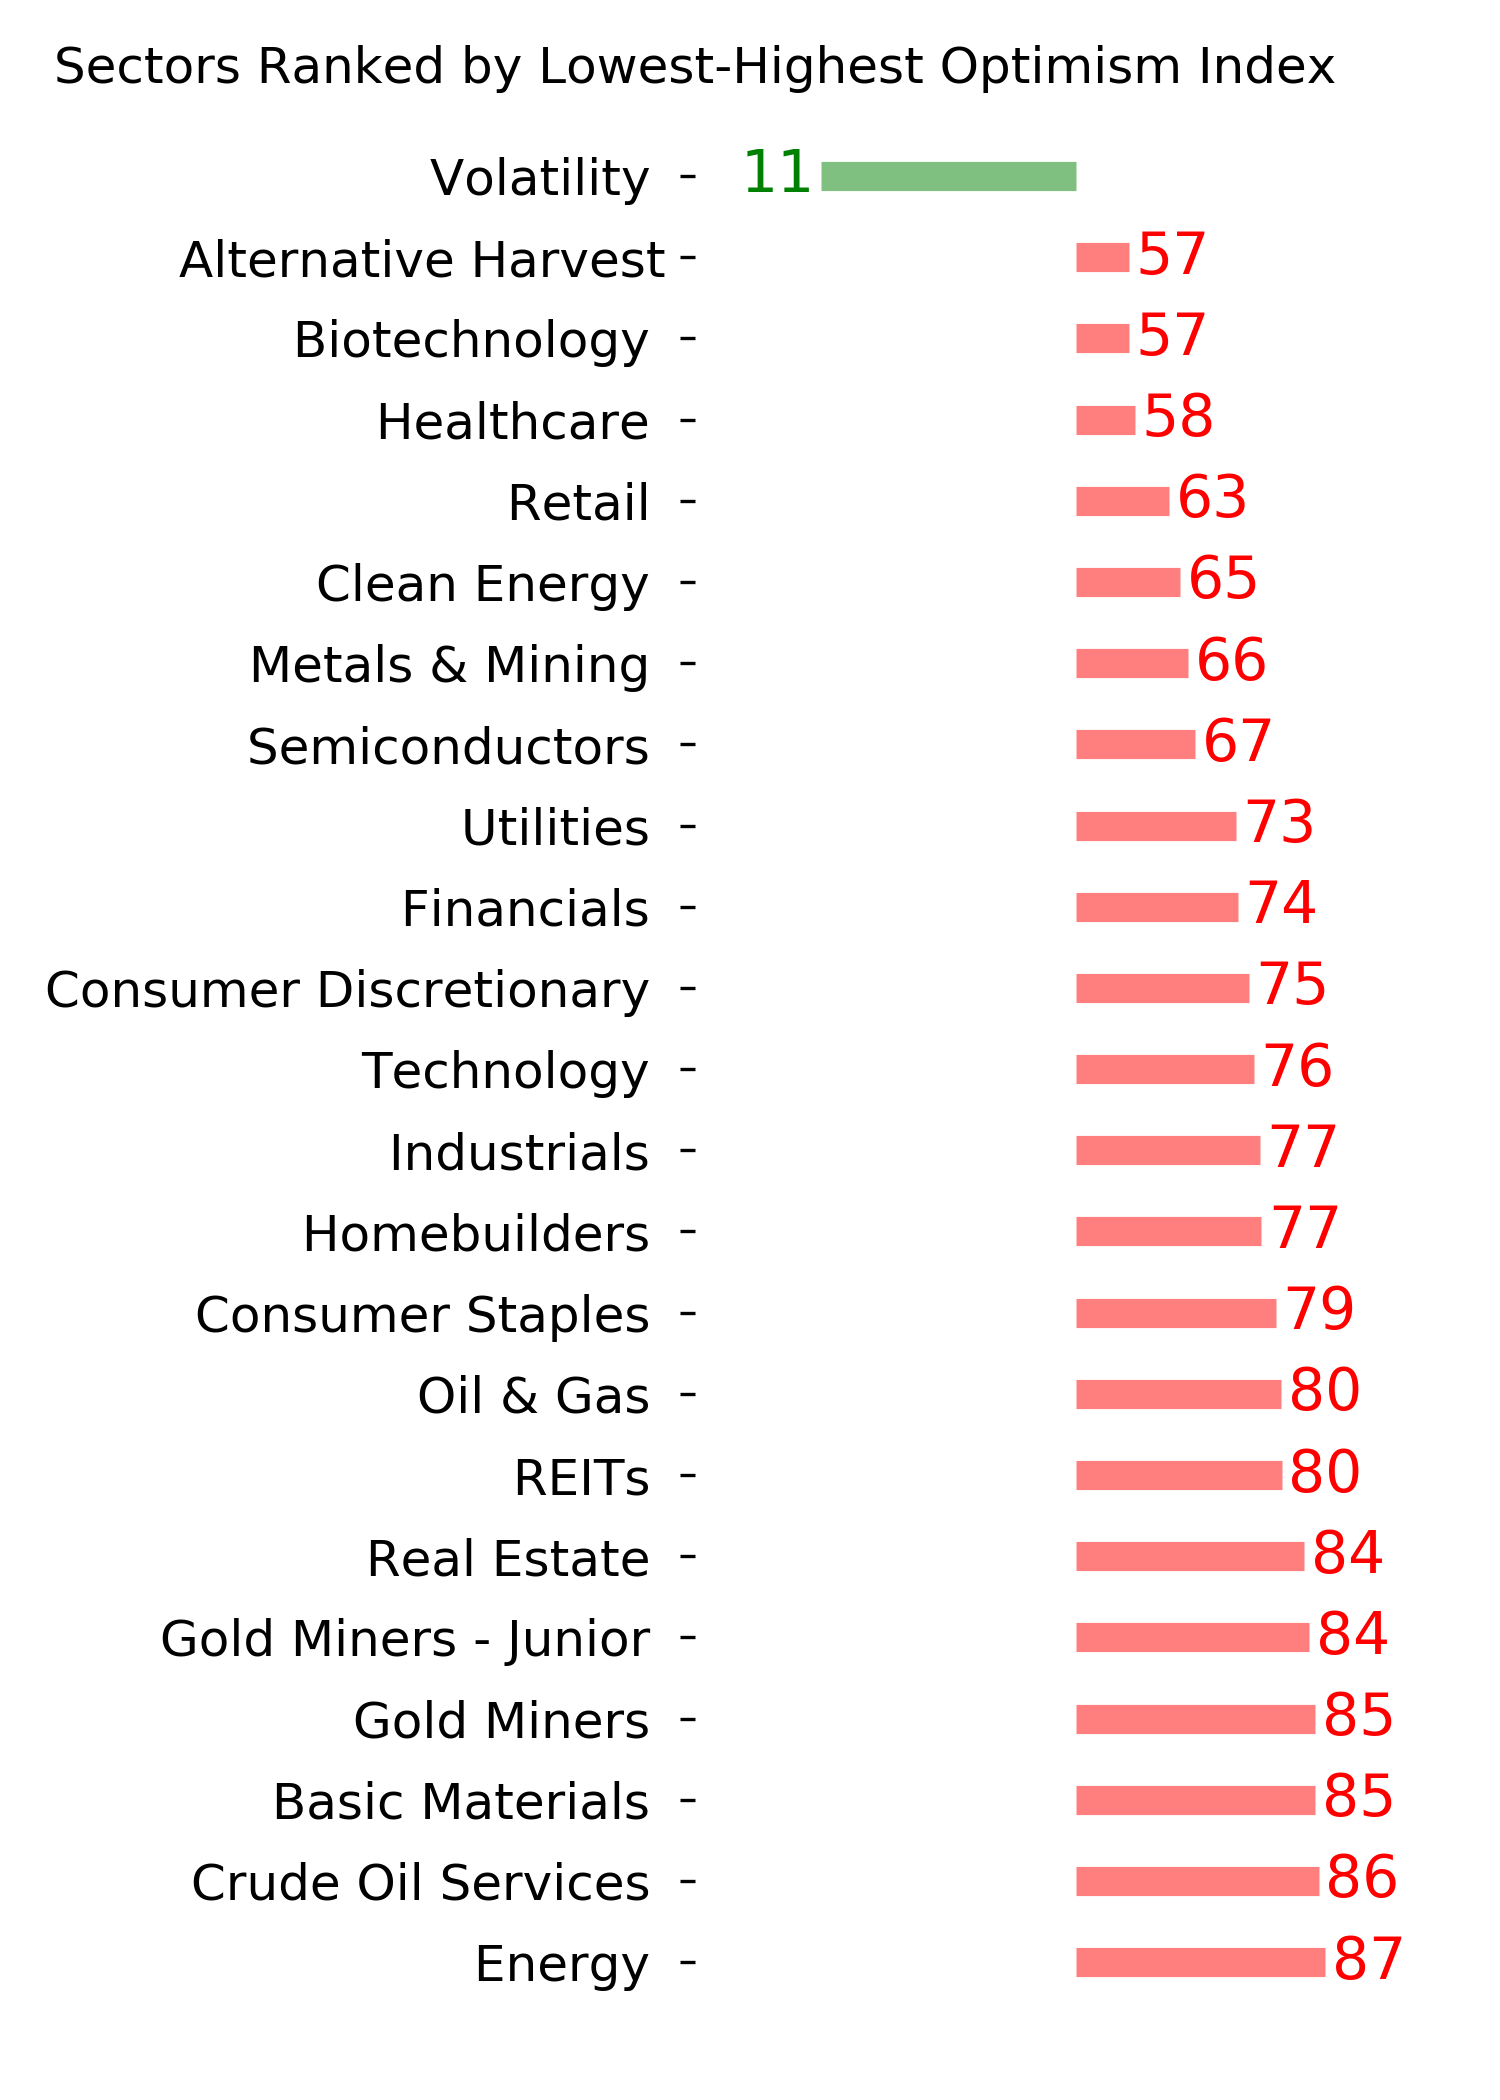
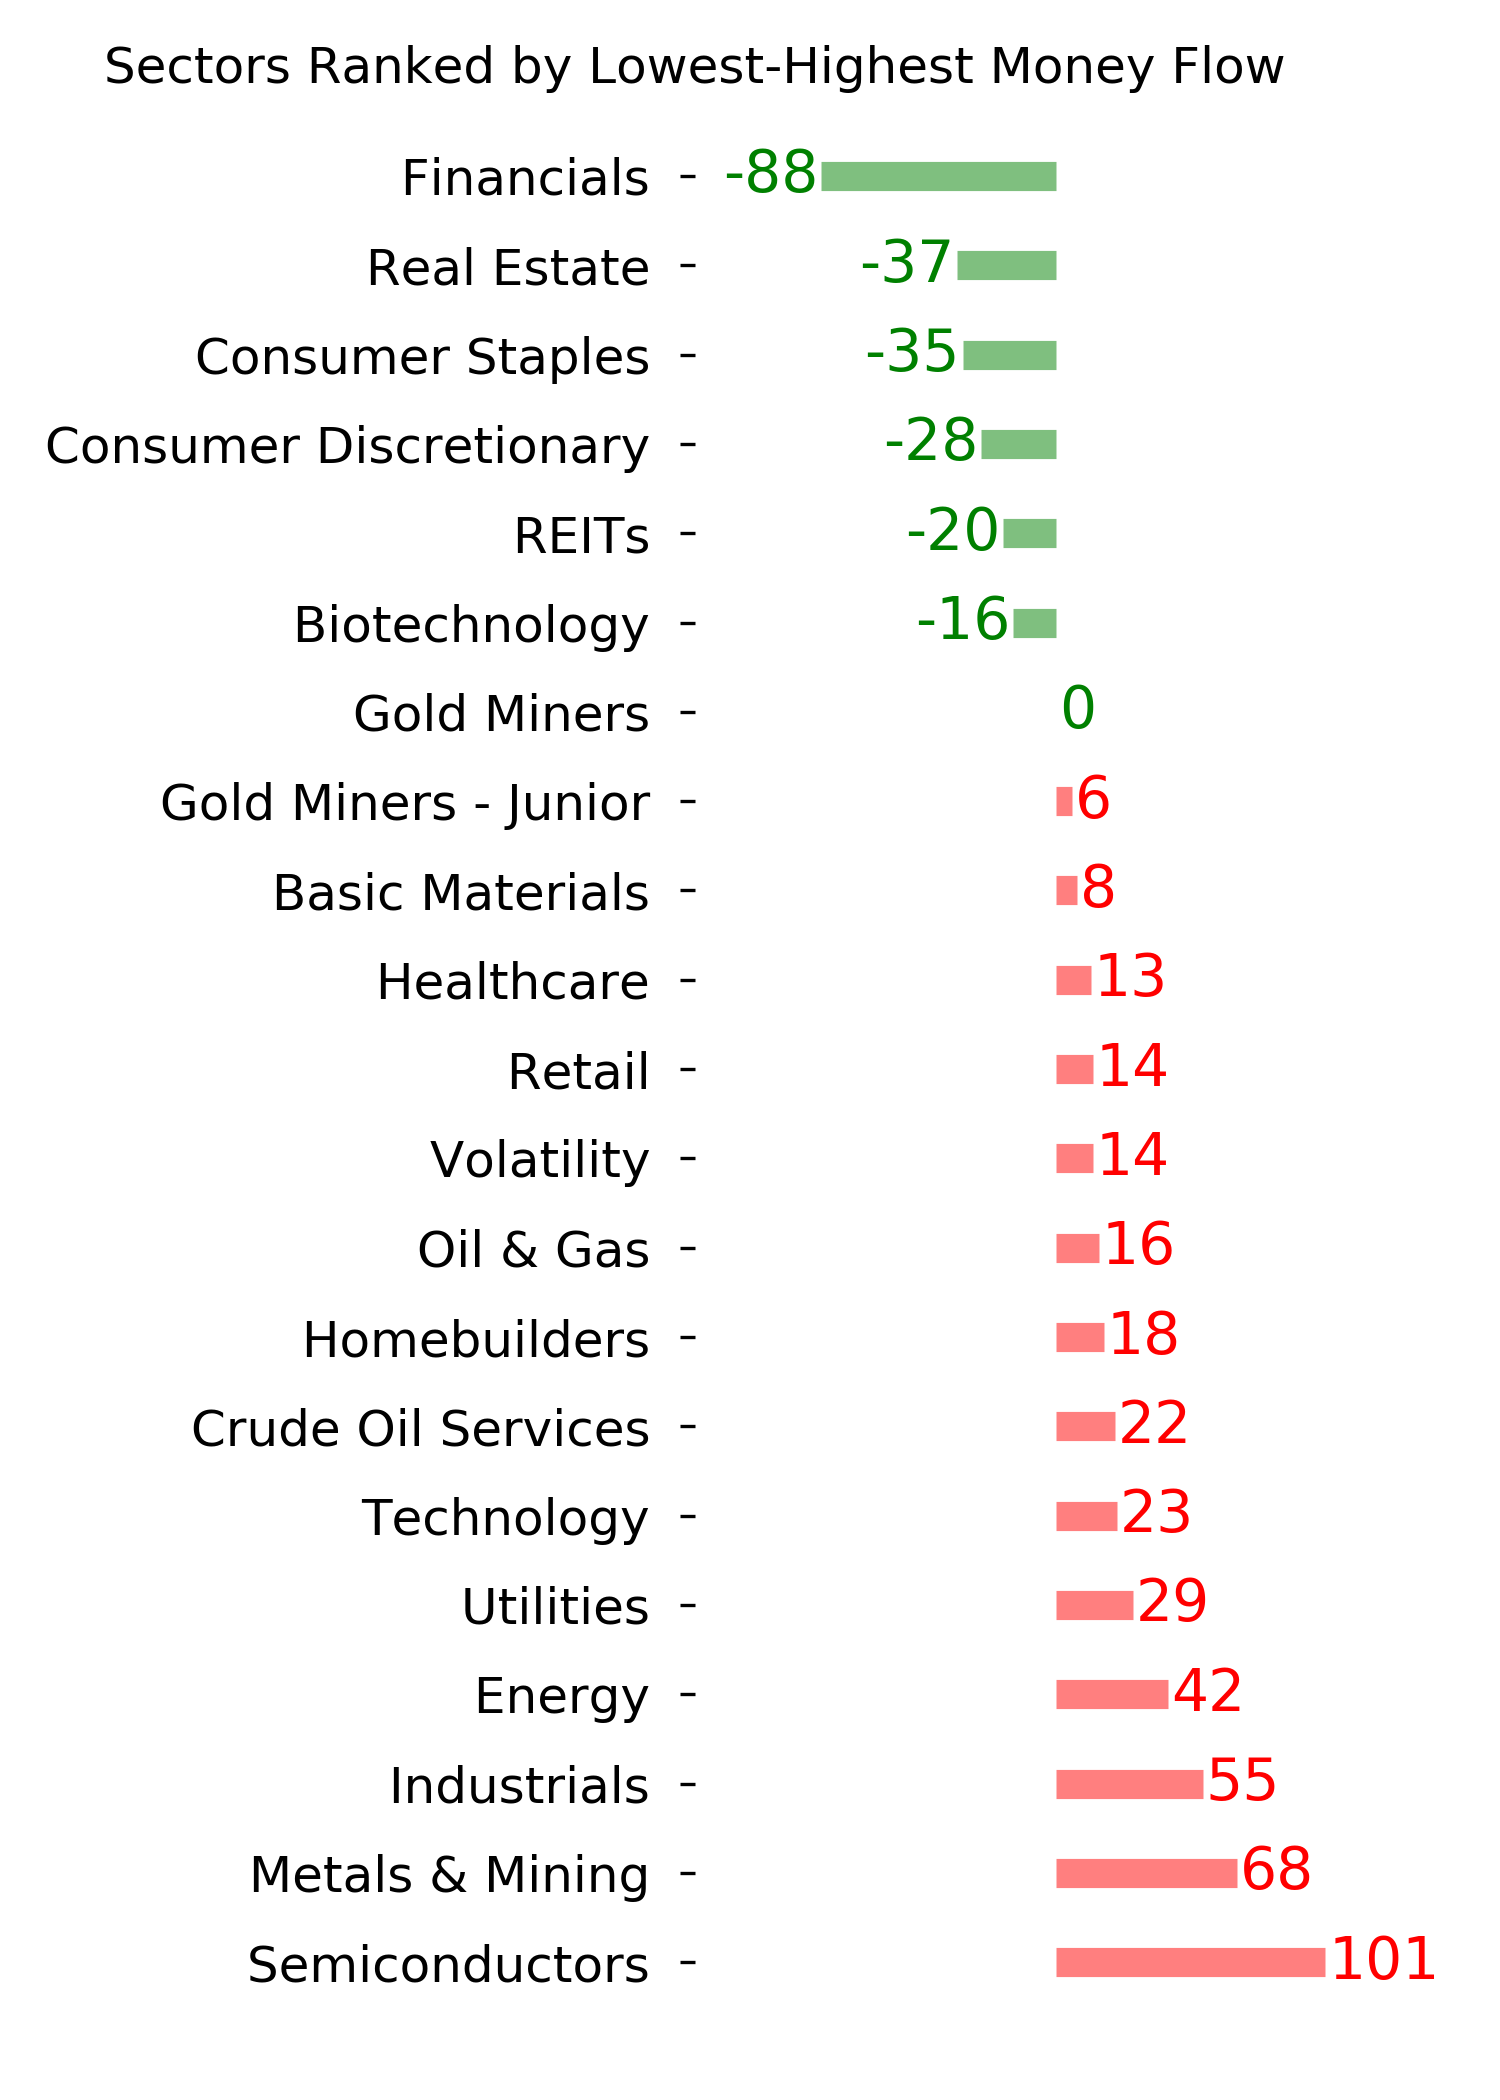
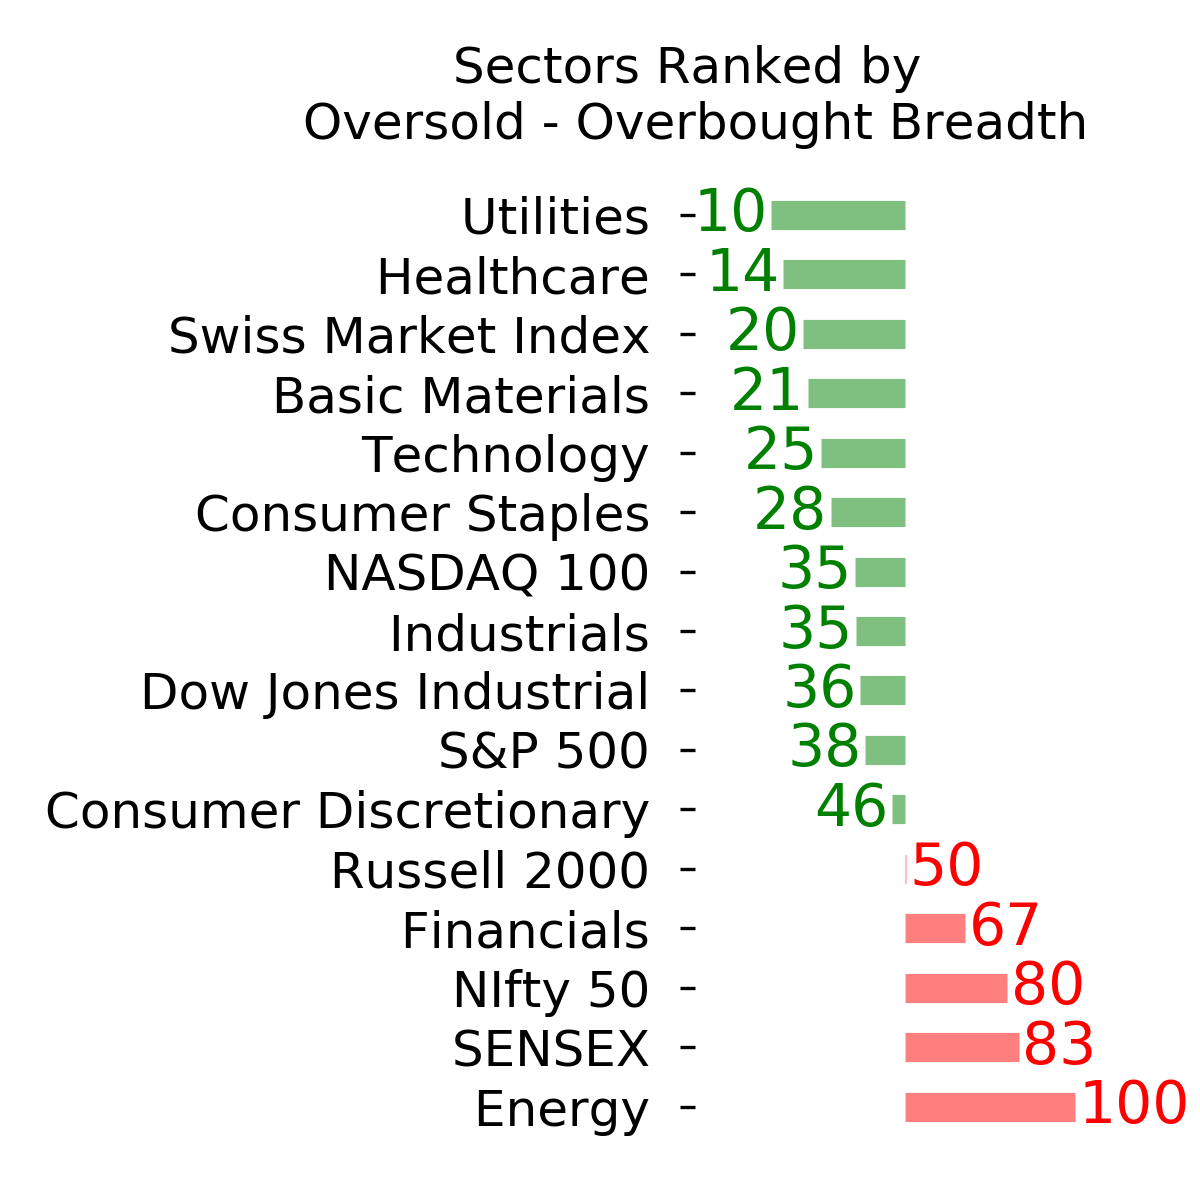
Ranks
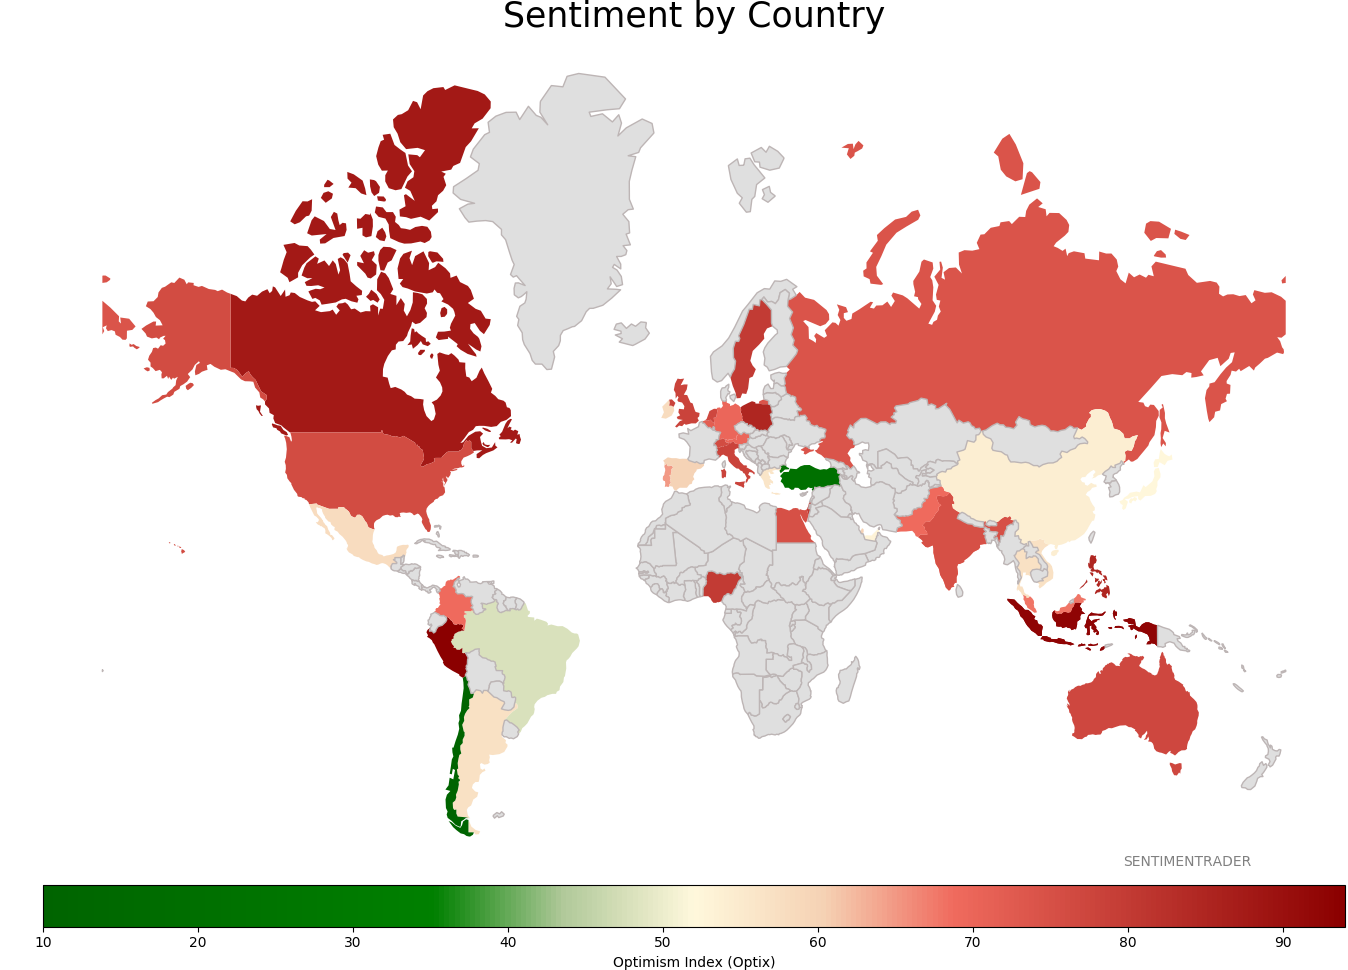
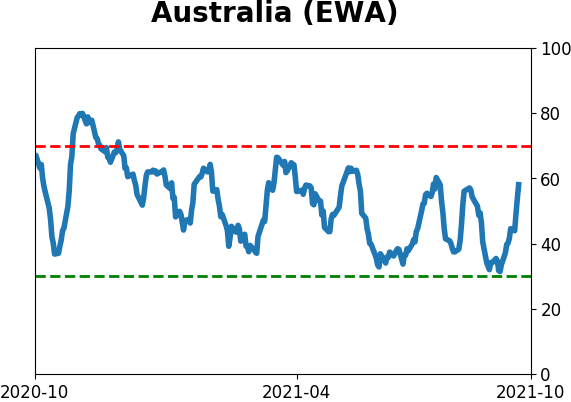
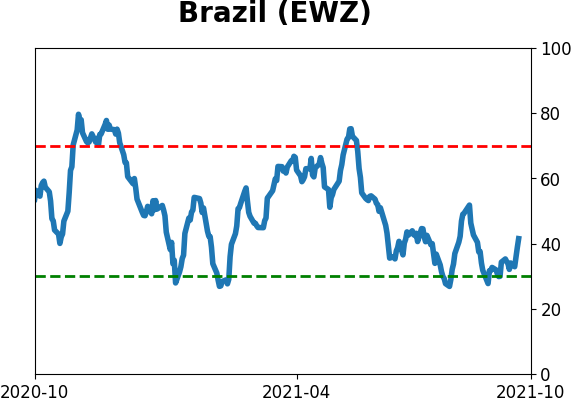
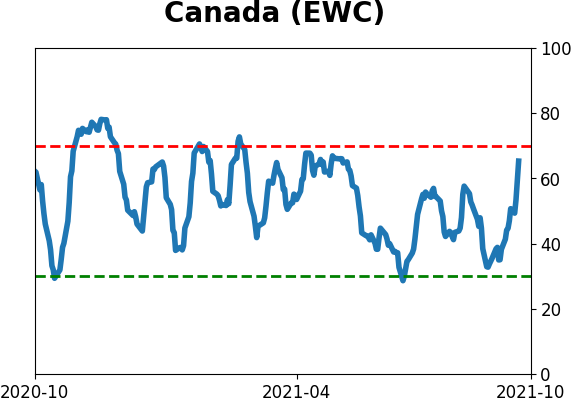
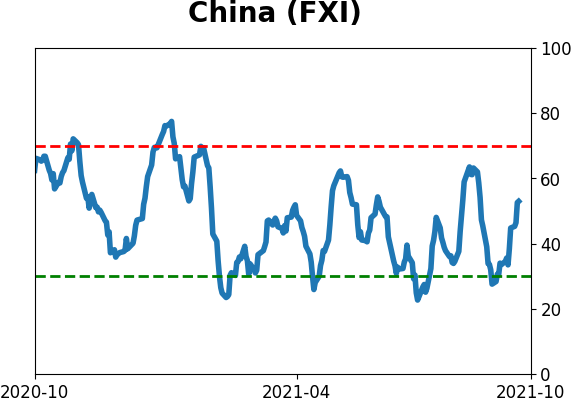
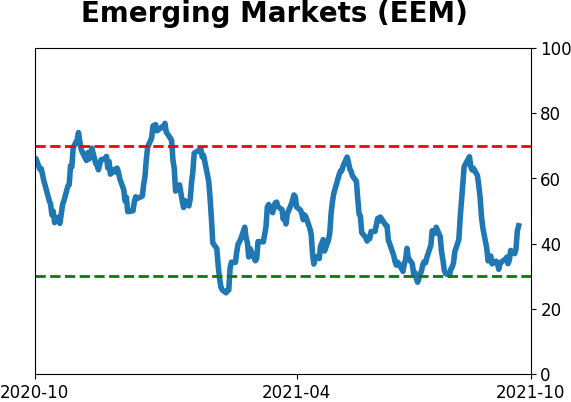
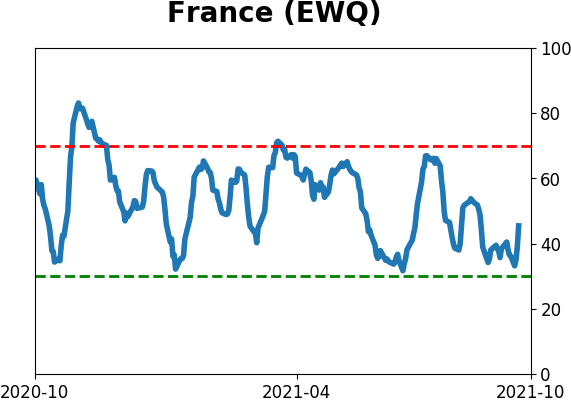
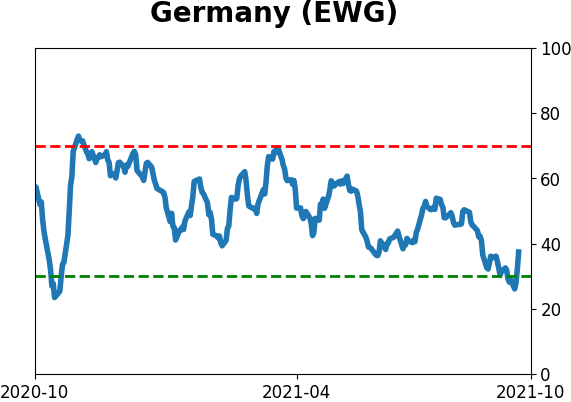
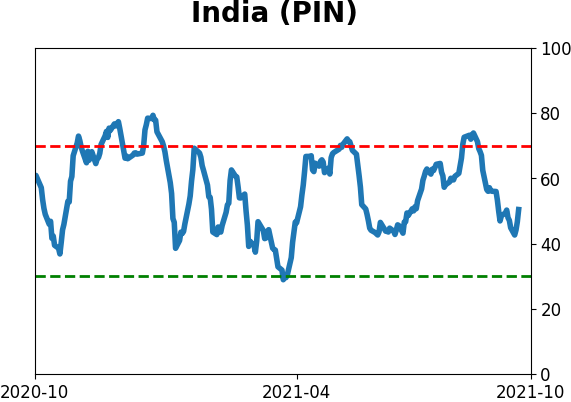
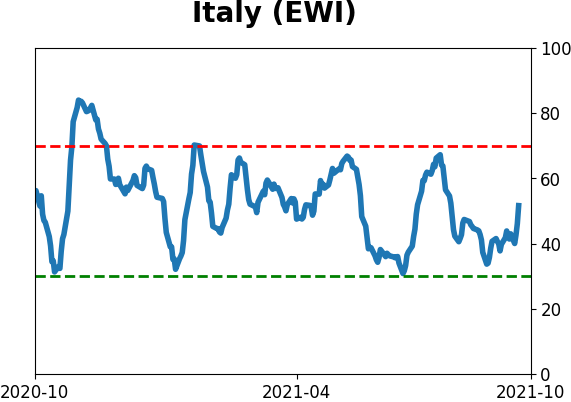
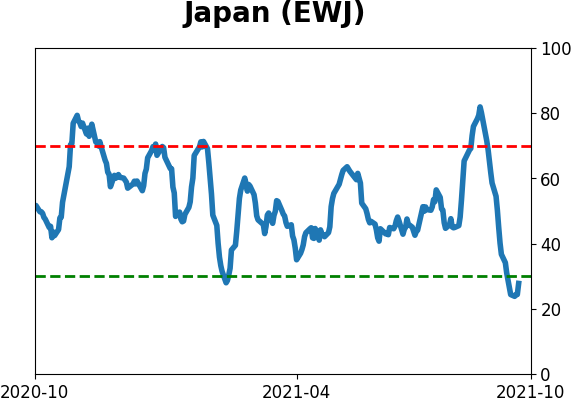
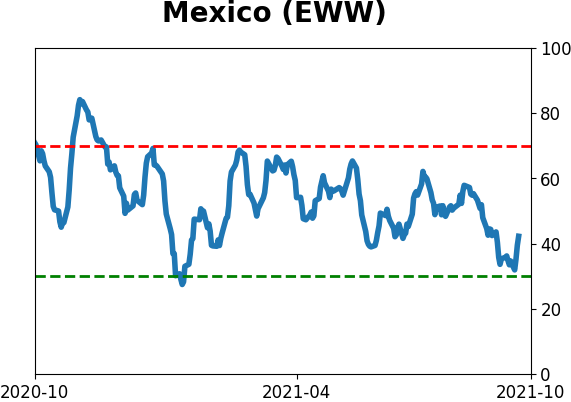
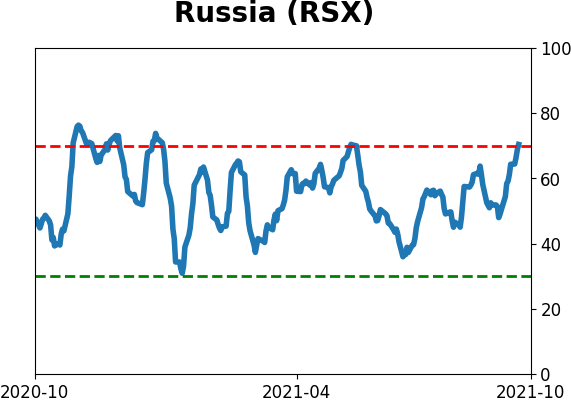
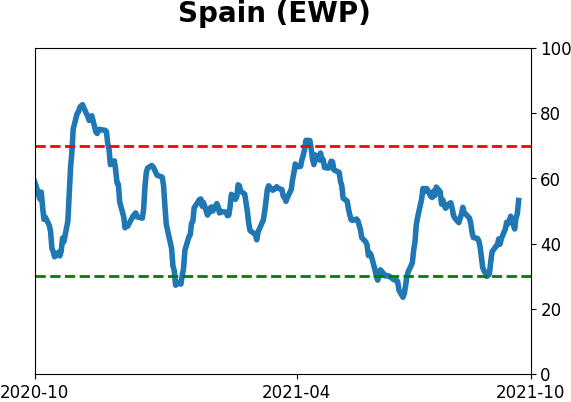
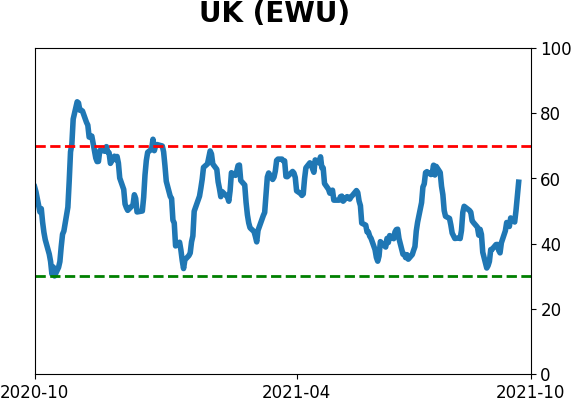
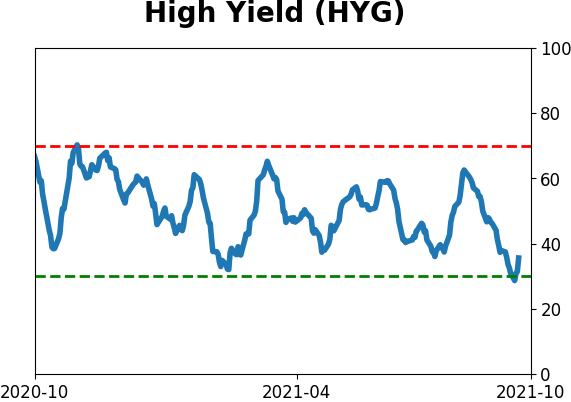
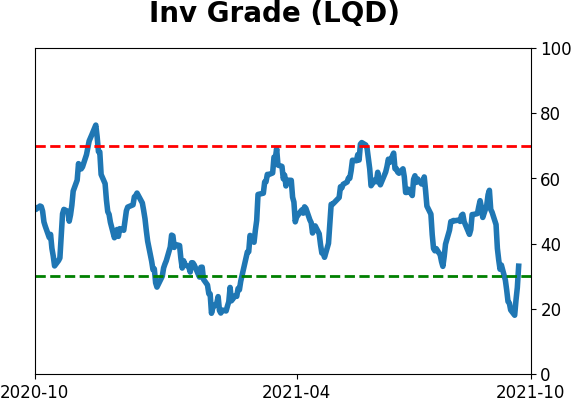
Sentiment Around The World
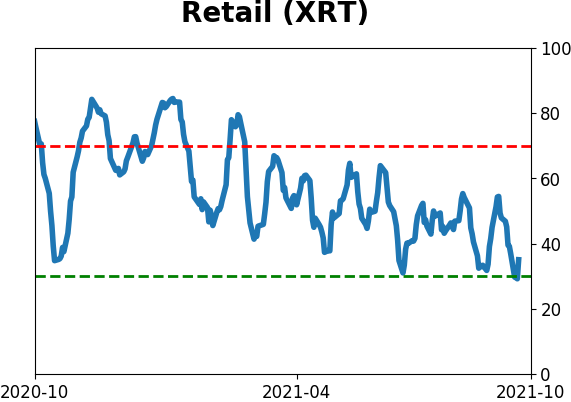
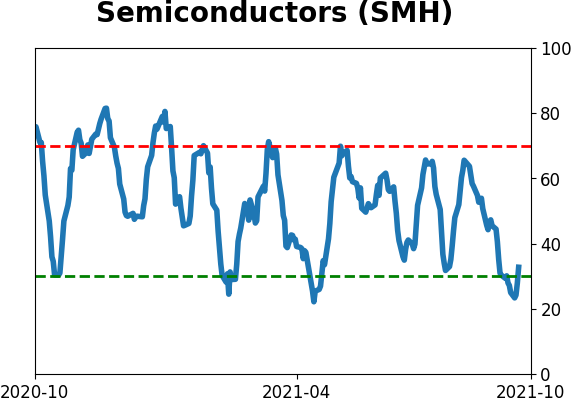
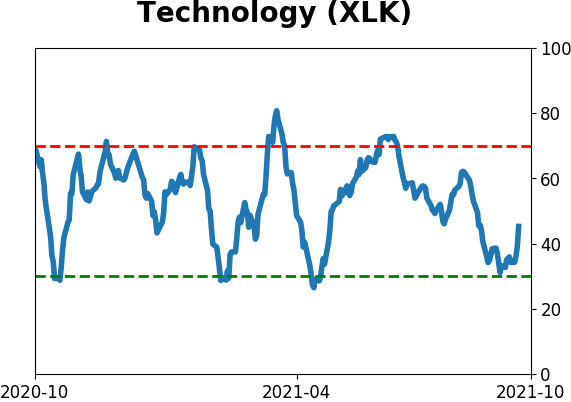
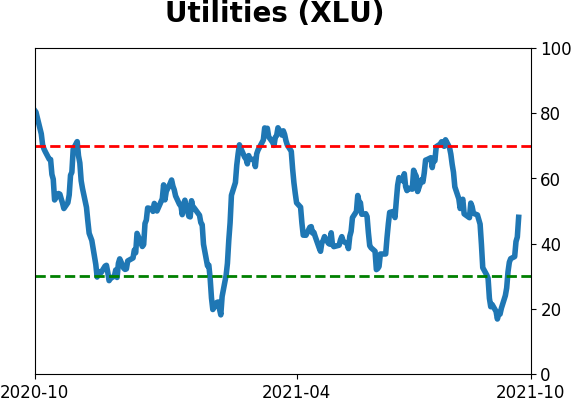
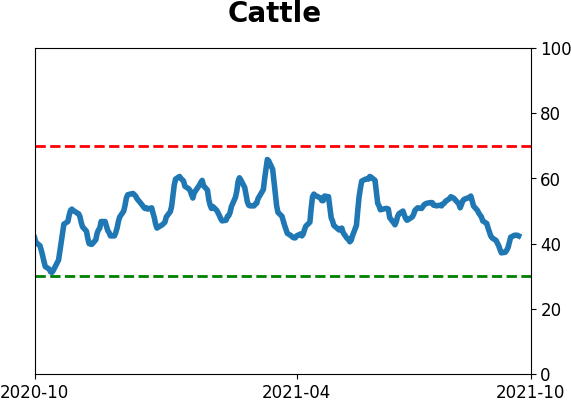
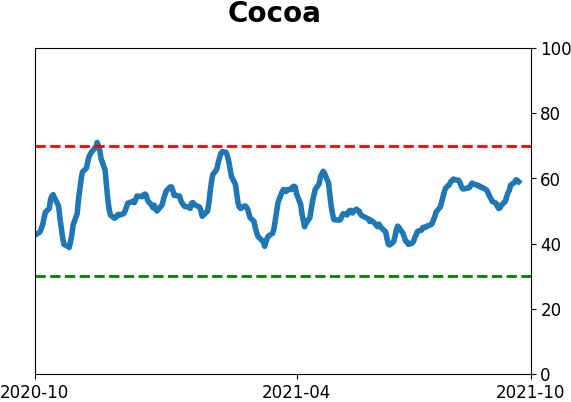
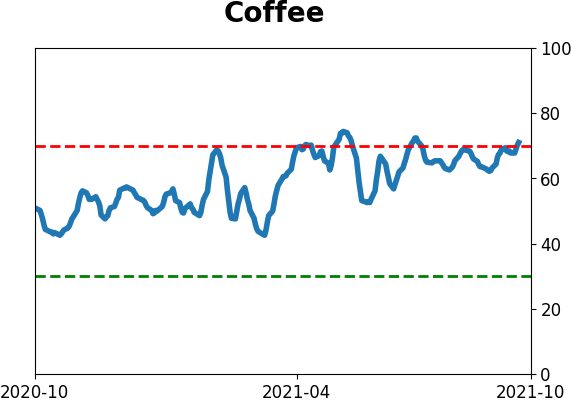
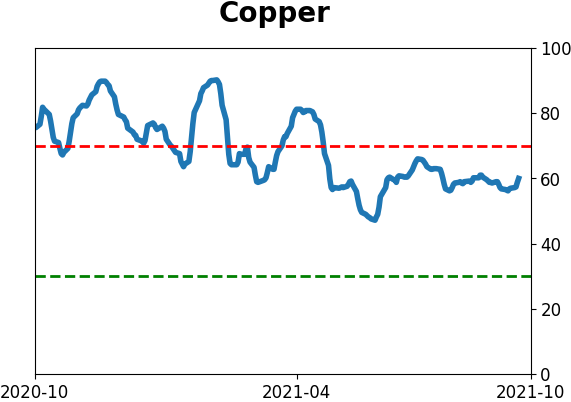
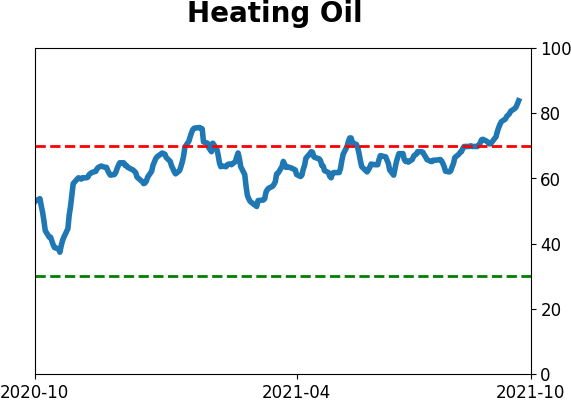
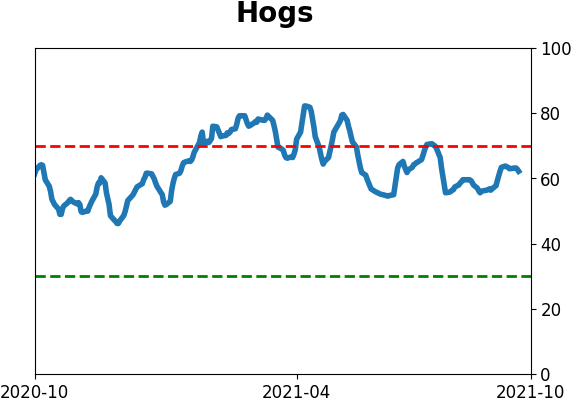
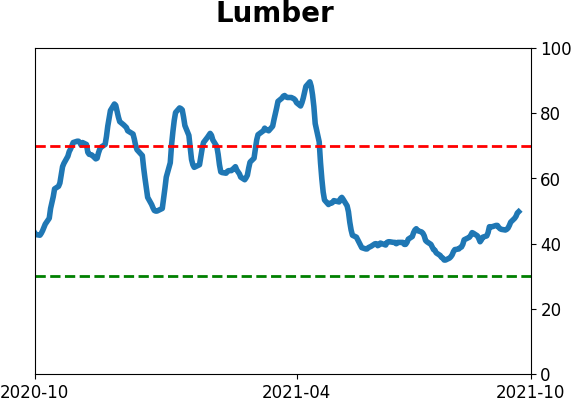
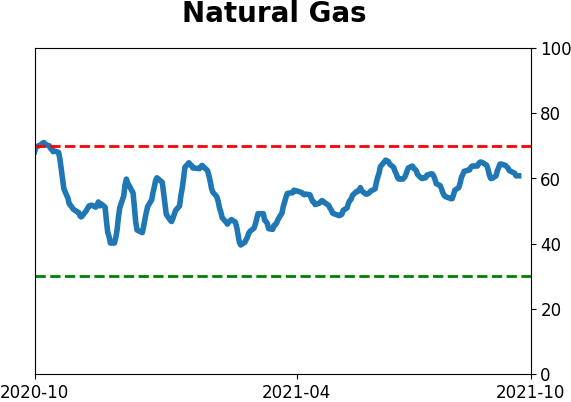
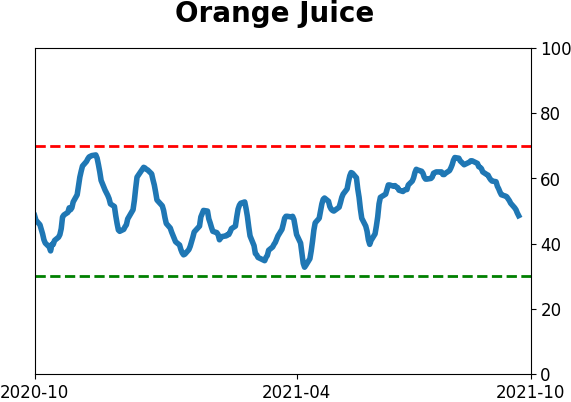
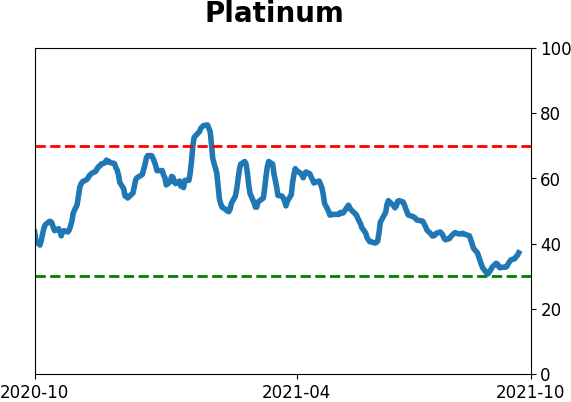
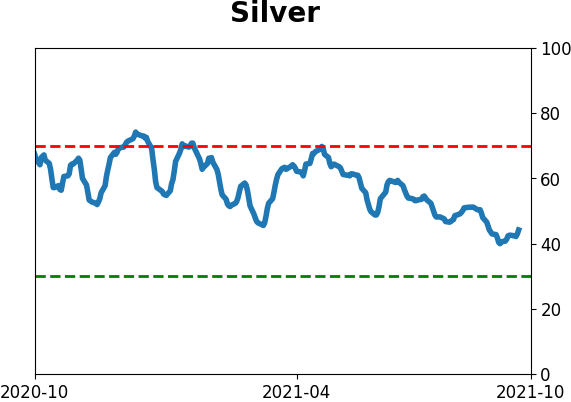
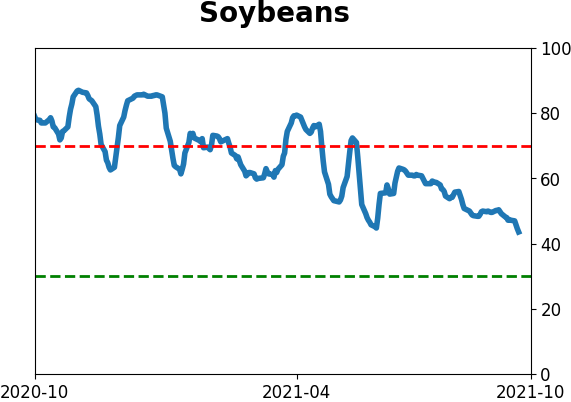
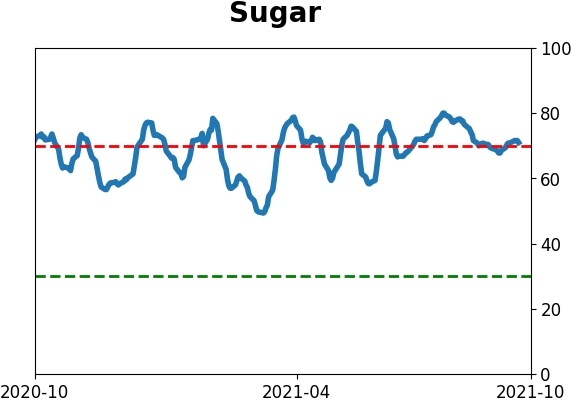
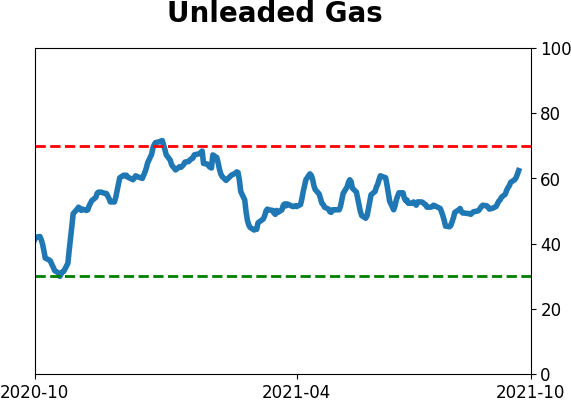
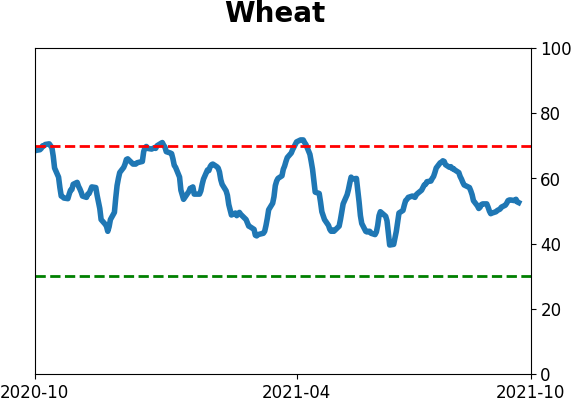
Optimism Index Thumbnails
|
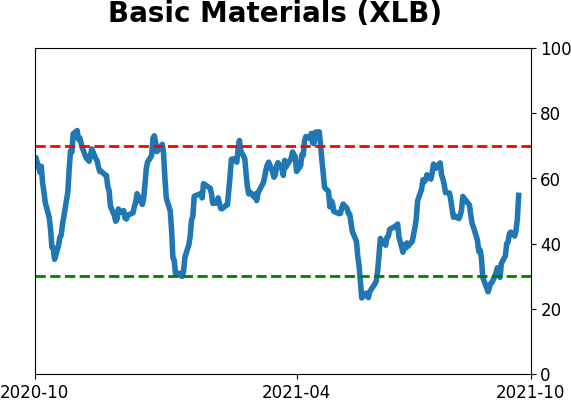
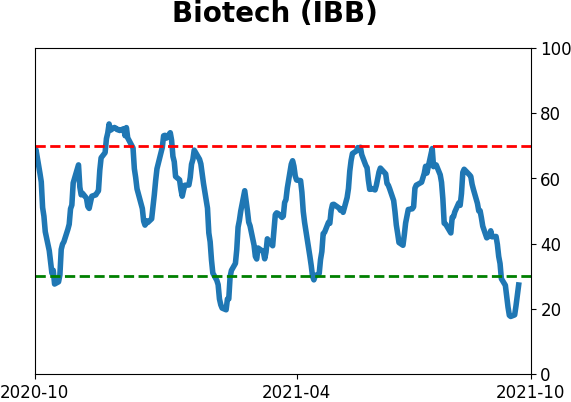
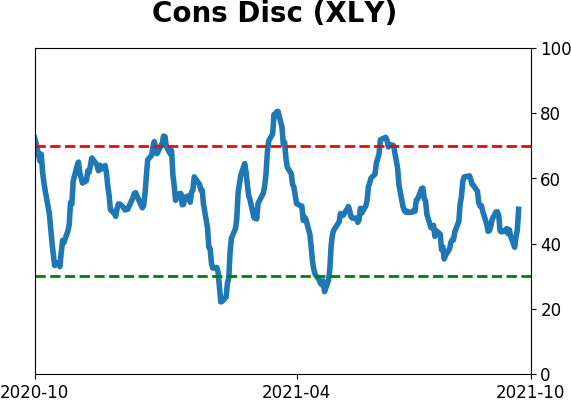
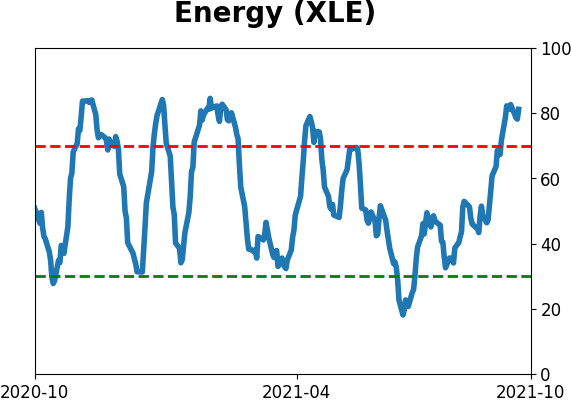
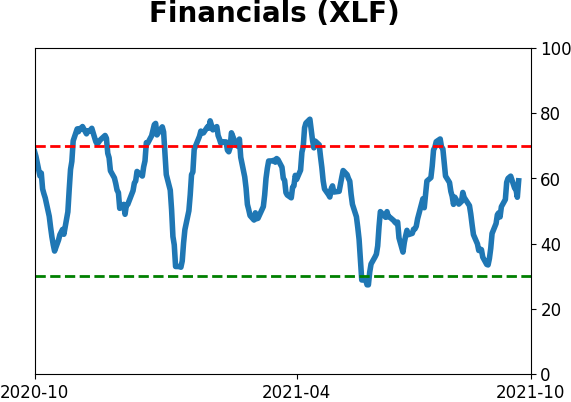
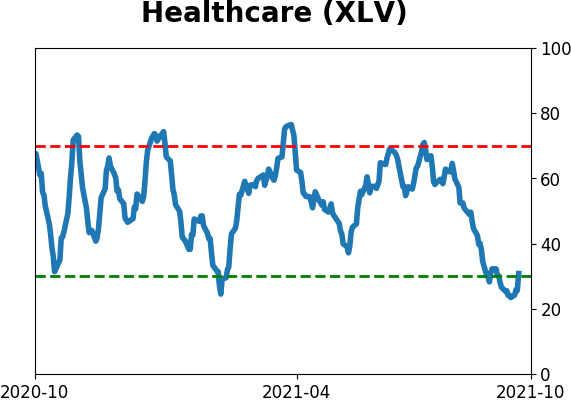
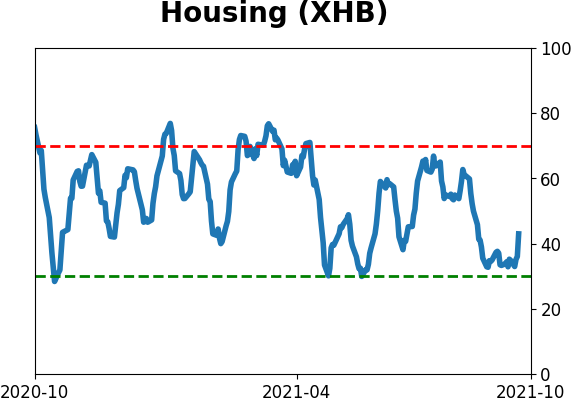
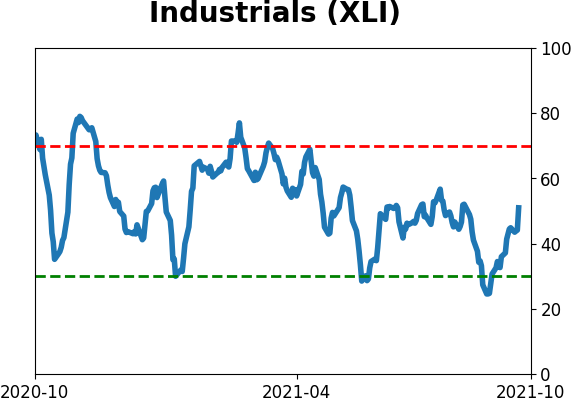
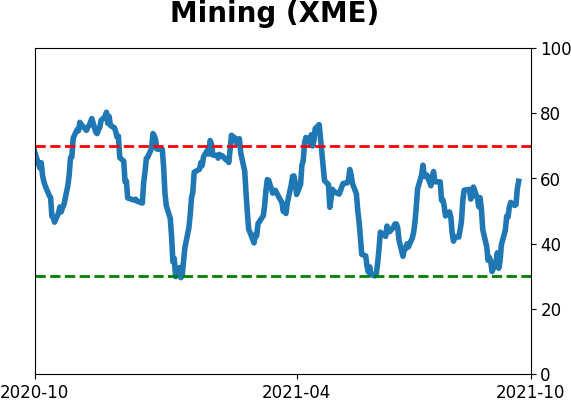
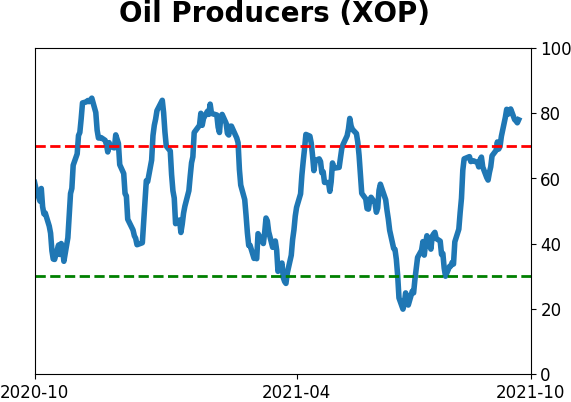
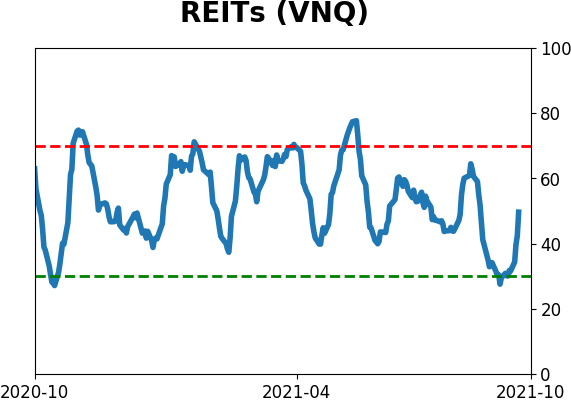
Sector ETF's - 10-Day Moving Average
|
|
|
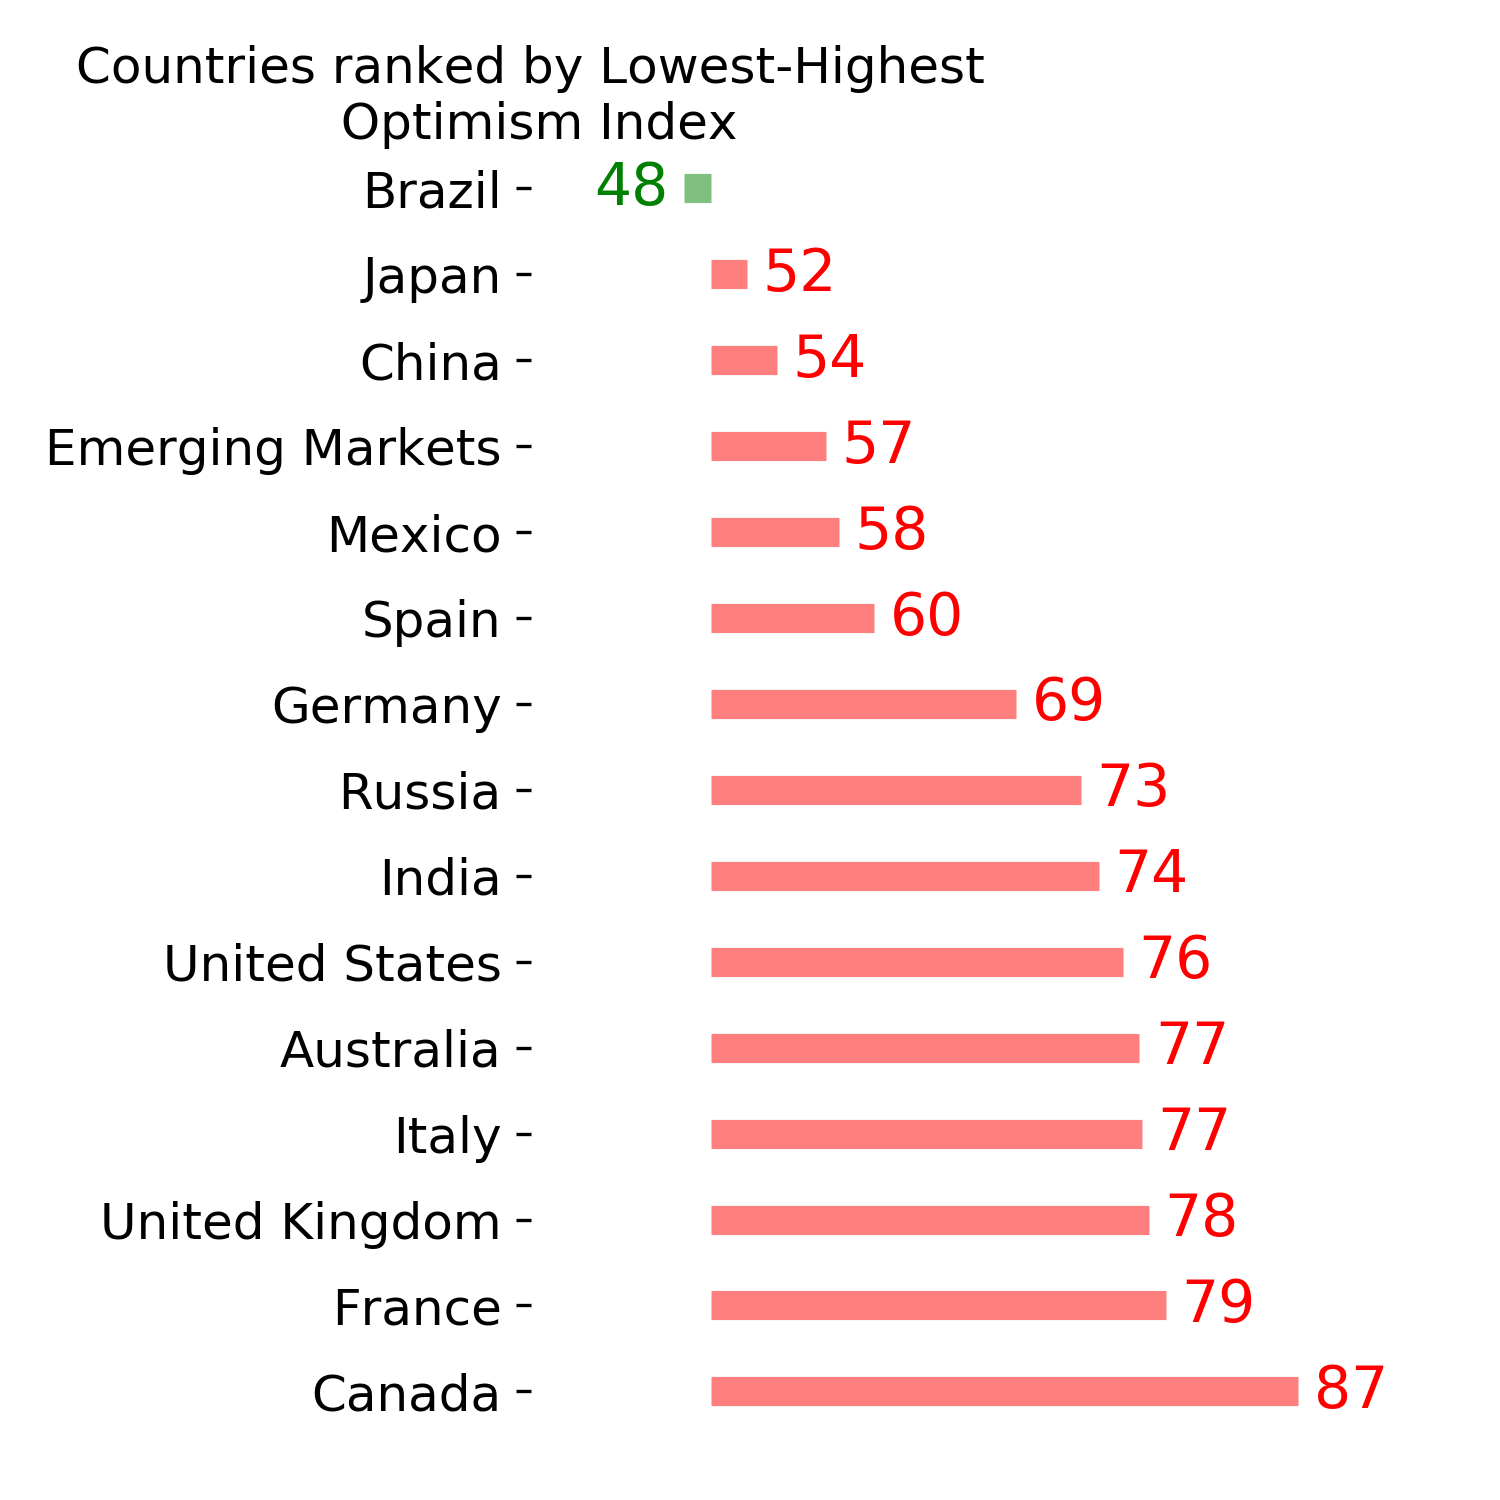
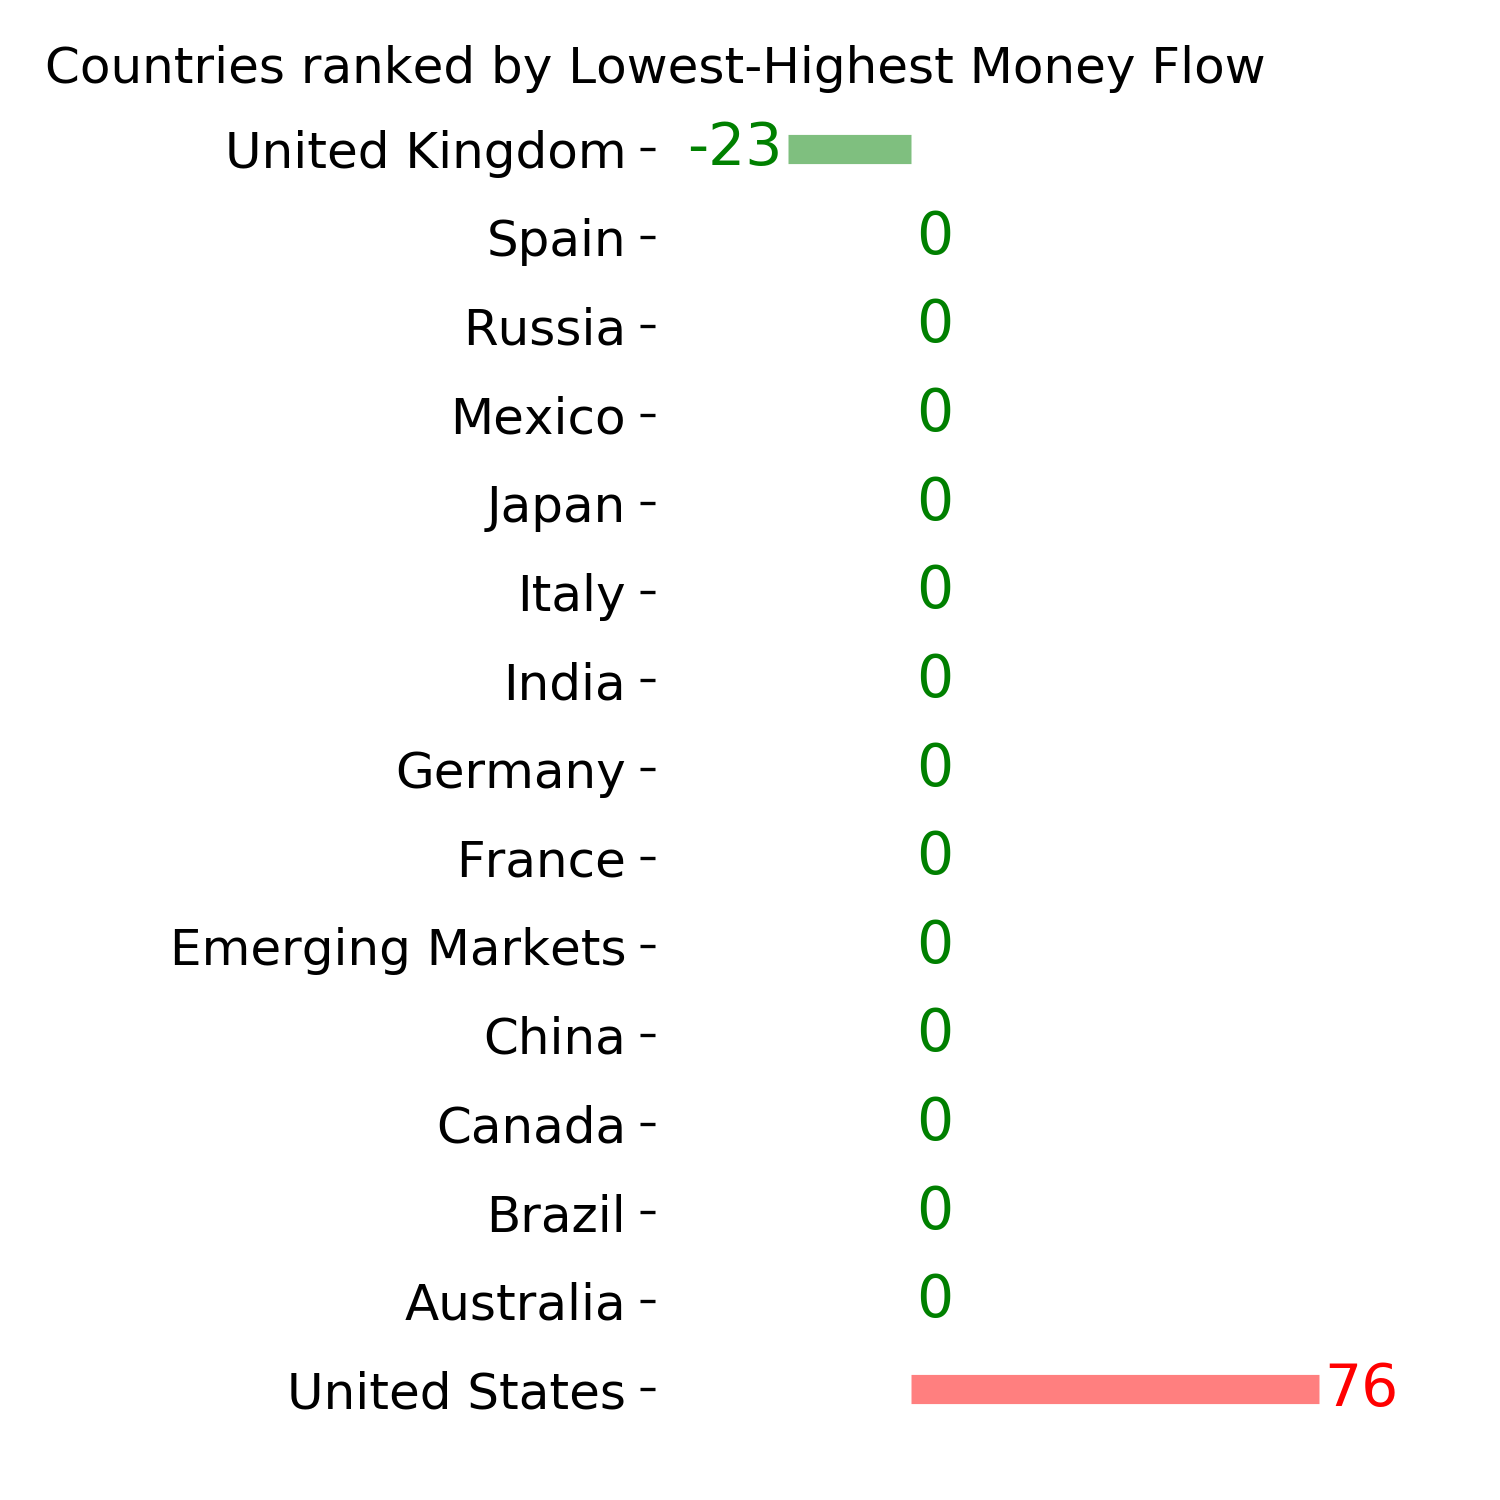
Country ETF's - 10-Day Moving Average
|
|
|
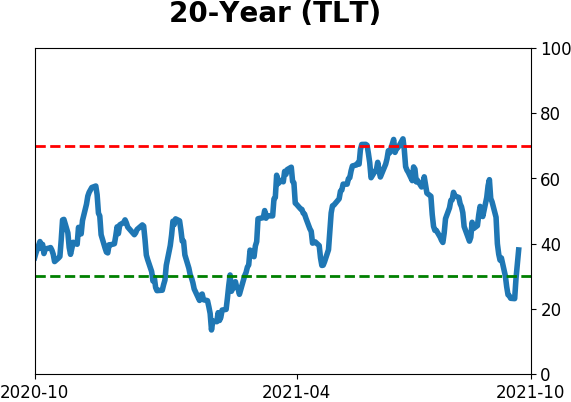
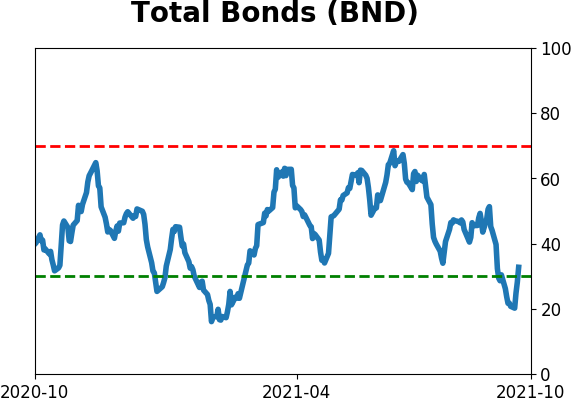
Bond ETF's - 10-Day Moving Average
|
|
|
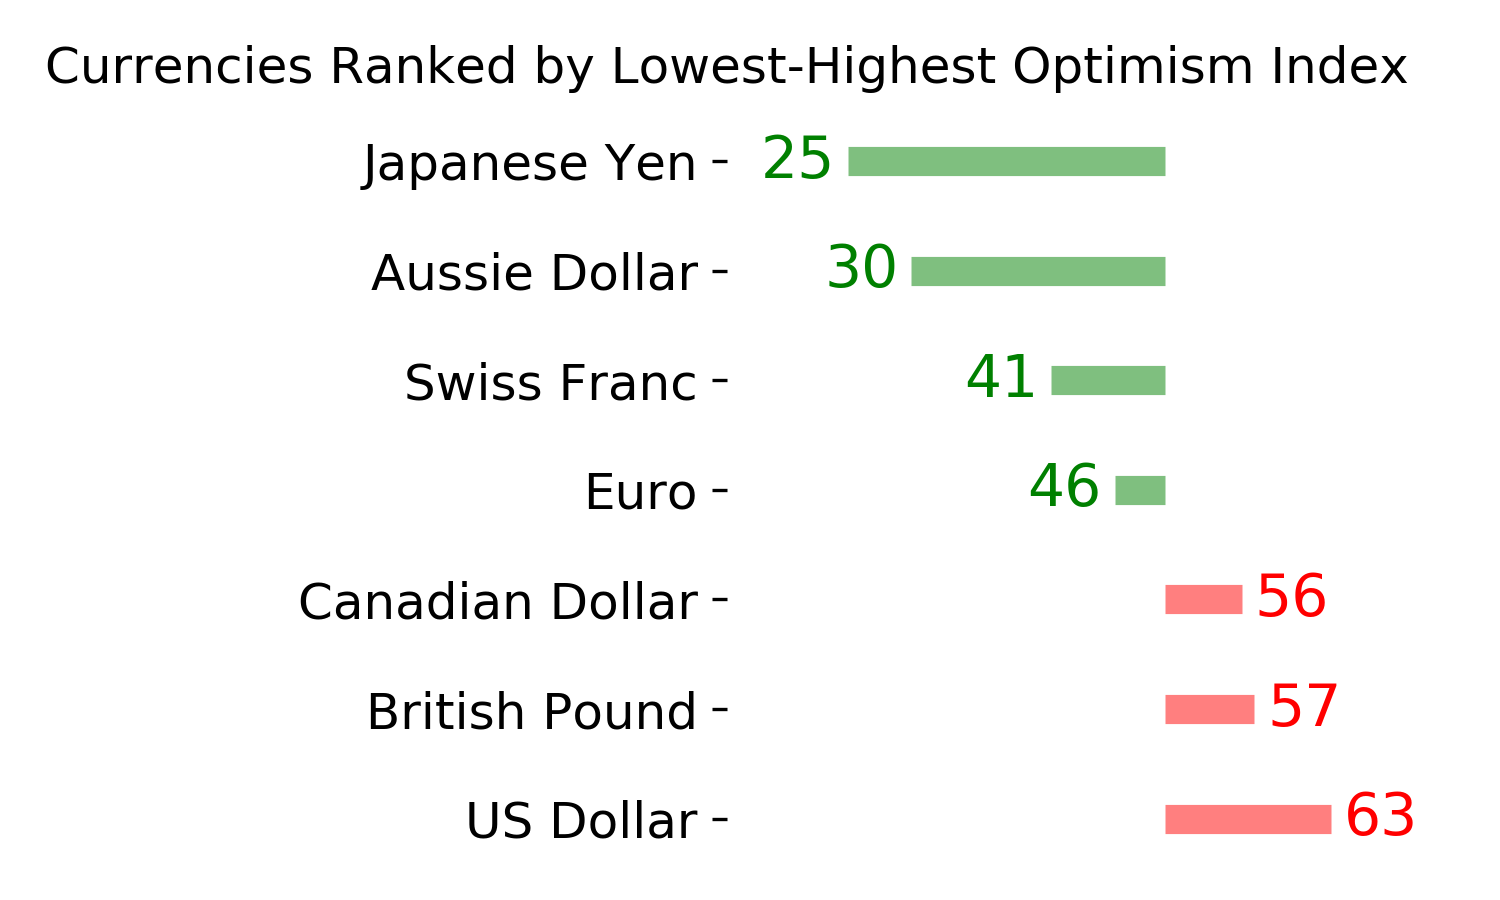
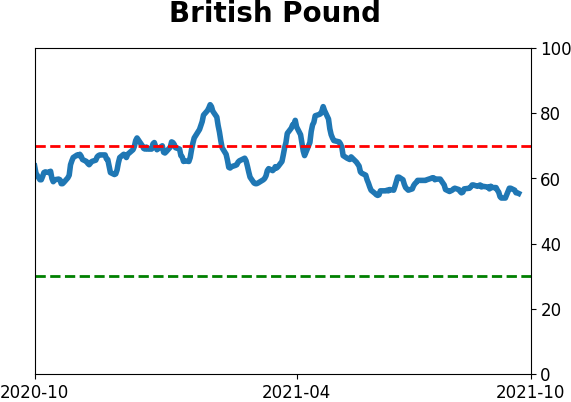
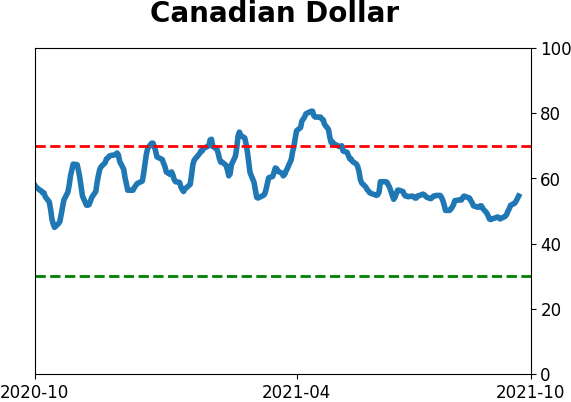
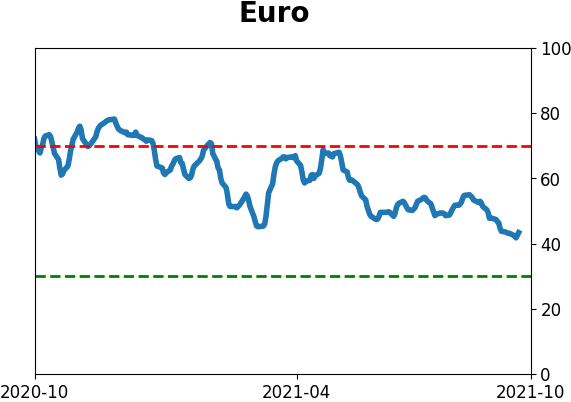
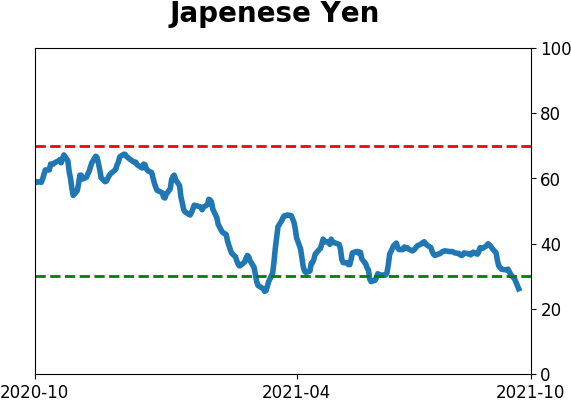
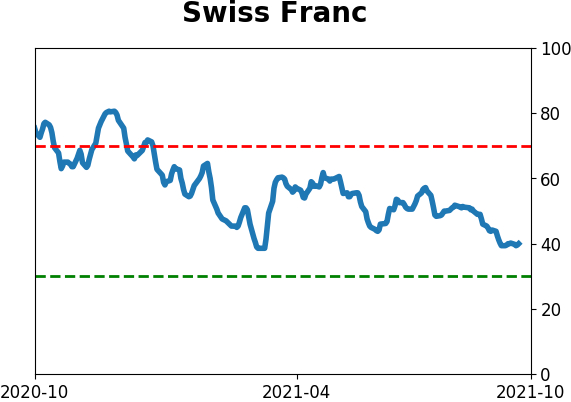
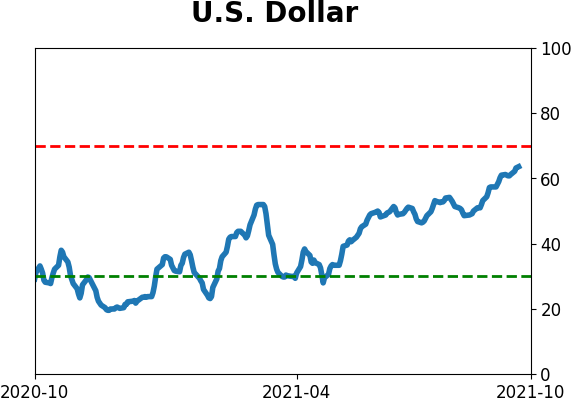
Currency ETF's - 5-Day Moving Average
|
|
|
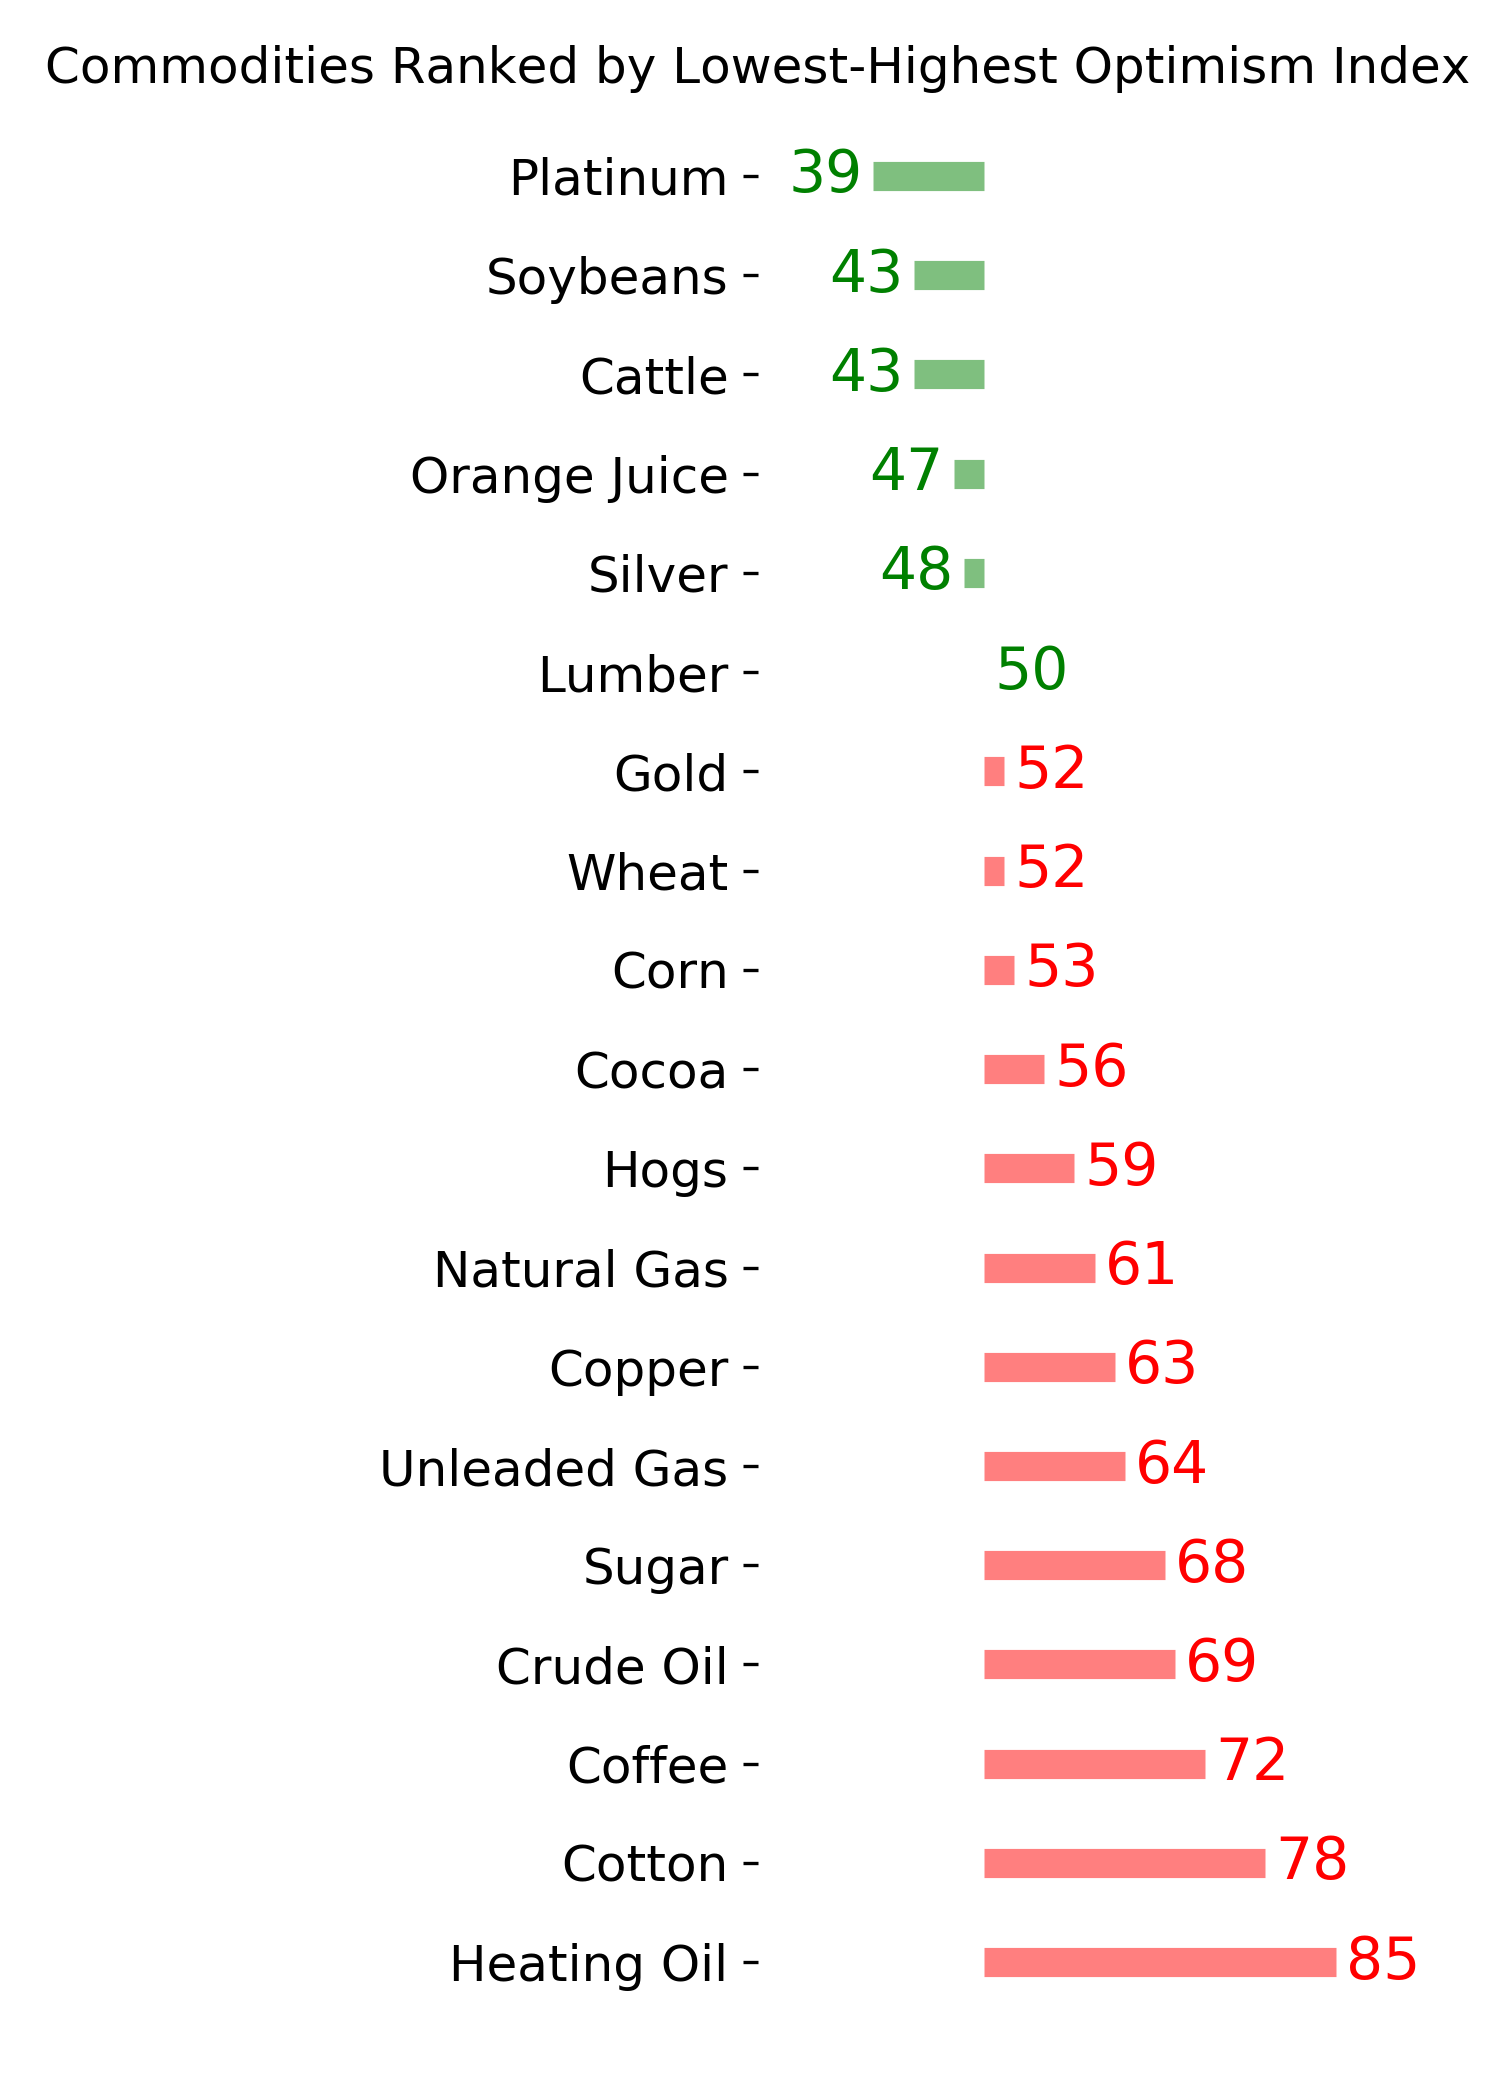
Commodity ETF's - 5-Day Moving Average
|
|