Headlines
|
|
Rally Broadens to Push Breadth to New Highs:
The comprehensive NYSE advance/decline line has set a new high for the first time in more than 90 days. That has consistently preceded multi-month gains in stocks, with low drawdowns.
Bottom Line:
STOCKS: Weak buy
The speculative frenzy in February is wrung out. There are some signs of pessimism, but the most compelling data show that buyers consistently tend to return once the first signs of extreme momentum end, especially as we head into a seasonally positive time of year. See the Outlook & Allocations page for more. BONDS: Hold
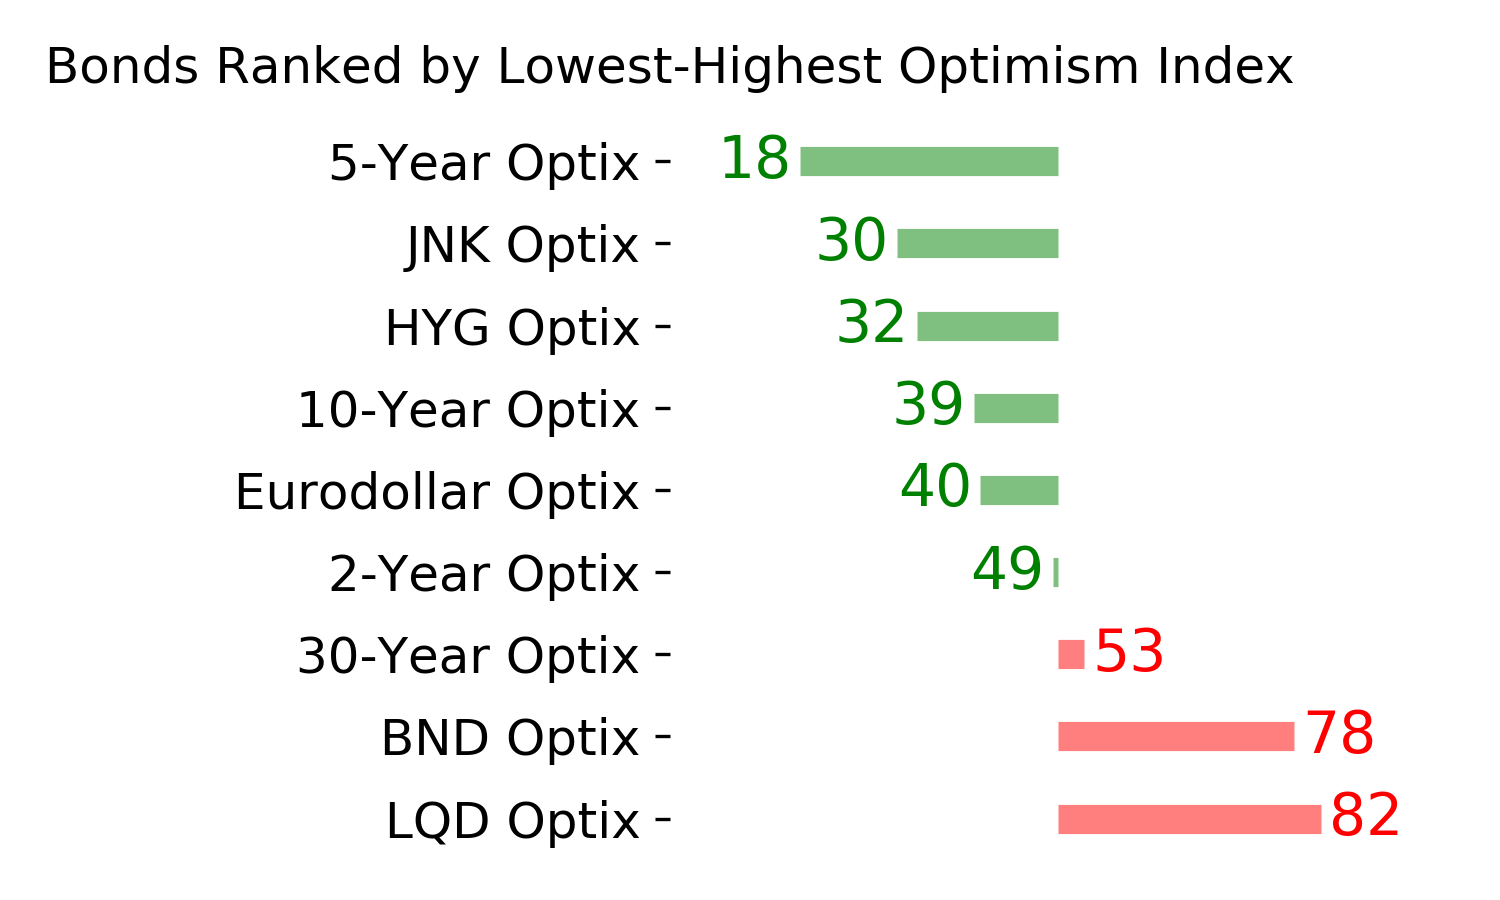
Various parts of the market got hit in March, with the lowest Bond Optimism Index we usually see during healthy environments. Bond prices have modest recovered and there is no edge among the data we follow. GOLD: Hold
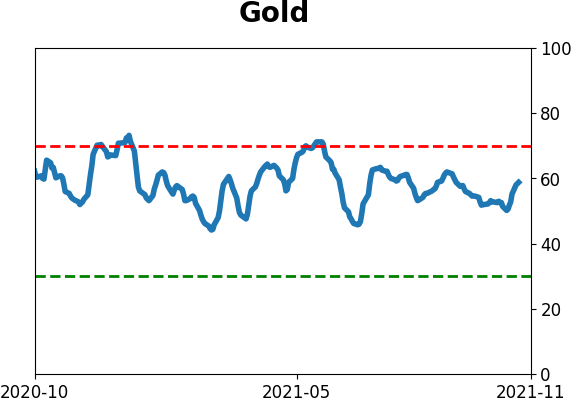
Gold and miners were rejected after trying to recover above their 200-day averages in May. Lately, some medium-term (not long-term) oversold extremes in breadth measures among miners have triggered.
|
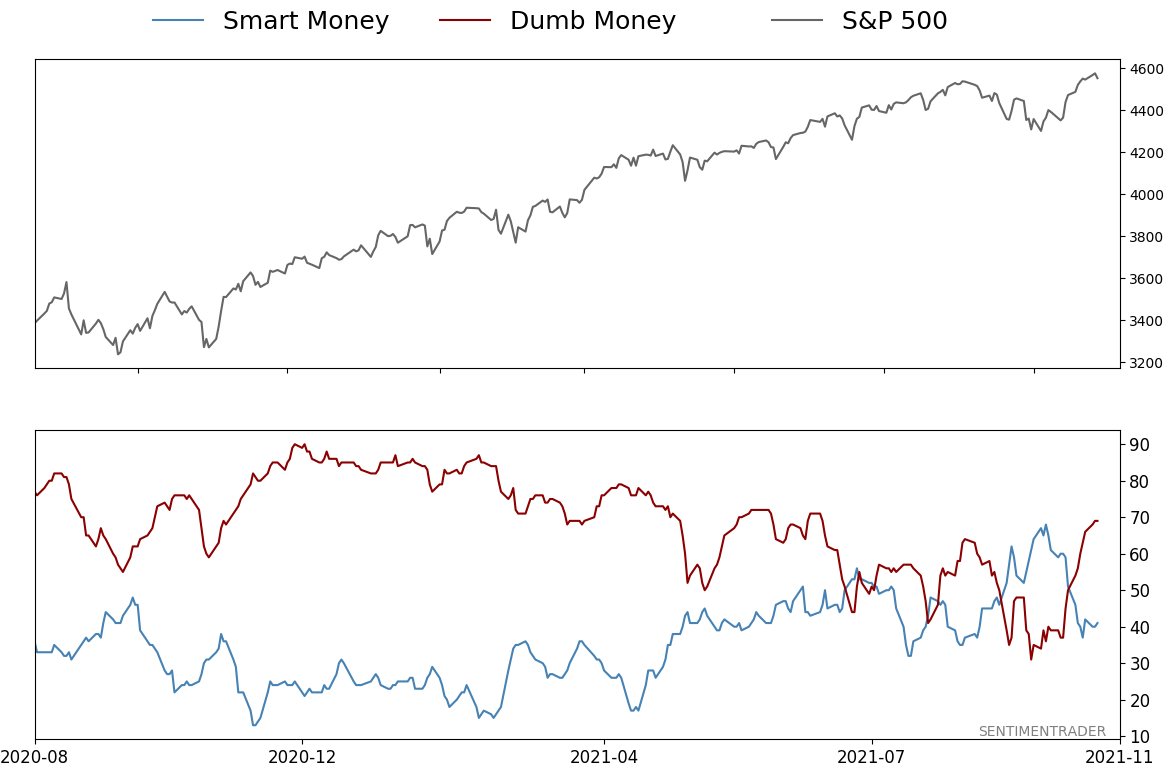
Smart / Dumb Money Confidence
|
Smart Money Confidence: 41%
Dumb Money Confidence: 69%
|
|
Risk Levels
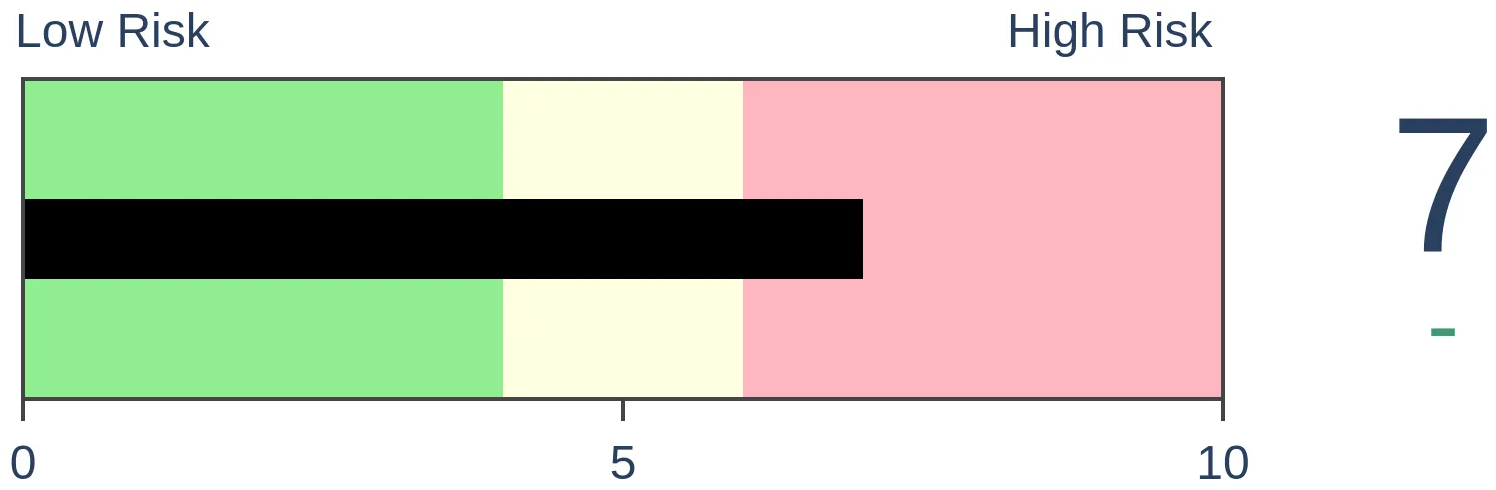
Stocks Short-Term
|
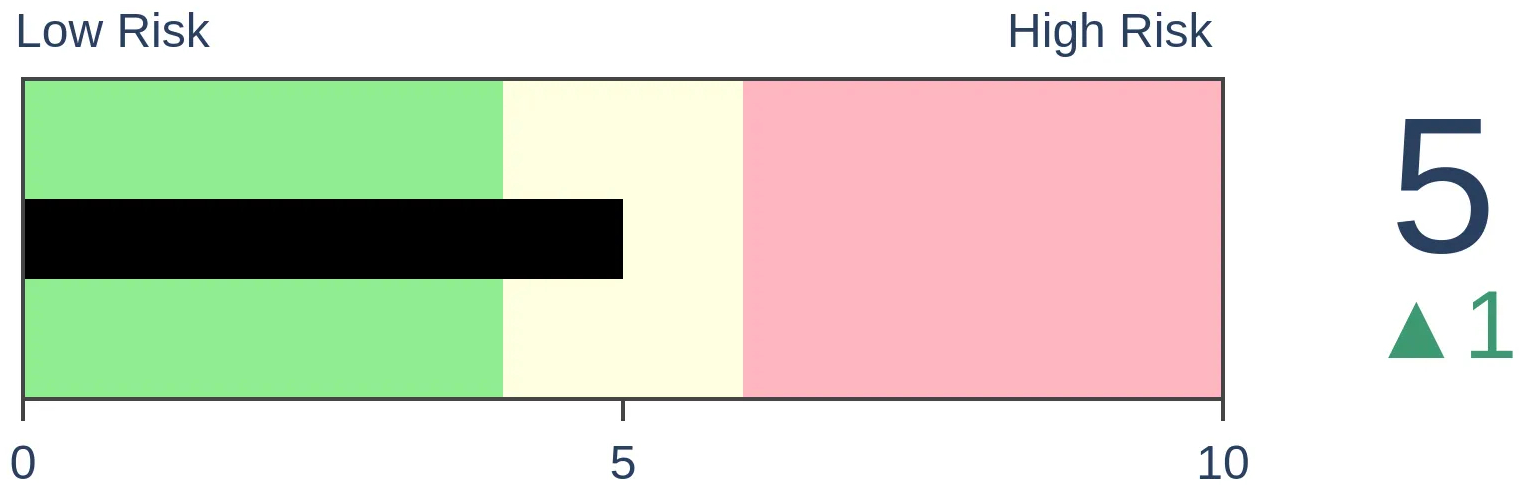
Stocks Medium-Term
|
|
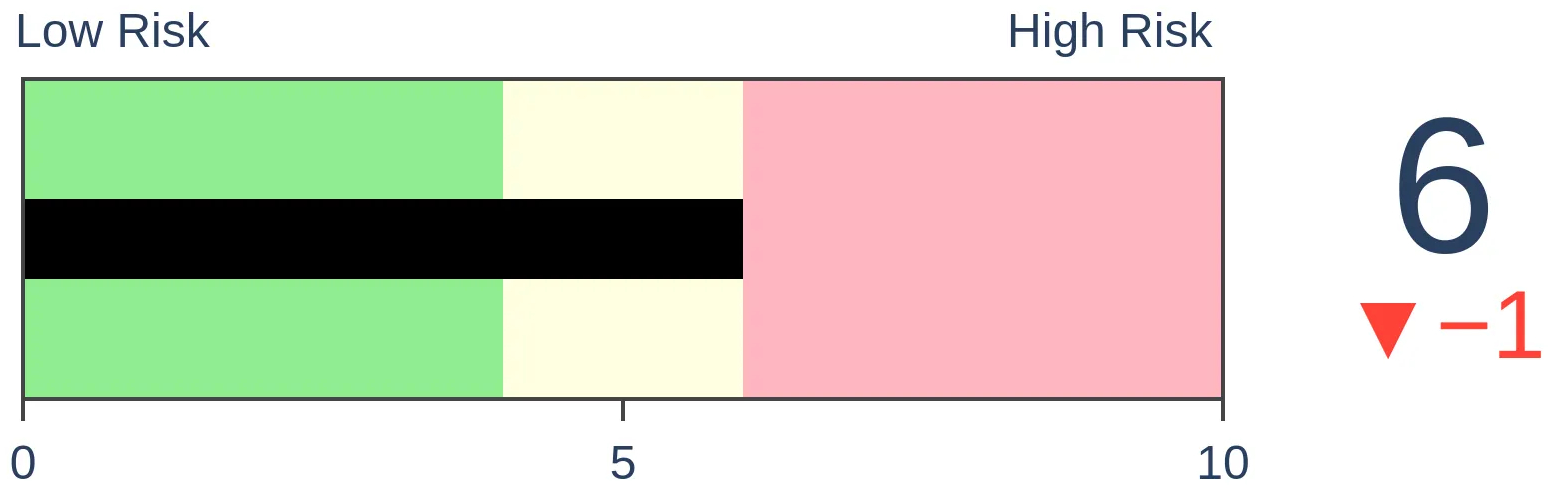
Bonds
|
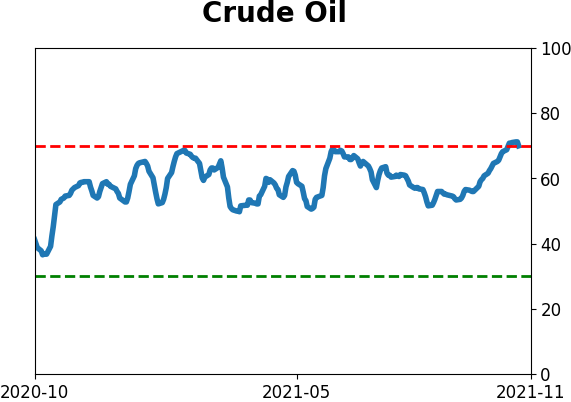
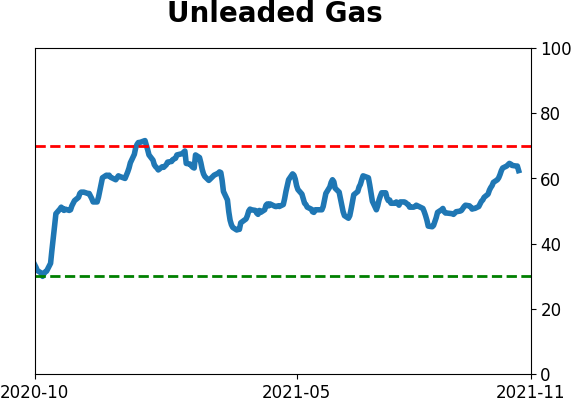
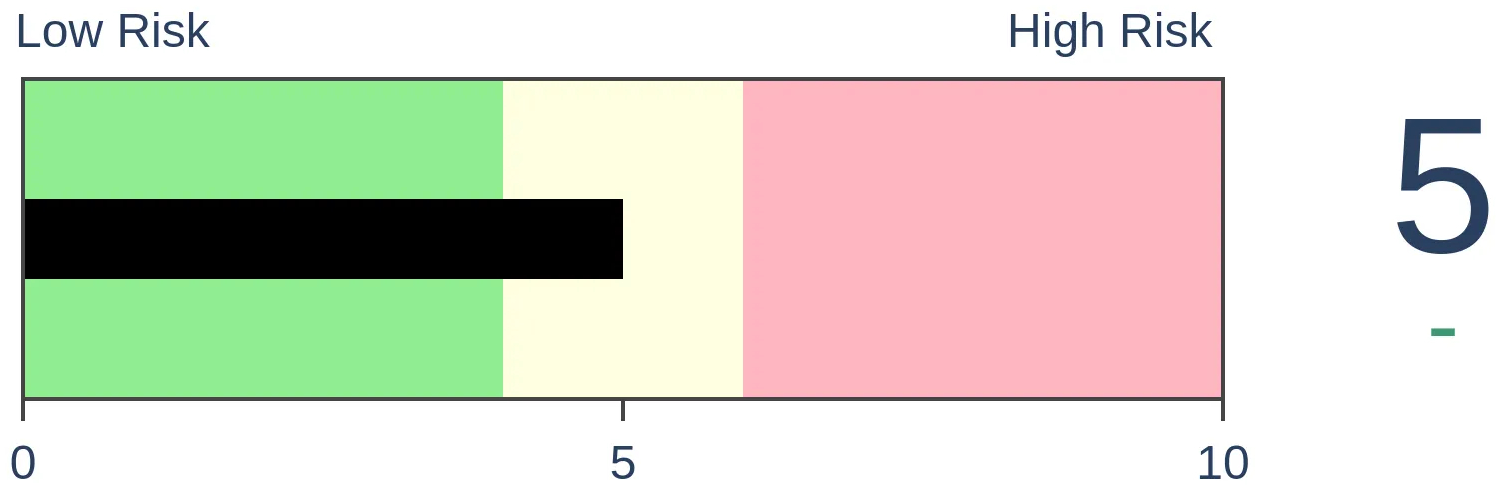
Crude Oil
|
|
Gold
|
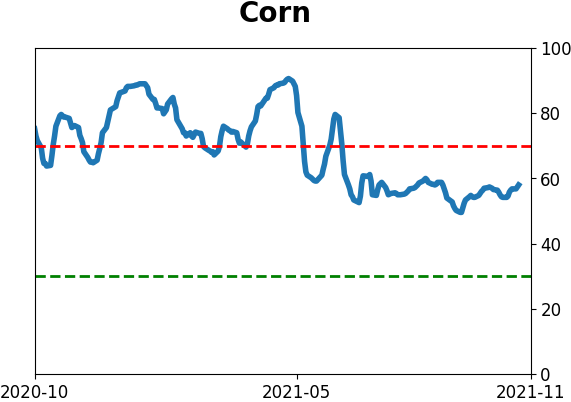
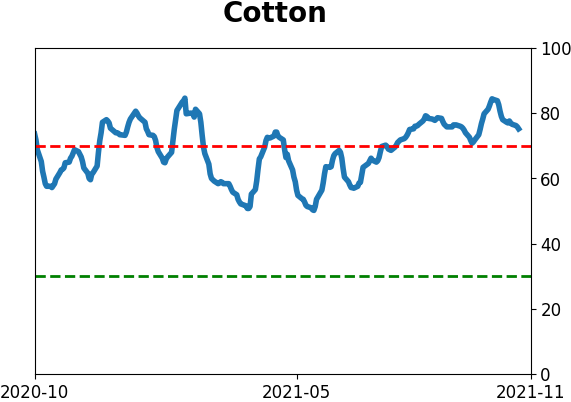
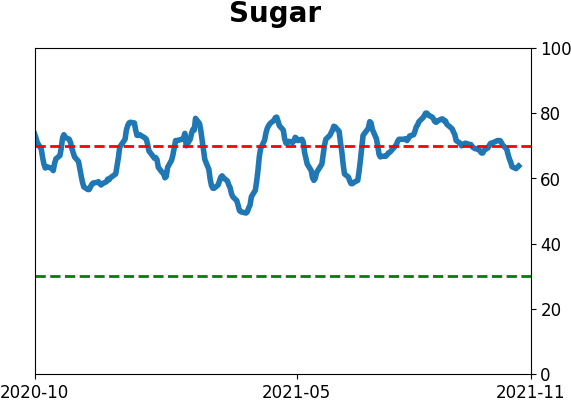
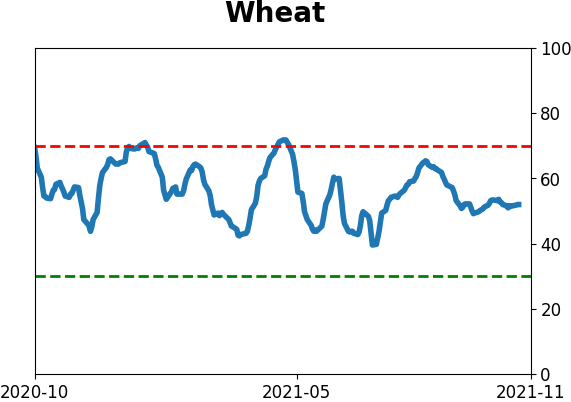
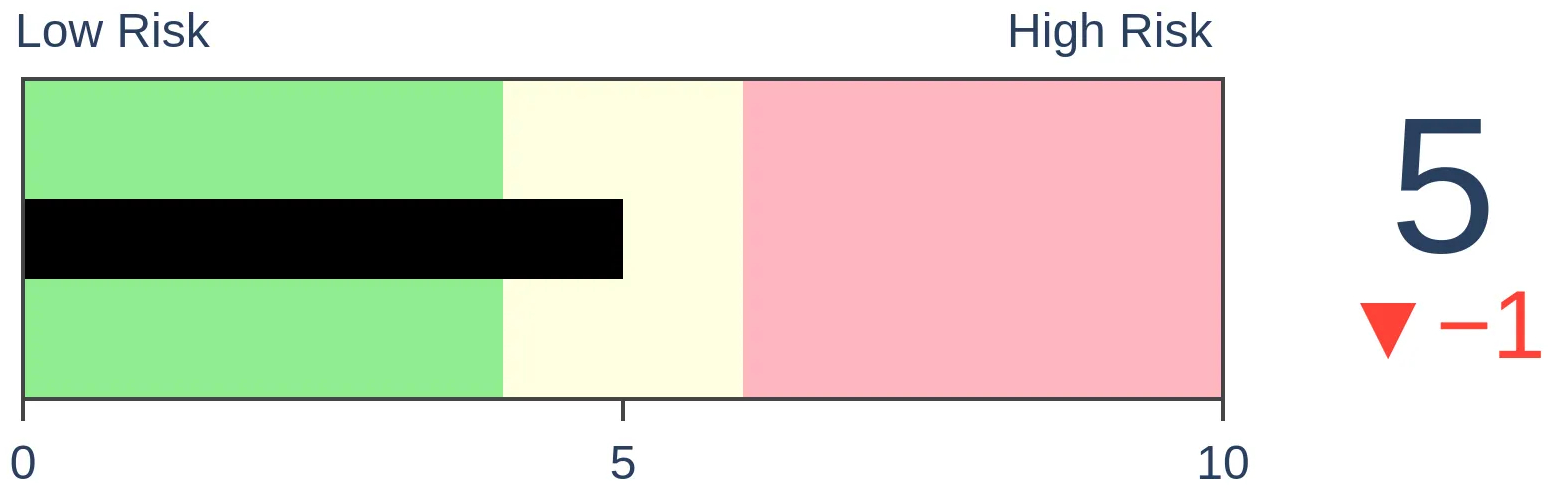
Agriculture
|
|
Research
By Jason Goepfert
BOTTOM LINE
The comprehensive NYSE advance/decline line has set a new high for the first time in more than 90 days. That has consistently preceded multi-month gains in stocks, with low drawdowns.
FORECAST / TIMEFRAME
None
|
On Monday, we saw that the Advance/Decline Line for S&P 500 stocks broke out to a new high. A line that incorporates the breadth of all securities traded on the NYSE hadn't quite done the same. Now it has.
For the first time in more than 90 days, the NYSE Cumulative Advance/Decline Line is sitting at a record high.
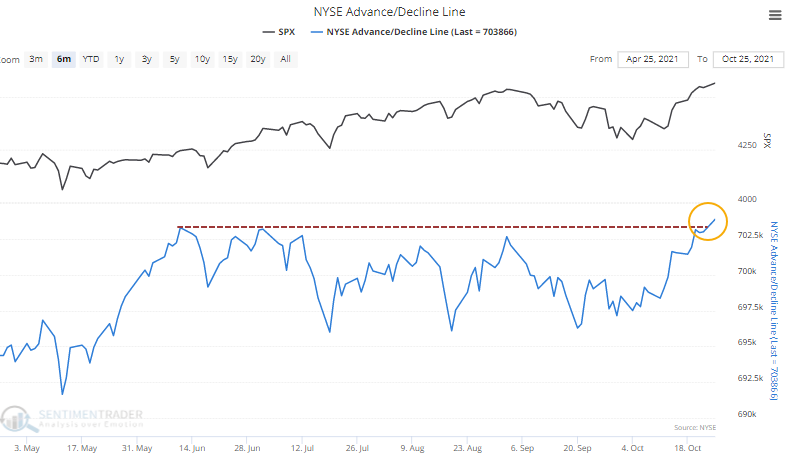
There are all kinds of things traded on the NYSE, with some arguments being that they should be excluded. That's a mistake. Securities with a smaller capitalization or that are especially sensitive to interest rates are suitable to include in breadth measurements.
Like we saw with breakouts in the S&P 500 line on Monday, new highs in the NYSE A/D Line have consistently preceded stock gains.
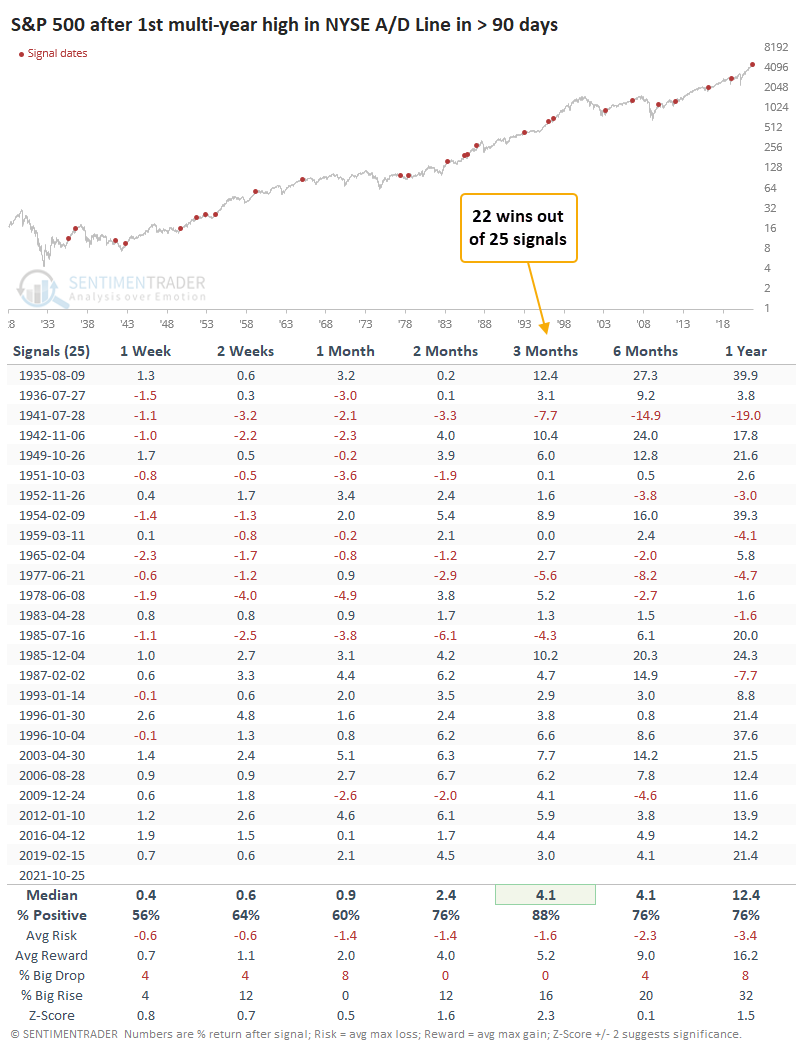
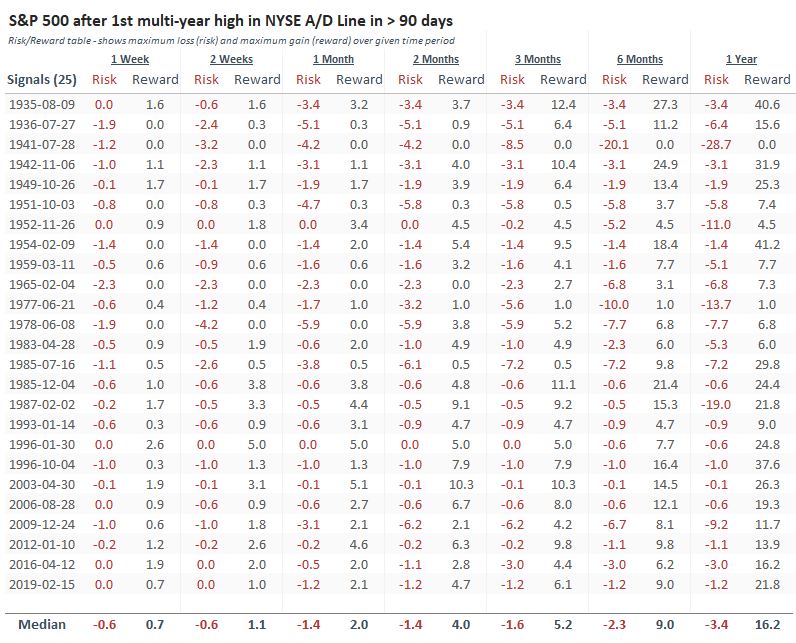
The Risk/Reward Table shows a dizzying amount of numbers, but it's worth demonstrating that over the next three months, there were no losses greater than -8.5% at any point for any signal. On average, drawdowns were limited to only -1.6%. Out of the 25 signals, 19 showed more reward (maximum gain) than risk (maximum decline).
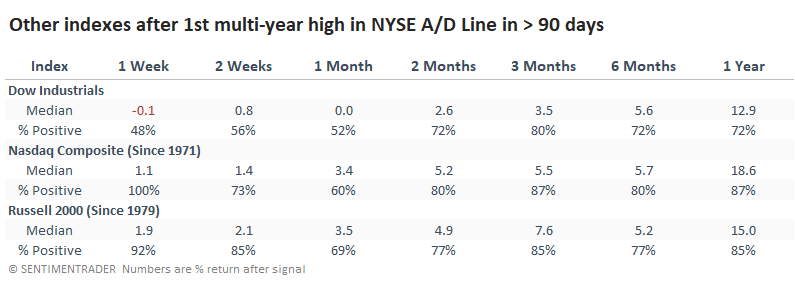
Among the other major equity indexes, the Dow Industrials struggled a bit more in the short-term while the tech-heavy Nasdaq Composite and small-cap Russell 2000 fared much better (but with fewer signals). Over the next week, the Nasdaq and Russell suffered few, if any, losses. Medium- to long-term returns were reasonably consistent between them.
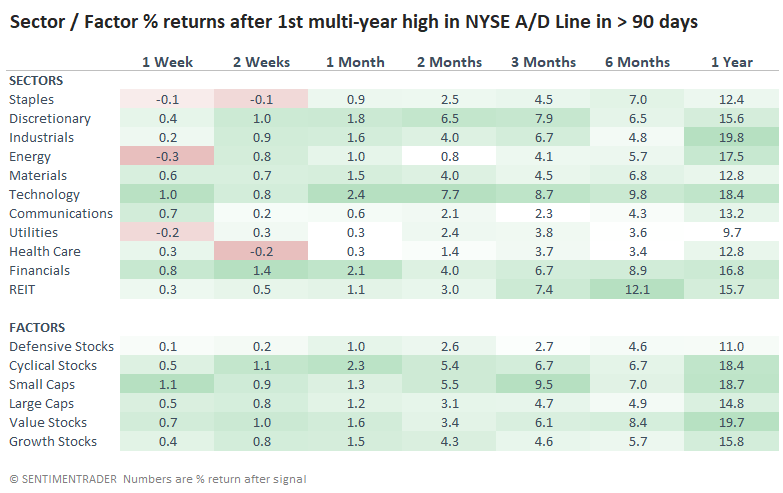
The same can be said for sectors and factors. There was a remarkable amount of consistency, with good returns pretty much all around.
Just because cumulative breadth measures like the Advance/Decline Line are sitting at new highs, it does not mean stocks can't decline. They can; they can even crash. While technicians like to focus on divergences, many 10% or greater declines began when the A/D Line was at new highs.
The biggest difference is that those significant declines usually began a prolonged "everything" rally in the A/D Line. They rarely happened when the A/D Line was just breaking out to new highs. We can never traffic in absolutes or certainties, only probabilities. Over a very long history, probabilities favor rising stocks, or at least only limited declines, after breakouts in breadth.
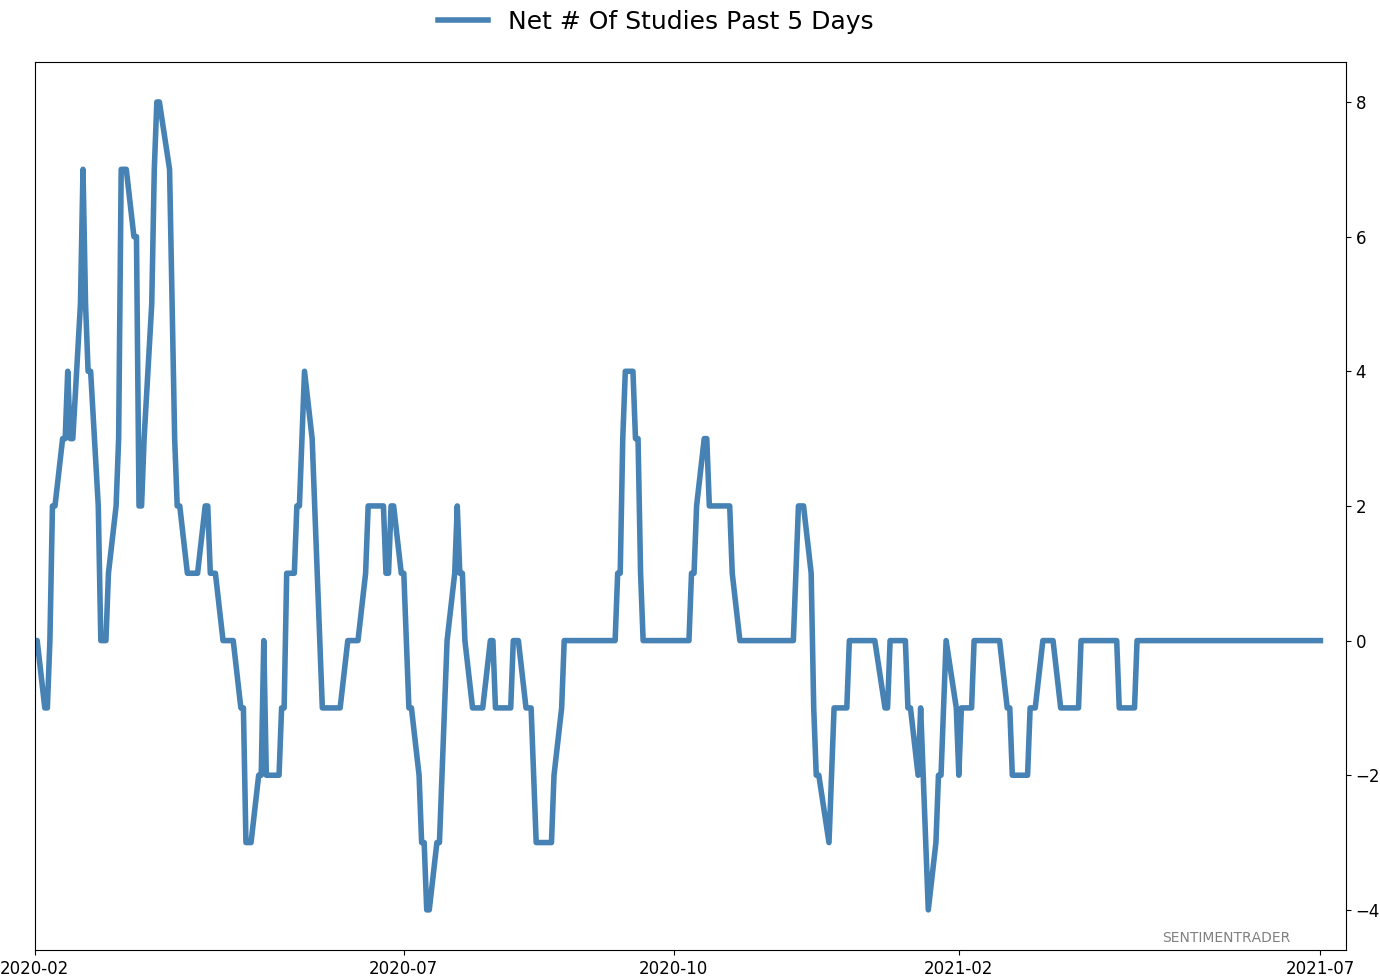
Active Studies
| Time Frame | Bullish | Bearish | | Short-Term | 2 | 0 | | Medium-Term | 8 | 0 | | Long-Term | 11 | 5 |
|
Indicators at Extremes
Portfolio
| Position | Description | Weight % | Added / Reduced | Date | | Stocks | RSP | 10.7 | Added 6.4% | 2021-10-01 | | Bonds | 32.7% BND, 7.1% SCHP | 39.8 | Added 8.3% | 2021-10-26 | | Commodities | GCC | 2.4 | Reduced 2.1%
| 2020-09-04 | | Precious Metals | GDX | 4.6 | Reduced 4.2% | 2021-05-19 | | Special Situations | 9.8% KWEB, 4.7% XLE, 2.9% PSCE | 17.3 | Added 9.78% | 2021-10-01 | | Cash | | 24.1 | | |
|
Updates (Changes made today are underlined)
Much of our momentum and trend work has remained positive for several months, with some scattered exceptions. Almost all sentiment-related work has shown a poor risk/reward ratio for stocks, especially as speculation drove to record highs in exuberance in February. Much of that has worn off, and most of our models are back toward neutral levels. There isn't much to be excited about here. The same goes for bonds and even gold. Gold has been performing well lately and is back above long-term trend lines. The issue is that it has a poor record of holding onto gains when attempting a long-term trend change like this, so we'll take a wait-and-see approach. Momentum has ebbed quickly in recent weeks, and nearing oversold levels in some indicators. This can be a dangerous area, with a lot of short-term volatility, but we'd be more inclined to add medium- to long-term exposure rather than sell on much more of a decline, thanks to already rock-bottom exposure. Other areas look more attractive, including some overseas markets. RETURN YTD: 11.0% 2020: 8.1%, 2019: 12.6%, 2018: 0.6%, 2017: 3.8%, 2016: 17.1%, 2015: 9.2%, 2014: 14.5%, 2013: 2.2%, 2012: 10.8%, 2011: 16.5%, 2010: 15.3%, 2009: 23.9%, 2008: 16.2%, 2007: 7.8%
|
|
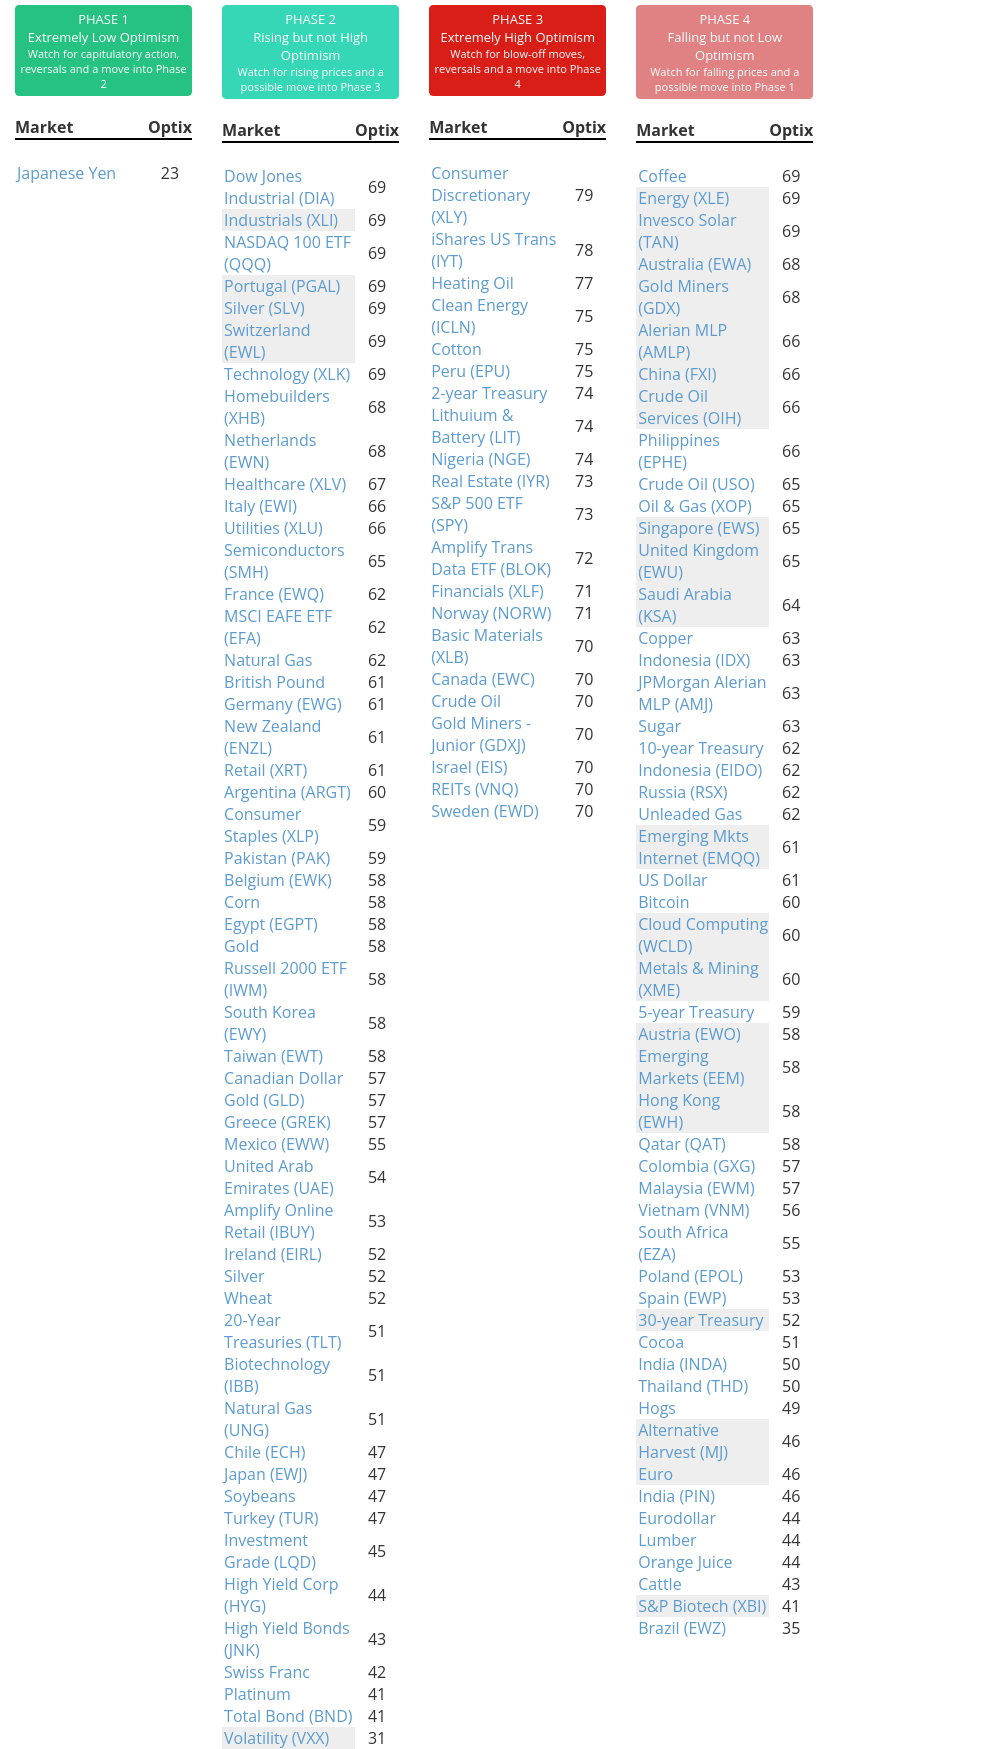
Phase Table
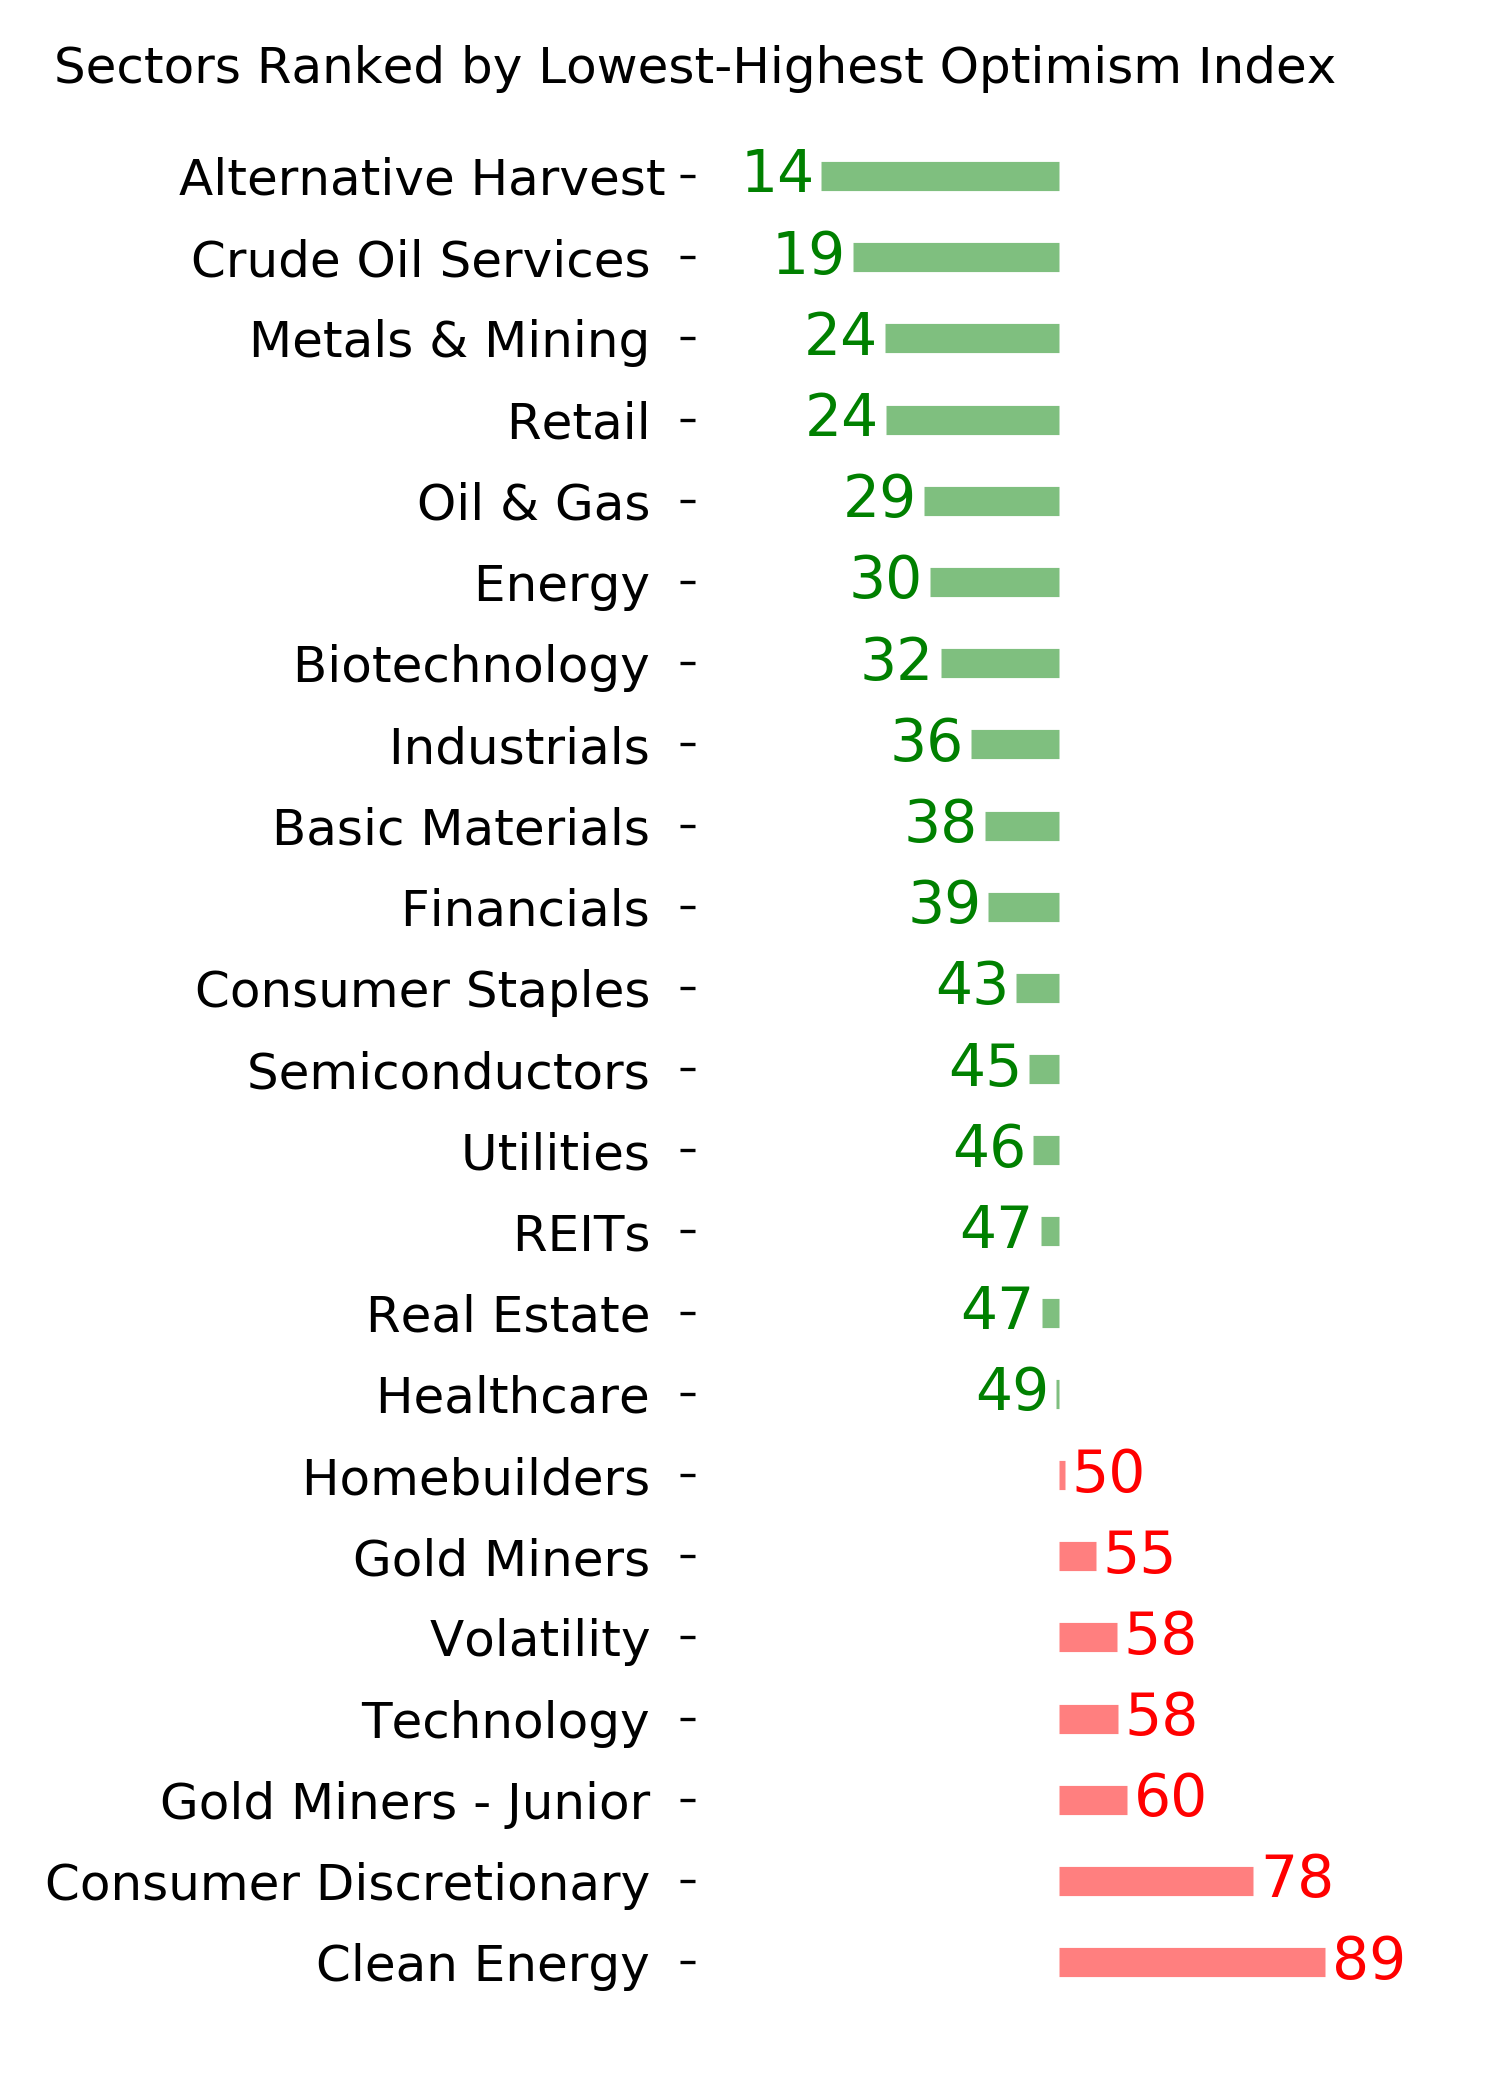
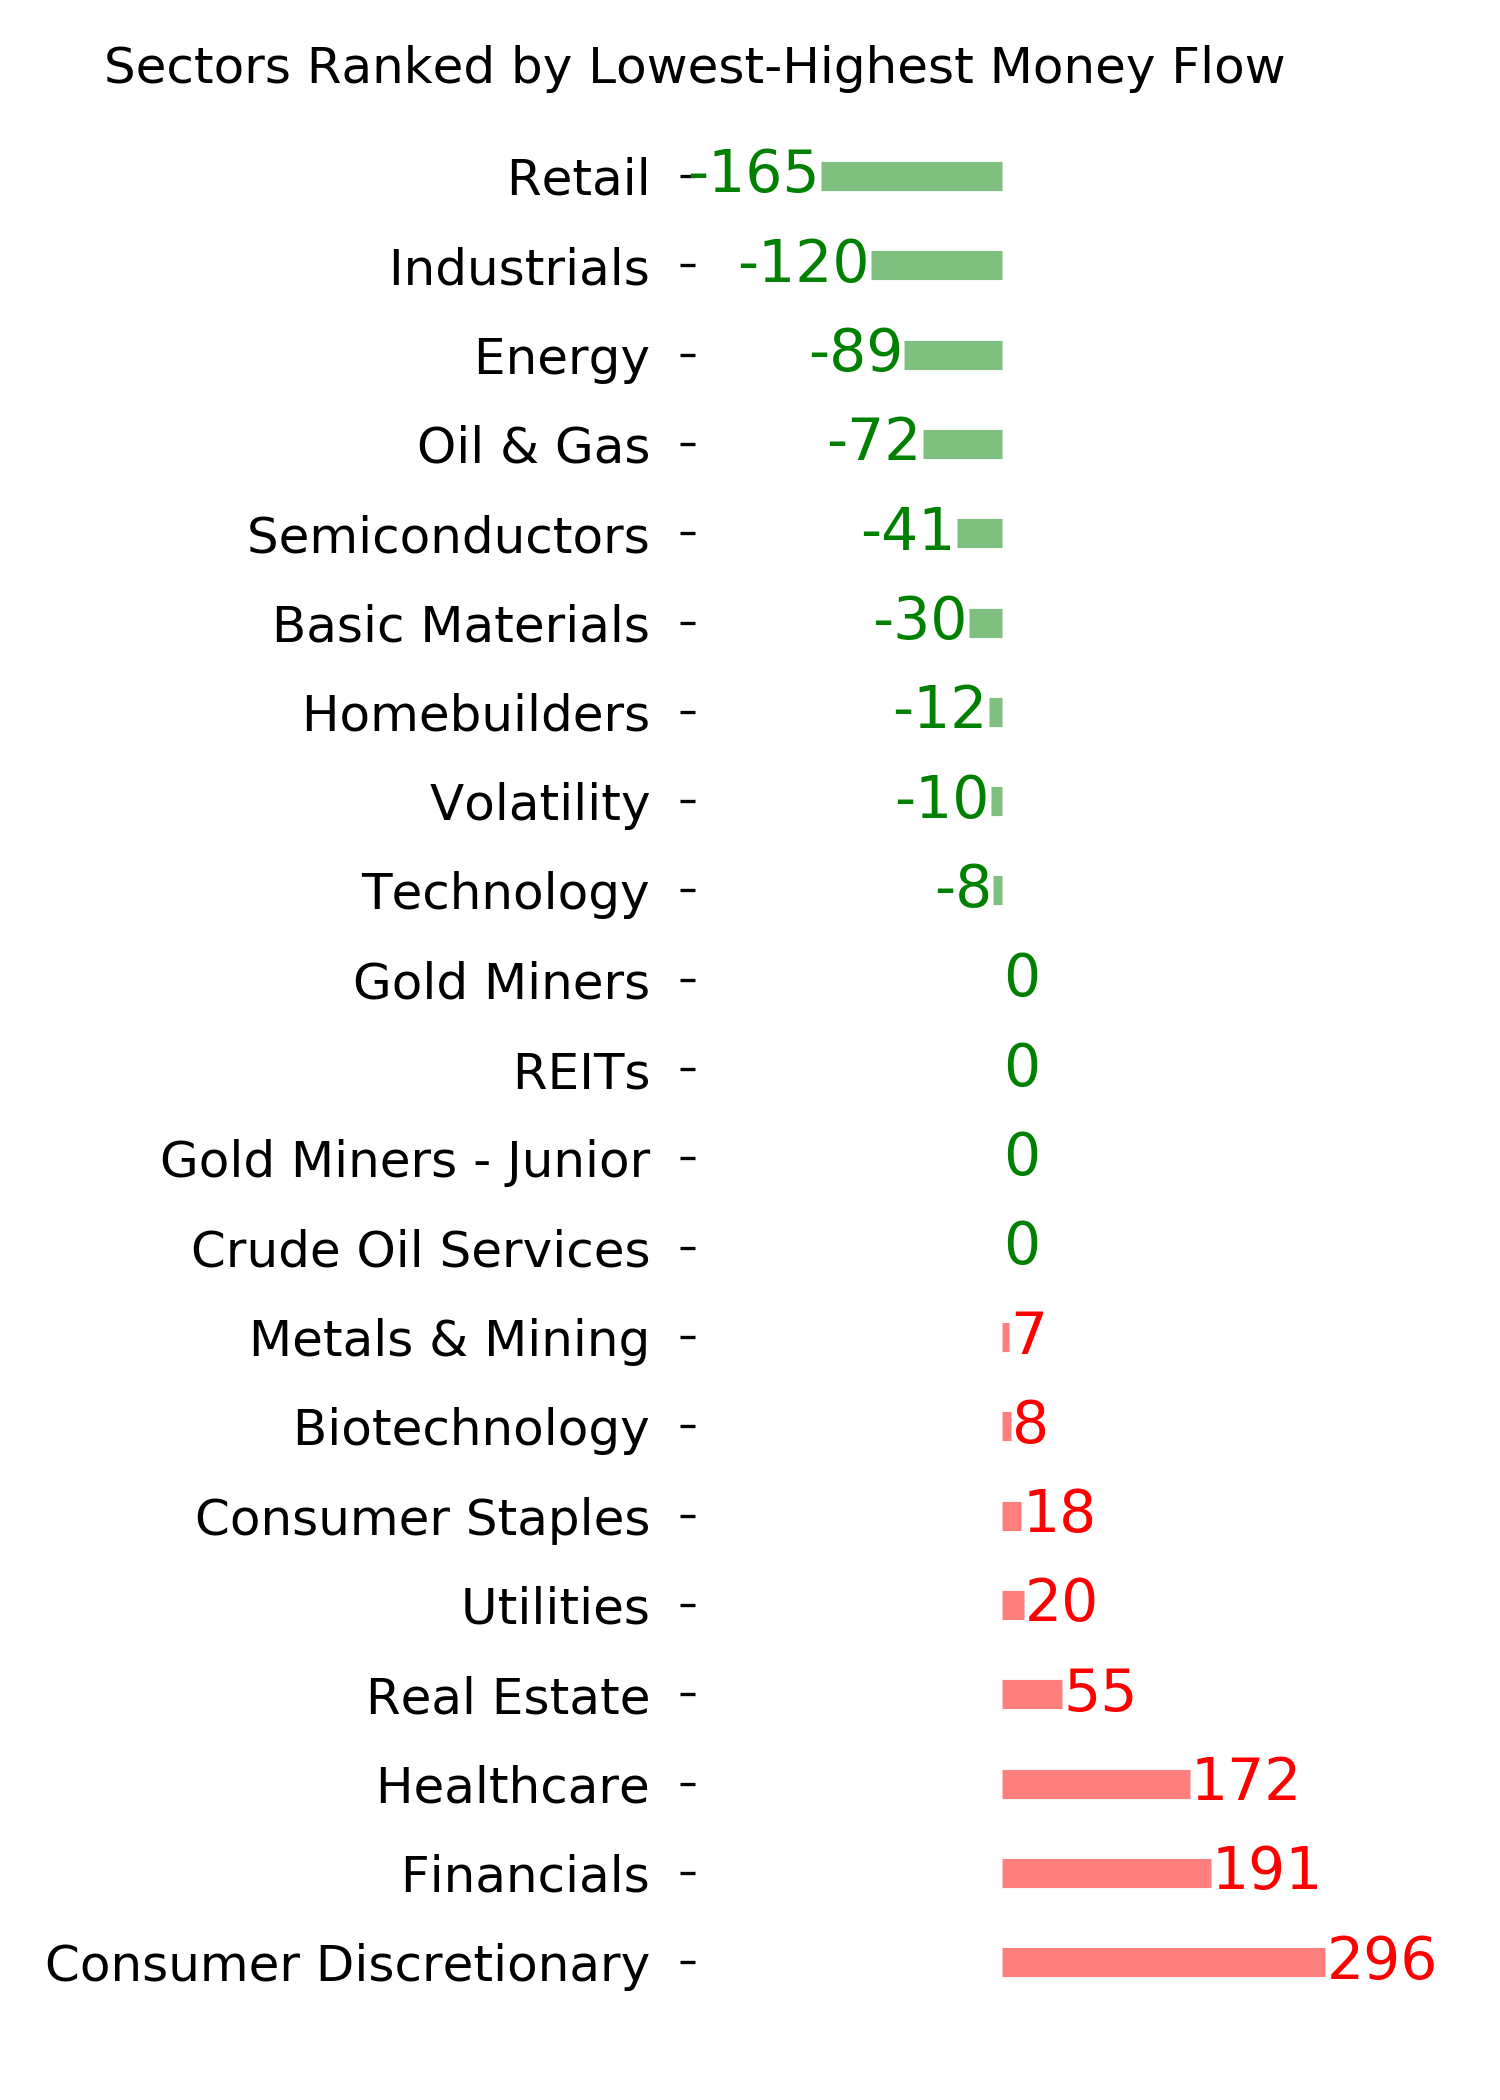
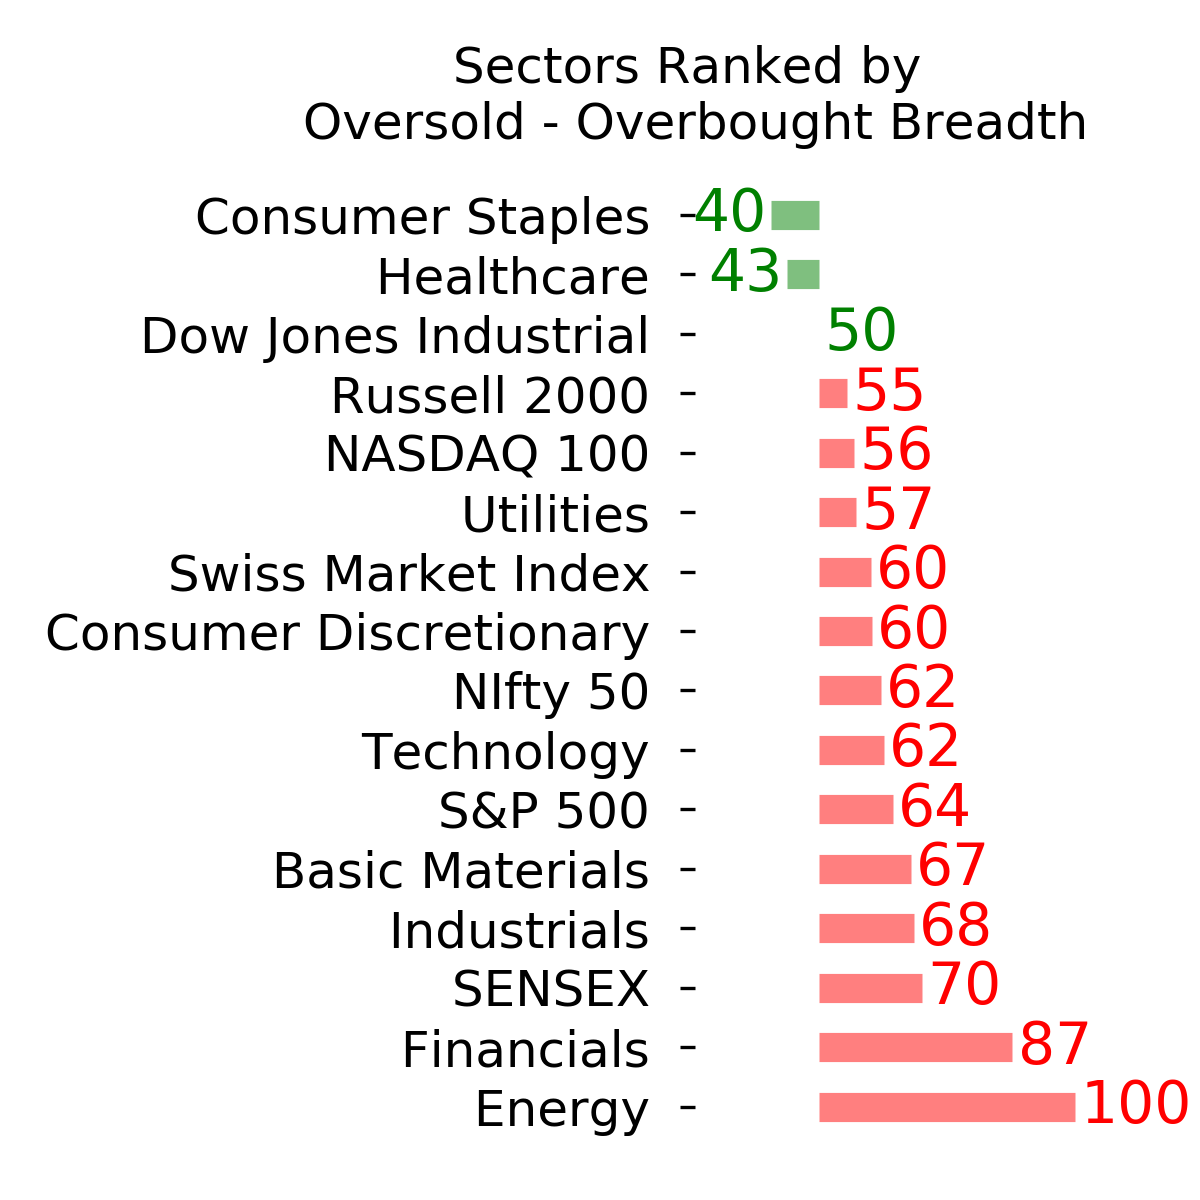
Ranks
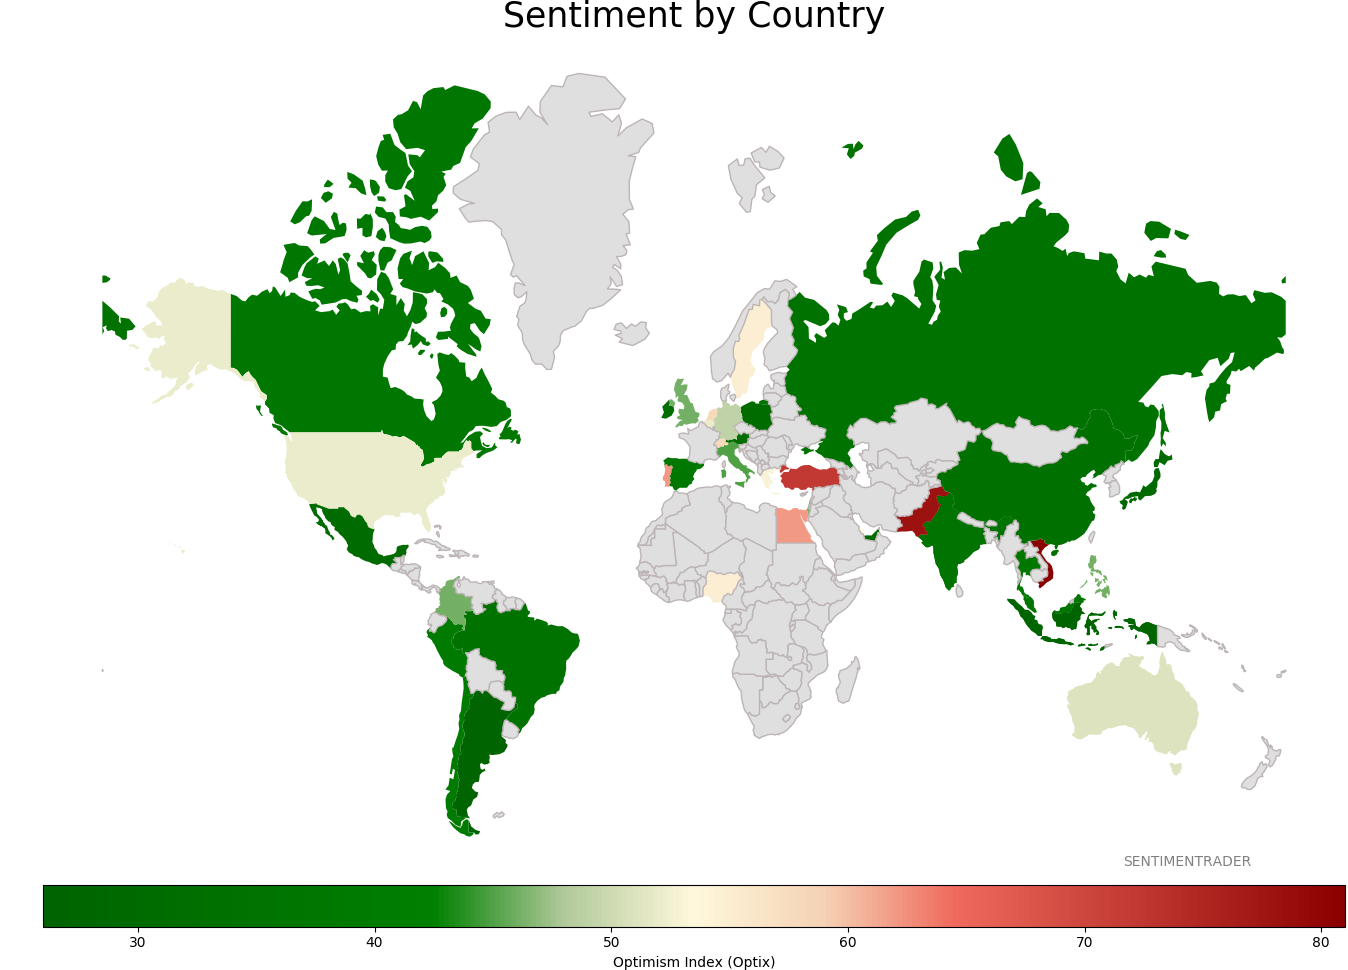
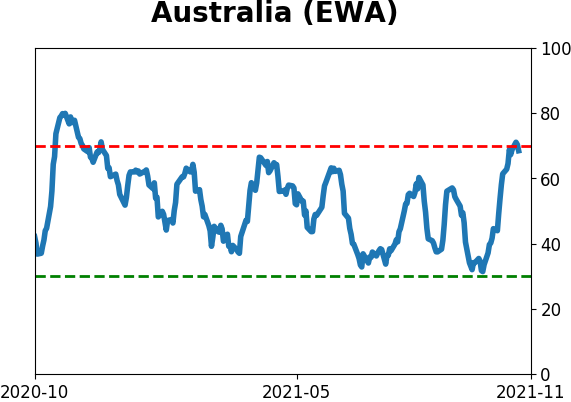
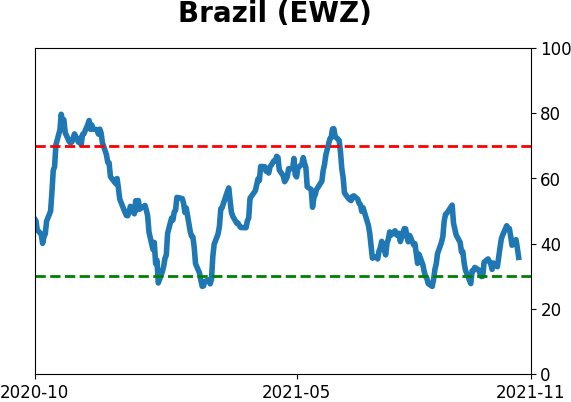
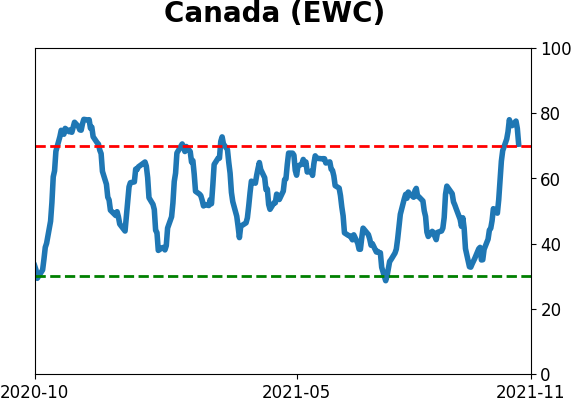
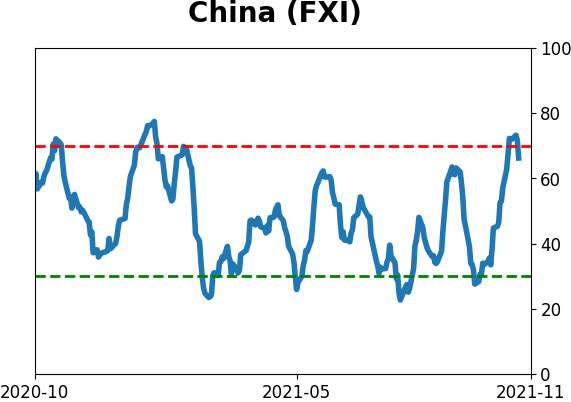
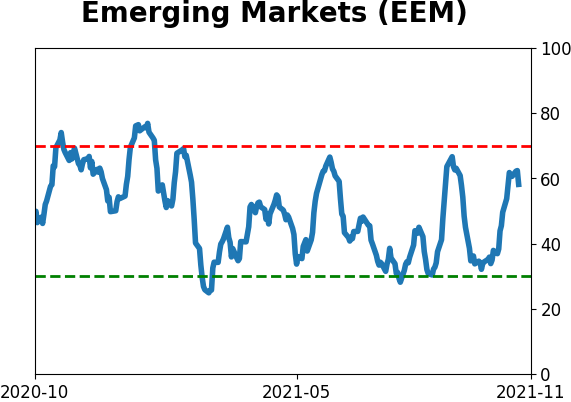
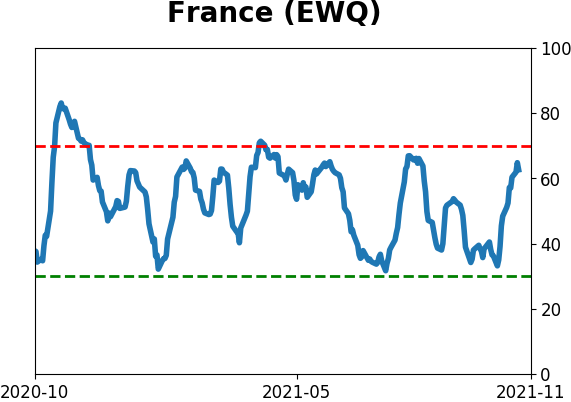
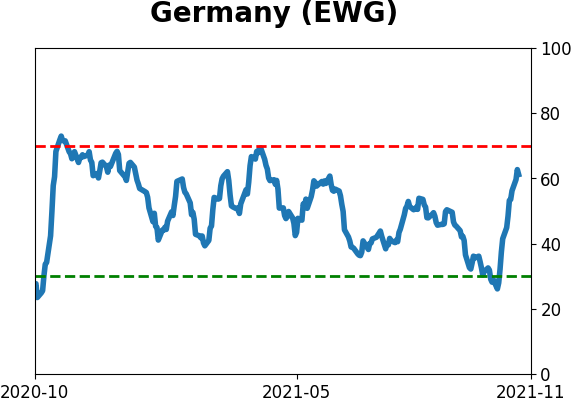
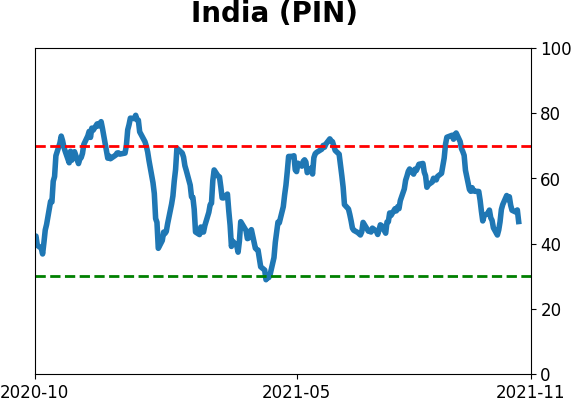
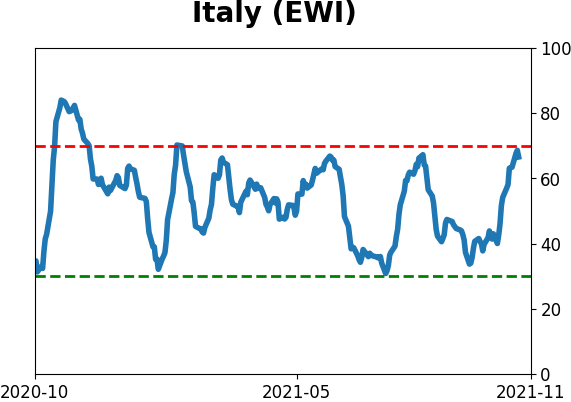
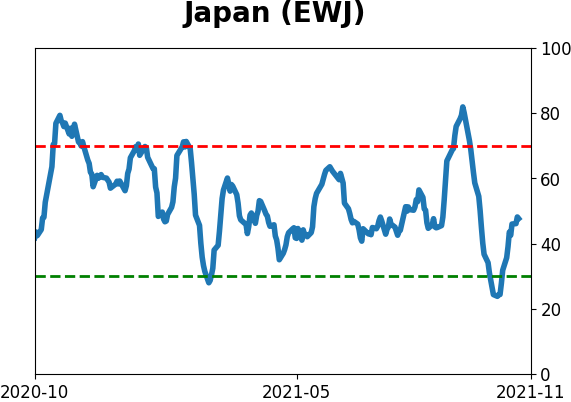
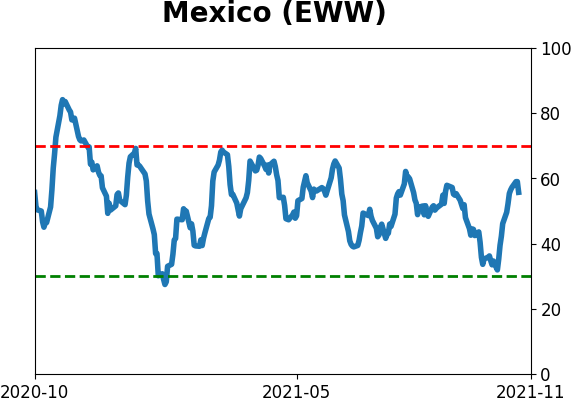
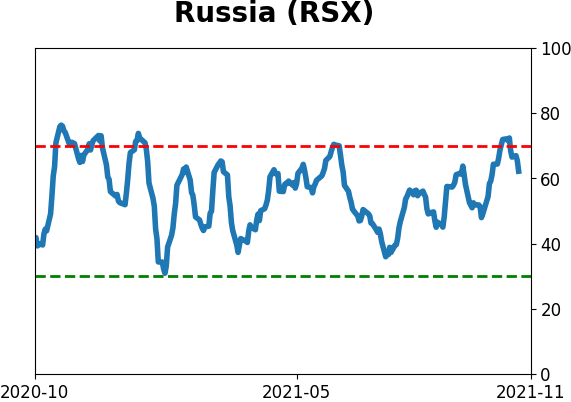
Sentiment Around The World
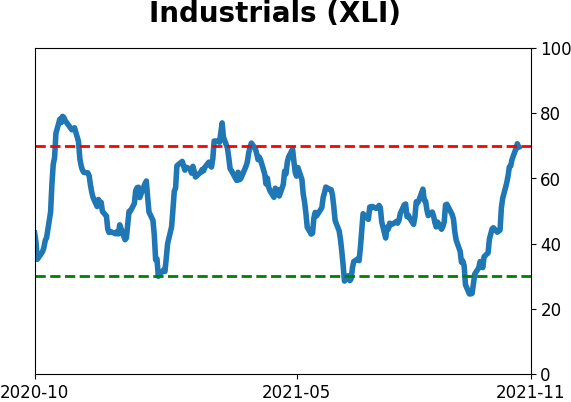
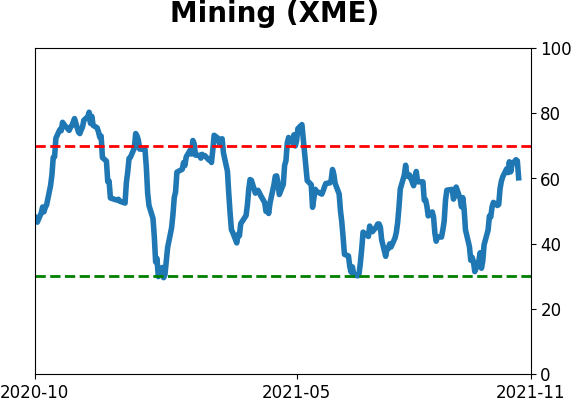
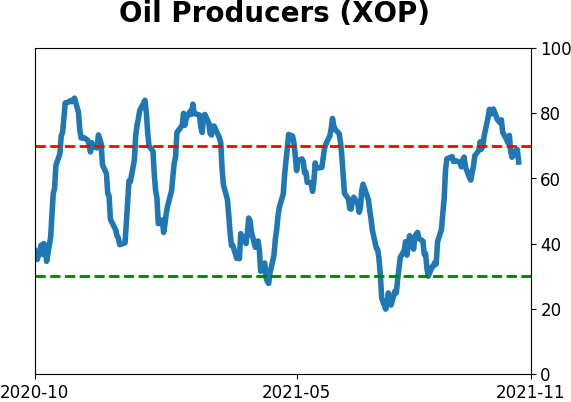
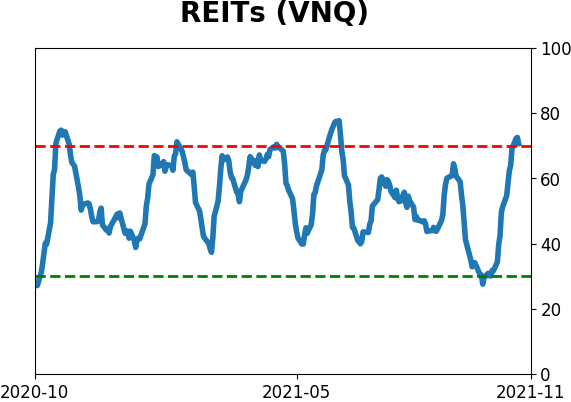
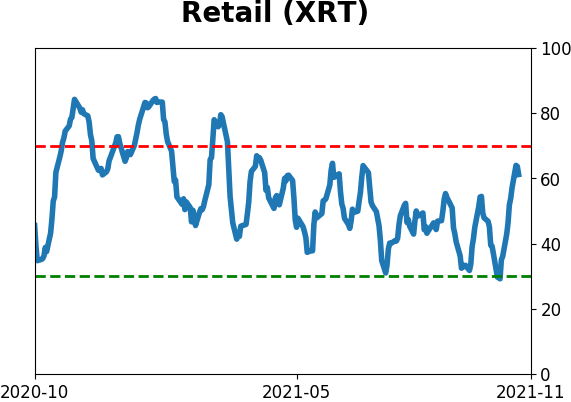
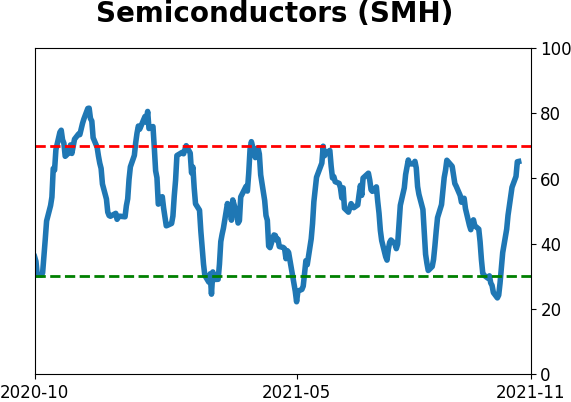
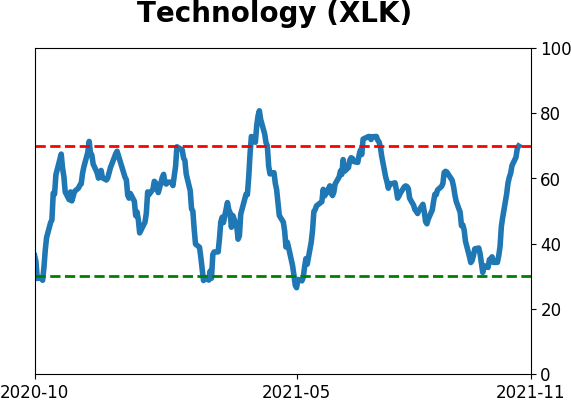
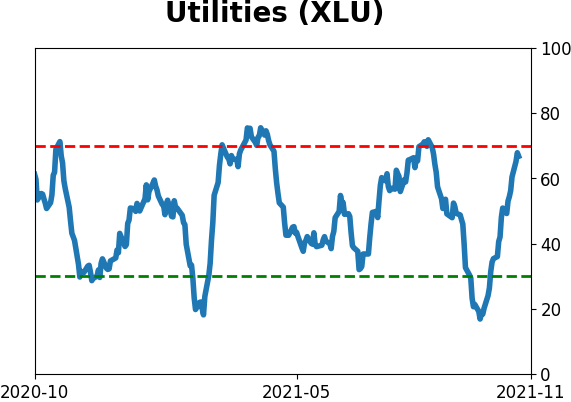
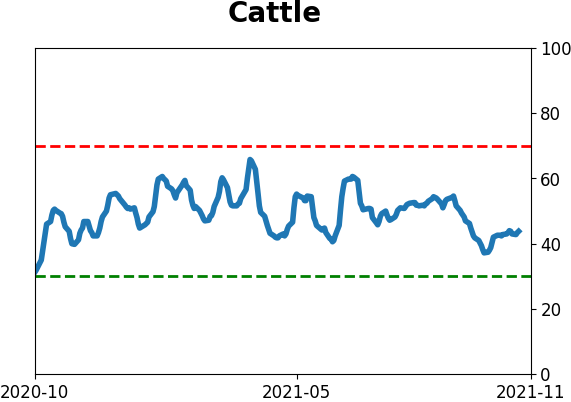
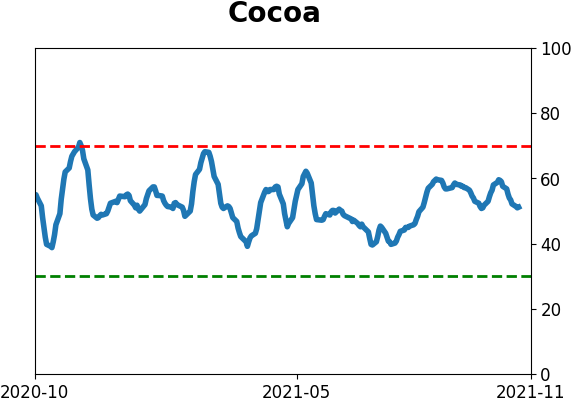
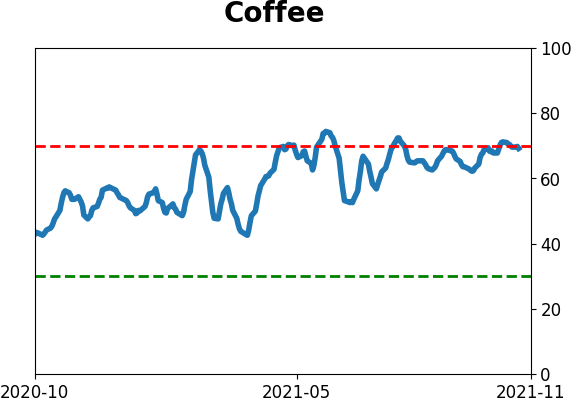
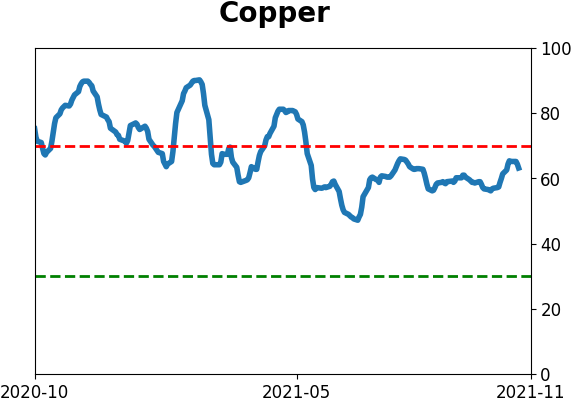
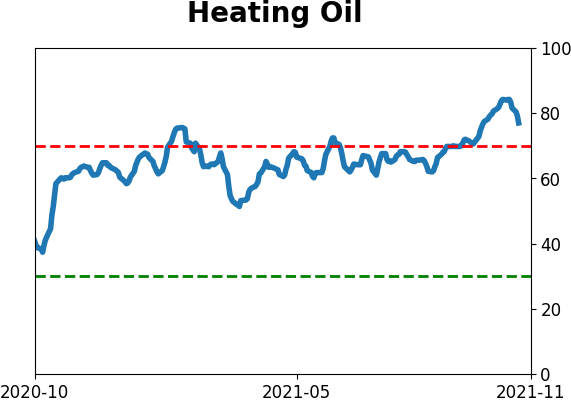
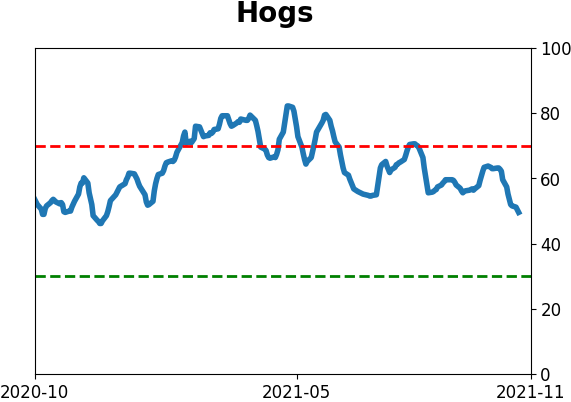
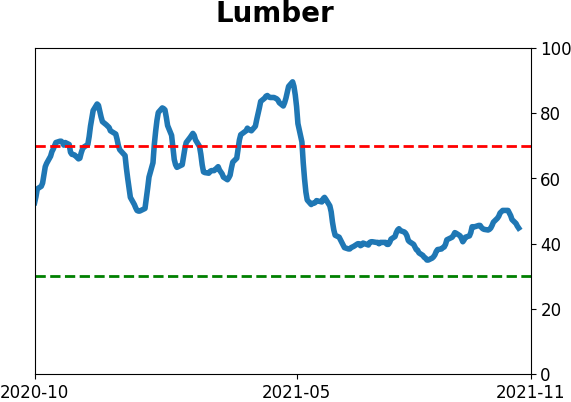
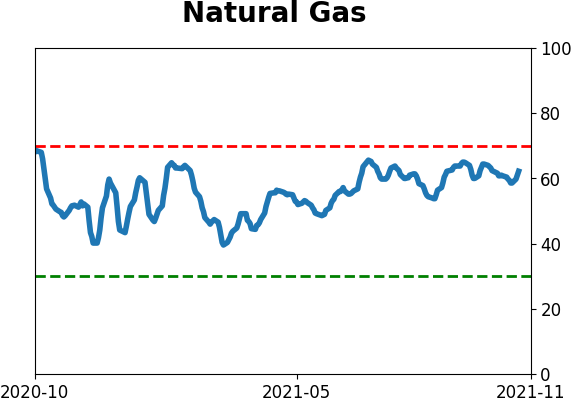
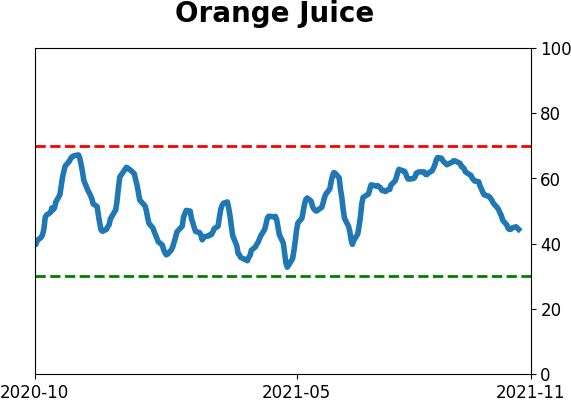
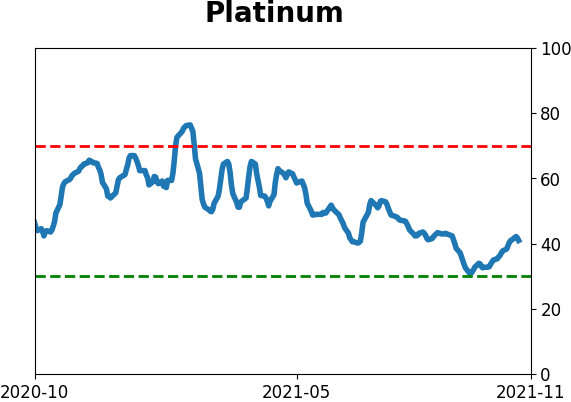
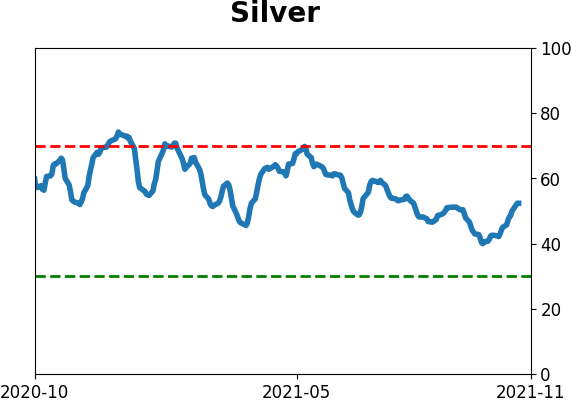
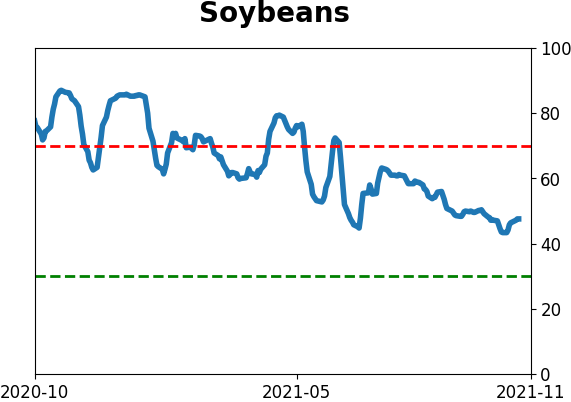
Optimism Index Thumbnails
|
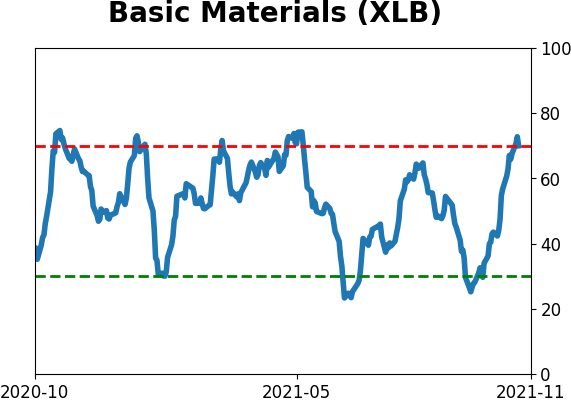
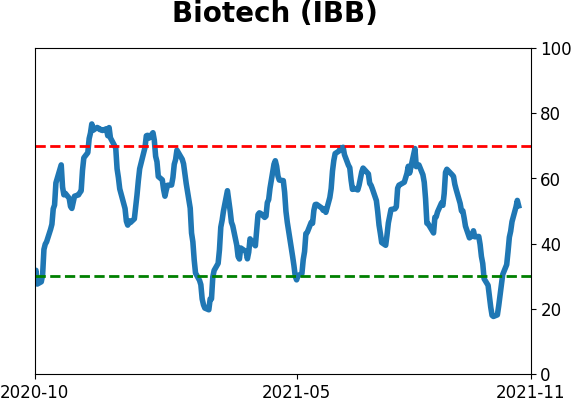
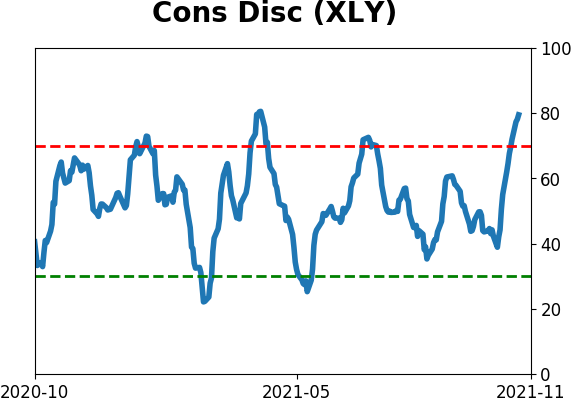
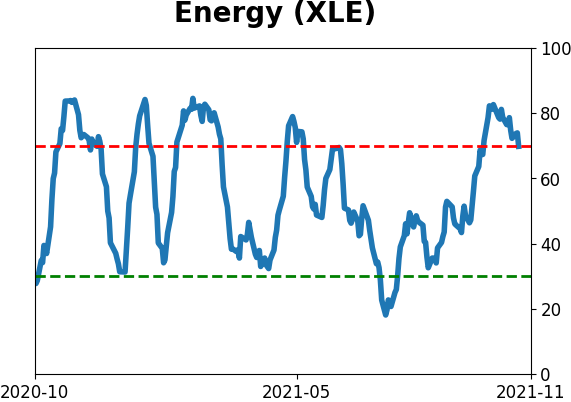
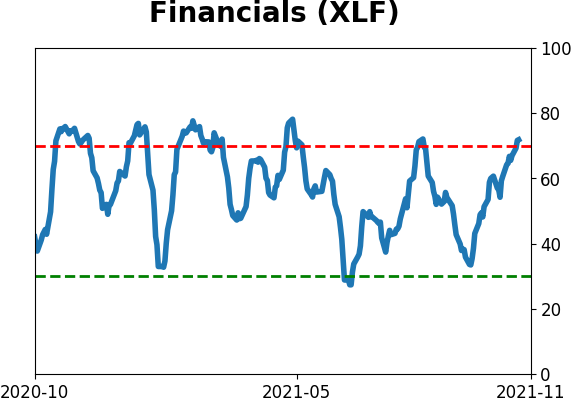
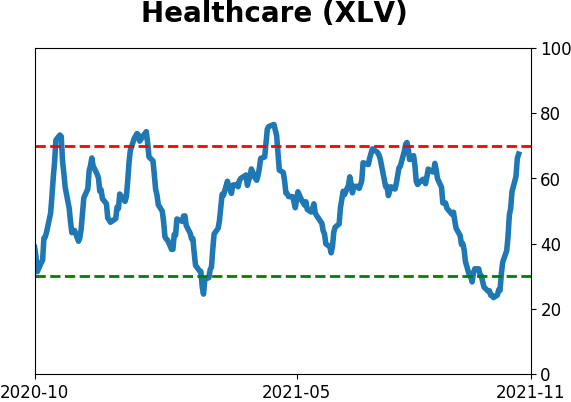
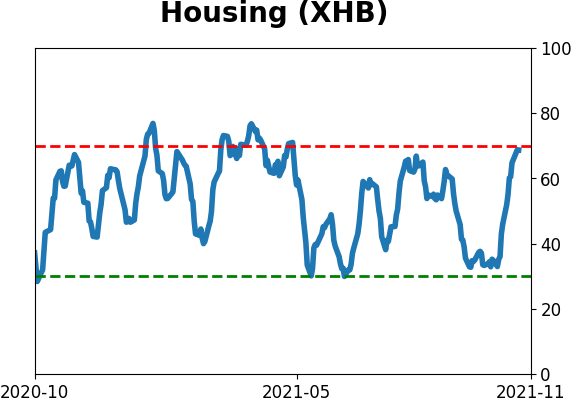
Sector ETF's - 10-Day Moving Average
|
|
|
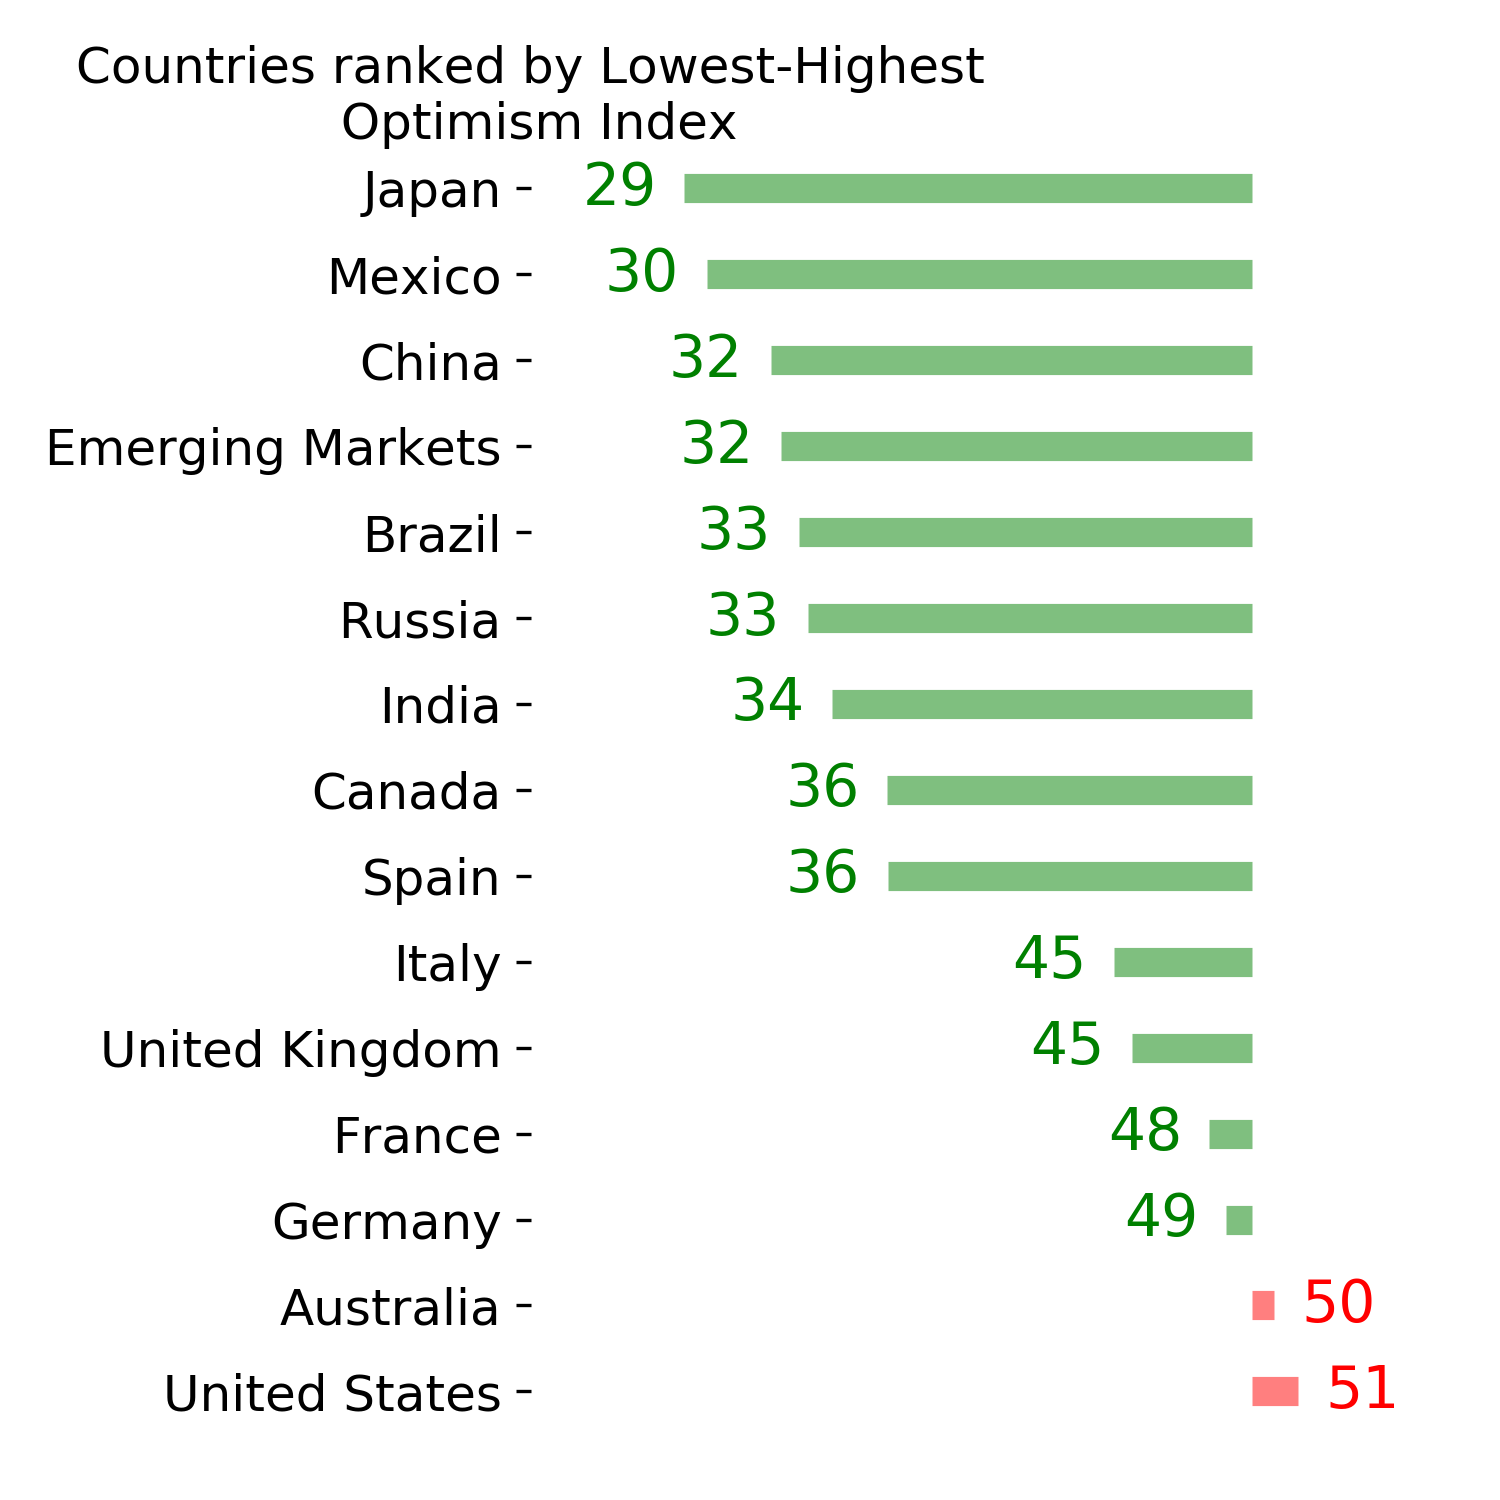
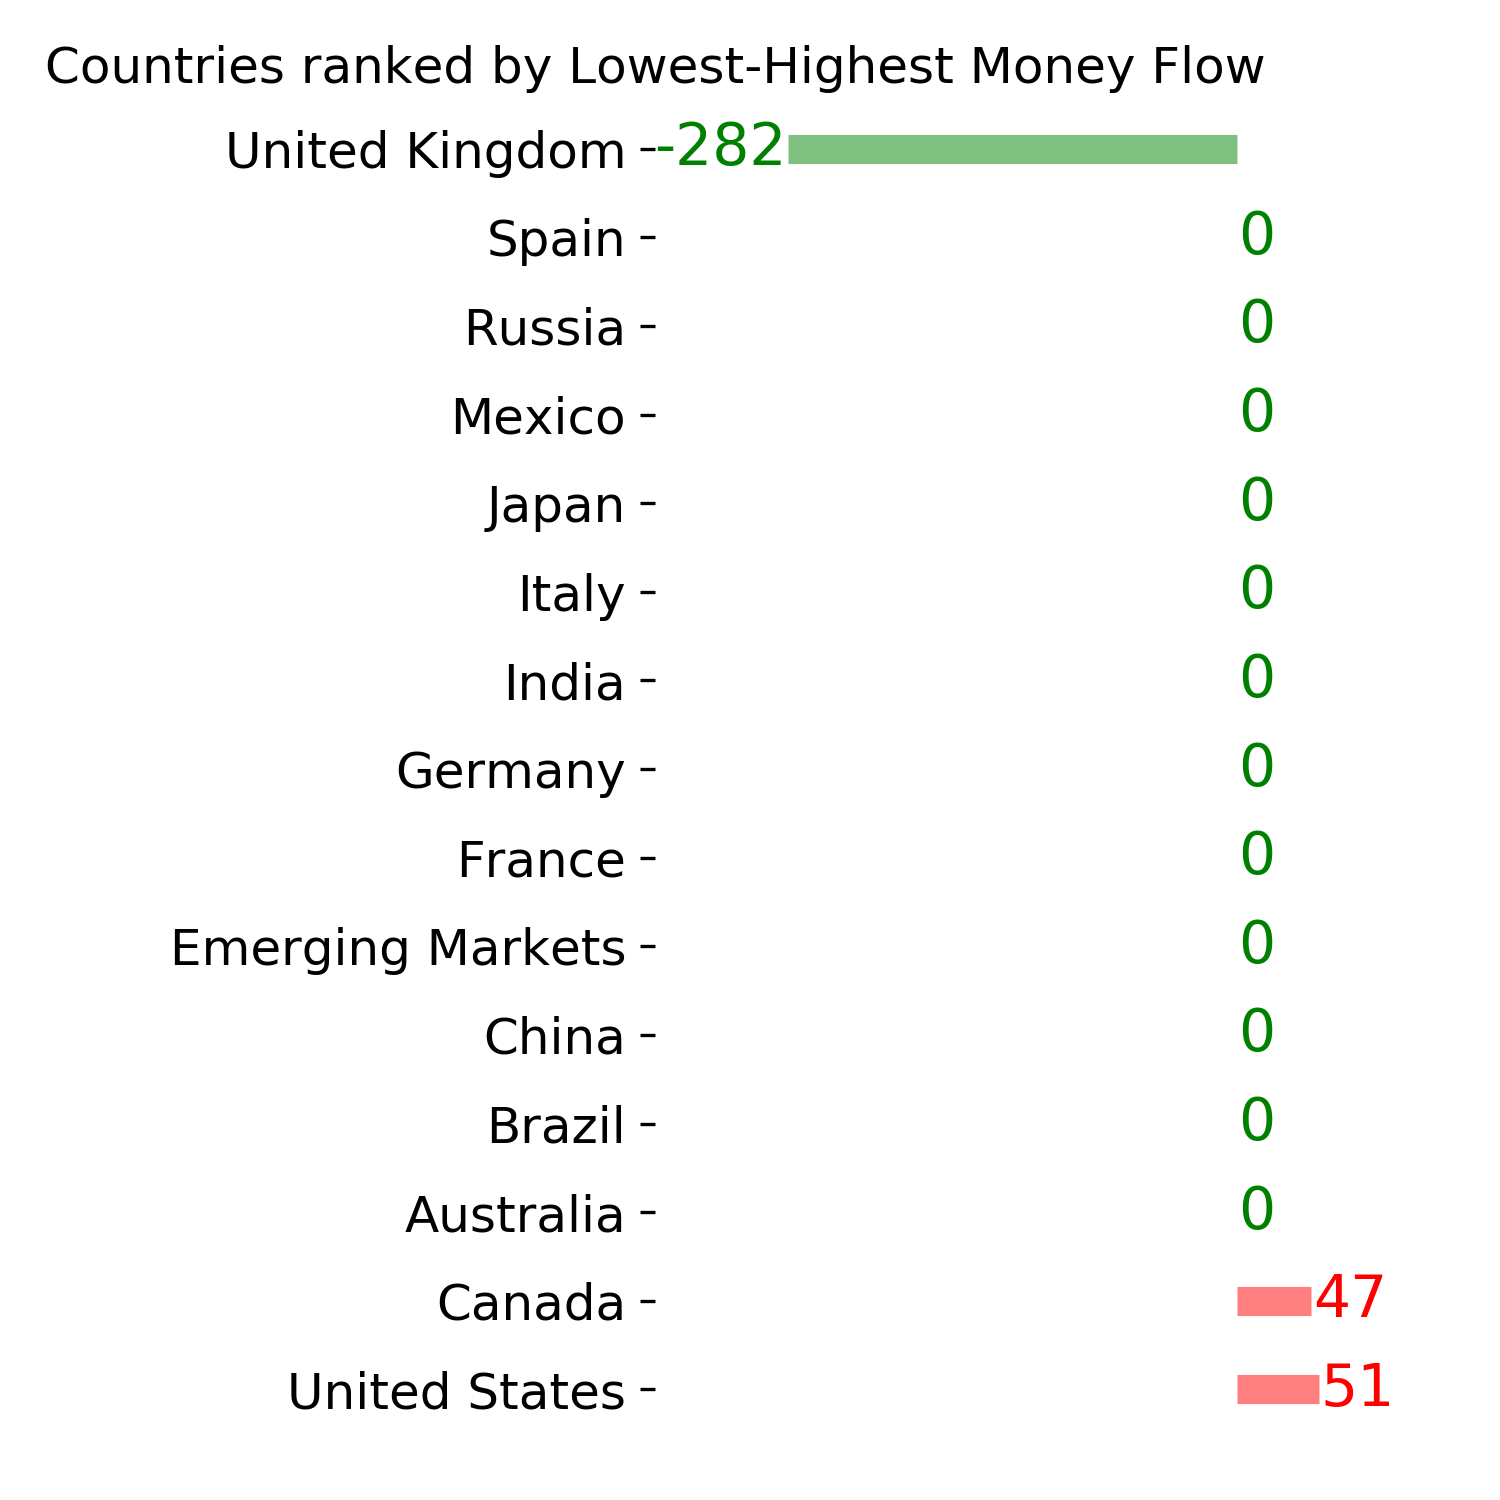
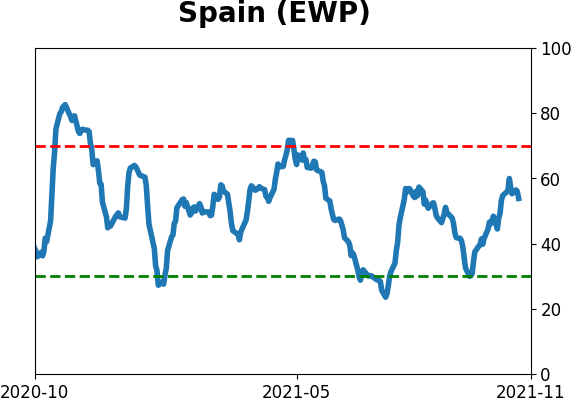
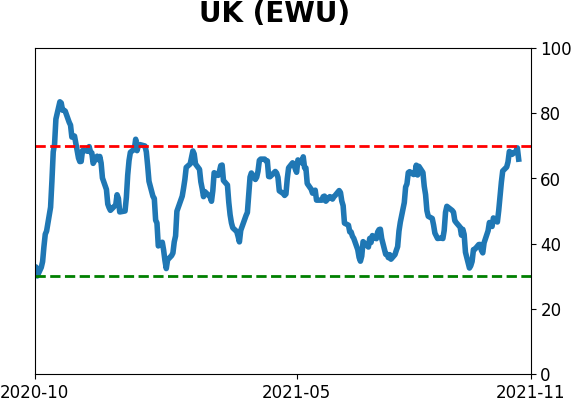
Country ETF's - 10-Day Moving Average
|
|
|
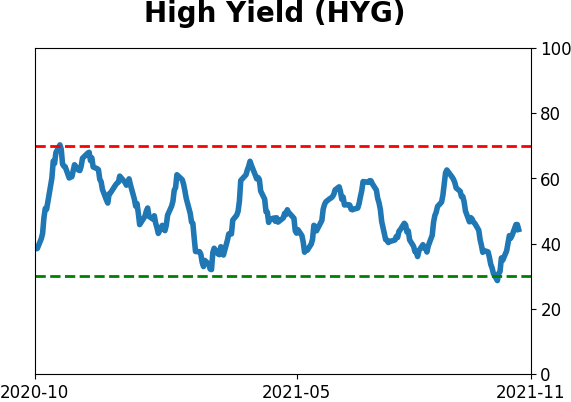
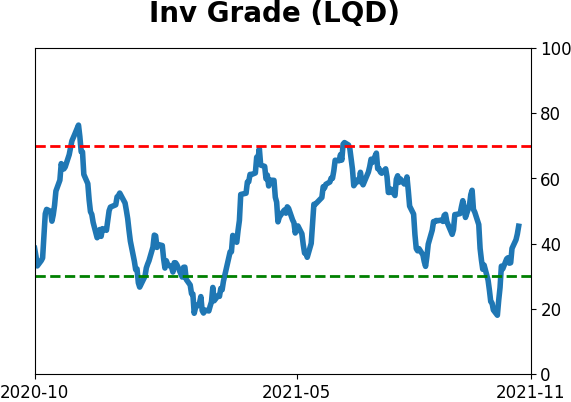
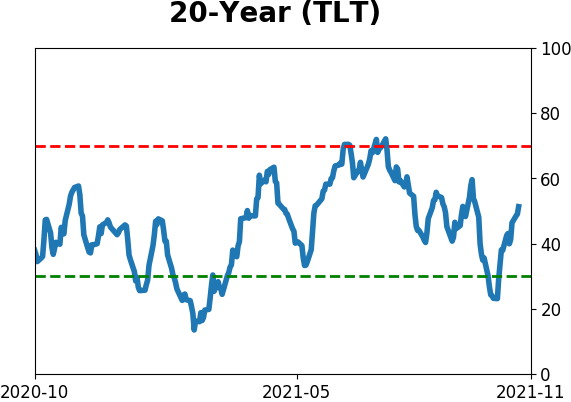
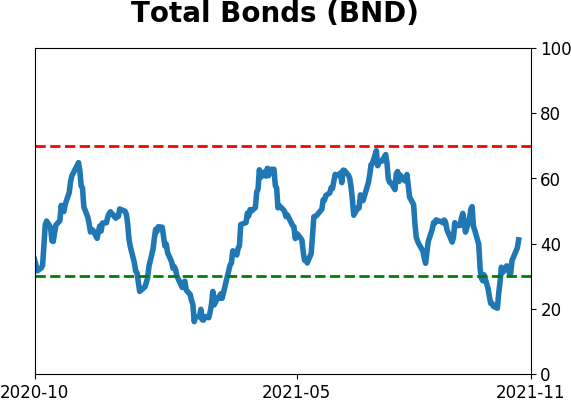
Bond ETF's - 10-Day Moving Average
|
|
|
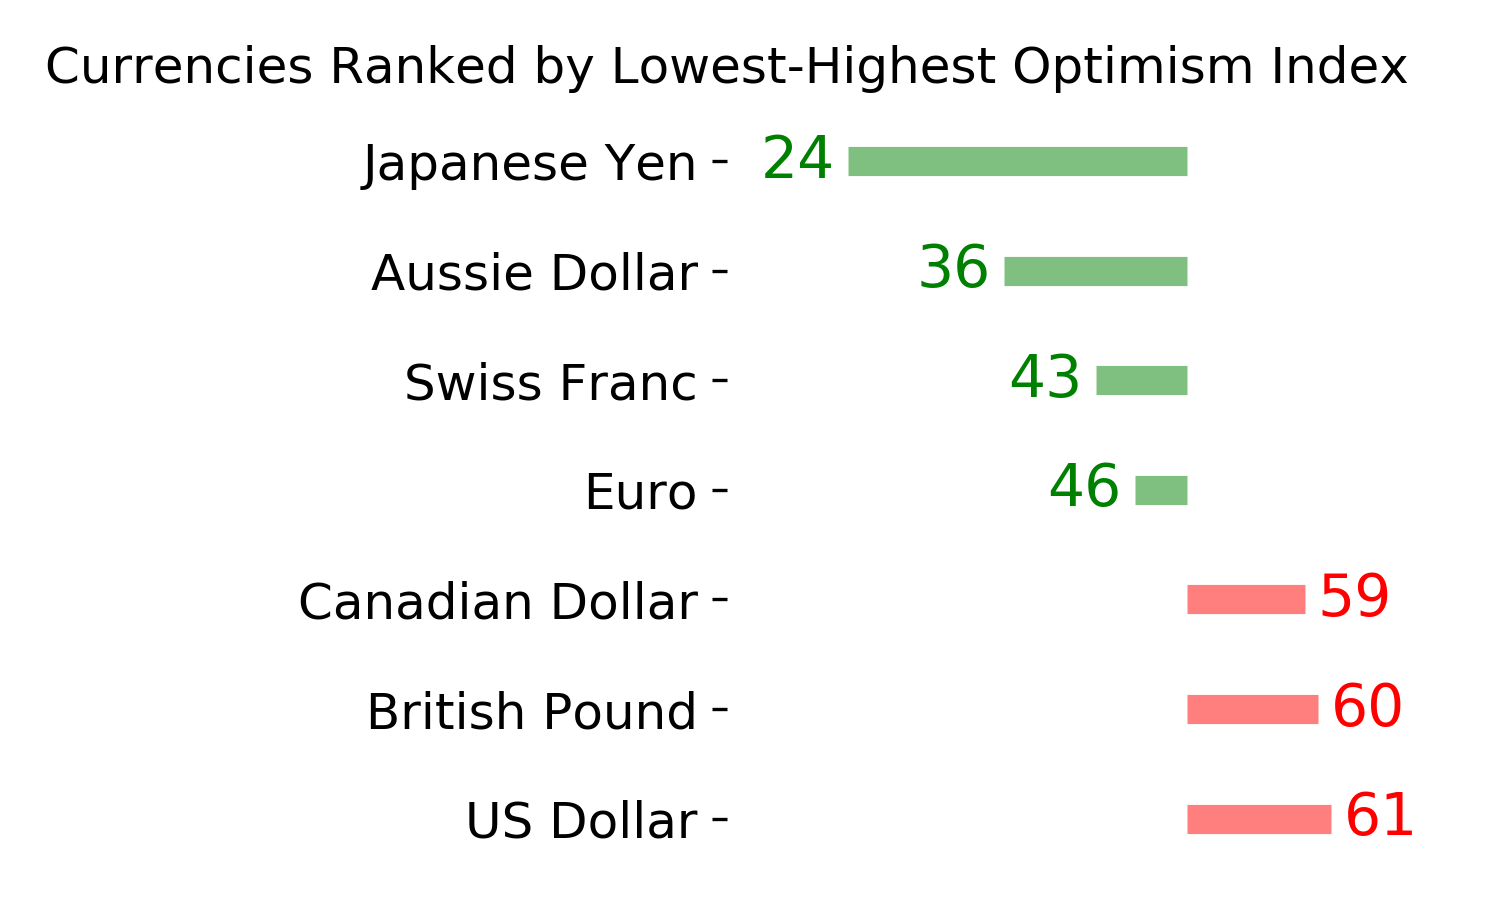
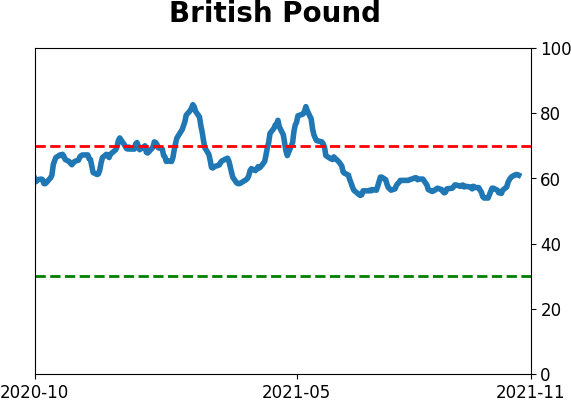
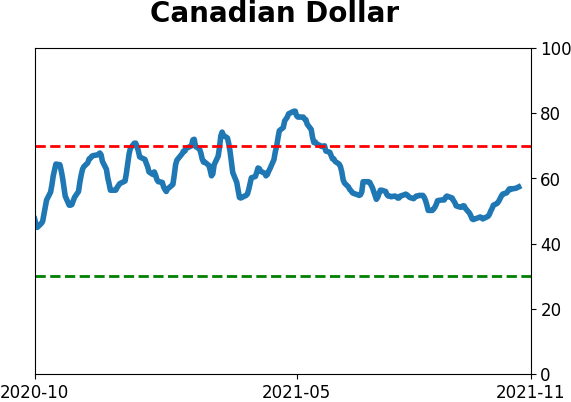
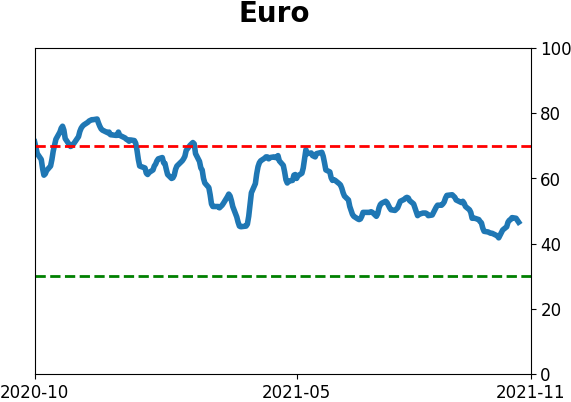
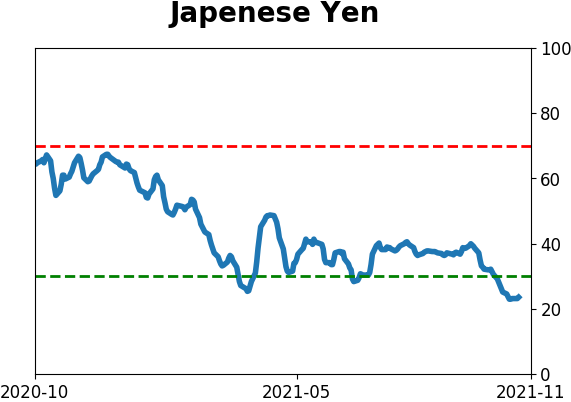
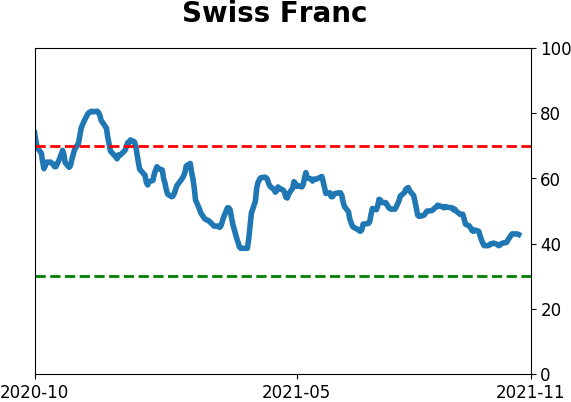
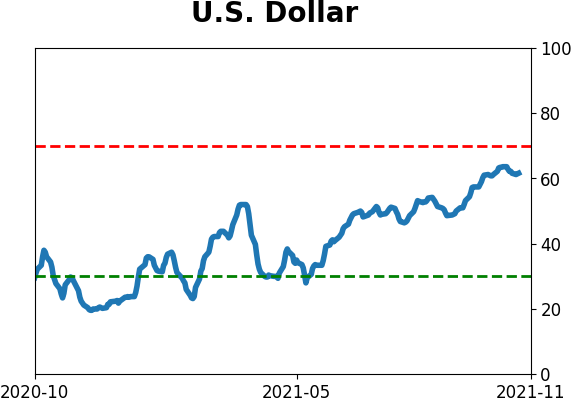
Currency ETF's - 5-Day Moving Average
|
|
|
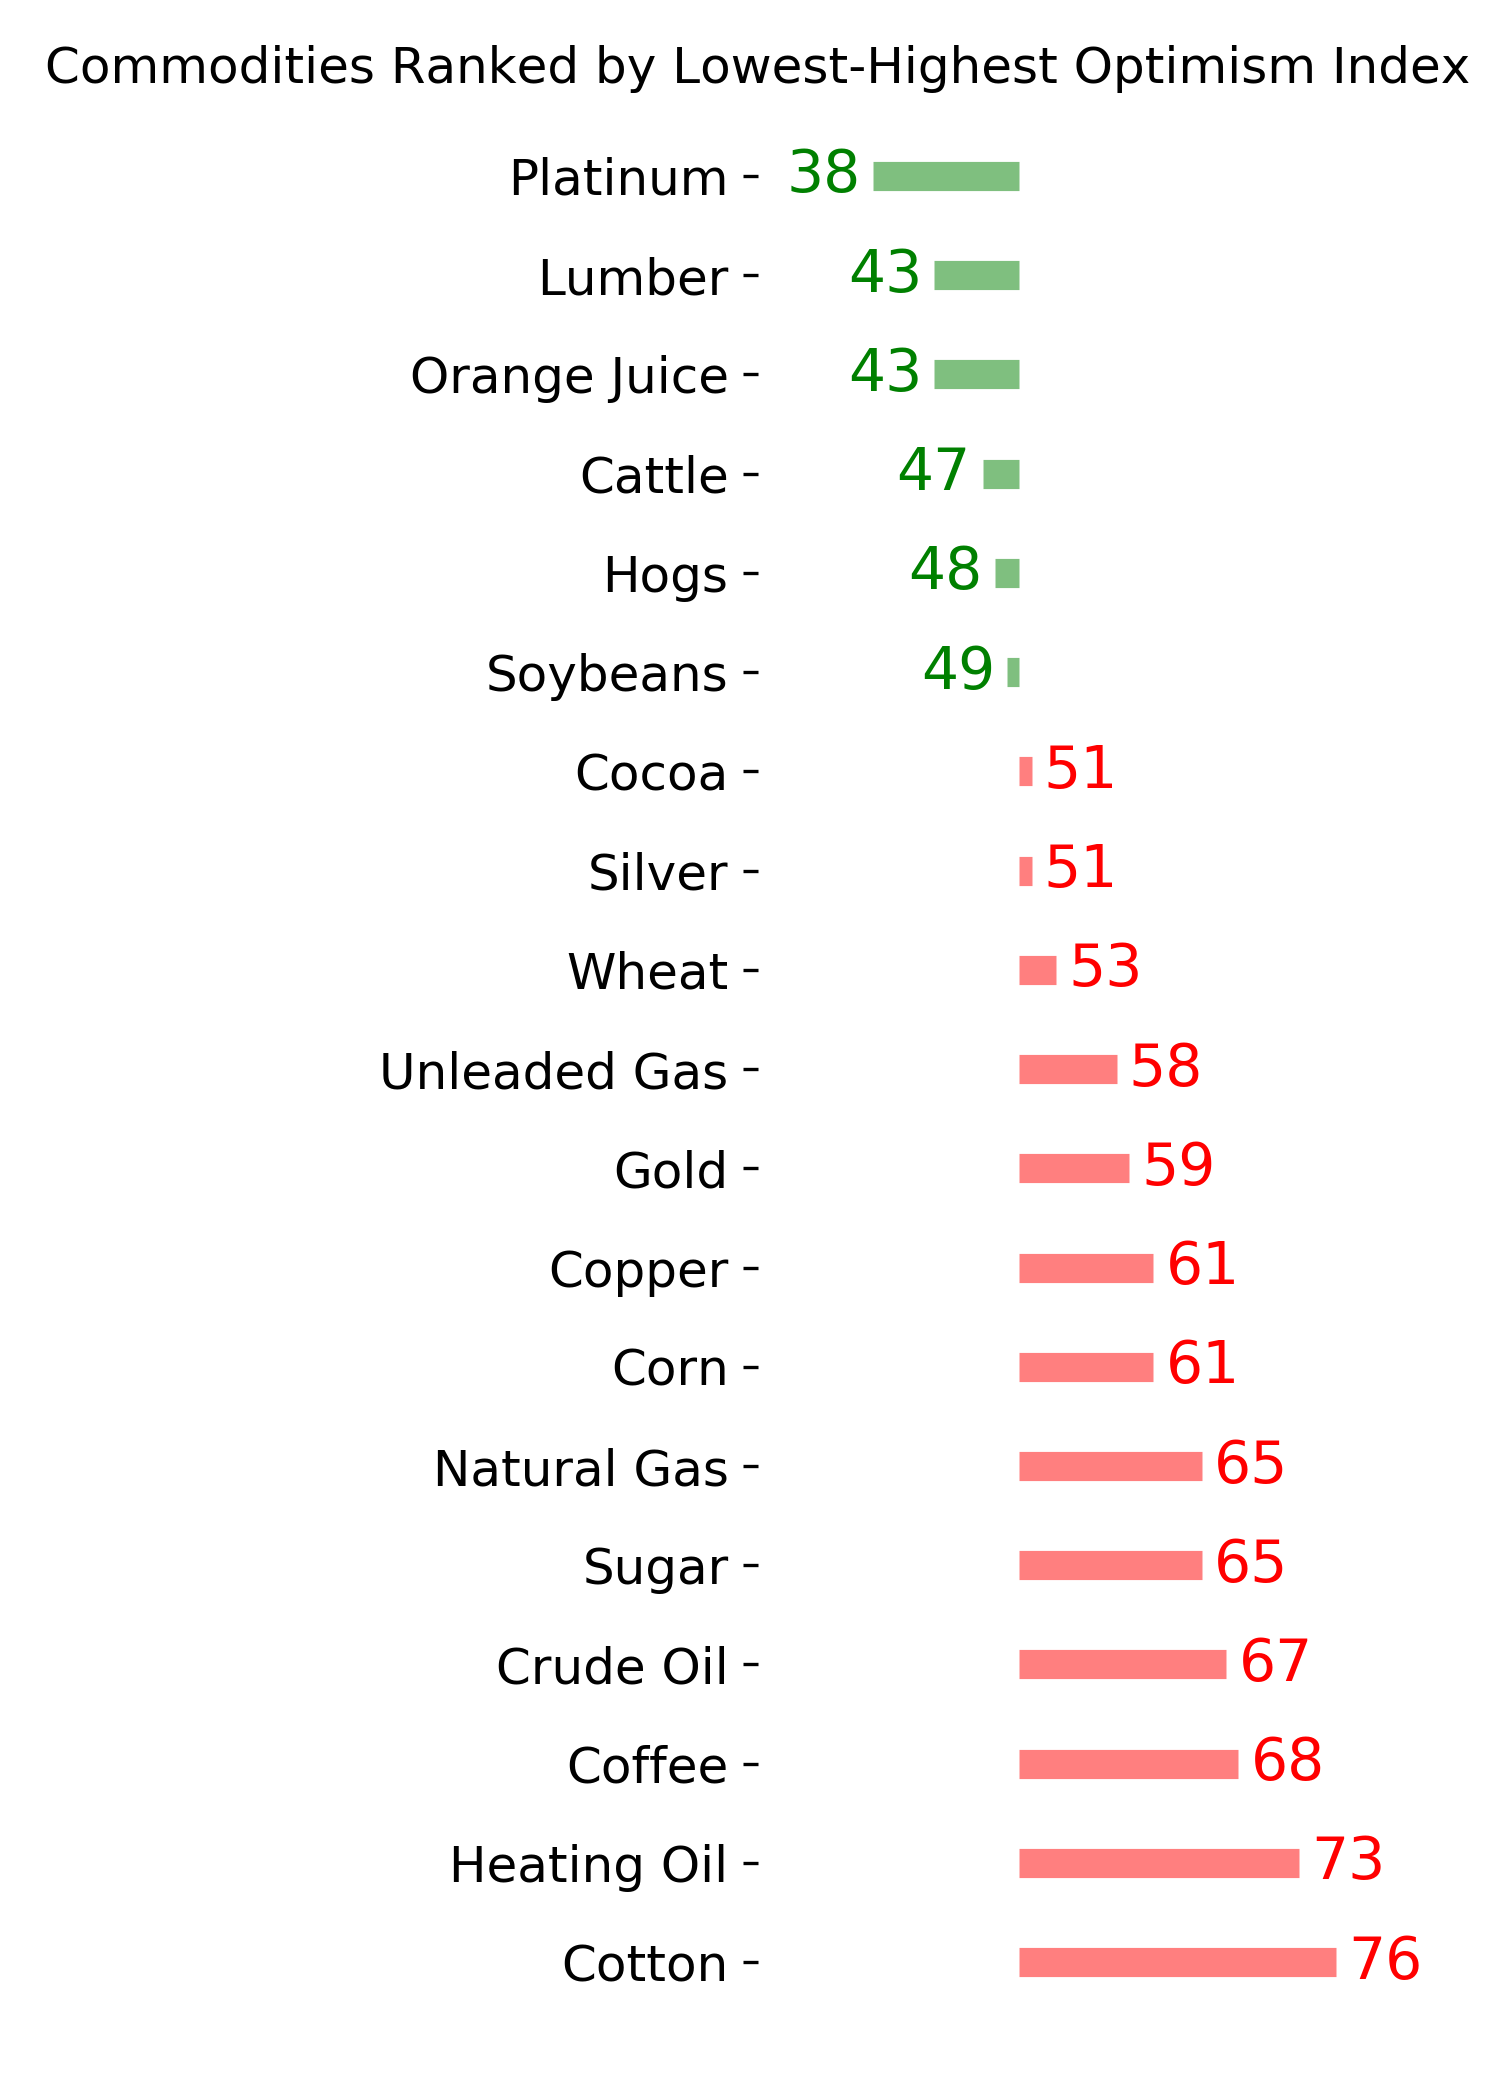
Commodity ETF's - 5-Day Moving Average
|
|