Headlines
|
|
It might be time to catch KOLD:
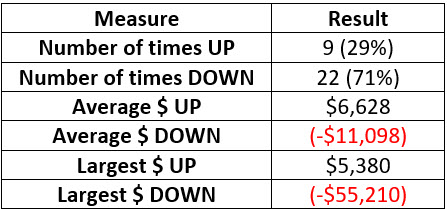
Natural gas is soon to enter a seasonally unfavorable period that has seen it decline 71% of the time since 1990. One of the simplest but most aggressive ways to trade it is buying an inverse, leveraged ETF. But be aware, it is not for the faint of heart.
Bottom Line:
STOCKS: Hold By early October, sentiment had reset. Several important momentum streaks ended, which has brought in buyers in the past, and seasonality turned positive. We're now seeing signs that sentiment has quickly shifted, especially among options traders. It's gotten to an extreme that has preceded weaker-than-average returns.
BONDS: Hold In late October, sentiment on bonds - from Treasuries to corporates - entered pessimistic territory. It's now starting to recover, with some quick moves in corporate bonds. We'll see if those bonds, in particular, can hold recent gains.
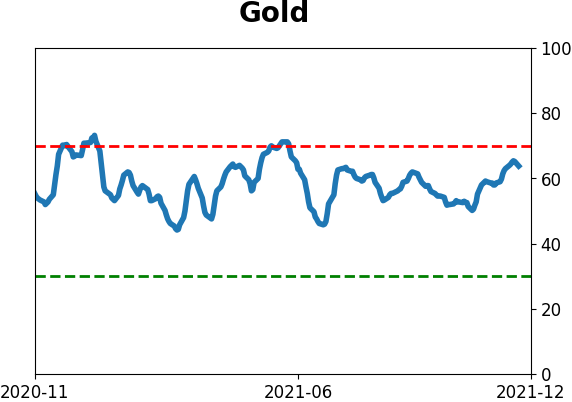
GOLD: Hold
Gold and miners were rejected after trying to recover above their 200-day averages in May. Some oversold extremes in breadth measures among miners triggered in late September, and they've recovered a bit since then. The group still has some proving to do.
|
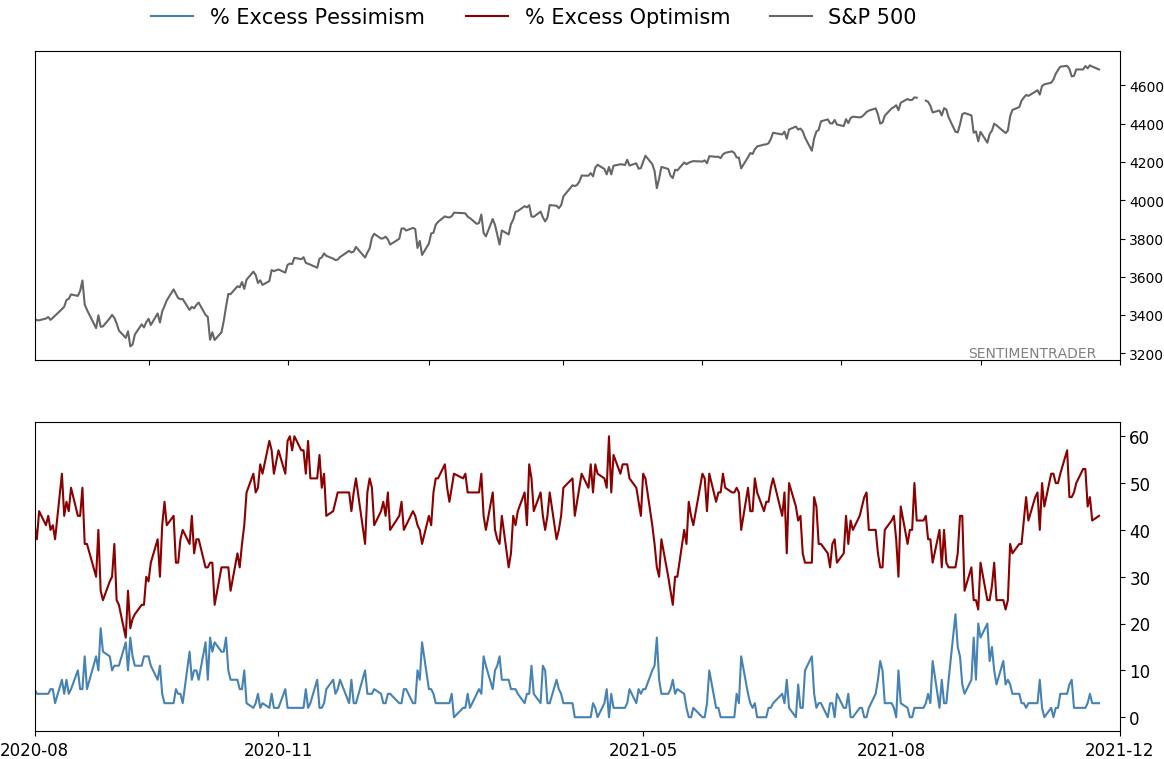
Smart / Dumb Money Confidence
|
Smart Money Confidence: 44%
Dumb Money Confidence: 60%
|
|
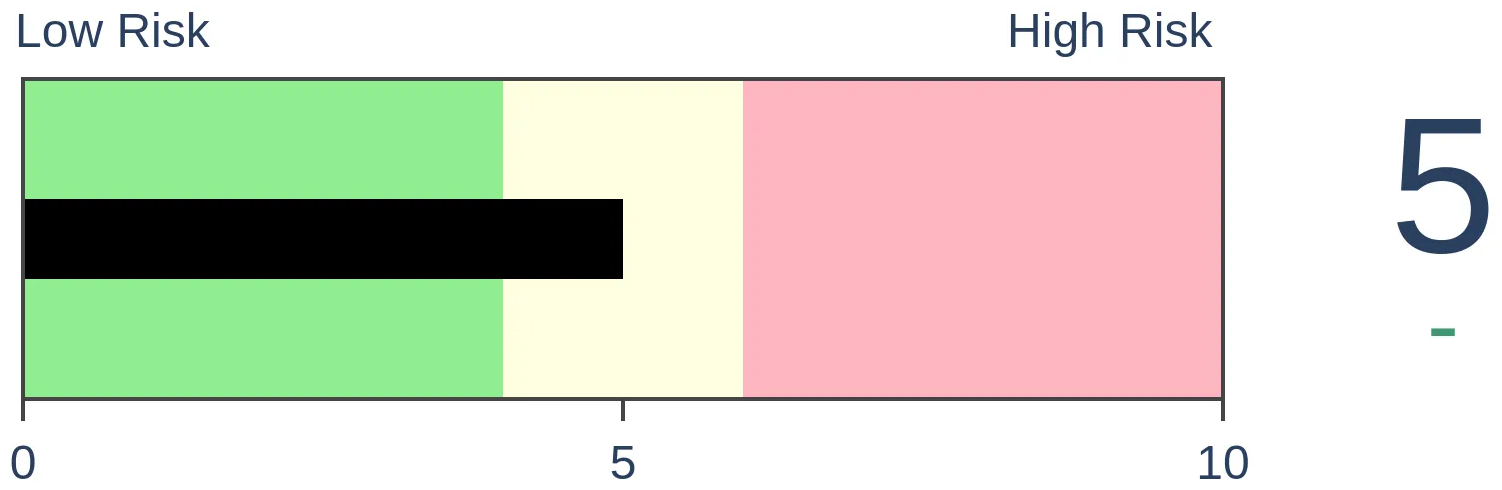
Risk Levels
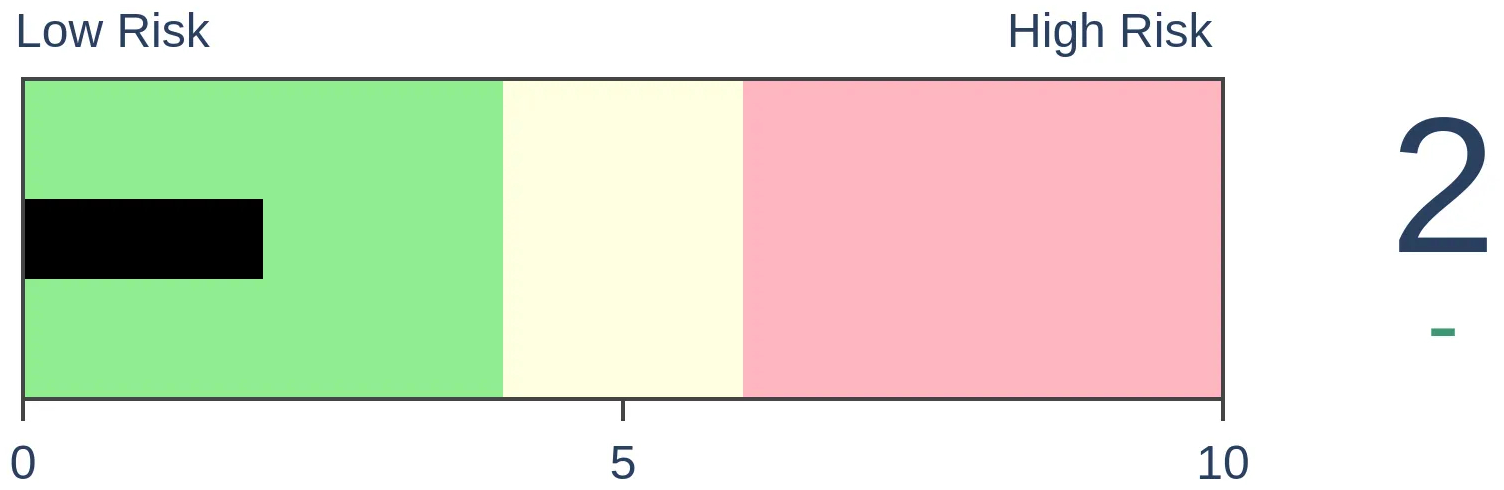
Stocks Short-Term
|
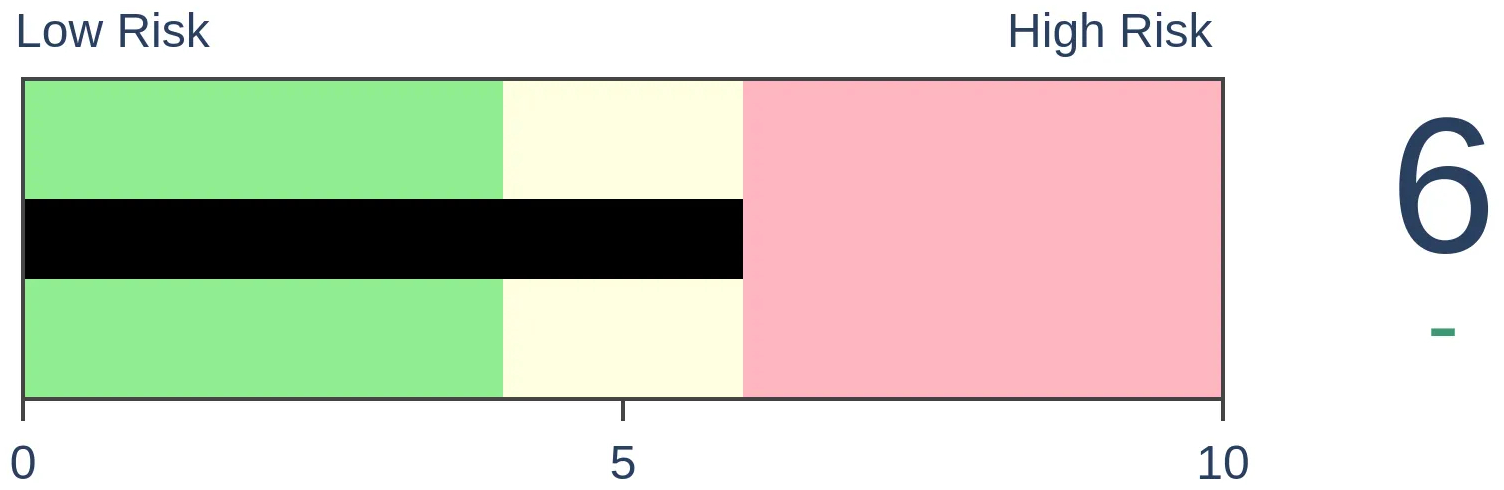
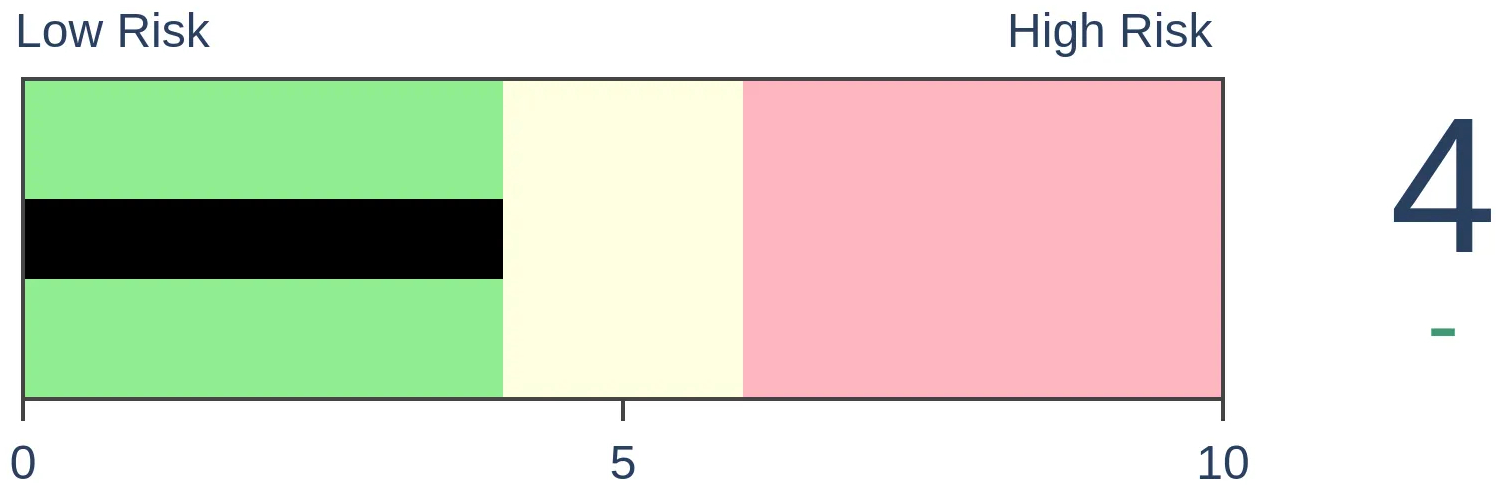
Stocks Medium-Term
|
|
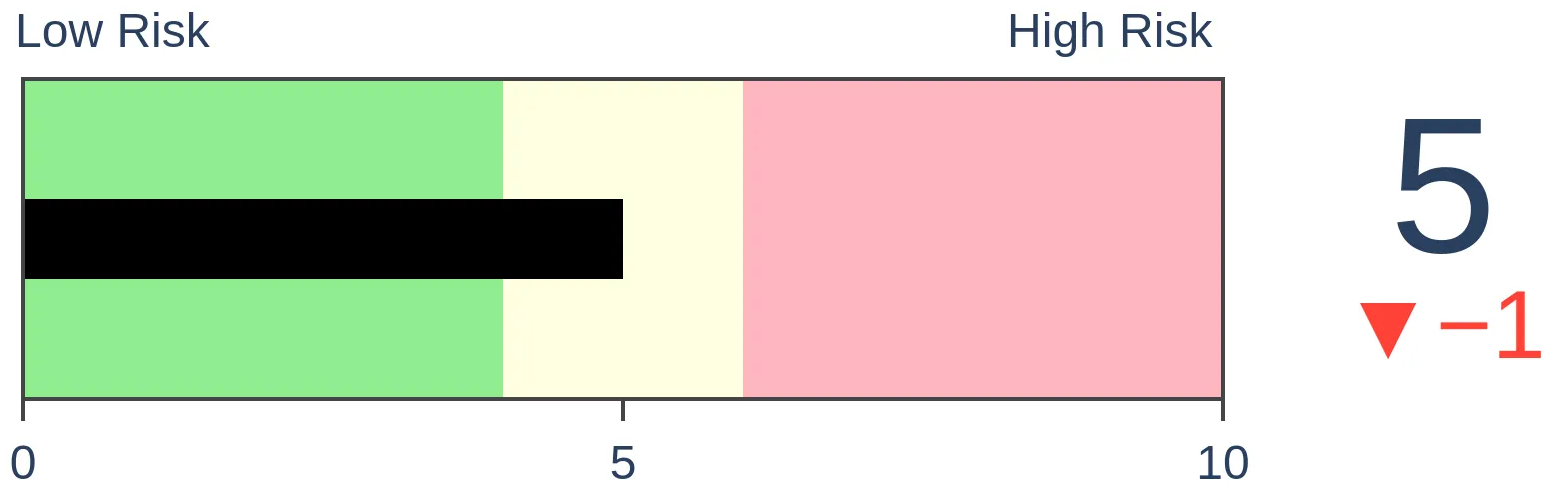
Bonds
|
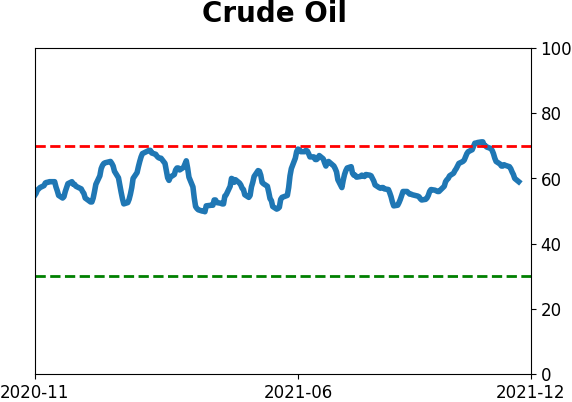
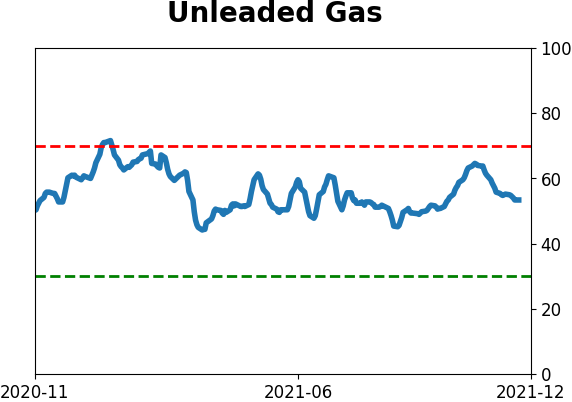
Crude Oil
|
|
Gold
|
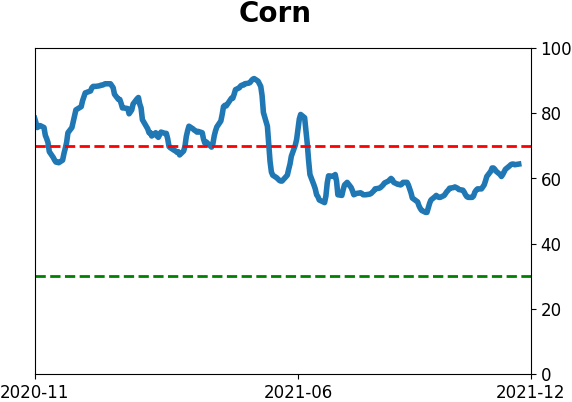
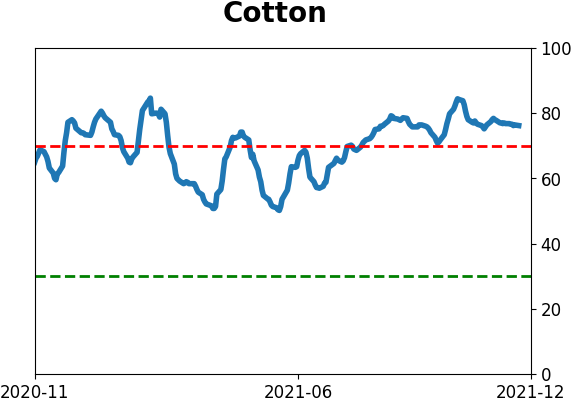
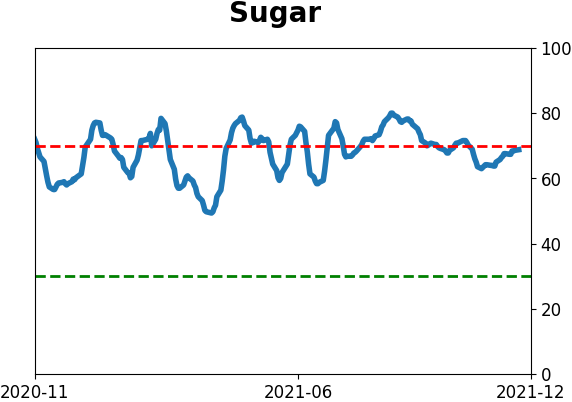
Agriculture

|
|
Research
By Jay Kaeppel
BOTTOM LINE
Natural gas is soon to enter a seasonally unfavorable period that has seen it decline 71% of the time since 1990. One of the simplest but most aggressive ways to trade it is buying an inverse, leveraged ETF. But be aware, it is not for the faint of heart.
FORECAST / TIMEFRAME
None
|
Key Points
- Natural gas is entering a seasonally unfavorable period
- Many traders will prefer to short natural gas futures or trade options on ETF ticker UNG
- Implied volatility for UNG options is presently elevated
- A low-cost alternative might be to trade the KOLD ETF
An unfavorable seasonal period
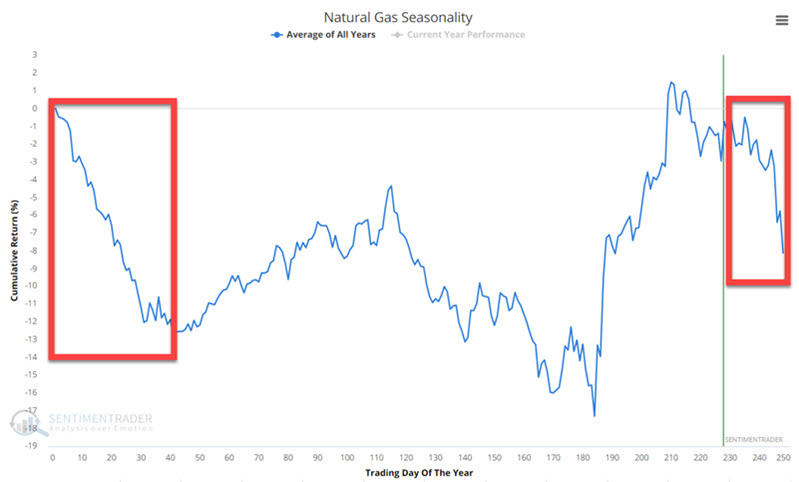
The chart below displays the annual seasonal trend for natural gas futures. Between trading day of the year (TDY) #230 and TDY #31 of the following year is often a period of price weakness.
The chart below displays the cumulative $ +(-) a trader might have experienced holding long natural gas futures ONLY during this seasonally unfavorable period every year since 1991.
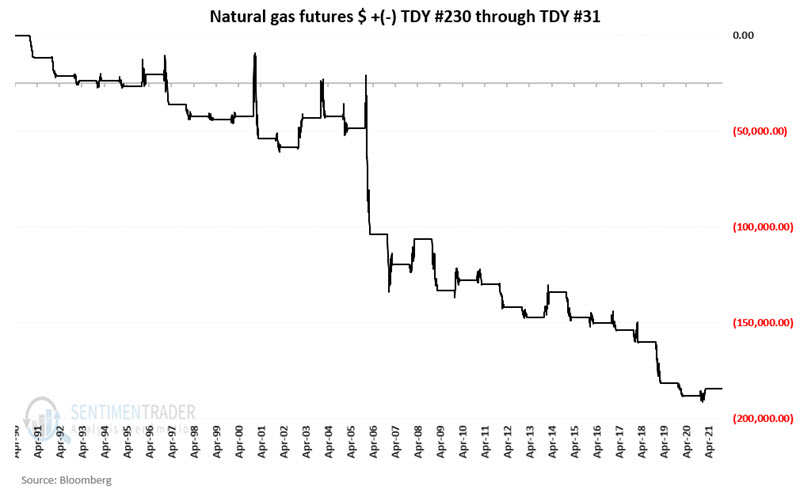
The hypothetical cumulative loss is -$184,500. So, in theory, a trader selling short natural gas futures could potentially garner a significant profit. The table below displays the relevant facts and figures.
Due to the leverage involved and the unlimited risk potential, not every trader is equipped - financially or emotionally - to trade natural gas futures.
Options on ticker UNG
Ticker UNG is an ETF that tracks the price of natural gas futures. A bearish trader could consider buying UNG put options. The problem here is that implied volatility on UNG options is relatively high. The chart below shows the price action for UNG along with IV for 90+-day options.
High implied volatility indicates that there is presently a great deal of time premium built into the price of the options. This means:
- You pay a lot of time premium to buy the options
- You will experience more significant time decay as expiration draws closer
- A decline in IV can result in a volatility crush that causes time premiums and the price of your option to decline
Using the KOLD fund instead
The ProShares UltraShort Bloomberg Natural Gas fund (KOLD) is an inverse, leveraged ETF that tracks natural gas futures. According to the ProShares website:
"ProShares UltraShort® Bloomberg Natural Gas seeks daily investment results, before fees and expenses, that correspond to two times the inverse (-2x) of the daily performance of the Bloomberg Natural Gas SubindexSM."
In theory, if the index loses -1% today, ticker KOLD should gain +2%. KOLD is a highly leveraged and very risky asset to trade. If natural gas does decline in a meaningful way while you hold this ETF, it is possible to garner large profits. But from a risk perspective, a trader must recognize that this ETF will lose money at twice the index rate if the index rises.
Never bet the ranch on this type of security. Leveraged and/or inverse funds are best used only in what I refer to as "hit-and-run" situations. As it turns out, the method we are discussing qualifies as a "hit-and-run" strategy, i.e., we know exactly when we will get in and exactly when we will get out. A trader can always take an early profit if they desire.
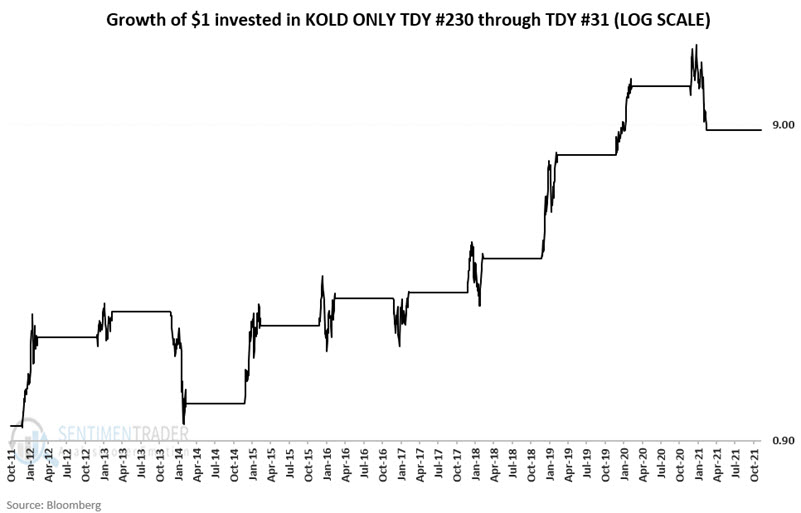
The chart below shows the growth of $1 invested in KOLD only from the close of TDY #230 each year through the close on TDY #31 of the following year.
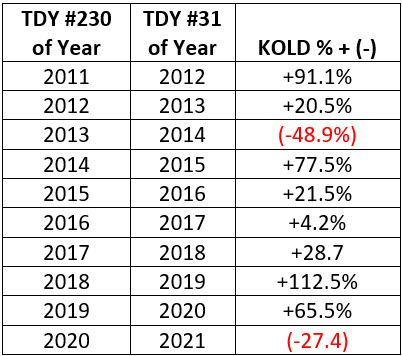
The table below displays the year-by-year results. While history is limited, and the two losses were substantial, there were four times as many wins.
As I stated earlier, this opportunity must be treated solely as a high risk, high reward strategy, and traders should carefully consider committing only pure risk capital they can afford to lose to this situation.
What the research tells us…
Natural gas has demonstrated a clear tendency to decline from early December through late February. Natural gas futures offer well-capitalized traders the purest (and also most risky) play. Buying shares of the KOLD fund is a viable substitute for shorting natural gas futures as long as a trader allocates capital conservatively without exposing themselves beyond their maximum tolerance for risk.
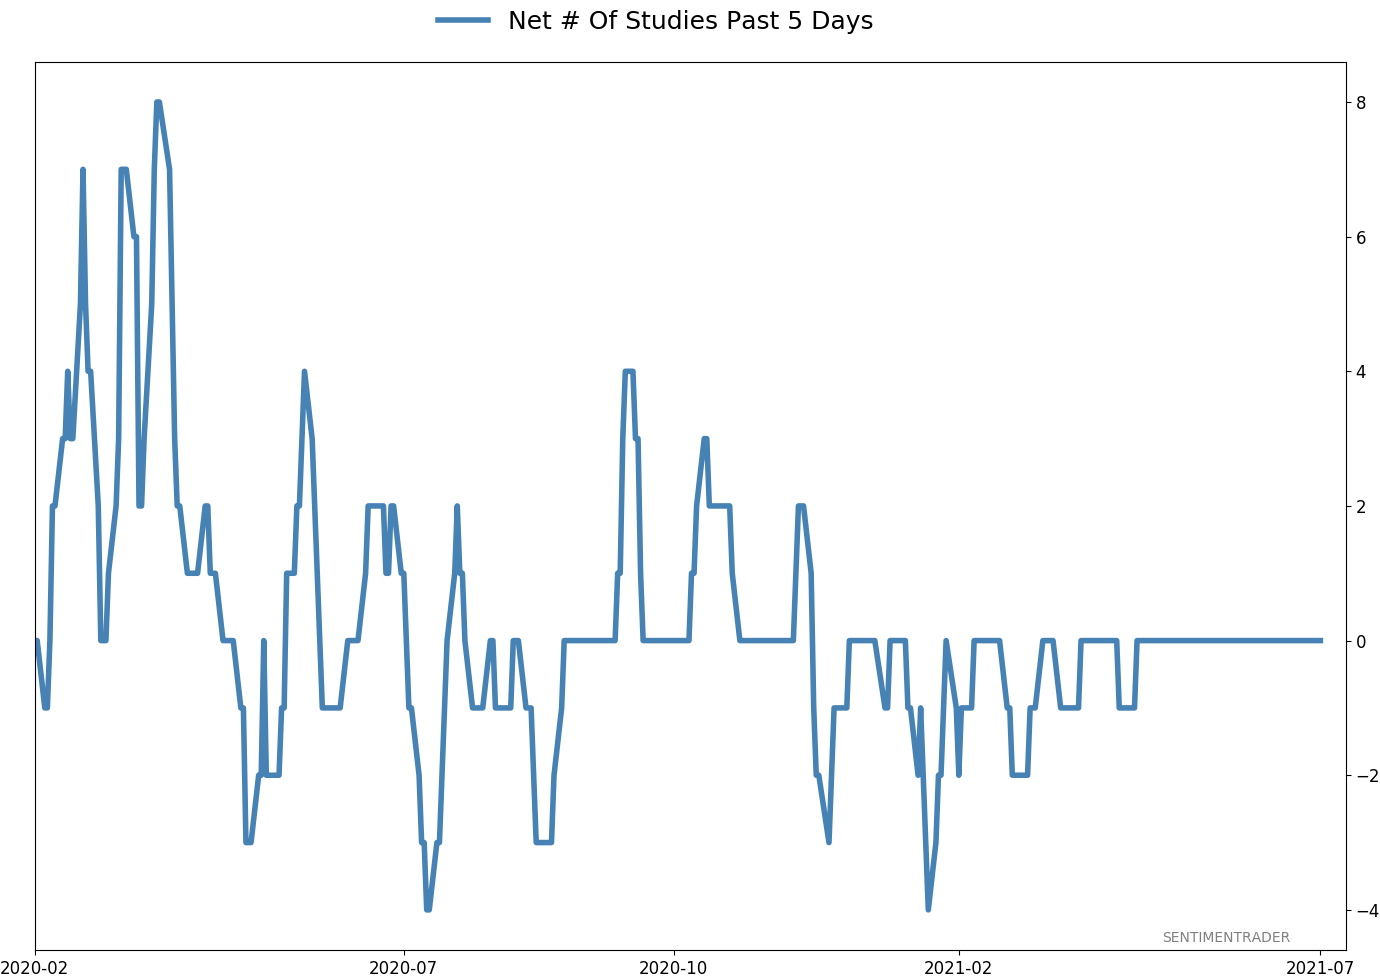
Active Studies
| Time Frame | Bullish | Bearish | | Short-Term | 2 | 0 | | Medium-Term | 11 | 0 | | Long-Term | 13 | 6 |
|
Indicators at Extremes
Portfolio
| Position | Description | Weight % | Added / Reduced | Date | | Stocks | RSP | 10.7 | Added 6.4% | 2021-10-01 | | Bonds | 32.7% BND, 7.1% SCHP | 39.8 | Added 8.3% | 2021-10-26 | | Commodities | GCC | 2.4 | Reduced 2.1%
| 2020-09-04 | | Precious Metals | GDX | 4.6 | Reduced 4.2% | 2021-05-19 | | Special Situations | 9.8% KWEB, 4.7% XLE, 2.9% PSCE | 17.3 | Added 9.78% | 2021-10-01 | | Cash | | 24.1 | | |
|
Updates (Changes made today are underlined)
Much of our momentum and trend work has remained positive for several months, with some scattered exceptions. Almost all sentiment-related work has shown a poor risk/reward ratio for stocks, especially as speculation drove to record highs in exuberance in February. Much of that has worn off, and most of our models are back toward neutral levels. There isn't much to be excited about here. The same goes for bonds and even gold. Gold has been performing well lately and is back above long-term trend lines. The issue is that it has a poor record of holding onto gains when attempting a long-term trend change like this, so we'll take a wait-and-see approach. Momentum has ebbed quickly in recent weeks, and nearing oversold levels in some indicators. This can be a dangerous area, with a lot of short-term volatility, but we'd be more inclined to add medium- to long-term exposure rather than sell on much more of a decline, thanks to already rock-bottom exposure. Other areas look more attractive, including some overseas markets. RETURN YTD: 11.3% 2020: 8.1%, 2019: 12.6%, 2018: 0.6%, 2017: 3.8%, 2016: 17.1%, 2015: 9.2%, 2014: 14.5%, 2013: 2.2%, 2012: 10.8%, 2011: 16.5%, 2010: 15.3%, 2009: 23.9%, 2008: 16.2%, 2007: 7.8%
|
|
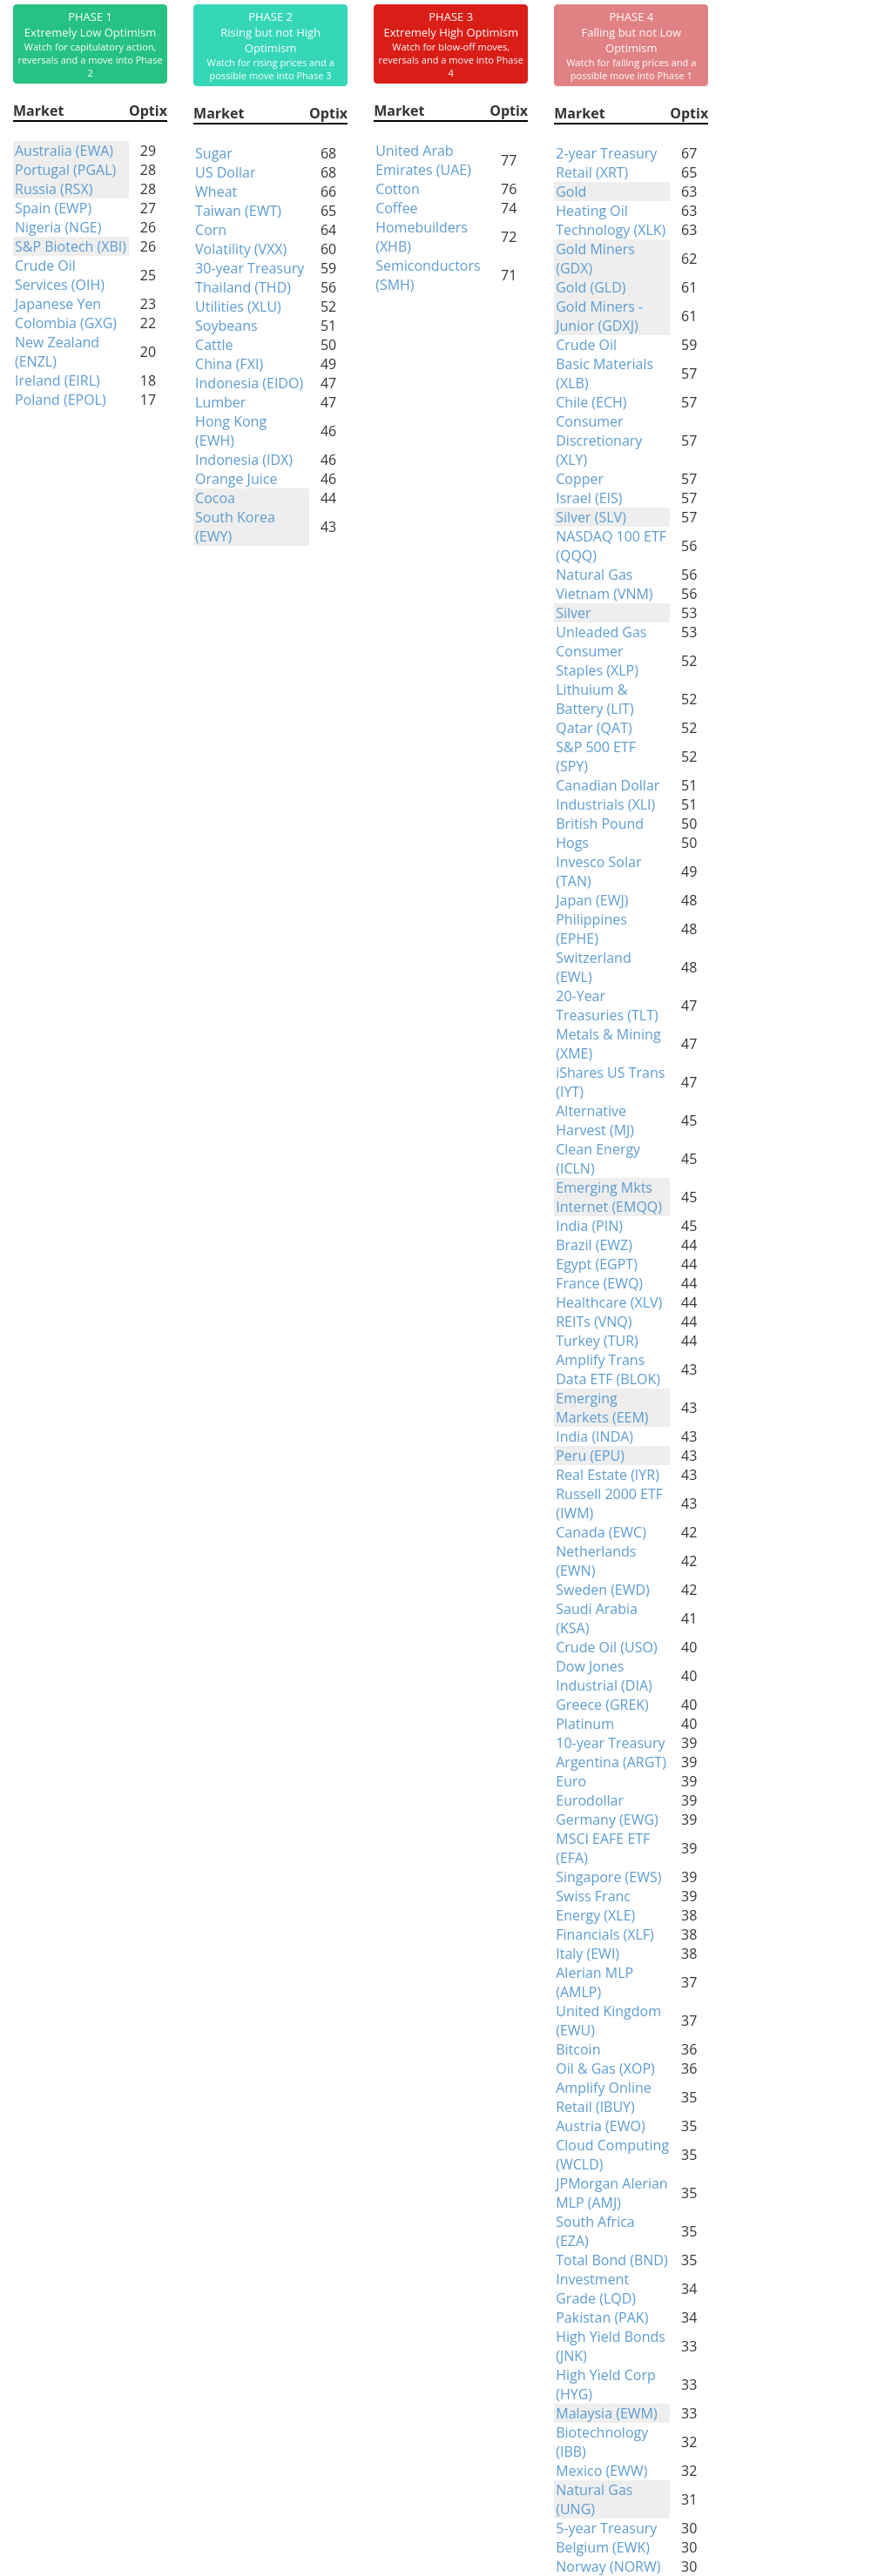
Phase Table
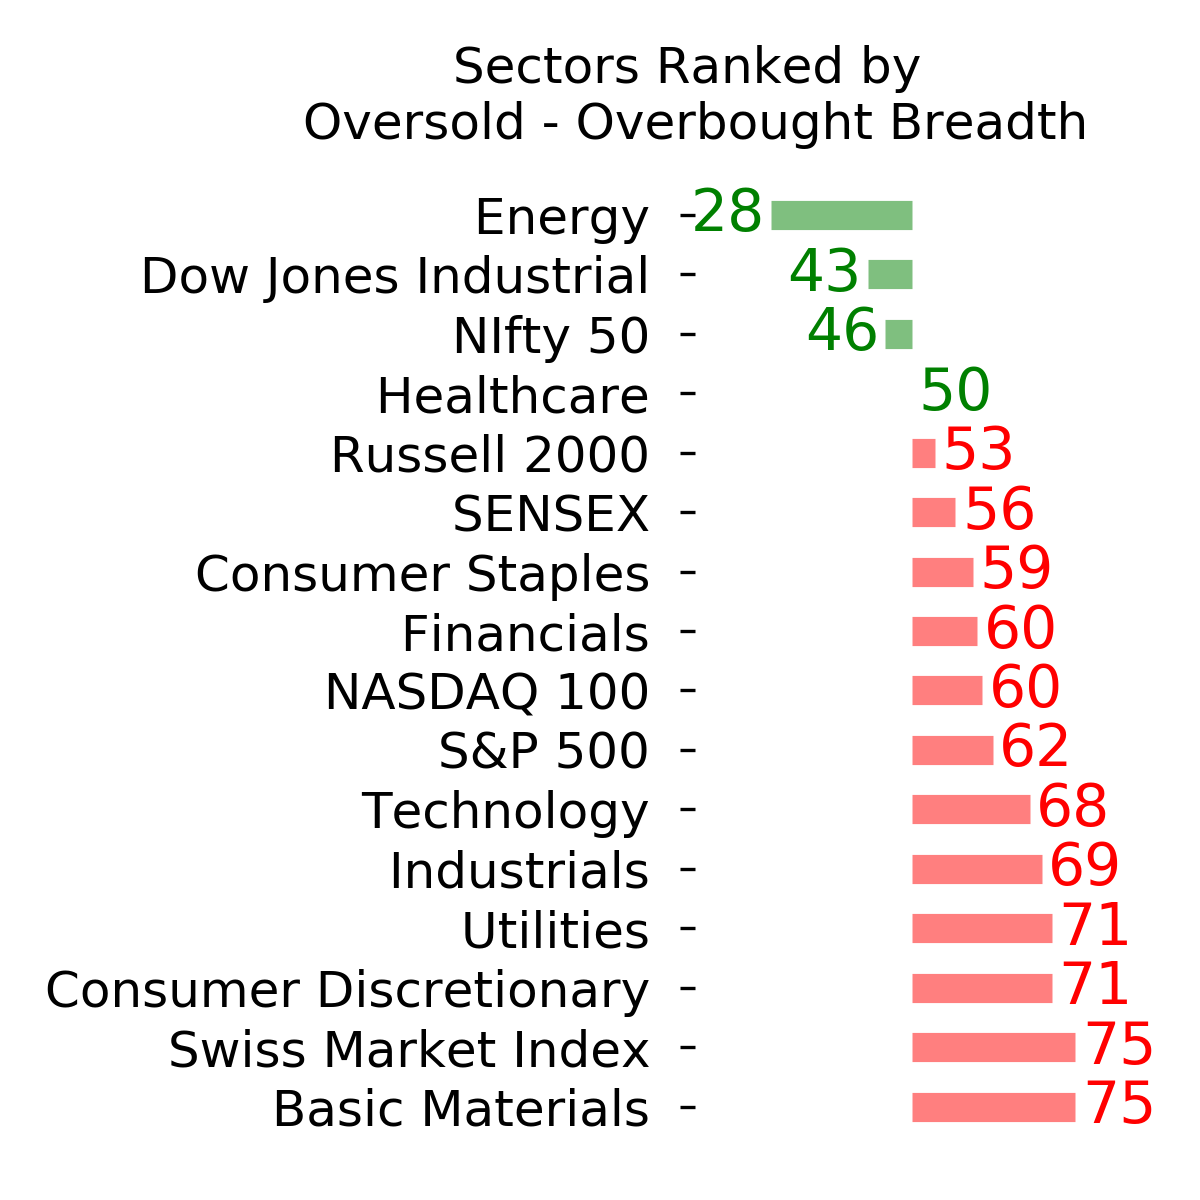
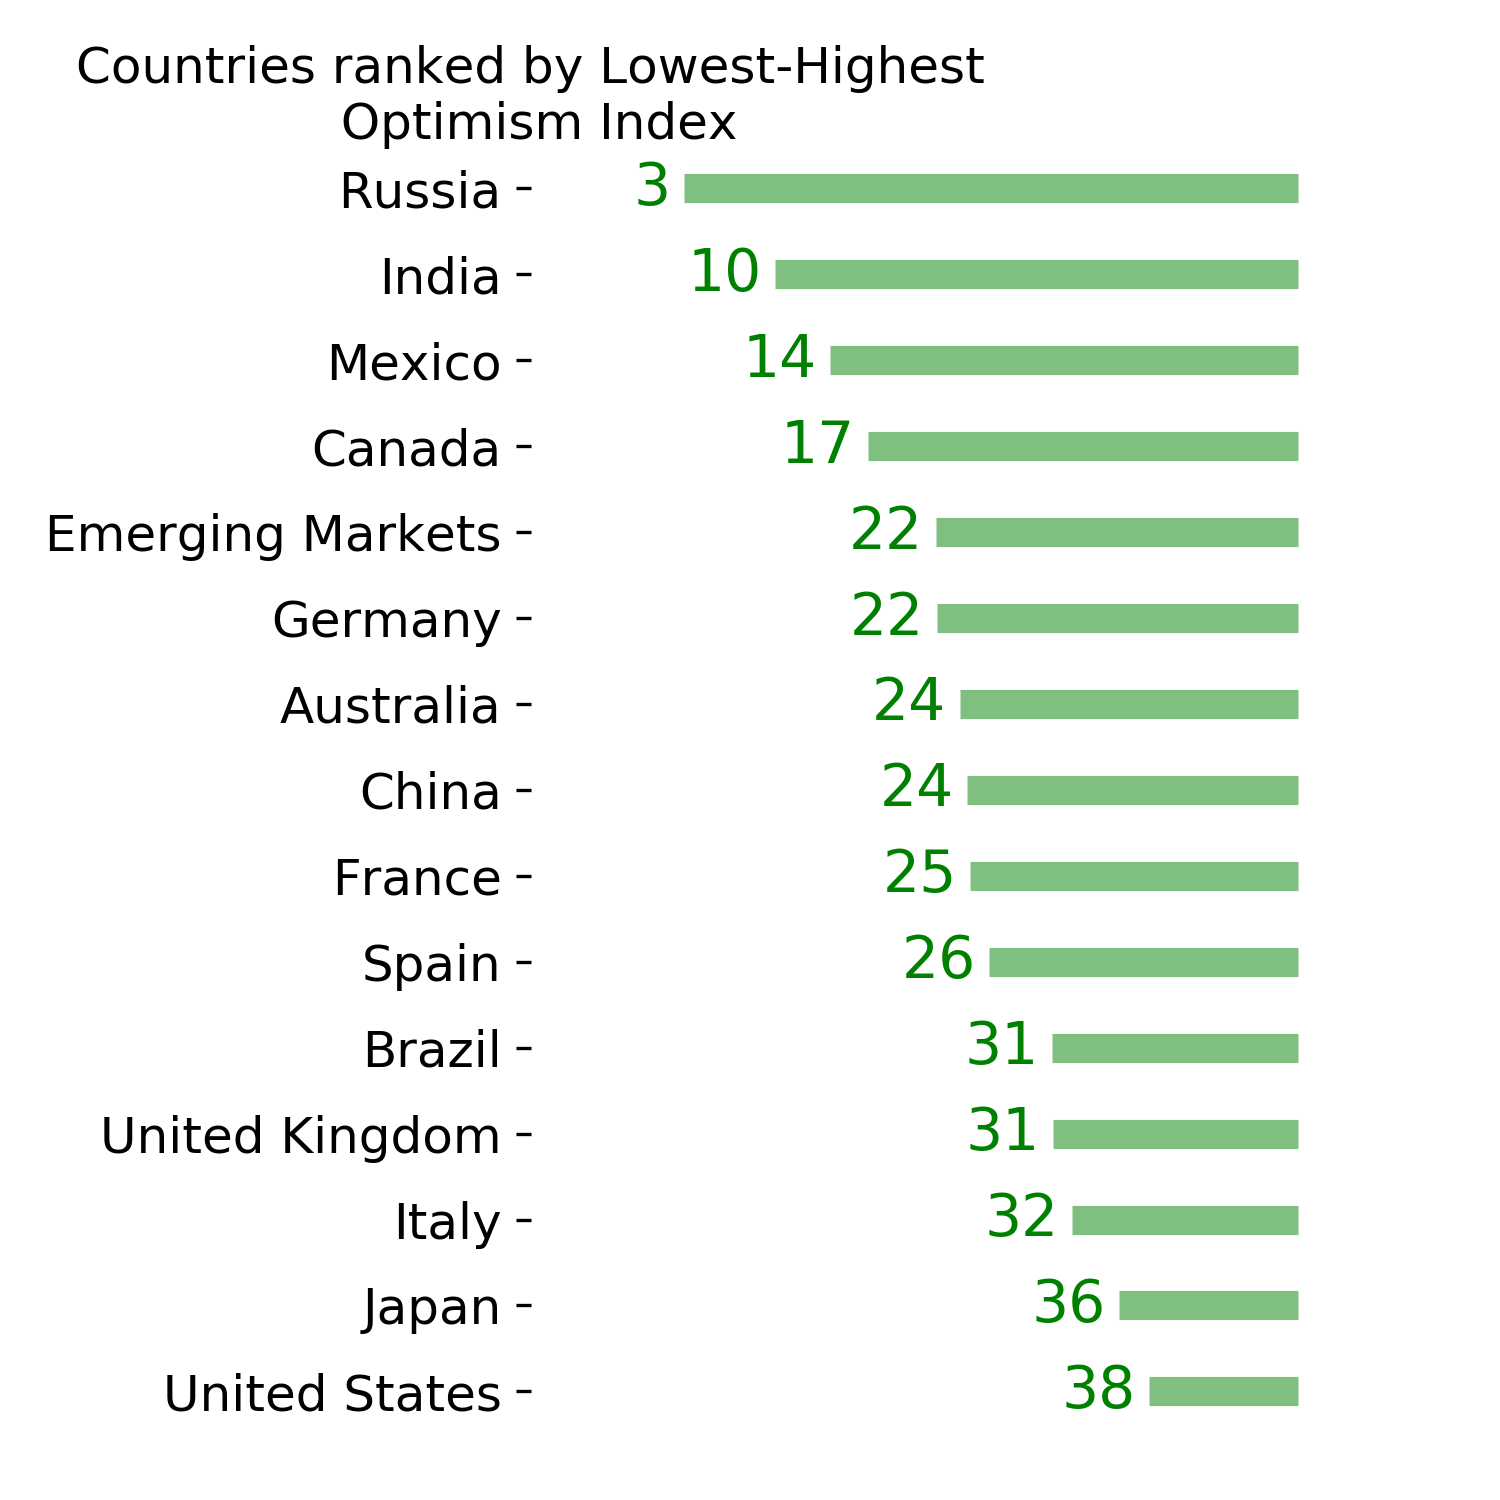
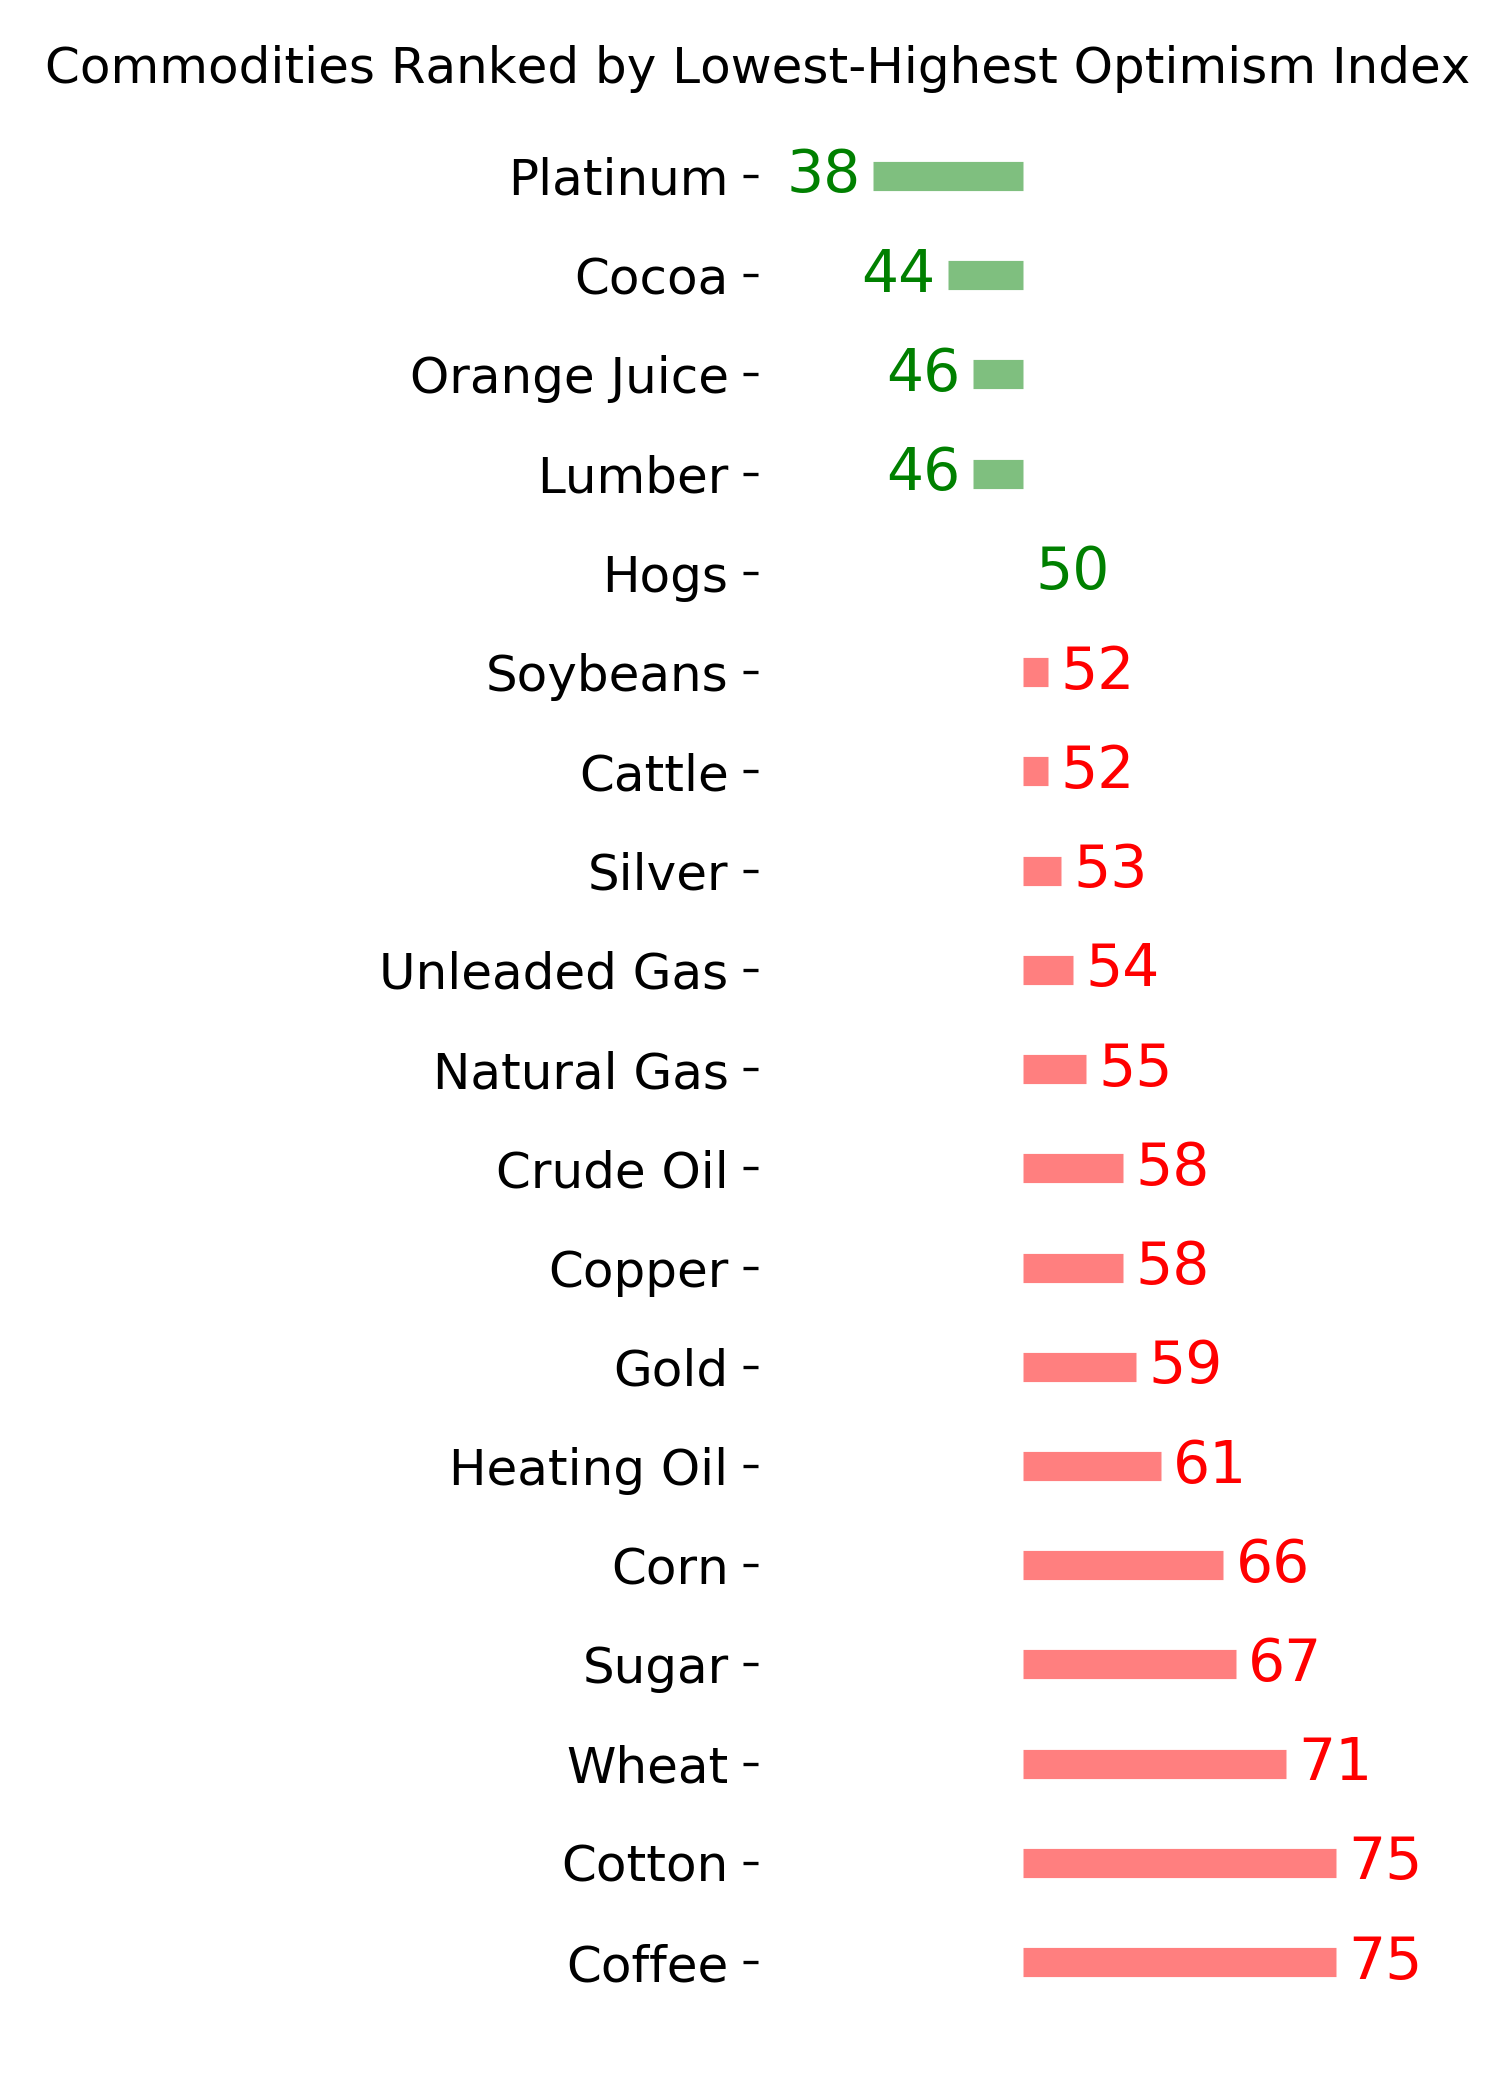
Ranks
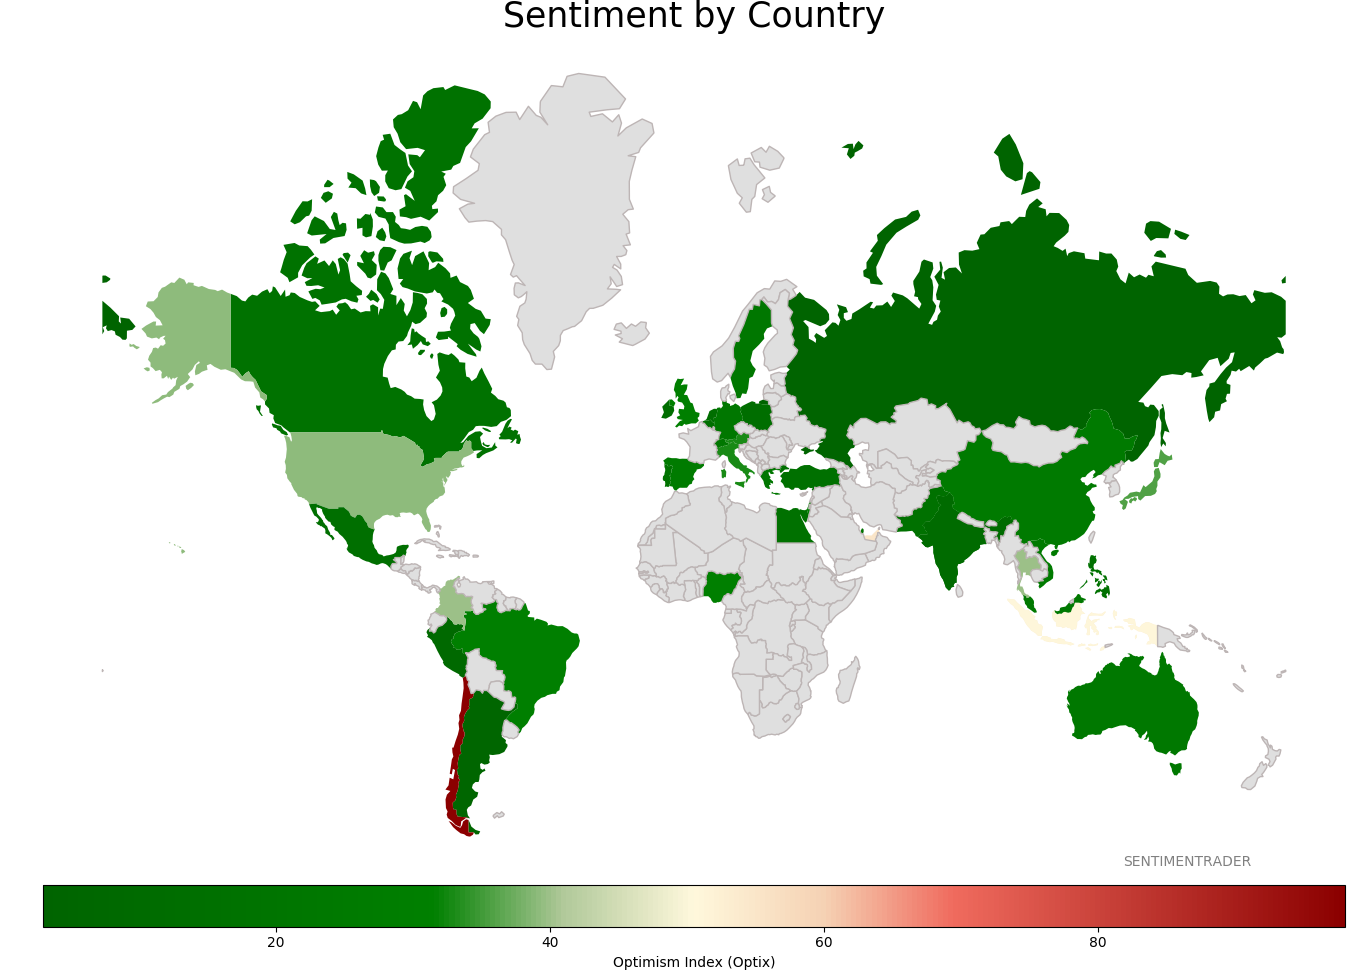
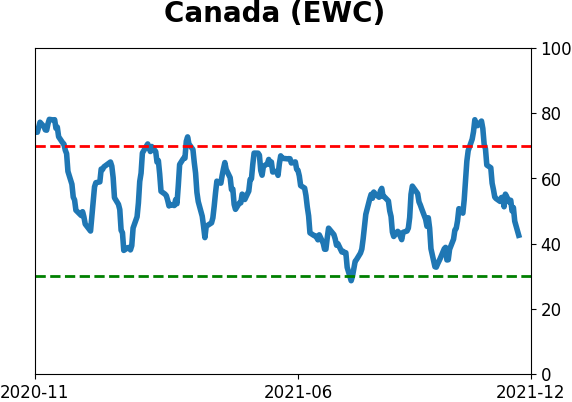
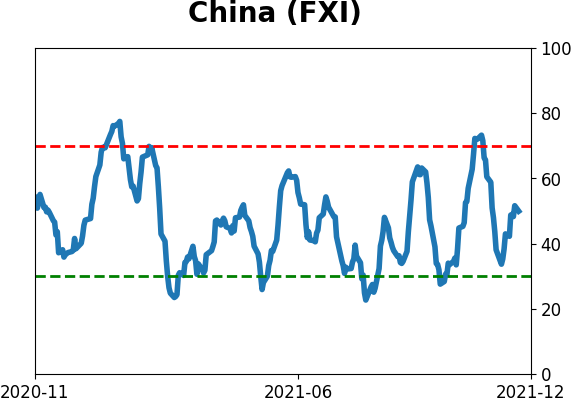
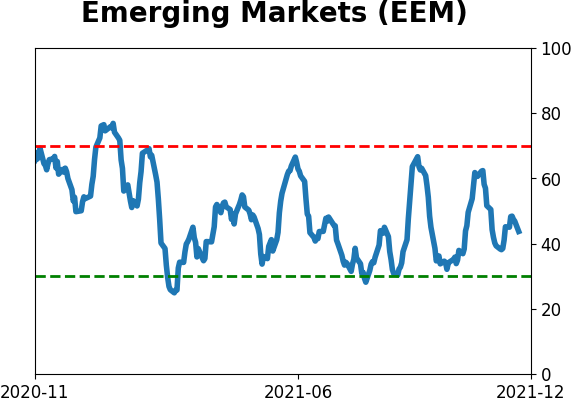
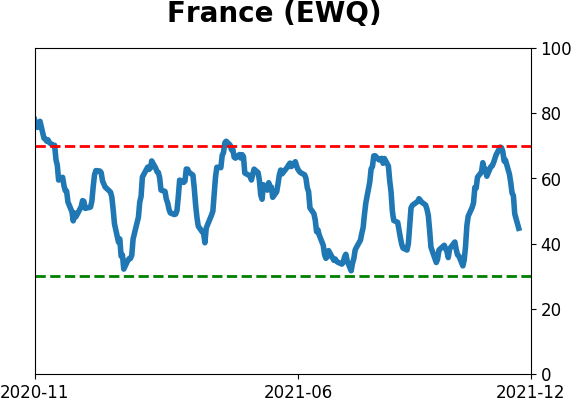
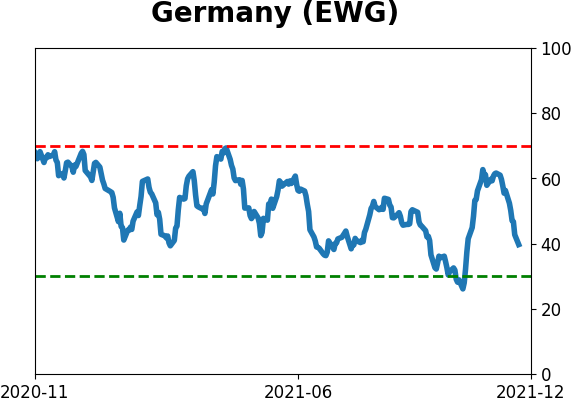
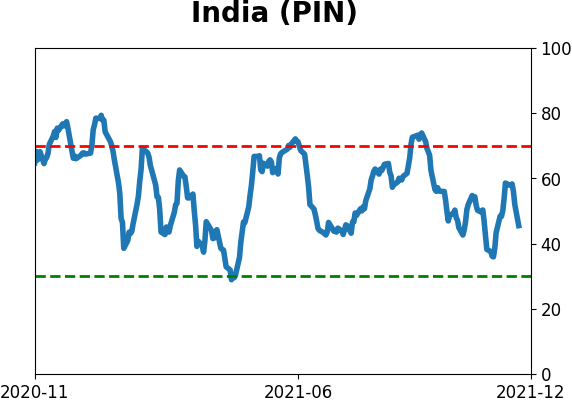
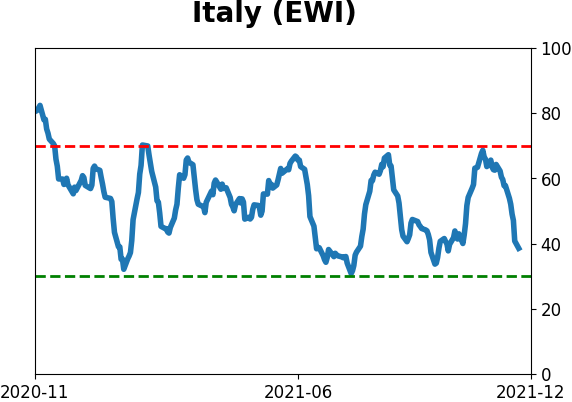
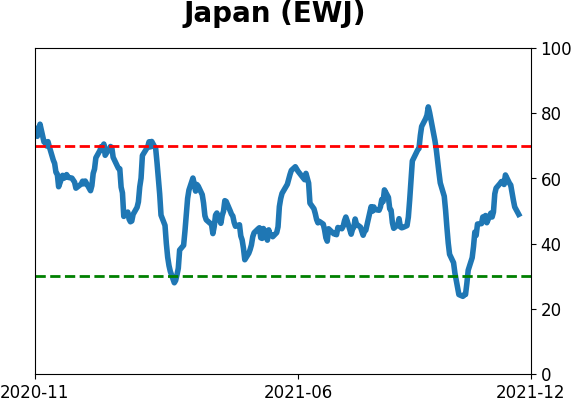
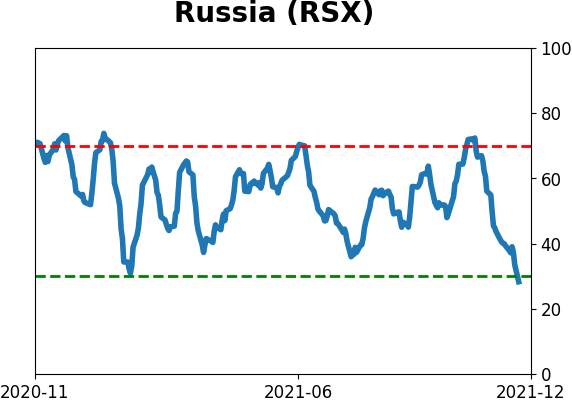
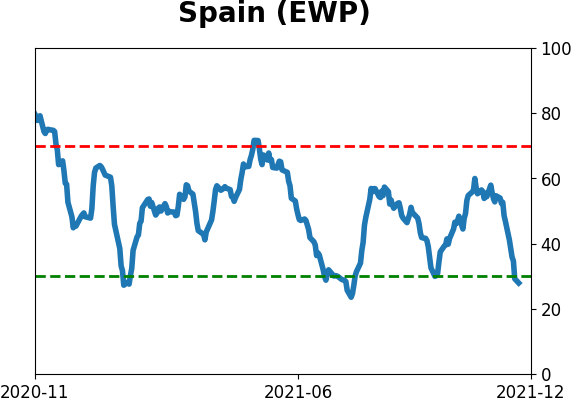
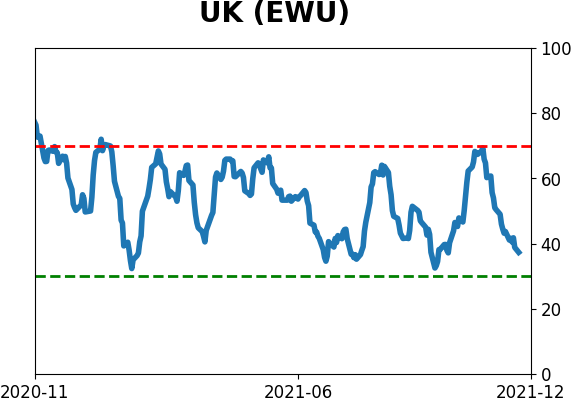
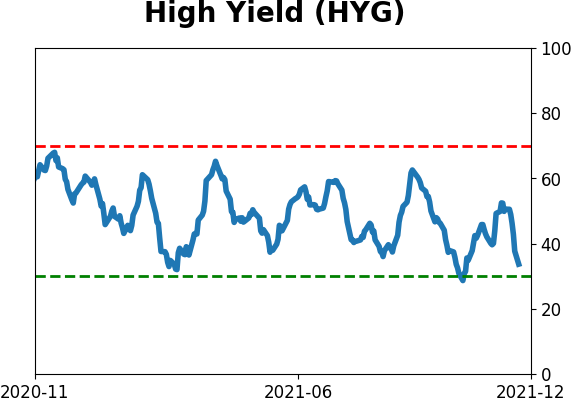
Sentiment Around The World
Optimism Index Thumbnails
|
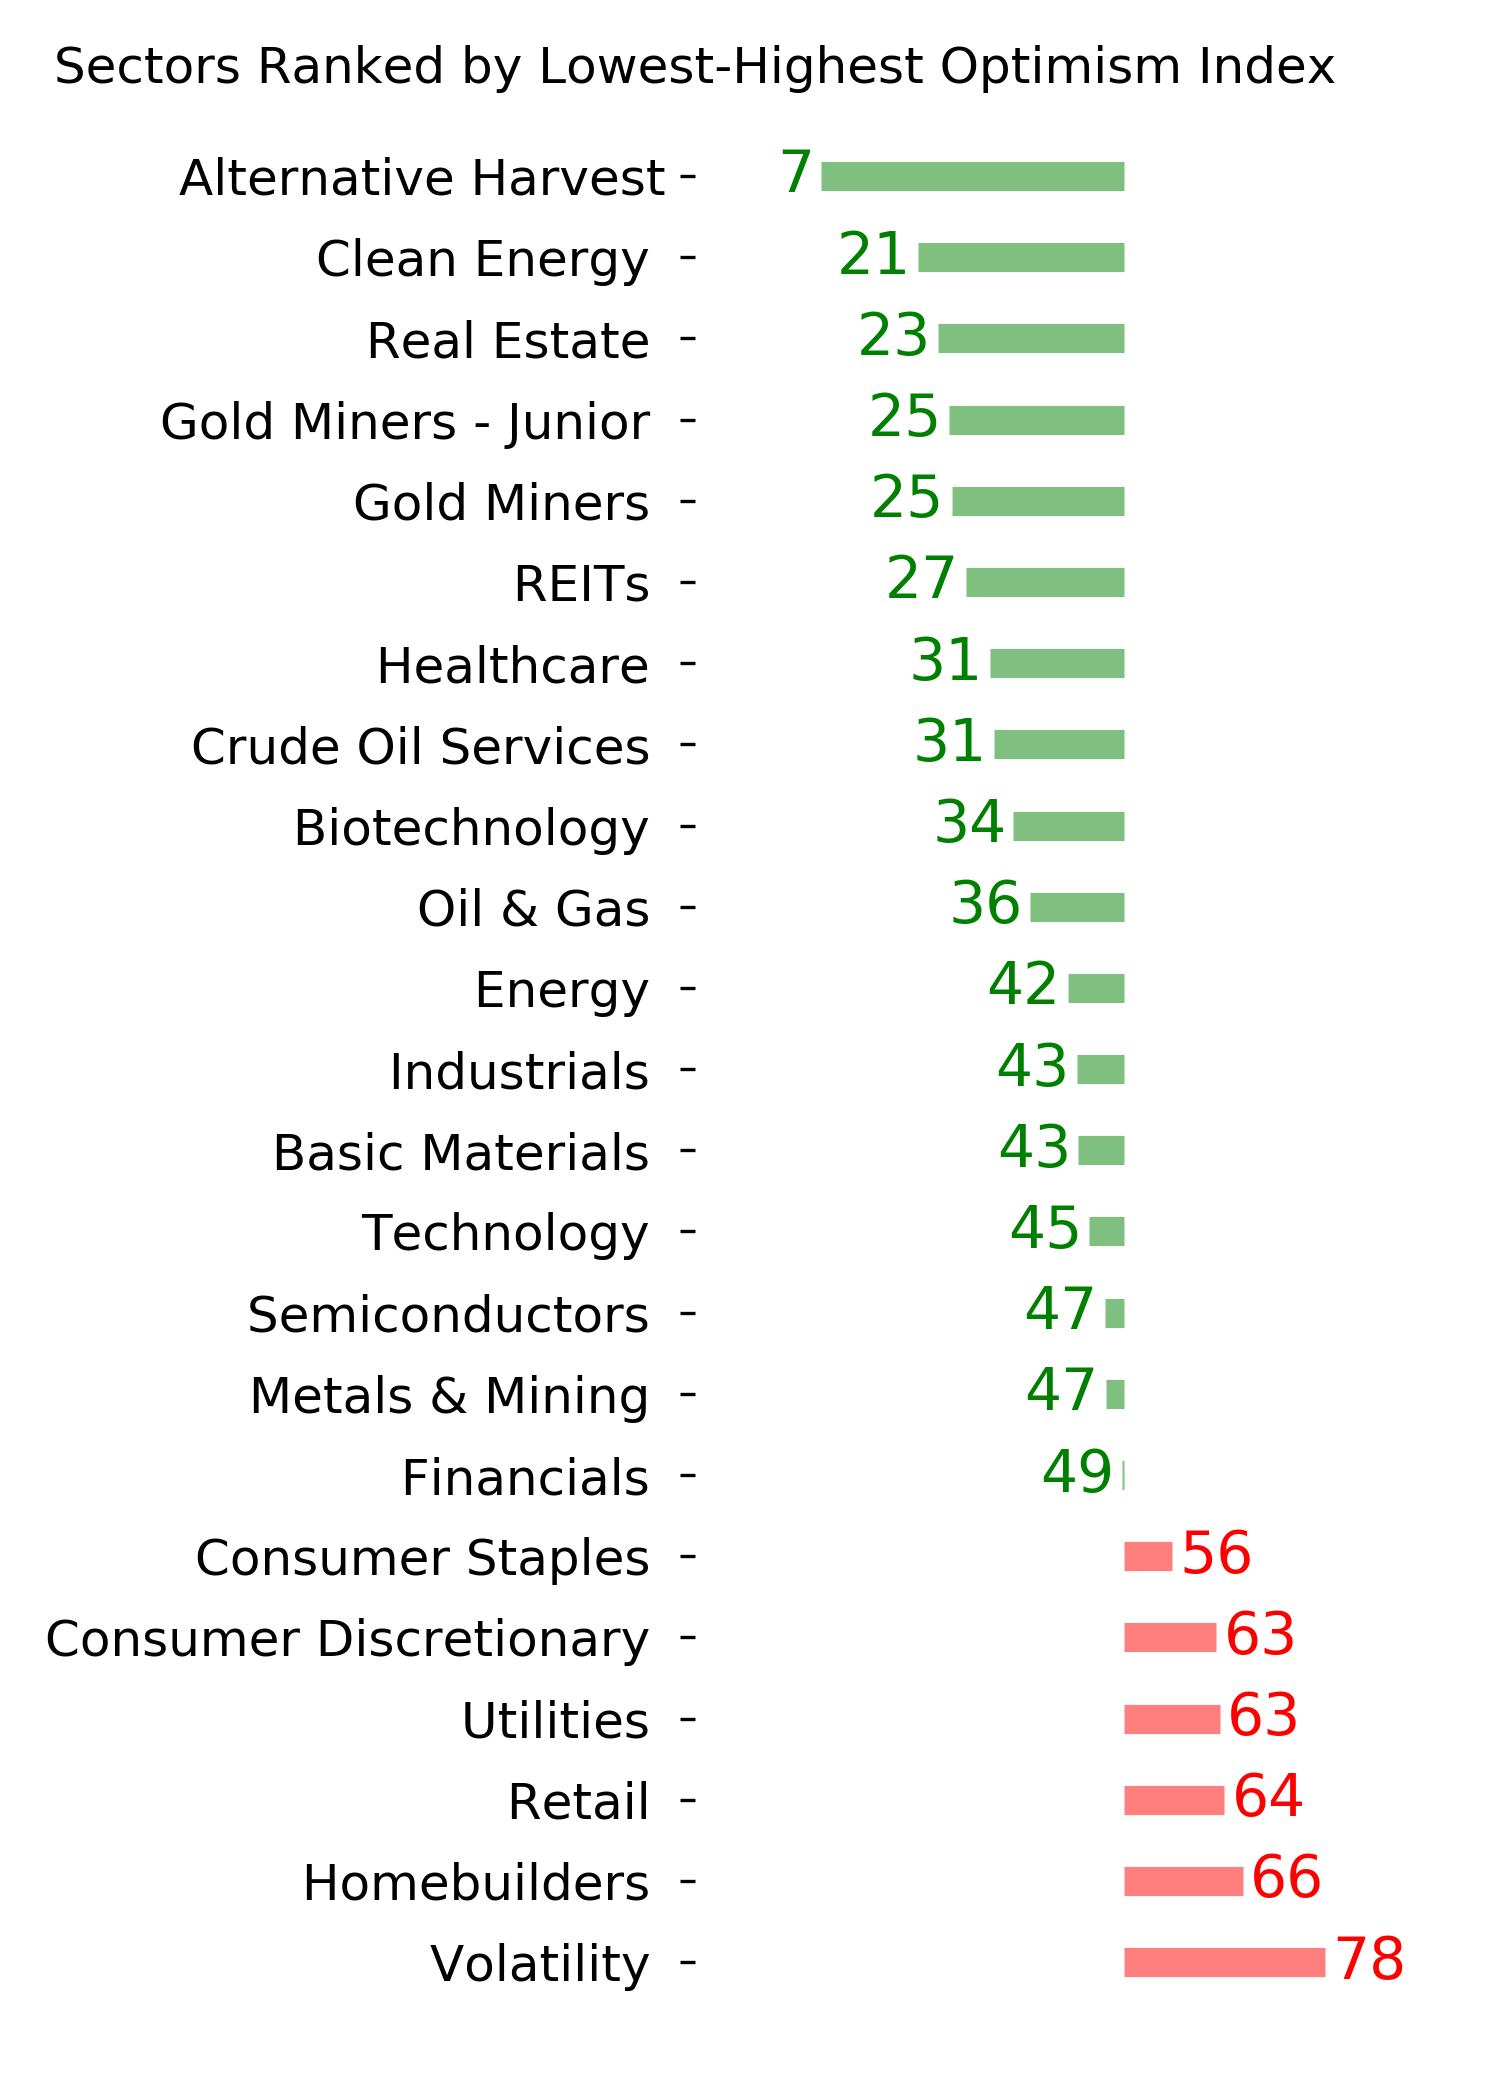
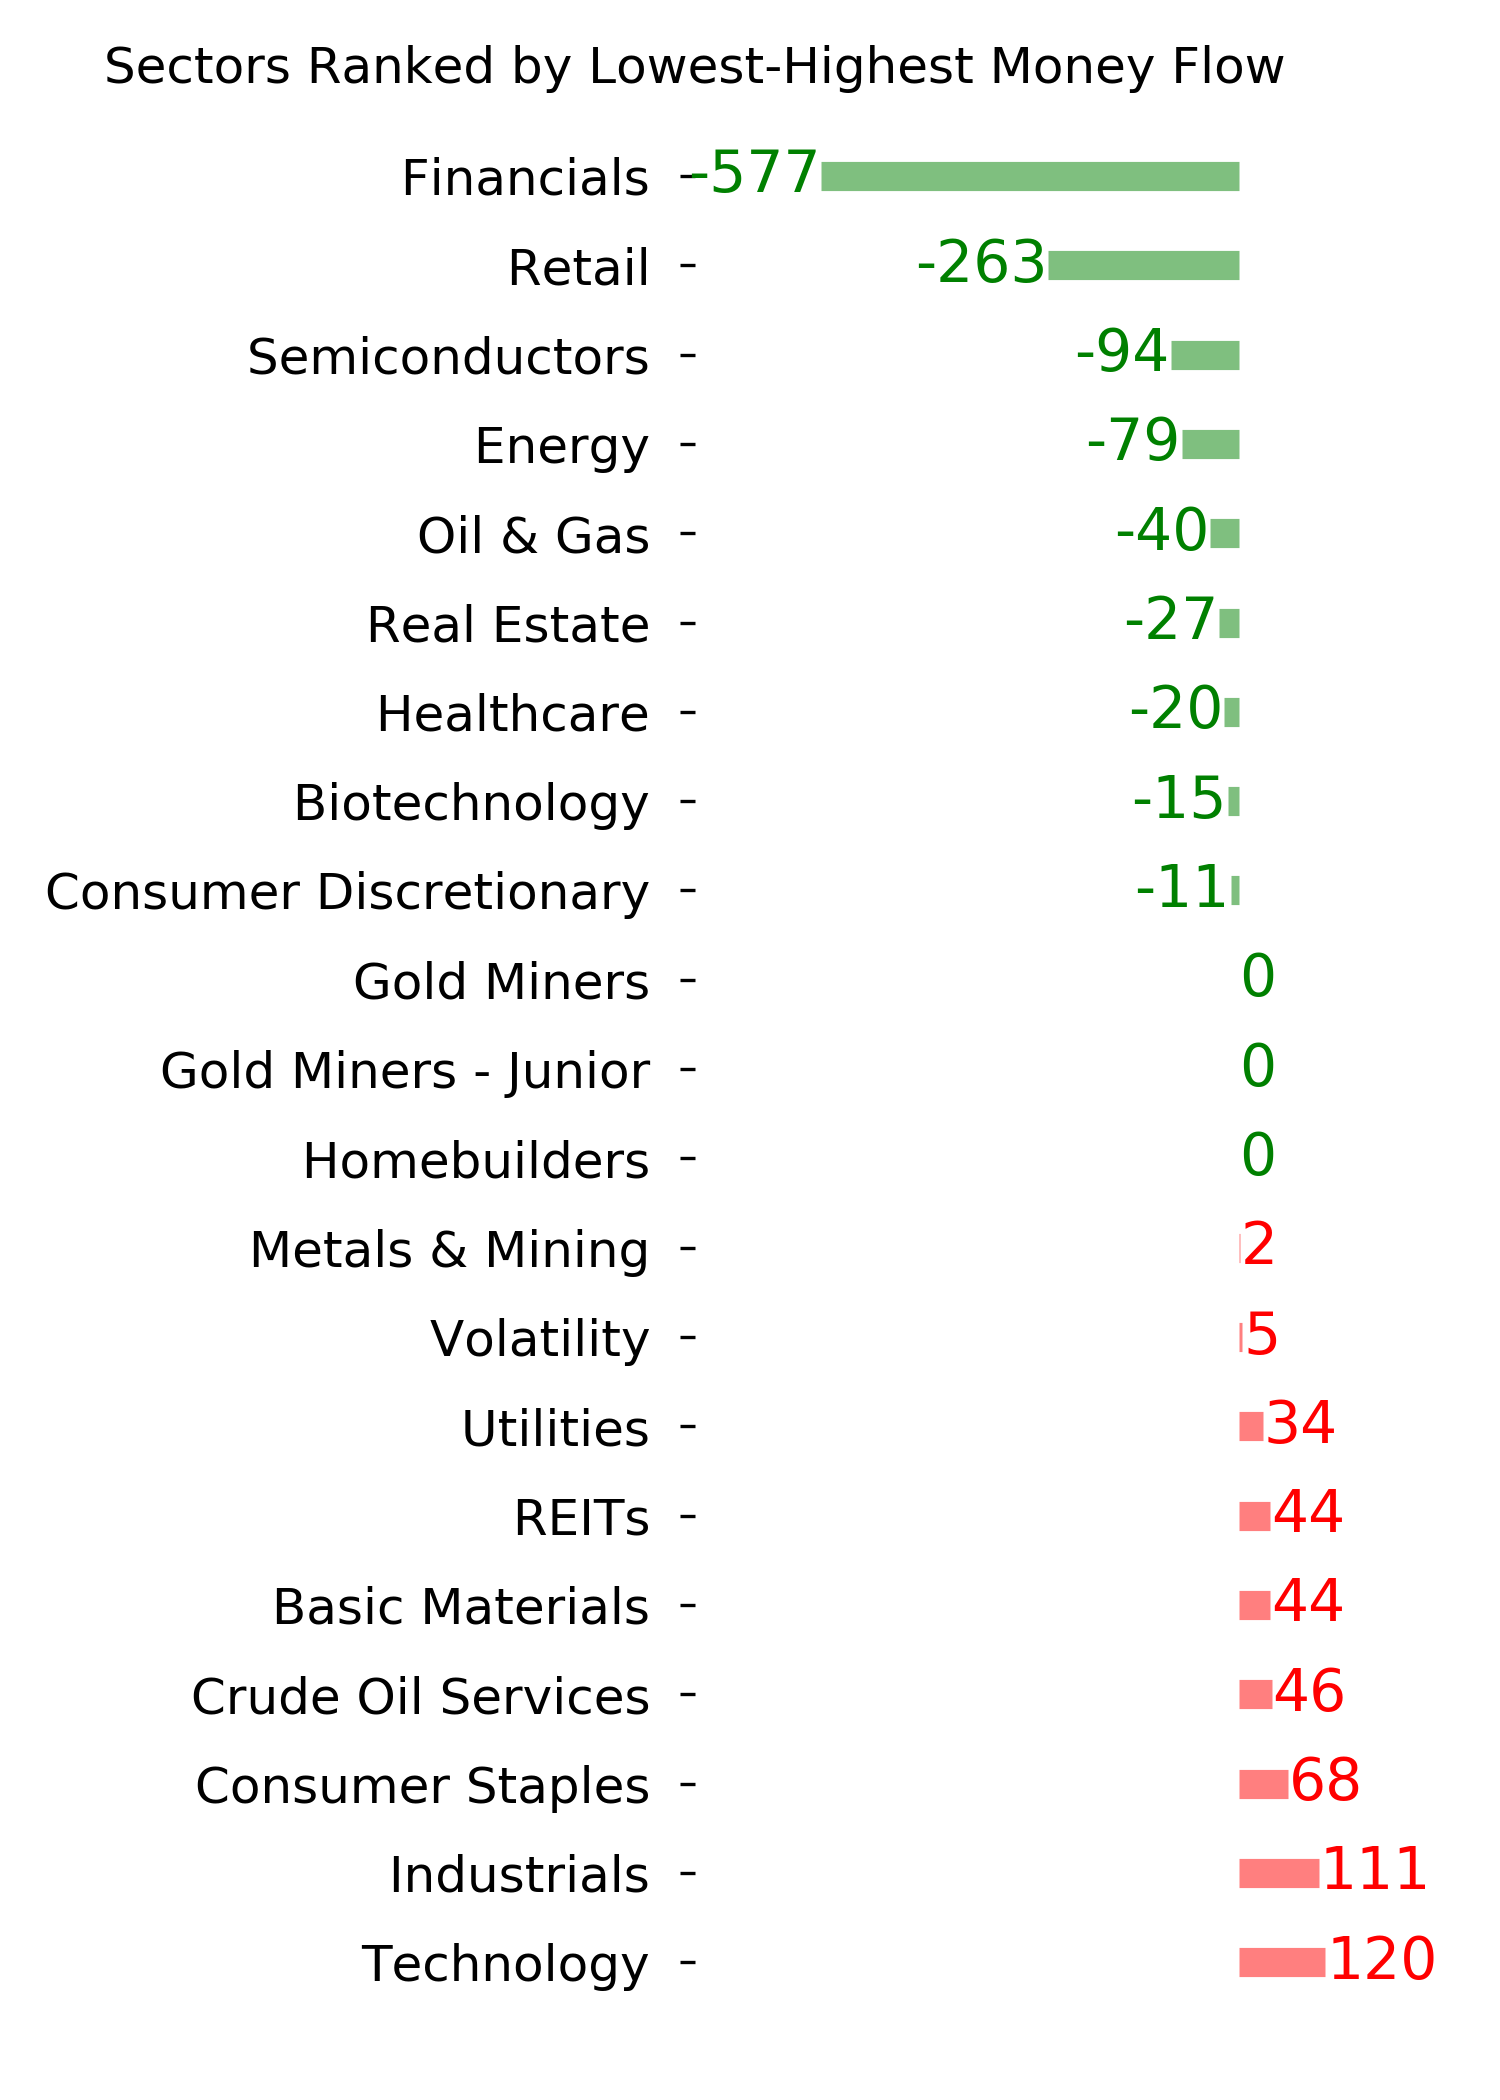
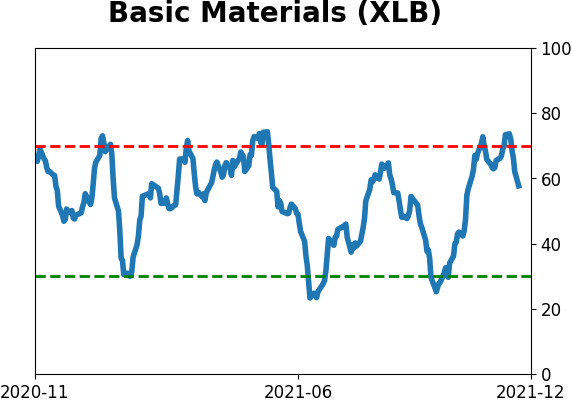
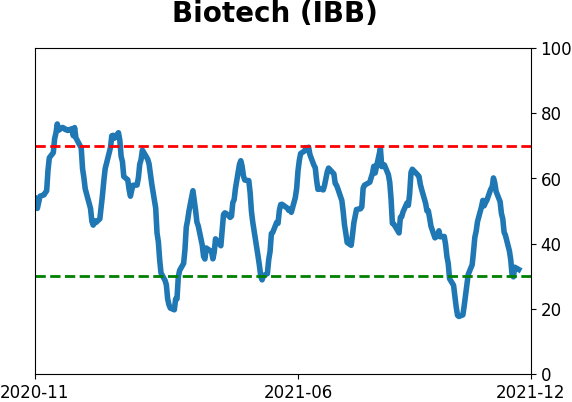
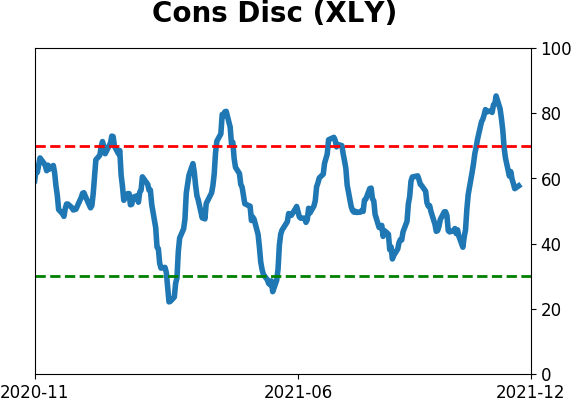
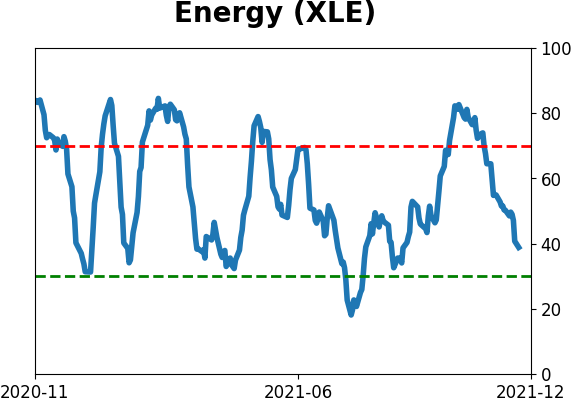
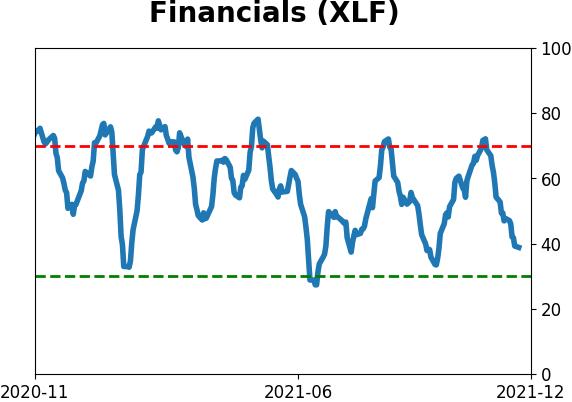
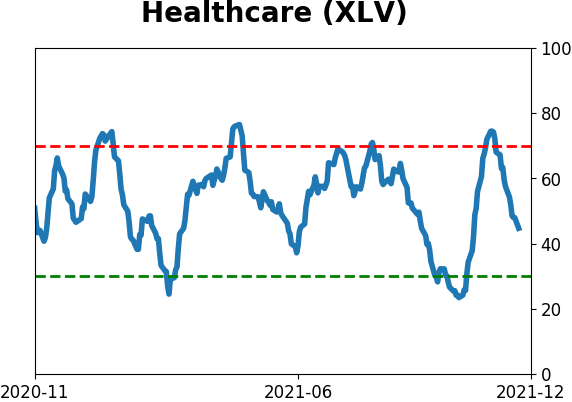
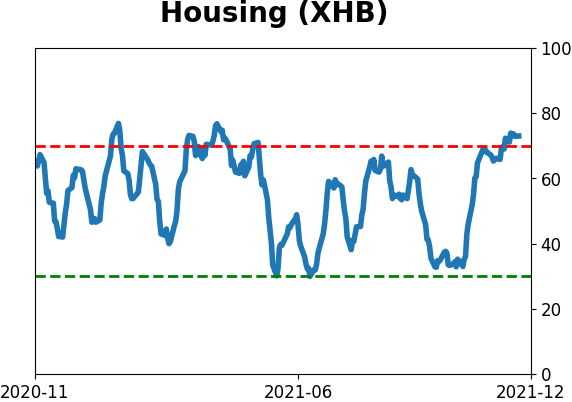
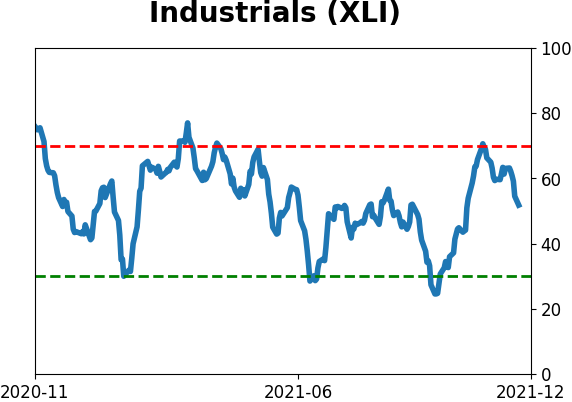
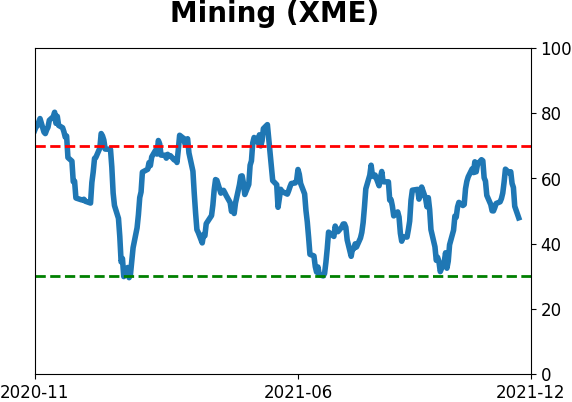
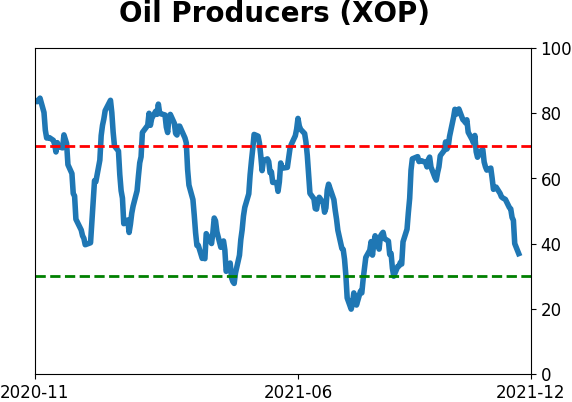
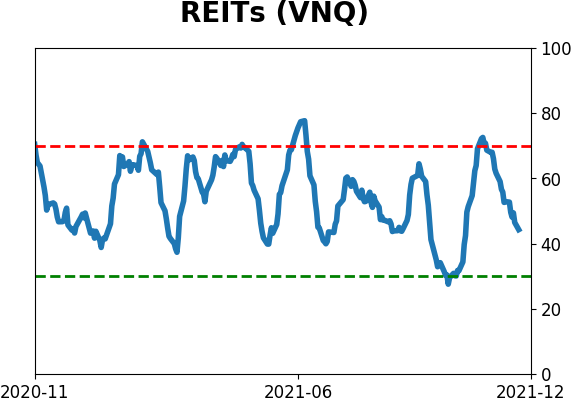
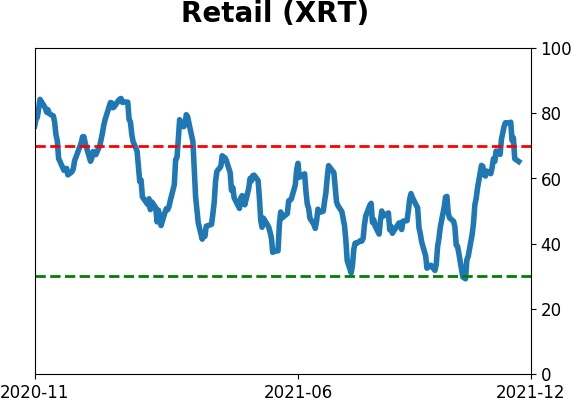
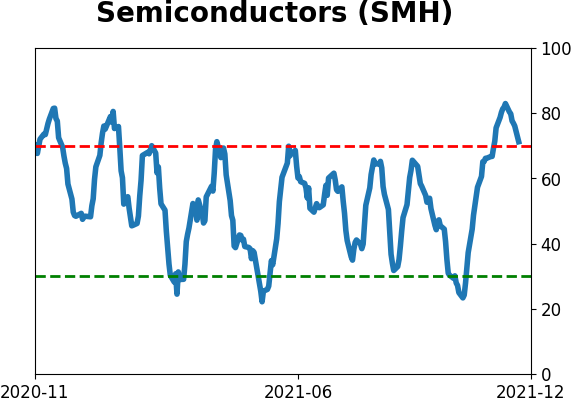
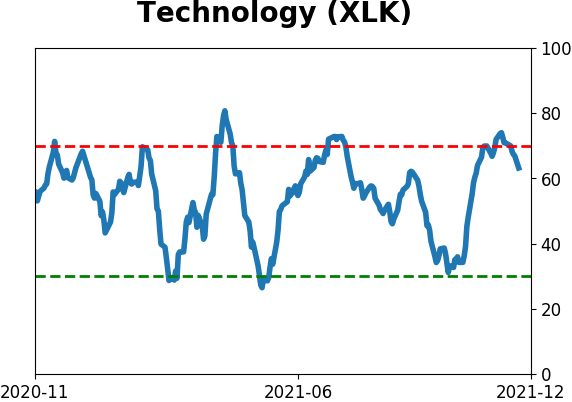
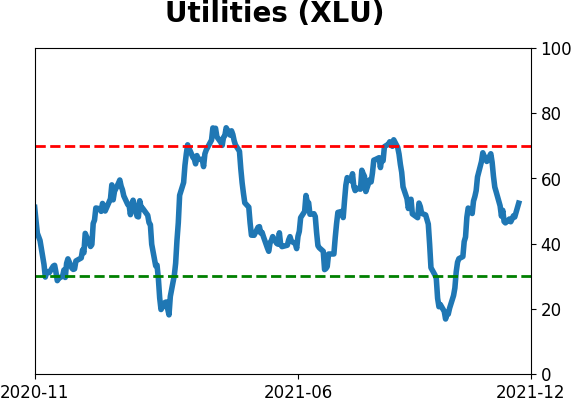
Sector ETF's - 10-Day Moving Average
|
|
|
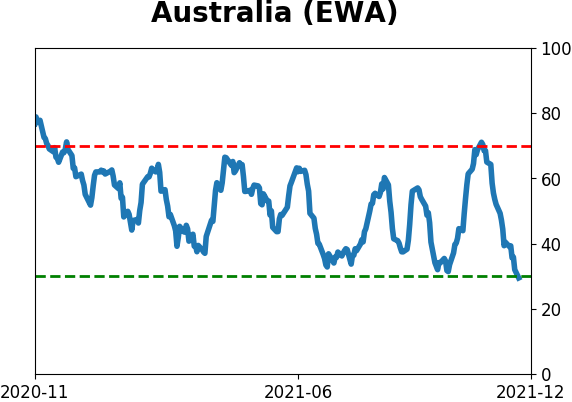
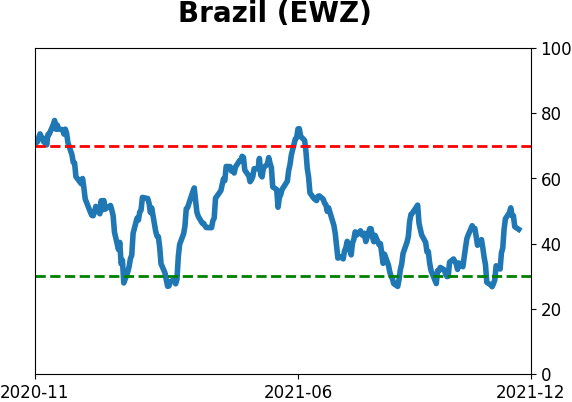
Country ETF's - 10-Day Moving Average
|
|
|
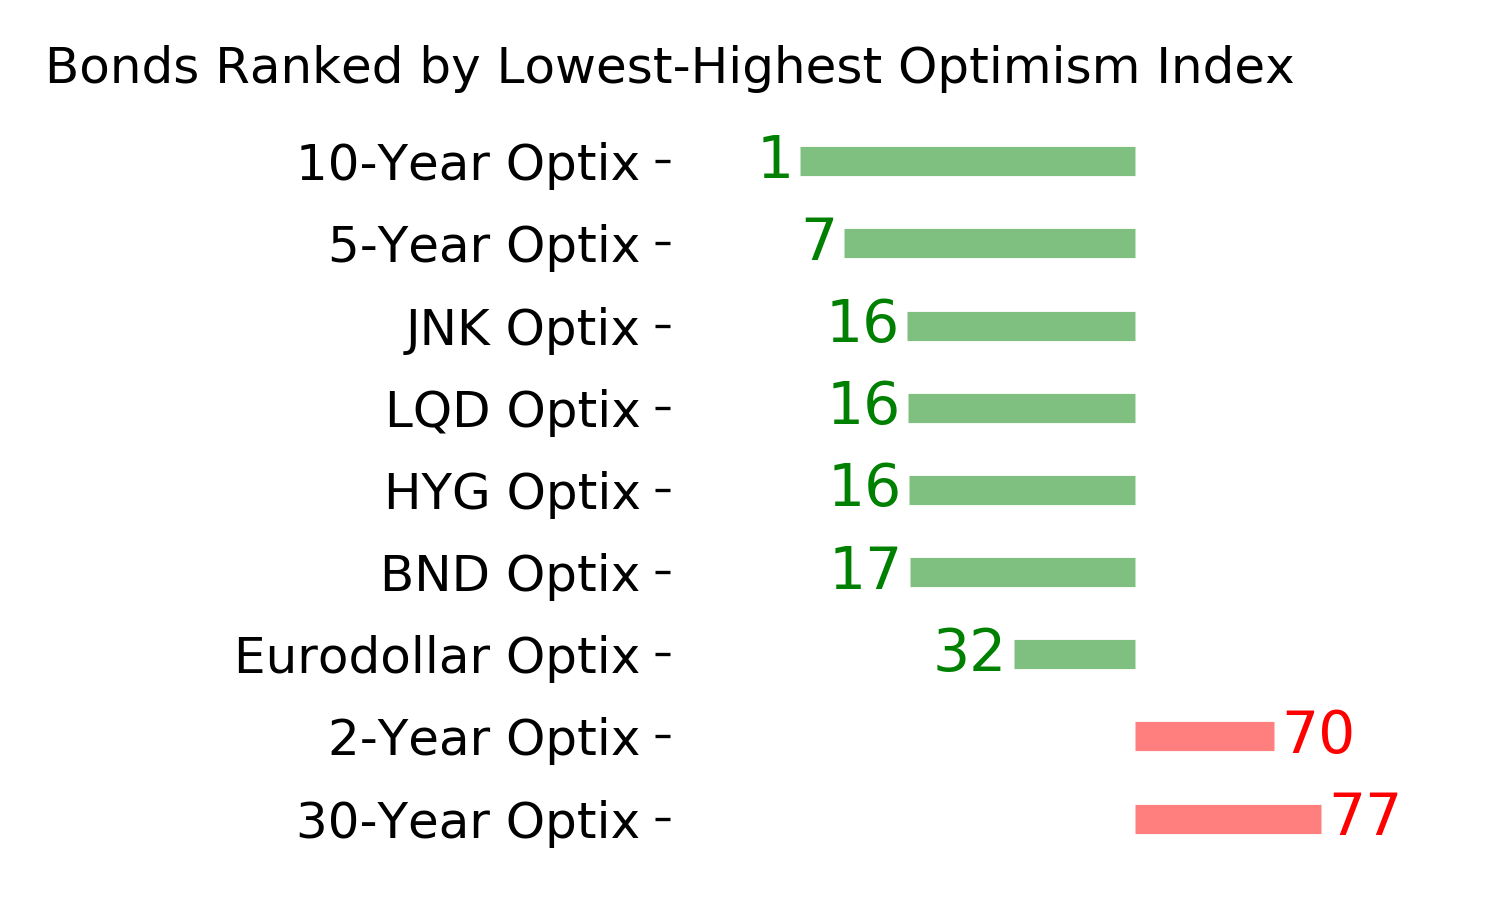
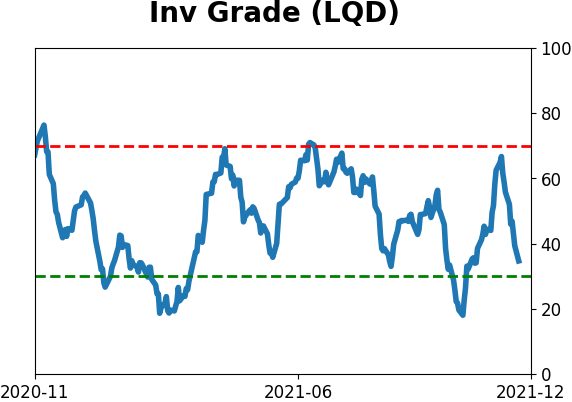
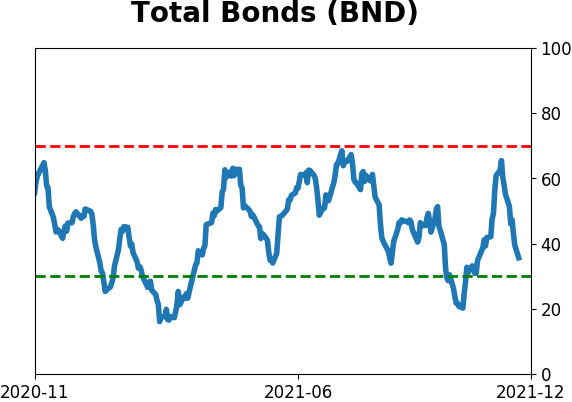
Bond ETF's - 10-Day Moving Average
|
|
|
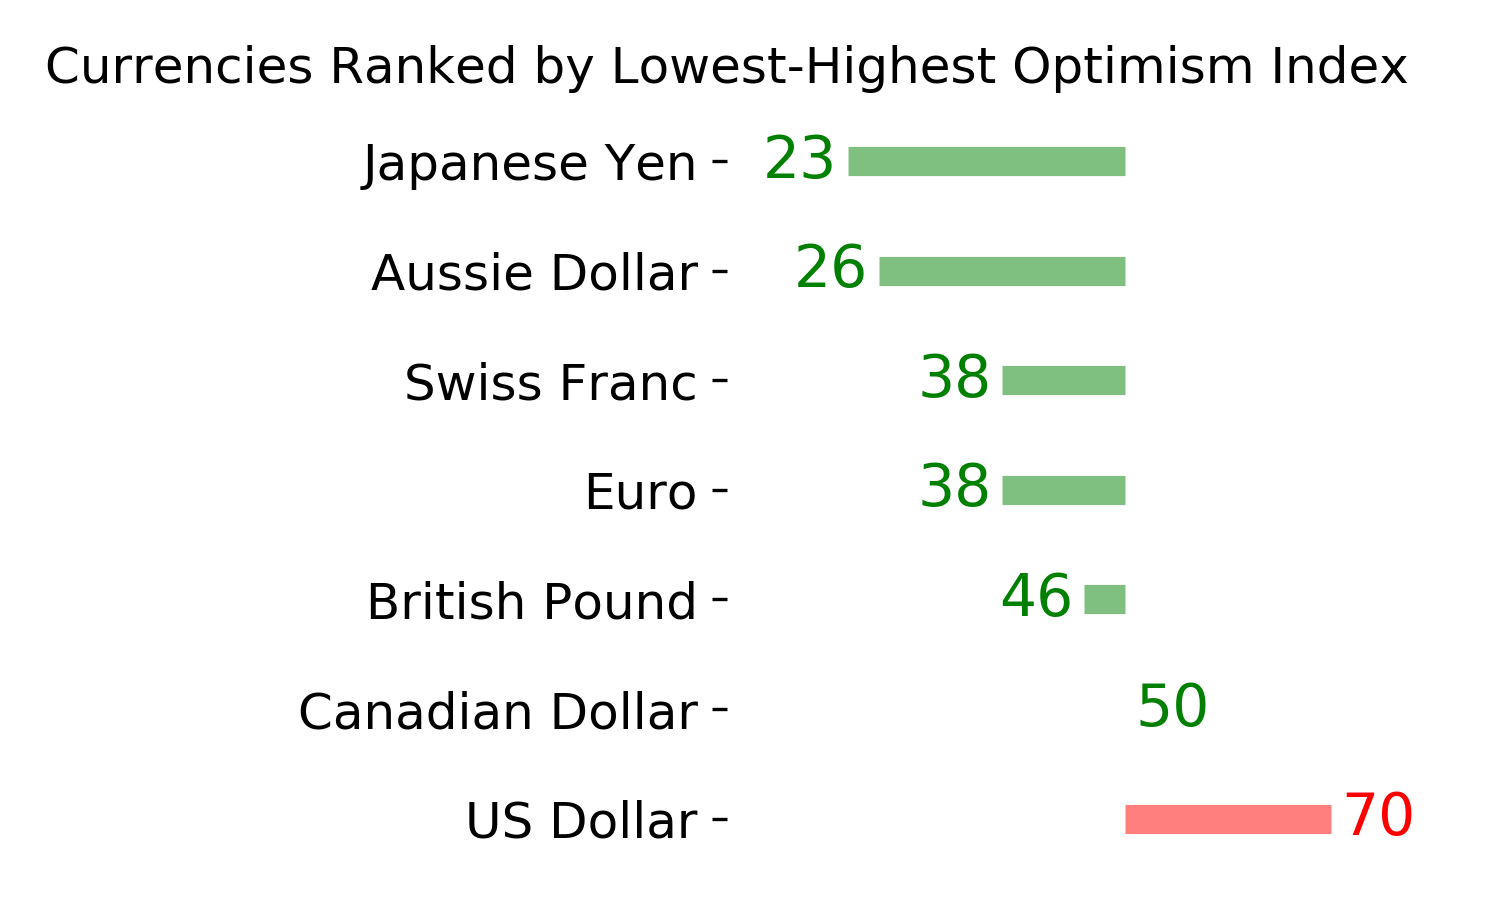
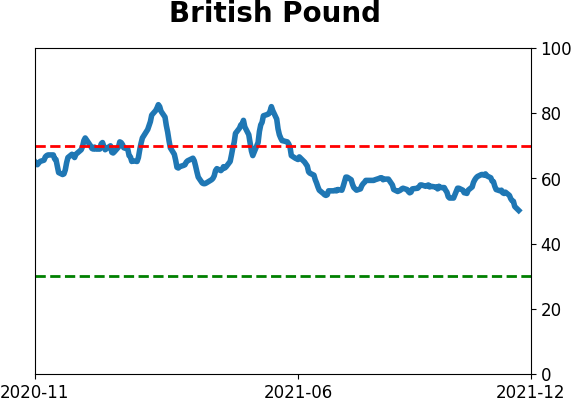
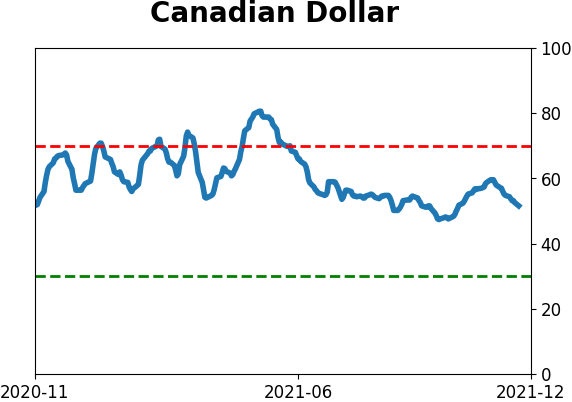
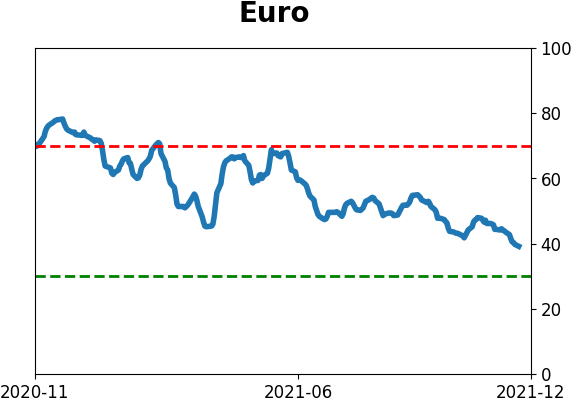
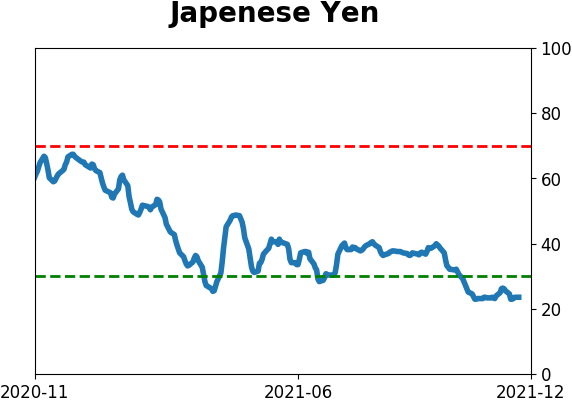
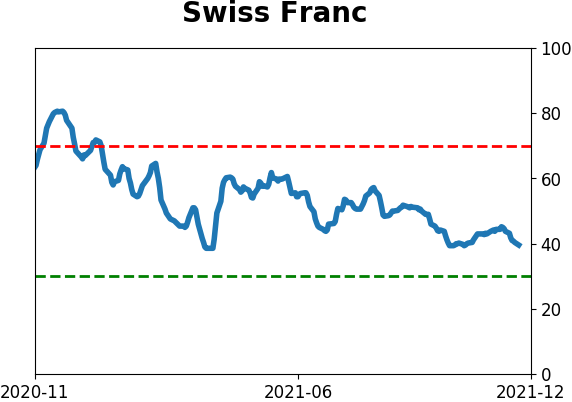
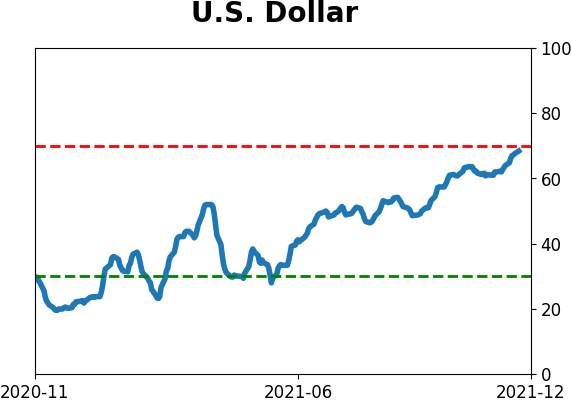
Currency ETF's - 5-Day Moving Average
|
|
|
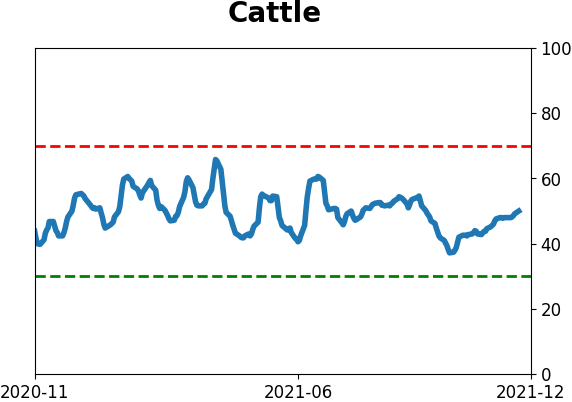
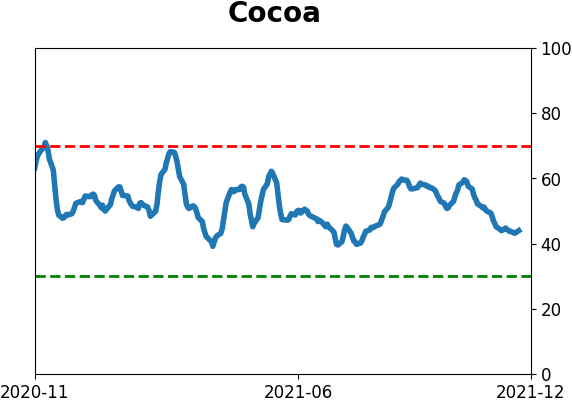
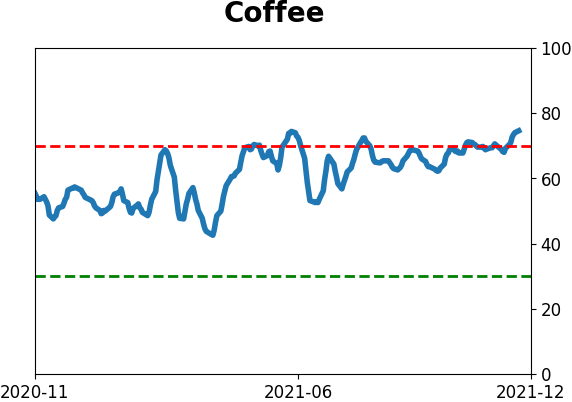
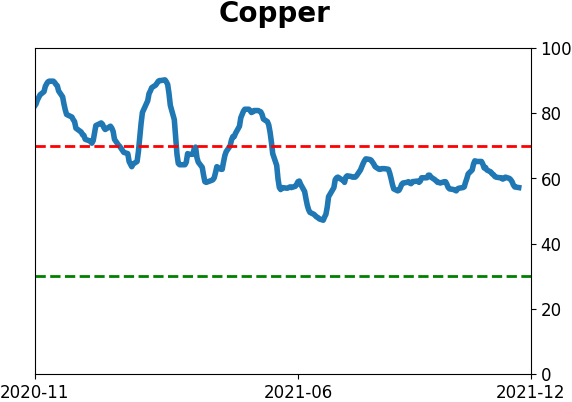
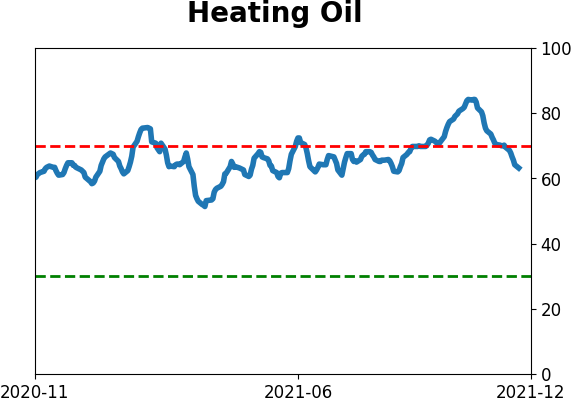
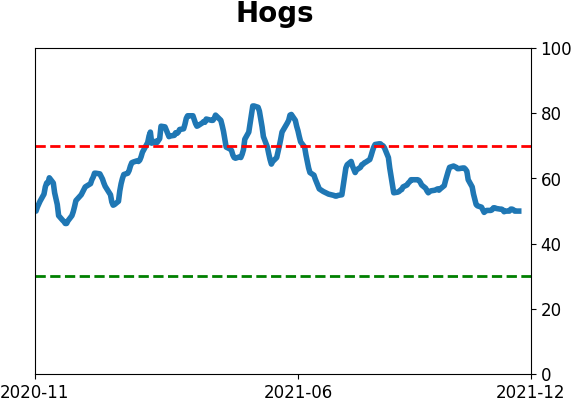
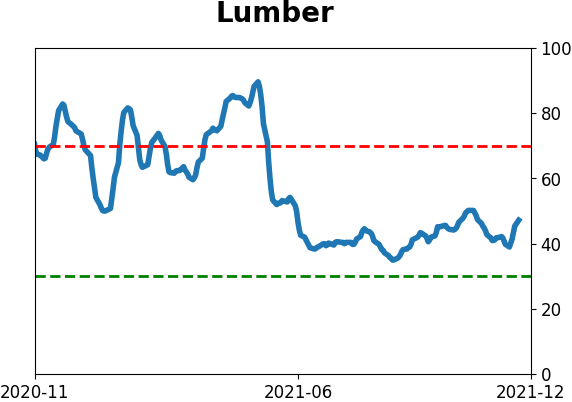
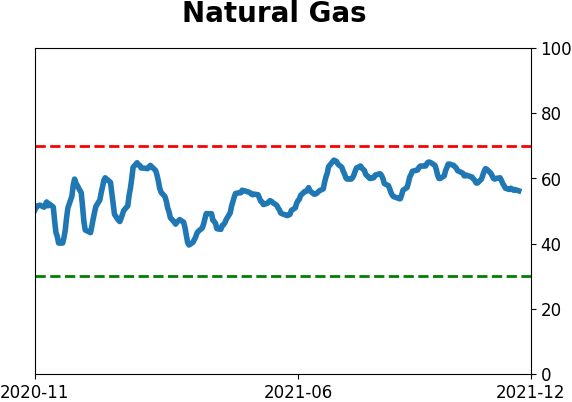
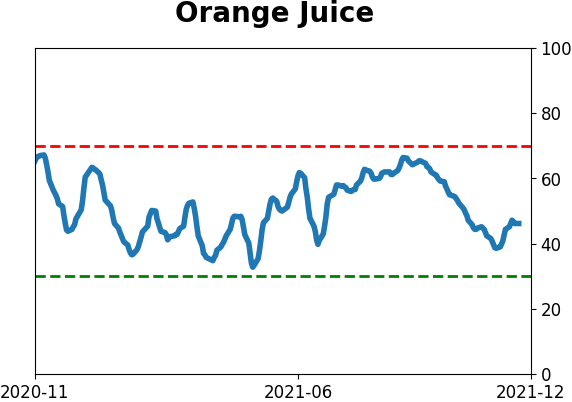
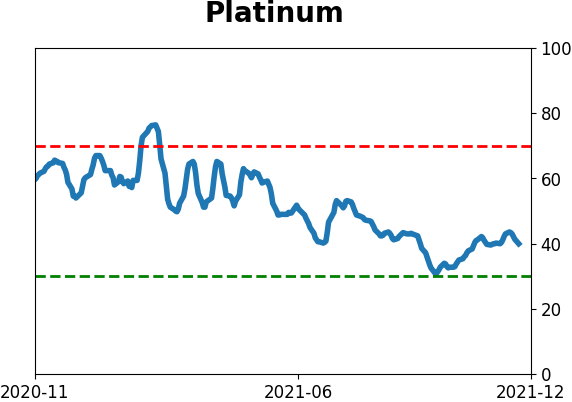
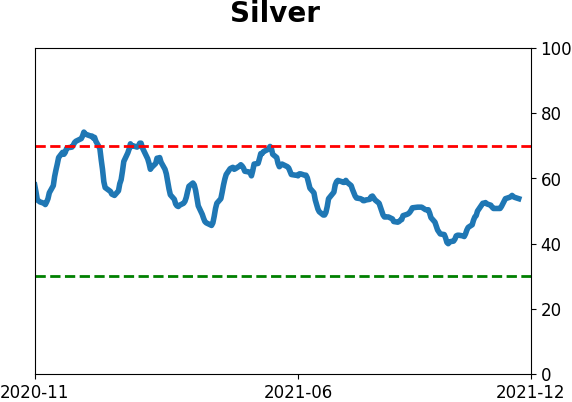
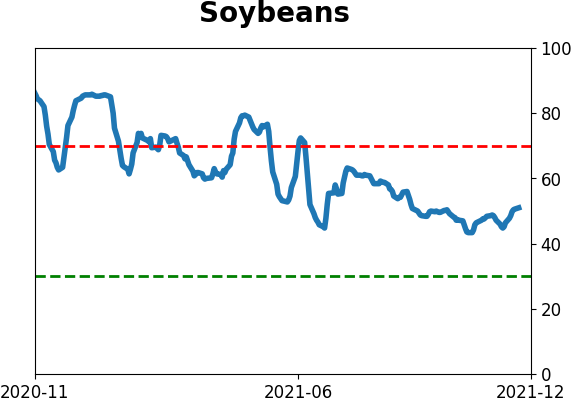
Commodity ETF's - 5-Day Moving Average
|
|