
Despite records, consumers aren't very optimistic

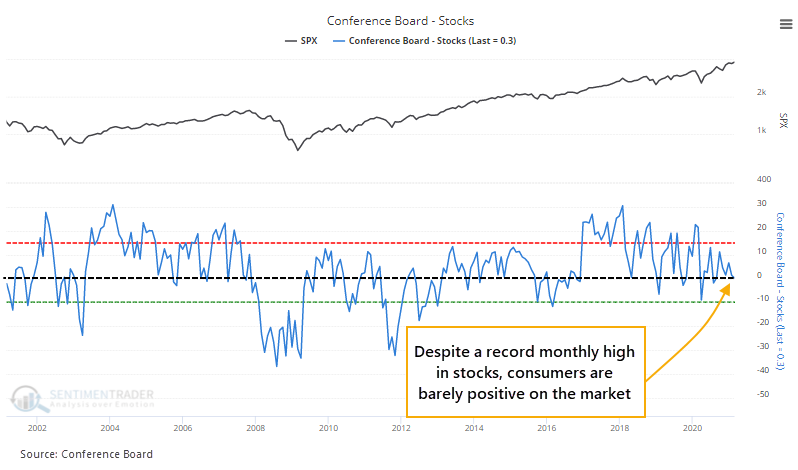
Despite a record monthly close in the S&P 500 and most other broad indexes in February, the average U.S. consumer isn't all that optimistic.
There are definite signs of speculative froth, even unbridled euphoria, among investors, but "investors" don't necessarily overlap with "consumers." The latest survey from the Conference Board shows that explicitly.
The latest results showed that almost as many consumers expect stocks to fall this year as to rise.
This is unusual. There is a 0.40 correlation (on a scale from -1.0 to +1.0) between the distance the S&P 500 is from a 3-year high and the net percentage of consumers that expect stocks to rise going forward. In other words, the closer the S&P is to a high, the more that consumers expect it to keep going.
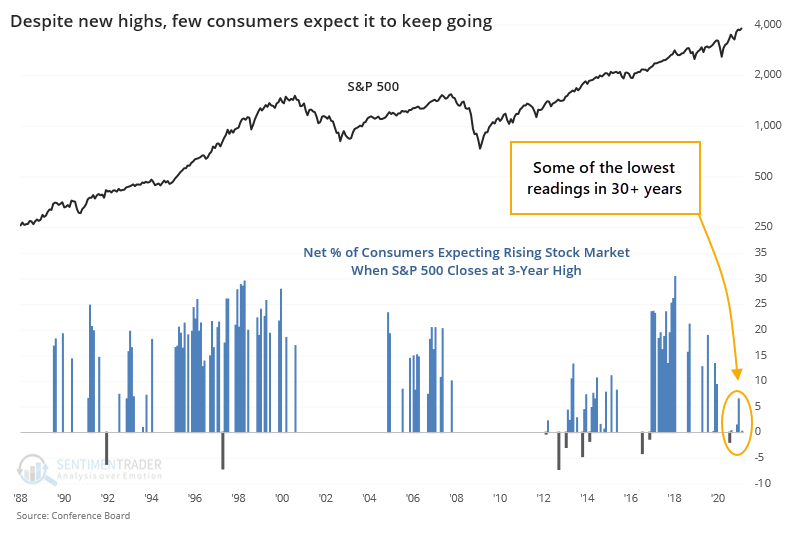
Recent months are showing some of the least optimistic readings in more than 30 years.
This is supposed to be a good sign of the proverbial Wall of Worry, so let's check.
The table below shows every month when the S&P 500 closed at a 3-year high, while consumers were the least optimistic on the market's prospects going forward. On average for these signals, only 0.3% more consumers expected stocks to rise than fall, which is exactly what the spread was in February.
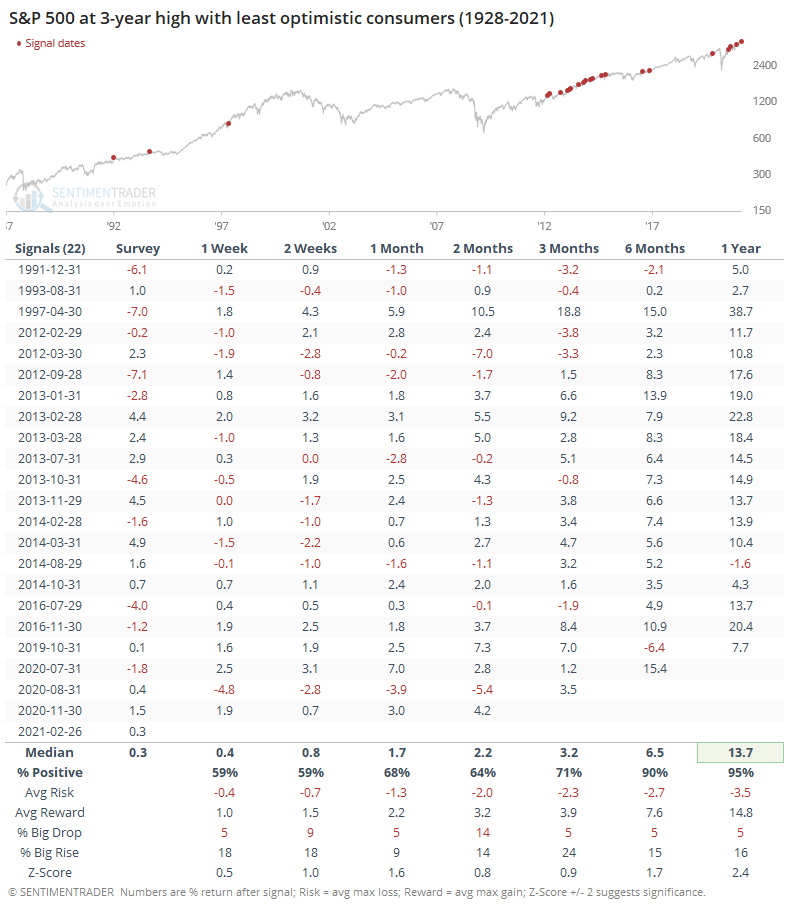
Overall, it proved to be a modest positive, thanks in large part to the cluster of readings since 2013-14. If we take out those two years, then the medium-term returns suffer quite a bit. Over the next 6-12 months, though, it was hard to find a negative return of any consequence.
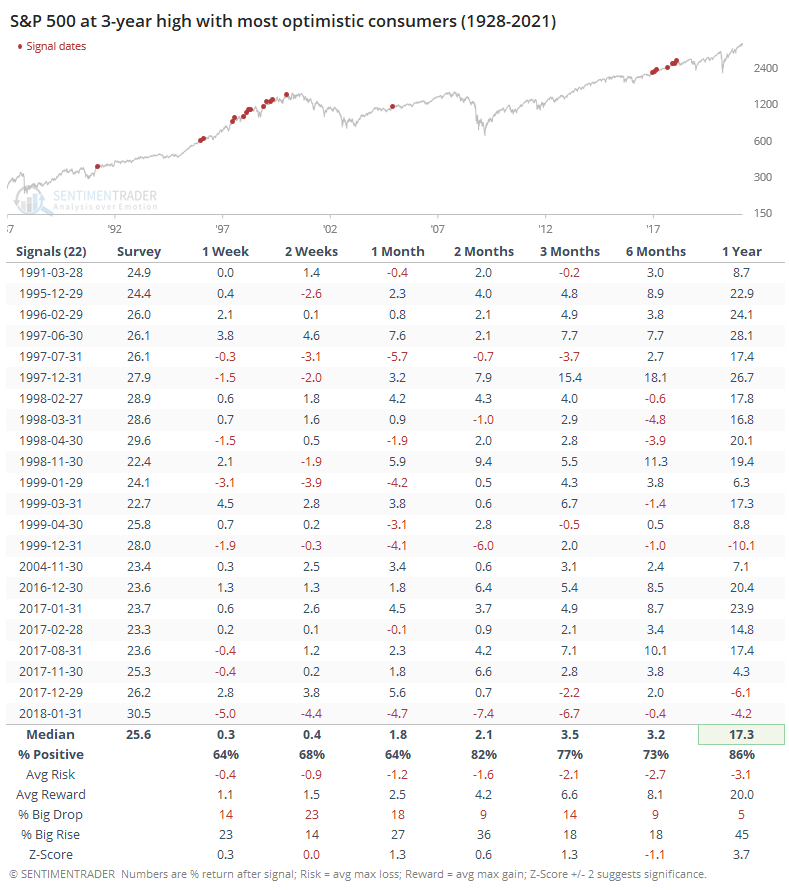
If we look at those months when consumers were most optimistic about future returns, then there wasn't much of a difference. While it preceded a couple of nasty falls, forward returns were in some respects even better than those months when consumers were pessimistic.
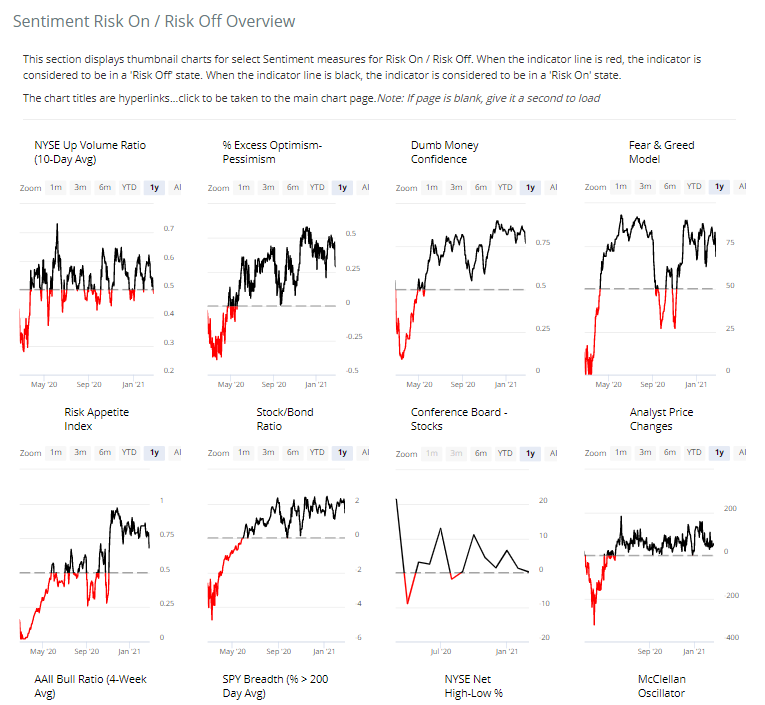
Consumers' preference for stocks is one of the gauges on a new page that Eric created. The Sentiment Risk-On / Risk-Off Overview is a single place to see a broad cross-section of indicators and how investors are positioning themselves. You can find it by going to Spotlights > Sentiment Risk-On / Risk-Off Overview.
Simple binary thresholds are used to determine whether sentiment is in risk-on (black) or risk-off (red) mode. The more indicators that are black, the more that we're in a risk-on mode, and more likely that dips will be bought. The more indicators are showing red, the more likely that rallies will be sold. It also gives a good overview of extremes either way.
Eric also aggregated all of the measures into one master Risk-On / Risk-Off Indicator. This is simply the percentage of indicators on that page that are currently showing risk-on behavior. Anything above 50% tends to coincide with risk-taking behavior. When it drops below 50%, that's when stocks tend to consistently struggle.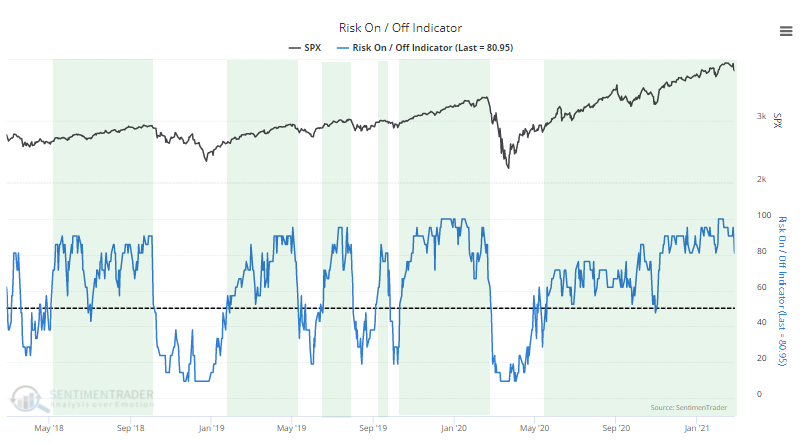
Like we've seen with so many measures lately, about the only negative here is that things have been so positive for so long, that they're less likely to lead to large, sustained gains. This aggregate has been in risk-on mode for 80 consecutive days, among the longest stretches in 20 years.
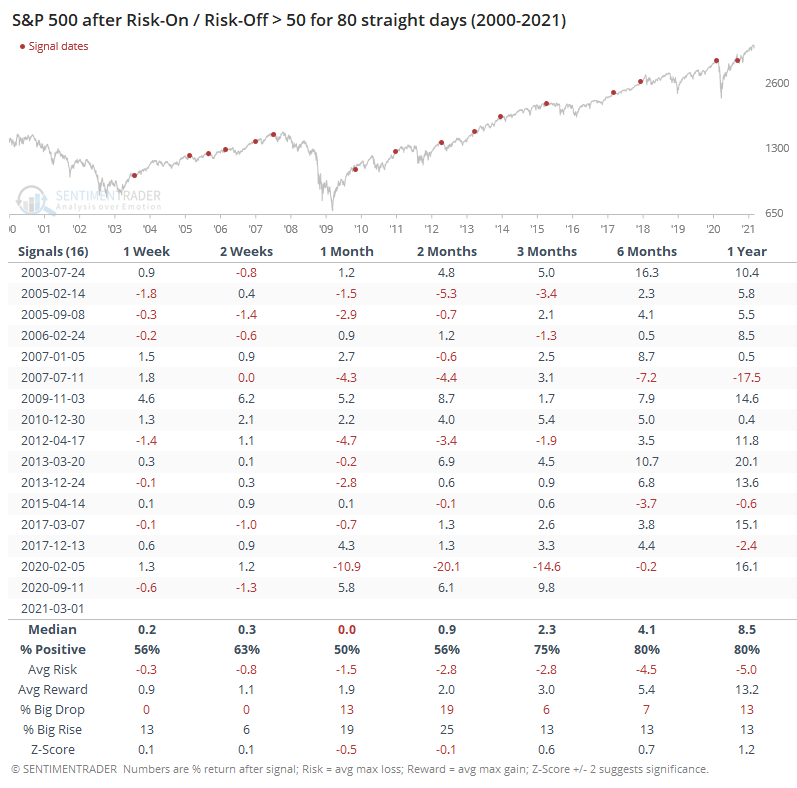
Returns after the others weren't terrible, but 11 out of the 16 showed a negative return sometime between 1-3 months later.
We have another half dozen or so indicators that should be added this week. If you're looking for a single place to check for a broad overview of how investors are behaving across time frames, this is it.
Some of them, like consumers' attitudes toward stocks, are at or near risk-off mode. Those are more of the exception than the rule, though, so it's safe to say that for now, investors will keep looking to buy the dip.