
Doubling Up Moving Average As S&P Members Get Overbought


This is an abridged version of our Daily Report.
Doubling up the averages
The S&P is 3% above its short-term moving average, 6% above its medium-term and 13% above its long-term.
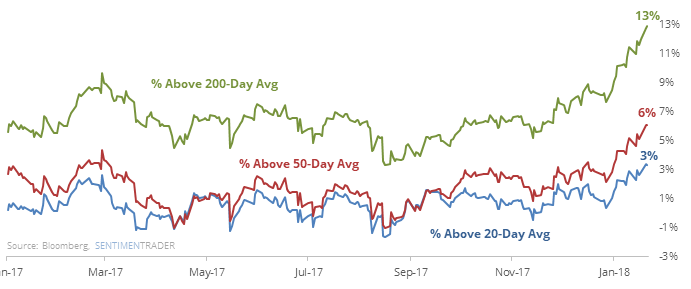
It hasn’t managed to “double up” its gains above each successive moving average in 20 years. Similar bouts of momentum saw short-term weakness, long-term strength.
It’s not just the index
The Relative Strength Index on the S&P 500 is historically stretched, but it’s not alone. More than a quarter of stocks in the index are also stretched, the most in 5 years.
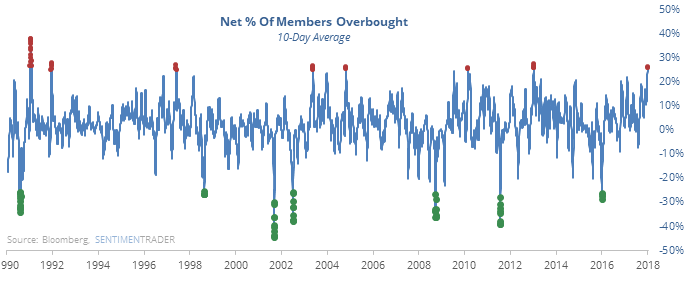
Other times that so many stocks were stretched saw fragile gains when not coming out of a bear market.
Stunning
For only the third time since the inception of QQQ, more than a quarter of the stocks in the index have averaged a 52-week high for a week straight. According to the Backtest Engine, the only other times it managed to do this were in mid-July and late-October 2013.
Dollar can’t catch a break
In the Phases And Ranks later in this report, we can see that the U.S. dollar is the most-hated currency. It’s actually about the most-hated asset we follow, with an Optimism Index below 25.
Using screens
We posted a new video about using the screens to find opportunities based on shorter-term sentiment within longer-term up/down trends and positive/negative seasonal windows. As we add more, you can find these at More > SentimenTrader Overview Videos.
For access to the full report, indicators, charts, screens, and Backtest Engine, log in or sign up for a free 30-day trial today.