
Dow's Long Correction With Positive S&P Breadth

This is an abridged version of our Daily Report.
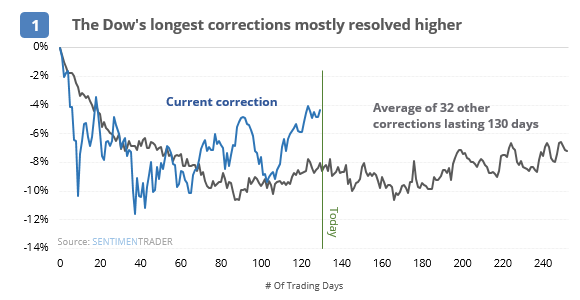
The Dow’s long correction
The Dow has gone 130 days without a new high or 20% loss, one of its longer stretches in purgatory. Other periods when it got stuck in a correction mostly resolved higher, with a choppy 1-2 months generally leading to new highs.
S&P breadth points higher
Even as the S&P 500 meanders below its 52-week high, its Advance/Decline Line has not. Over the past month, a near-record number of positive divergences have triggered.
Cooked
The main ETF focused on Turkish equities (TUR) suffered another large loss on Monday, pushing its Optimism Index to a lowly 2. That’s not often seen on any fund. According to the Backtest Engine, since the financial crises it has been this low 9 times.
Site updates
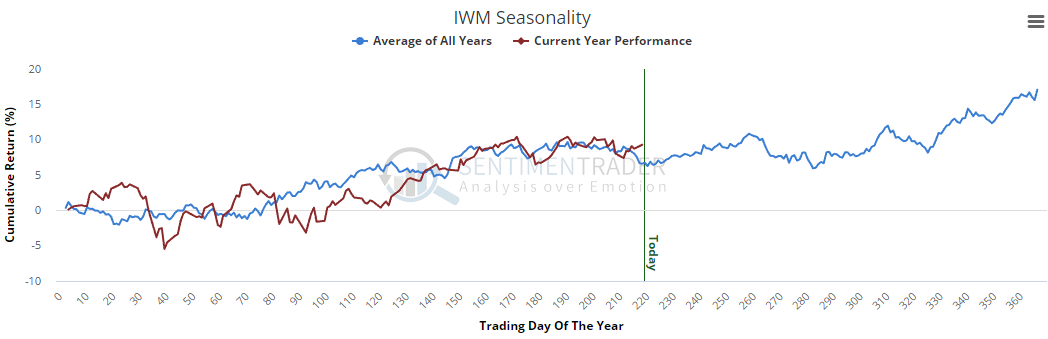
Eric has added a couple of great new features to the site. Seasonality charts now include a “today” marker along with year-to-date performance, showing how the ETF (or index or commodity) has performed relative to its usual pattern. Check out corn, or IWM, for example.
He’s also added thumbnail charts for bonds, commodities, sectors and countries, the same as is shown later in each of these reports. It’s a great way to see sentiment for groups at a glance. You can check the What’s New section periodically to see the latest enhancements.
For access to the full report, indicators, charts, screens, and Backtest Engine, log in or sign up for a free 30-day trial today. |