
Election Cycle This, Election Cycle That

A lot of analysis has been done regarding the purported 4-year election cycle in the U.S. stock market.
And there are a whole lot of ways one can slice the data. This piece will look at two distinct periods within the 4-year election cycle. Trading based on the election cycle typically involves buying an index fund representing a particular stock index. However, the thing to remember though is that it is not just when you buy an index that counts. In many cases, which index you buy can also make a big difference.
For the purposes of this piece, we will focus solely on the performance of the Dow Jones Industrial Average during two portions of the 4-year election cycle. In Part II we will consider what happens if we use a different index. But first things first.
Election Cycle: Period 1
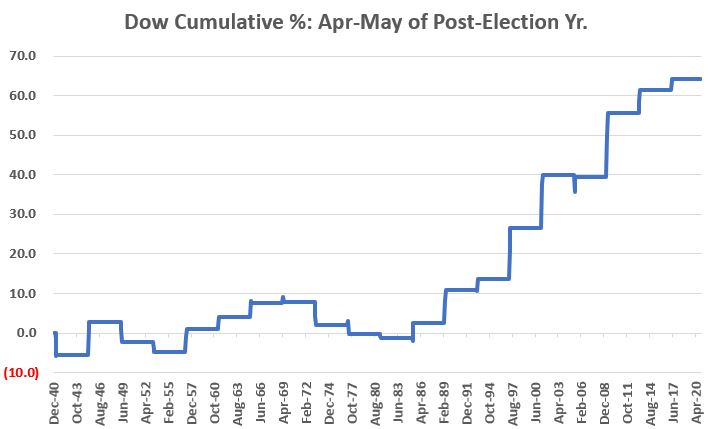
For Period 1 we will look at the price performance for the Dow ONLY during April and May of the Post-Election year starting in 1941.
The chart below displays the cumulative price gain for the Dow during this 2-month period every four years. As you can see, things were:
- pretty "hit-or-miss" for the first 40+ years
- pretty spectacularly consistent after that
The Table below displays the actual cycle-by-cycle results.
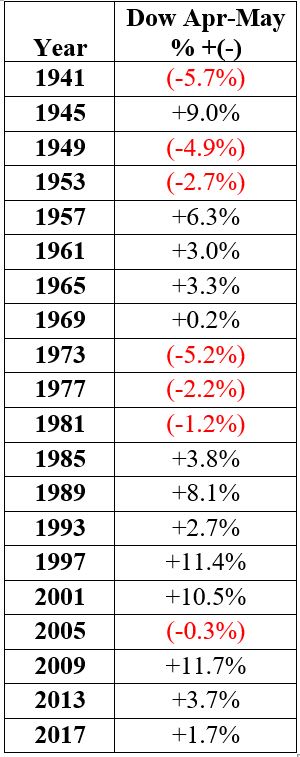
The Dow showed a gain during this 2-month period 5 times during the first 11 election cycles and then 8 of the last 9. What will happen in April-May of 2021? We'll just have to wait and see. In Part II of this series we will compare the returns for the Dow during this period to that of another index.
Election Cycle: Period 2
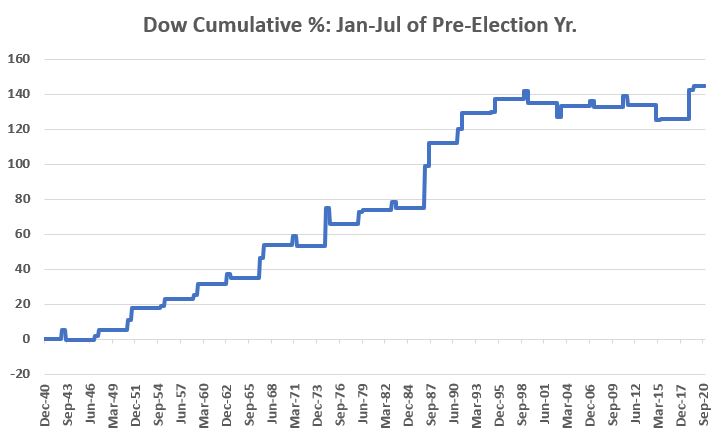
For Period 2 we will look at the price performance for the Dow ONLY during January through July of the Pre-Election year starting in 1943.
The chart below displays the cumulative price gain for the Dow during this 7-month period every four years. As you can see, things were:
- pretty spectacularly consistent for the first 60 years
- pretty "hit or miss" after that
The Table below displays the actual cycle-by-cycle results.
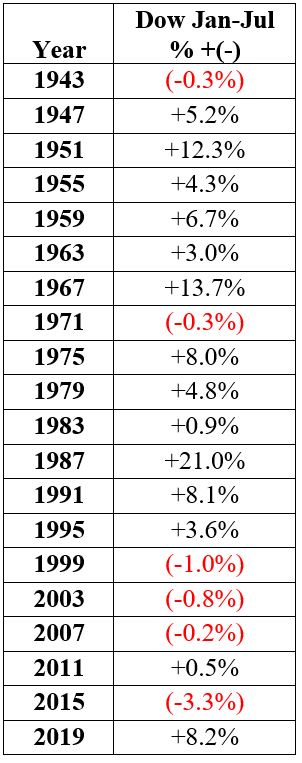
The Dow showed a gain during this 7-month period 12 times during the first 14 election cycles and then only 2 of the last 6. What will happen in January-July of 2023? Who knows? But again, Part I is merely a segue into Part II where we will compare the returns for the Dow during this period to that of another index.
Two Periods Combined
Just to complete the "experiment", lets assume that an investor held the Dow Jones Industrial Average ONLY during April and May of each post-election year and during January through July of every pre-election year starting in 1941 (a return of zero percent is assumed for all other months). The equity curve for this "strategy" (such as it is) appears in the chart below.
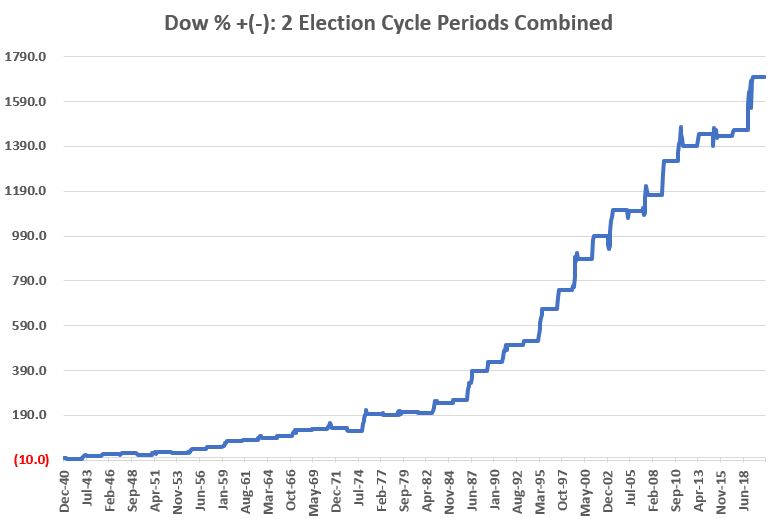
The Table below displays the actual cycle-by-cycle results.
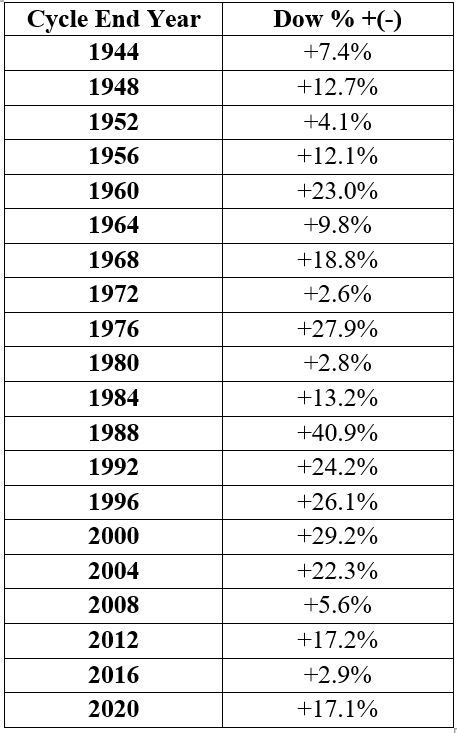
Because this "strategy" entails holding the Dow during only 9 out of every 48 months, the gross return is not really enough to justify this as a "standalone" strategy. Still, given that holding the Dow only during these 9 months out of every 48 has generated a gain during all of the 20 previous election cycles, it is hard to argue with the consistency.
In Part II we will look at the potential for enhancing performance by using indexes other than the Dow Jones Industrial Average.