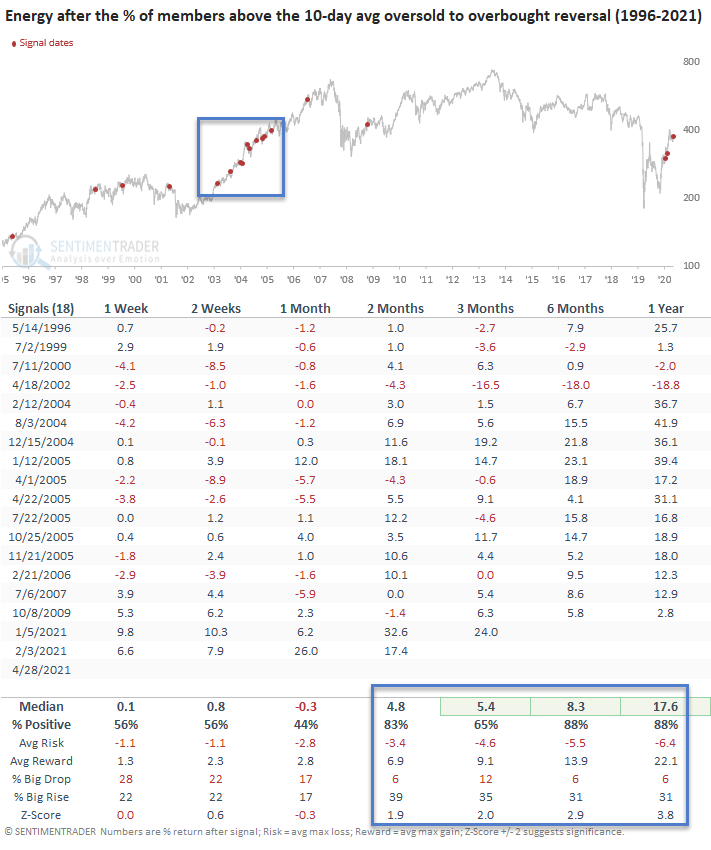
Energy - Oversold to Overbought Reversal Buy Signal

The percentage of S&P 500 energy members trading above their respective 10-day moving average registered an oversold to overbought reversal buy signal on 4/28/21.
THE CONCEPT
The oversold to overbought reversal signal identifies instances when the percentage of members trading above their respective 10-day moving average reverses from oversold to overbought in a user-defined number of days or less. The model will issue an alert based upon the following conditions.
CONDITIONS FOR BREADTH SIGNAL
- Percentage of members cross below 9.75%. i.e., reset condition
- If percentage of members goes from <= 9.75% to >= 92.25% in 5 days or less, then buy
Please see my note from 3/29/21 for more information on the signal concept.
Let's take a look at some charts and the historical signal performance.
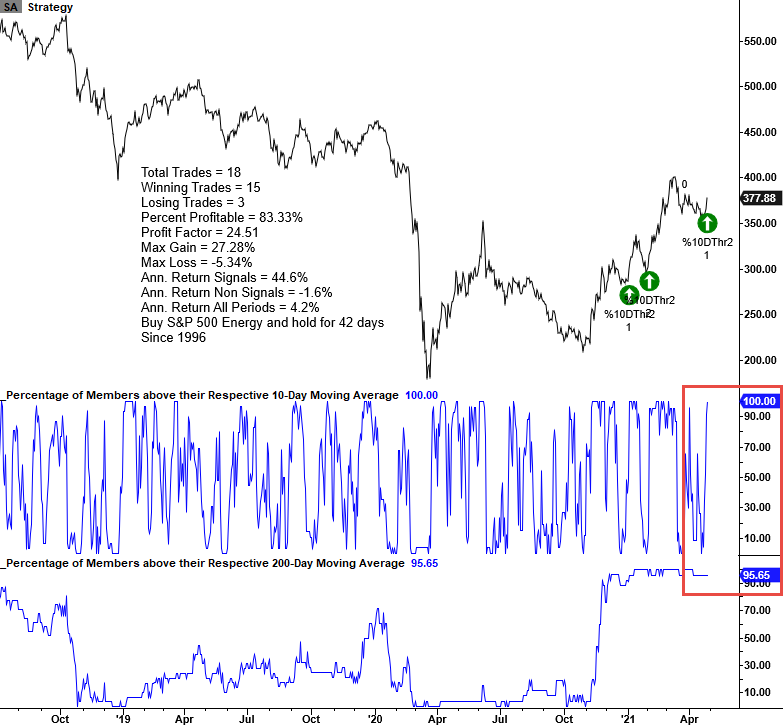
CURRENT CHART
HOW THE SIGNALS PERFORMED
The 2-month timeframe provides a slight edge, but it's not something that gets me excited about jumping in and playing a reversal signal.
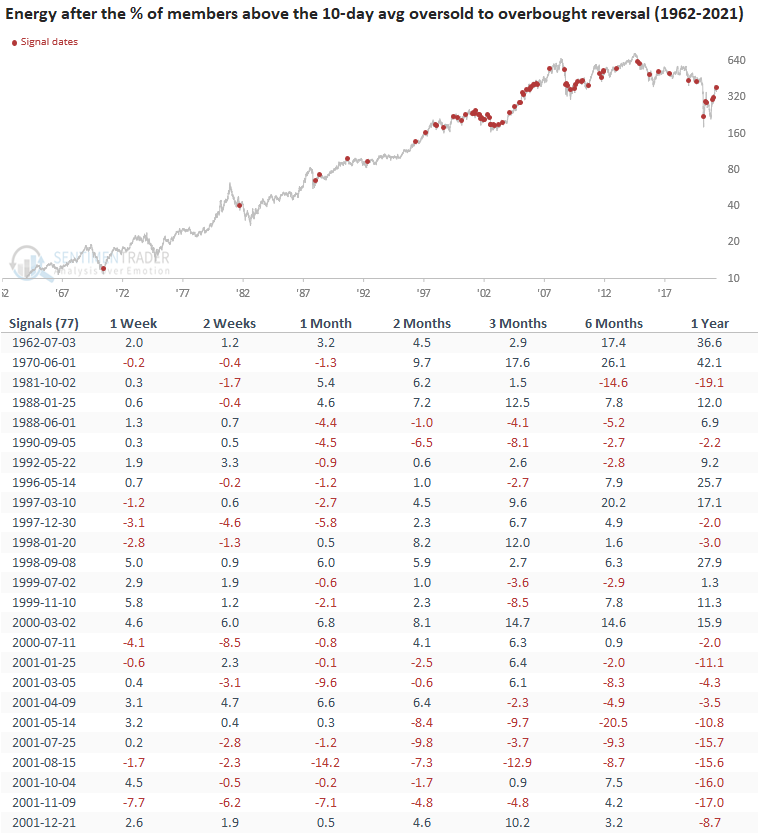
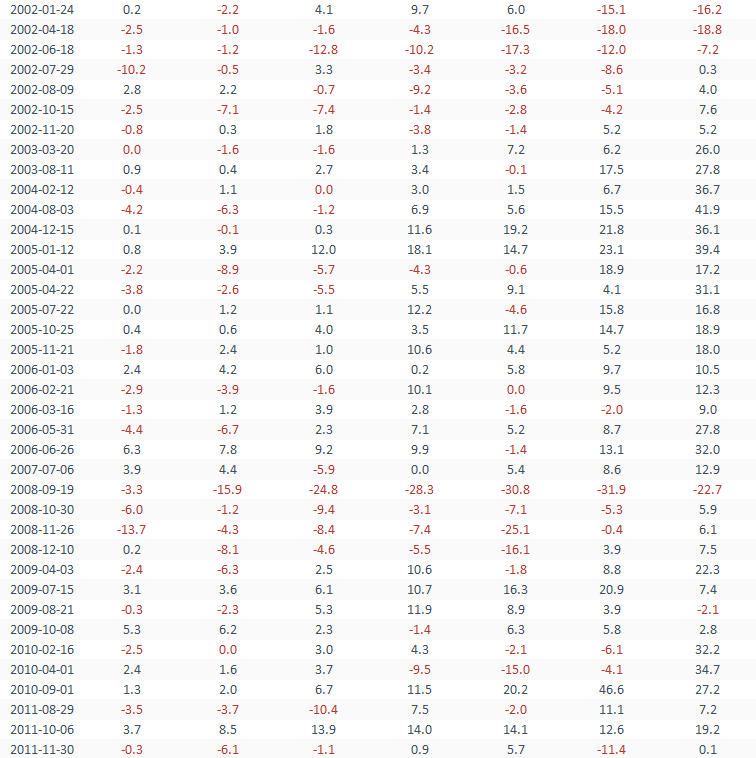
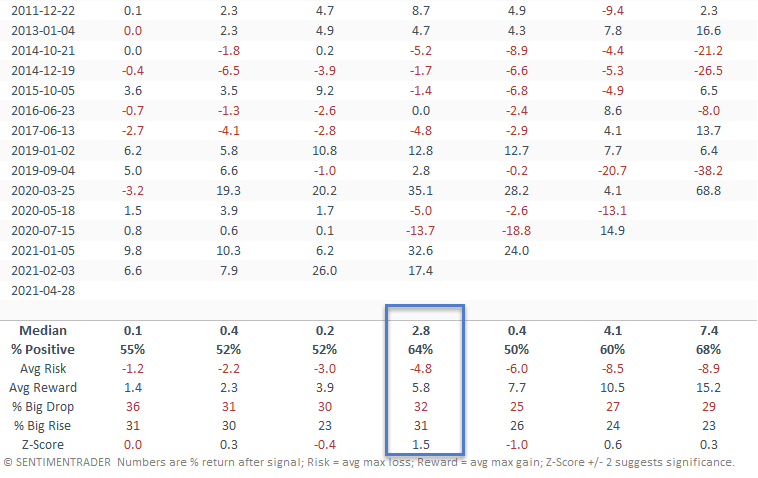
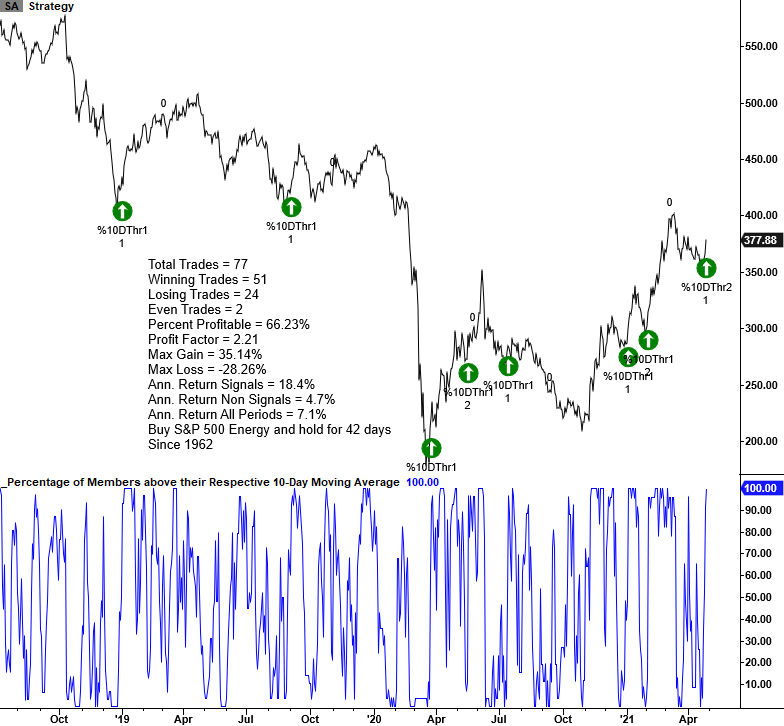
Let's look at the same signal when the percentage of members trading above their respective 200-day moving average is 90% or greater, a level that is indicative of a strong uptrend. I relaxed the 200-day parameter from the current reading of 95% to show a larger sample size.
CURRENT CHART WITH PERCENT ABOVE 200-DAY FILTER
HOW THE SIGNALS PERFORMED WITH PERCENT ABOVE 200-DAY FILTER
Performance looks significantly better in the 2-12 month timeframe with several notable z-scores. While the 1-month timeframe is unfavorable, I would note that the more recent signals look better.