Products
SentimenTrader Trading Tools
‍
Backtest Engine
My Trading Toolkit
Correlation Analysis
Seasonality
Indicators & Data API
‍
Proprietary Indicators & Charts
Market Data API
Strategies & Scanner
‍
50+ Trading Strategies
Smart Stock Scanner
Research Reports
‍
Research Solutions
Reports Library
Free Resources
Simple Backtest Calculator
Simple Seasonality Calculator
The Kelly Criterion Calculator
Sentiment Geo Map
Public Research Reports
Pricing
Company
About
In the News
Testimonials
Client Success Stories
Contact
Log inLoginSign up
< BACK TO ALL REPORTS

Excess Liquidity Is Draining From the Market

Jason Goepfert
2021-06-04
With money flowing out of financial assets and into productive ones, Excess Liquidity is draining from the market.

The flood of money that found its way into financial markets is leaving and pooling into economic production. This behavior suggests that  Excess Liquidity is plunging.

On our site, we define Excess Liquidity as:

This shows the growth in growth in M2, a broad measure of the money supply that includes deposits and money market funds, and the growth in the economy. In the long term, they tend to grow together. However, when the supply of money grows faster than the economy (represented by the growth in Industrial Production), the excess money is not invested in "things" but rather tends to find its way into financial assets. Therefore, high levels of excess liquidity tend to be positive for stock prices. Low levels of excess liquidity are negative for stocks but are not as strong as the opposite condition.

We can see just how much this figure spiked and then plunged with the latest economic releases.

Excess liquidity m2 industrial production

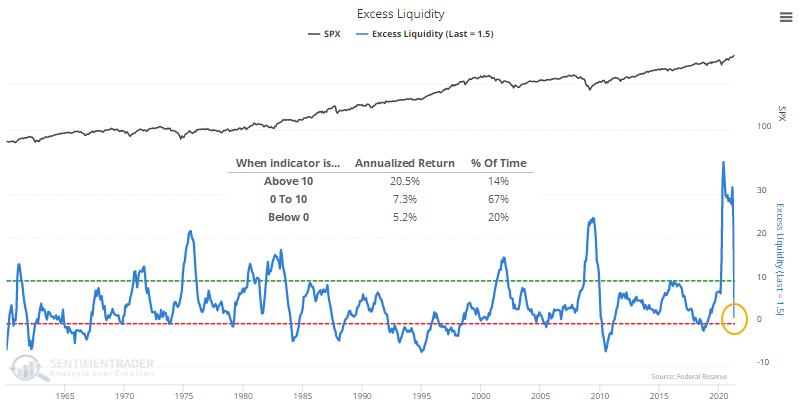
The S&P 500 has returned an annualized +20.5% when Excess Liquidity is above 10%, where it had been since last March. Its returns are more in line with random as that figure drops below 10% and heads toward zero. 

The overall takeaway from the plunge in Excess Liquidity shouldn't be that it's necessary bearish. More than anything, for the broader market, it's simply "not bullish." Stocks tend to perform better when the figure is high. When it drains out, the S&P has mostly held up okay, but two sectors, in particular, showed vastly different returns.

Stat Box

More than $1 billion flowed out of the Nasdaq 100 trust, QQQ, on Thursday. According to our Backtest Engine, over the past 3 years, buying QQQ and holding for 1 month following a $1 billion outflow would have returned 188% versus 98% for buy-and-hold.


What else we're looking at

  • Full returns in the S&P 500 after a plunge in Excess Liquidity
  • How sectors and factors performed after Liquidity declined
  • A look at momentum stocks, and whether they suffered from draining Liquidity
  • Brazilian stocks are showing an internal thrust
  • An update on the gold / S&P 500 ratio and where it stands today
PRODUCTS
SentimenTrader
Trading Tools
Indicators & Data API
‍
Strategies & Scanner
‍
Research Reports
FREE
RESOUrCES
Simple Backtest
Calculator
Simple Seasonality
Calculator
The Kelly Criterion
Calculator
Sentiment Geo Map
‍
Public Research Reports
‍
Pricing
Bundle pricing
‍
Announcements
‍
FAQ
COMPANY
‍
About
‍
In the News
‍
Testimonials
‍
Client Success Stories
CONTACT
‍
General Inquiries
‍
Media Inquiries
‍
Financial Professionals Inquiries
‍
© 2025 Sundial Capital Research Inc. All rights reserved.
Setsail Marketing
TermsPrivacyAffiliate Program
Risk Disclosure: Futures and forex trading contains substantial risk and is not for every investor. An investor could potentially lose all or more than the initial investment. Risk capital is money that can be lost without jeopardizing ones’ financial security or life style. Only risk capital should be used for trading and only those with sufficient risk capital should consider trading. Past performance is not necessarily indicative of future results.

Hypothetical Performance Disclosure: Hypothetical performance results have many inherent limitations, some of which are described below. No representation is being made that any account will or is likely to achieve profits or losses similar to those shown; in fact, there are frequently sharp differences between hypothetical performance results and the actual results subsequently achieved by any particular trading program. One of the limitations of hypothetical performance results is that they are generally prepared with the benefit of hindsight. In addition, hypothetical trading does not involve financial risk, and no hypothetical trading record can completely account for the impact of financial risk of actual trading. for example, the ability to withstand losses or to adhere to a particular trading program in spite of trading losses are material points which can also adversely affect actual trading results. There are numerous other factors related to the markets in general or to the implementation of any specific trading program which cannot be fully accounted for in the preparation of hypothetical performance results and all which can adversely affect trading results.

Testimonial Disclosure: Testimonials appearing on this website may not be representative of other clients or customers and is not a guarantee of future performance or success.