
Extreme Greed As Utilities And Yields Forge Unholy Alliance

Extreme greed
The CNN Fear & Greed proxy model has moved further into optimistic territory, now showing Extreme Greed, pushed higher by most of the components in the model.
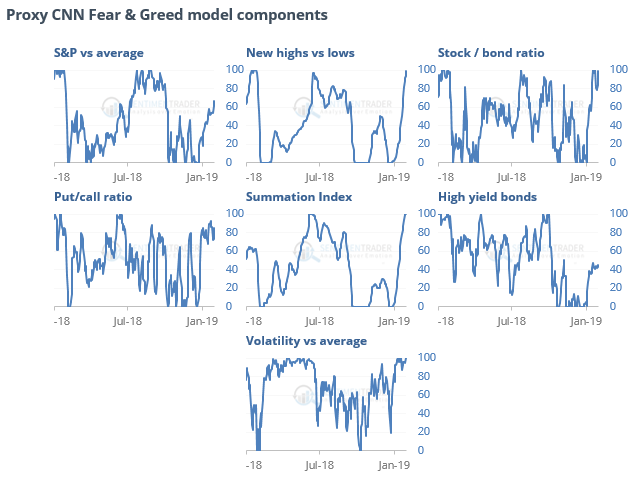
Other times it has become this stretched in a downtrend, future returns were almost exclusively negative. There were 99 days since 1998, with only 28% of them showing a positive return two months later.
Unholy alliance
Utilities stocks are highly sensitive to the moves in interest rates. Higher bond yields usually mean lower prices for Utilities, so the rolling correlation between them is almost always negative, at least since 1962. Lately, though, it has become very positive, and that has preceded some tough market environments.
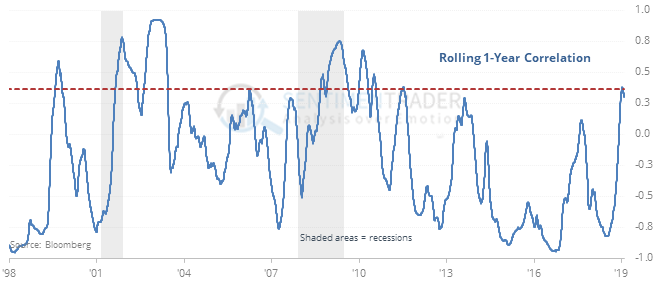
For Utilities stocks, it was an even worse development. The Dow index suffered losses over the next 3-9 months every time, and they were large. For bonds, it was a similarly bad sign, as yields headed higher over the next 9 months every time as well.
Energetic
More than 95% of Energy stocks are above their 50-day averages, the most of any sector, while the XLE fund is still trading below its 200-day average. According to the Backtest Engine, this happened 3 other distinct times (Dec 2012, May 2009, Mar 2016).
Tailwinds
According to the Seasonal bias for the most popular ETFs, February has been good to metals and miners (click the Value column header twice for the most positives ones to show up at the top). The Sentiment & Seasonality screen isn’t showing many funds with pessimism during a traditionally positive time of the time, and vice-versa but that will be one to watch to see if any of the commodity-related ones show up in the coming days.
This post was an abridged version of our Daily Report. For full access, sign up for a 30-day free trial now.