
Extreme Momentum in Energy Stocks

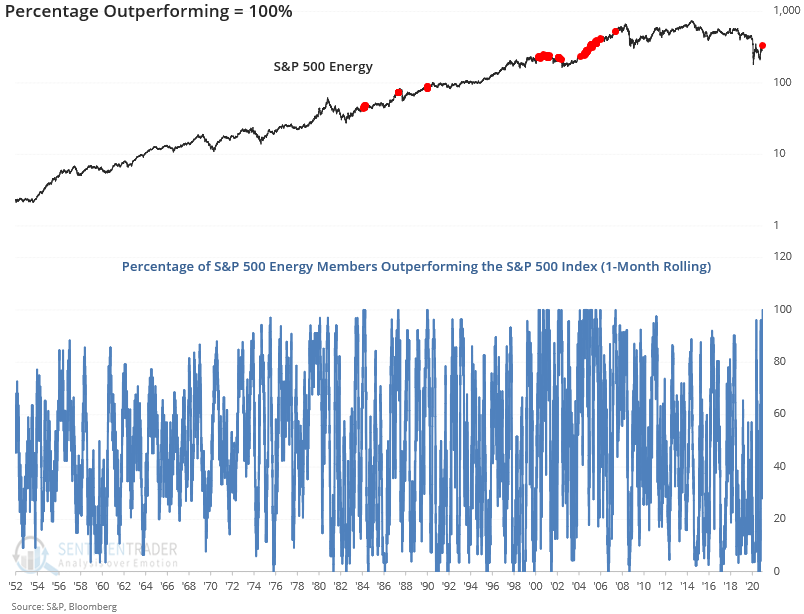
Momentum in energy stocks hit an extreme level on 1/14/21 as 100% of the sector members outperform the S&P 500 Index on a rolling 21-day basis. As a result of the surge in energy stocks, the signal count for a composite thrust model that contains several other measures reached a reading of 75%. I want to assess how historical instances of extreme momentum in the energy group impact forward returns in today's note.
Historical Example
As the chart below indicates, it's rare to see 100% of the energy group members outperform the S&P 500 Index. The last signal occurred in June 2007 as energy was well entrenched in a multi-year bull market.
Signal Performance
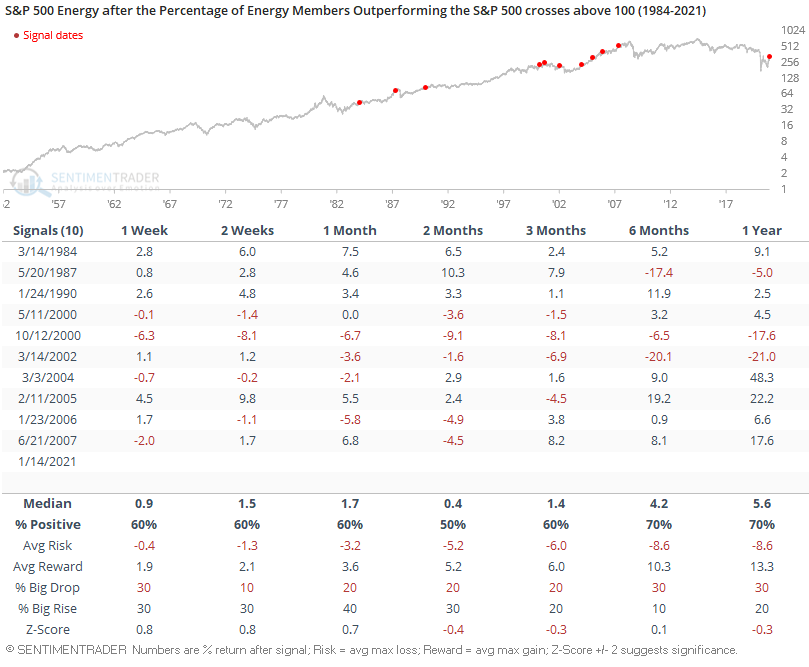
The table's signals contain all instances when the percentage of members outperforming the SPX reached 100% with a reset below 25%. I use a reset to filter out repeats. The sample size is small, with mixed results. If you're in the camp that energy is on the cusp of a new bull market, one could focus on the 2004 signal as an analog. Otherwise, you might think about the 2000 growth peak signals.
Composite Thrust Model for Sectors
With the new signal in the percentage of issues outperforming, let's look at a composite model containing the algorithm. The following analysis utilizes a Composite Thrust Model for sector data that includes eight measures for identifying extreme momentum through internal and external participation.
The composite includes the following:
- Percentage of issues above the 10-day bearish to bullish reversal
- Percentage of issues above the 50-day moving average surge
- Percentage of issues overbought surge
- Percentage of issues at a 21-Day high surge
- Breadth Thrust
- Volume Thrust
- Rate of Change Thrust
- Percentage of members outperforming surge
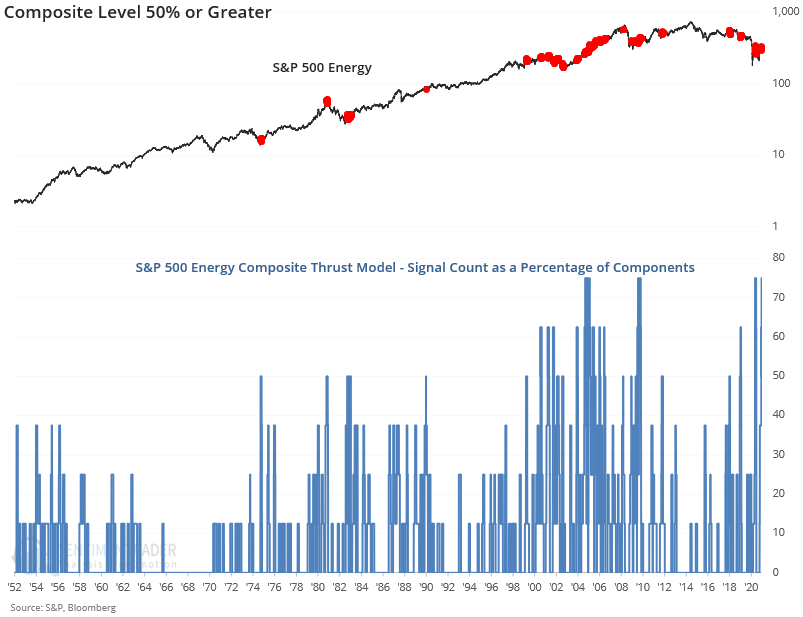
Composite readings of 75% are rare. Aside from the new signal on 1/14/21, it's only happened four other times since 1952. Instances include June 2020, August 2009, February 2005, and October 2004, helping to confirm some recent notes by Jay and Jason related to rig counts.

Let's lower the threshold level to 50% and conduct a study to see how energy performs after a signal. As the chart below indicates, a lower threshold for the composite produces more historical signals.
Performance Results
Performance results are weak across several timeframes. In some cases, the z-score is approaching the significance level of -2. The most recent signal in June 2020 was a complete disaster.

Bottom line: Energy is a challenging group. Today's study confirms that extreme momentum can be unkind if one is late to the party as the returns are weak. From a long-term perspective, one could make the case that the group is flashing a sign that says, pay attention to me.