Extreme moves in gold and silver
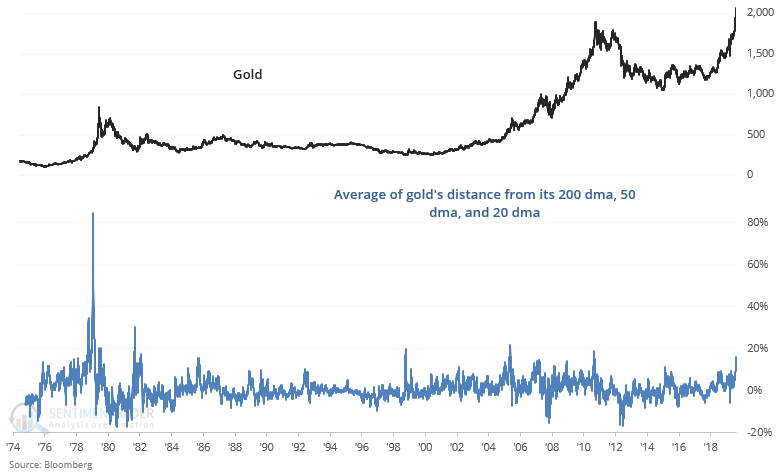
I've recently touched on extreme readings in gold and silver, usually with the conclusion that this is slightly bearish for precious metals in the short term. Plenty of journalists and social media personalities touched on gold's extreme deviation from its 200 dma. This is useful way of looking at big market movements, but can be improved if we look at gold's average distance from several moving averages of different time frames.
The following chart look's at the average of gold's distance from its 200 dma, 50 dma, and 20 dma:
When gold rallied so far ahead of all 3 moving averages (long term, medium term, and short term), gold's returns over the next 2+ months were poor. The 2011, 2006, and 1999 cases all saw gold pullback sharply. The 1982 case saw gold rally a bit further before forming a multi-year peak. And only the 1979 bubble saw gold explode even higher:
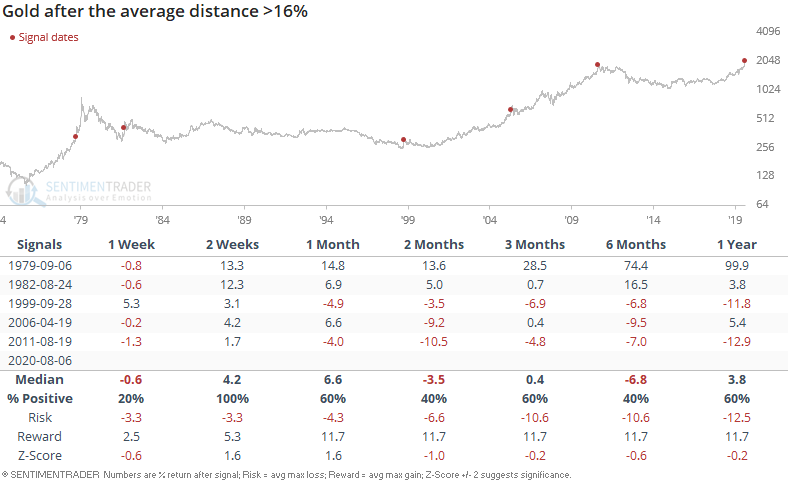
Here's the risk:reward table.
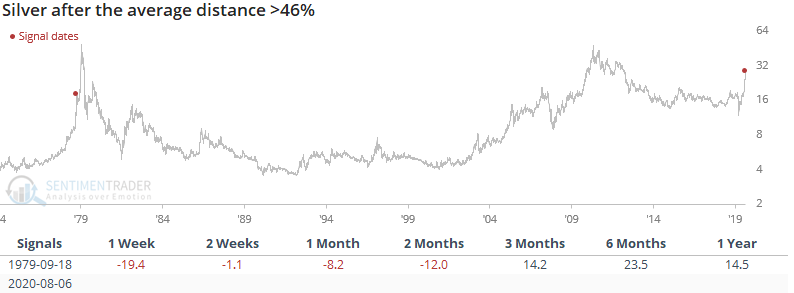
Silver's explosive rally is equally rare, and can only be compared with silver's bubble in 1979-1980:
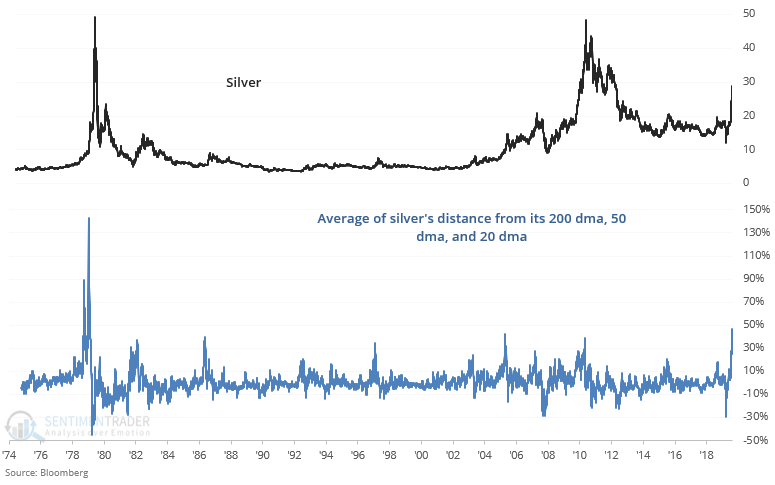
That historical case saw silver pullback quickly before surging 1 last time to the end of its bubble:
Bubble tops are notoriously hard to predict and trying to time the top is practically futile. You can find plenty of reasons why the exact top is here already, and you can also find plenty of reasons why gold and silver should surge even further. All we can say here is that this isn't a good time to be long from a risk:reward perspective.
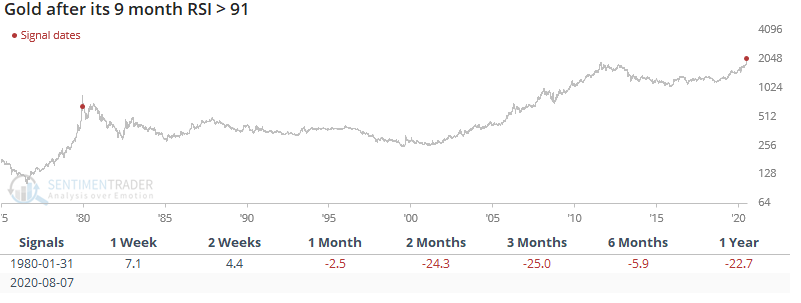
From a slightly longer term time frame, gold's 9 month RSI is at one of the highest readings ever:
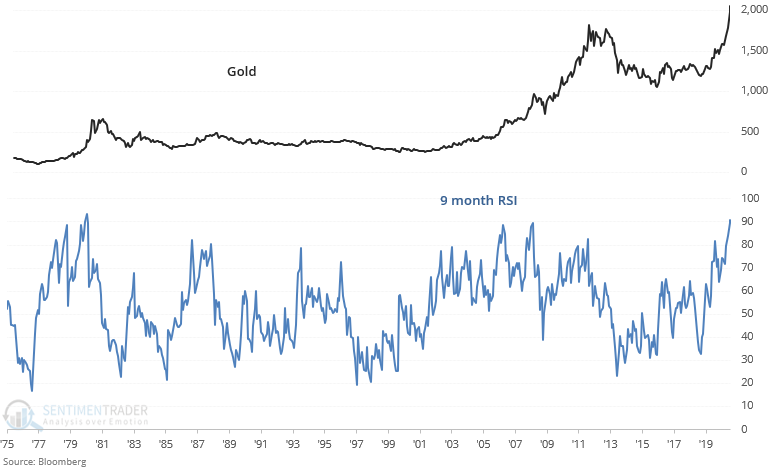
The prior high came just as gold was about to peak: