Products
SentimenTrader Trading Tools
‍
Backtest Engine
My Trading Toolkit
Correlation Analysis
Seasonality
Indicators & Data API
‍
Proprietary Indicators & Charts
Market Data API
Strategies & Scanner
‍
50+ Trading Strategies
Smart Stock Scanner
Research Reports
‍
Research Solutions
Reports Library
Free Resources
Simple Backtest Calculator
Simple Seasonality Calculator
The Kelly Criterion Calculator
Sentiment Geo Map
Public Research Reports
Pricing
Company
About
In the News
Testimonials
Client Success Stories
Contact
Log inLoginSign up
< BACK TO ALL REPORTS

Failed vs successful bear market rallies

Jason Goepfert
2020-04-20
Stocks have enjoyed a historic rally from a 52-week low. Even during failed rallies that end up leading to lower prices longer-term, the initial rally has usually led to a pullback then another rally attempt. Successful lows also see some shorter-term pullbacks, with a plateau over the next 1-3 months.

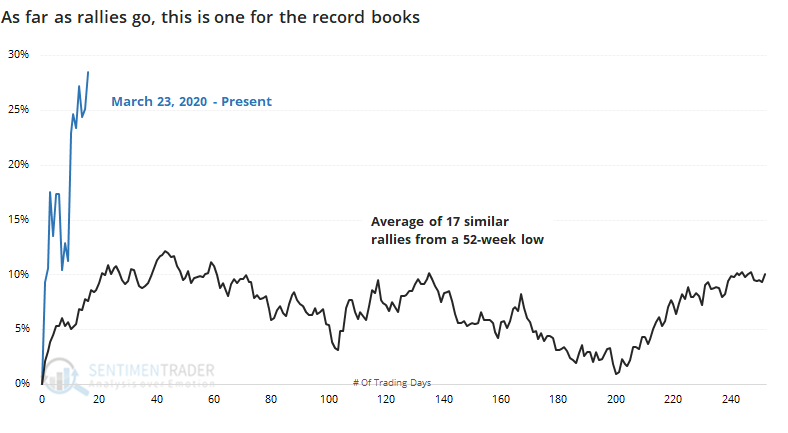
As far as rallies from a low, the past few weeks have been epic. It's been well-documented that stocks have enjoyed one of the best-ever stretches over the past couple of weeks, pushing the S&P 500 nearly 30% off its 52-week low.

If we go back to 1928 and look at every time the S&P managed to rally for this long off of a low, we can get a sense for how it performed afterward, depending on whether the rally ended up being a success or failure.

The chart below shows every time it rallied for 18 sessions off a 52-week low, gaining at least 5%.

When the rebounds ultimately succeeded, these initial kick-off rallies tended to hit the pause button right about now. Once we got about 20 days into the recovery, the S&P often plateaued, chopping around for weeks at least.

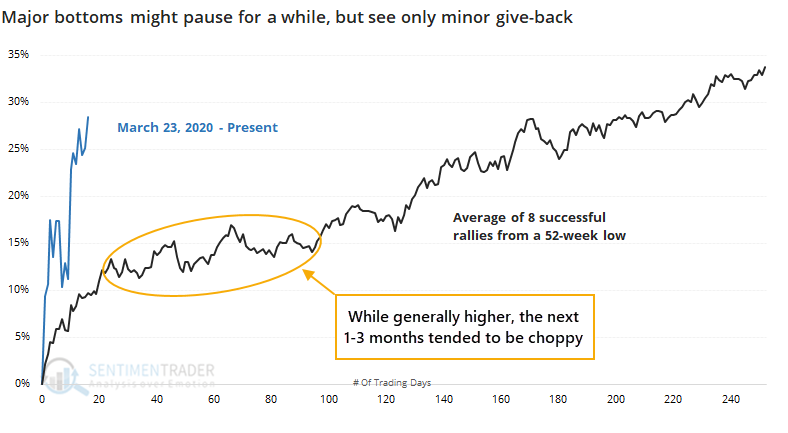
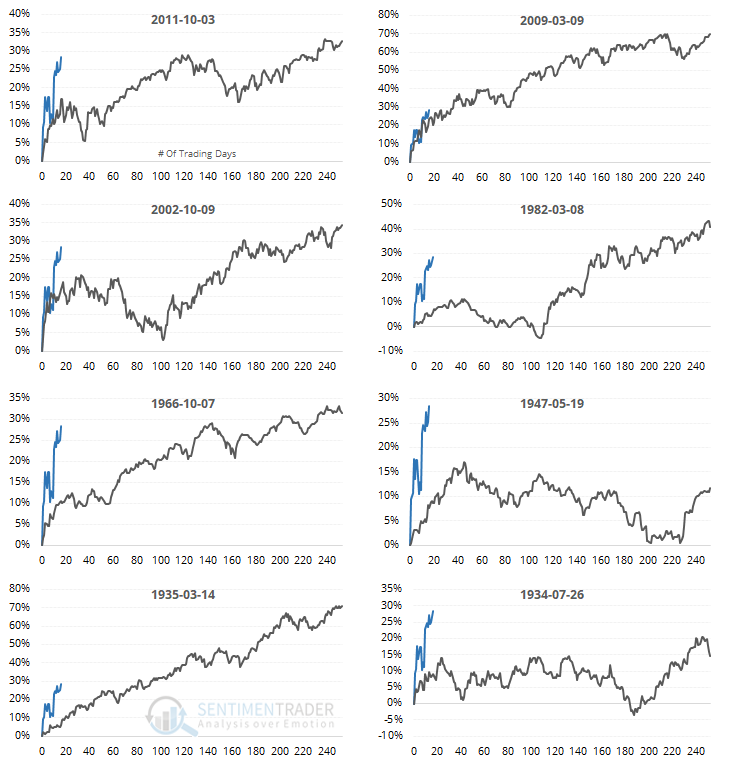
There was wide variability among the samples, but there were only two bottoms that took off like a rocket and just kept going, in 2009 and 1935. Otherwise, buyers paused for a while and digested those initial gains.

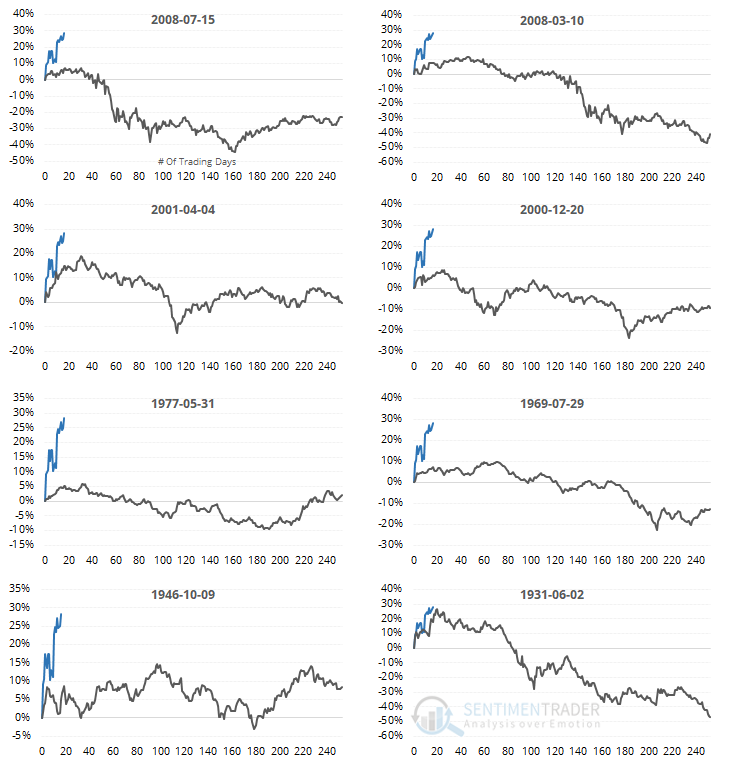
Now, let's look at the failures. These are times when the S&P also made a major push off a 52-week low but ended up seeing either a negative or only slightly positive return over the next year.

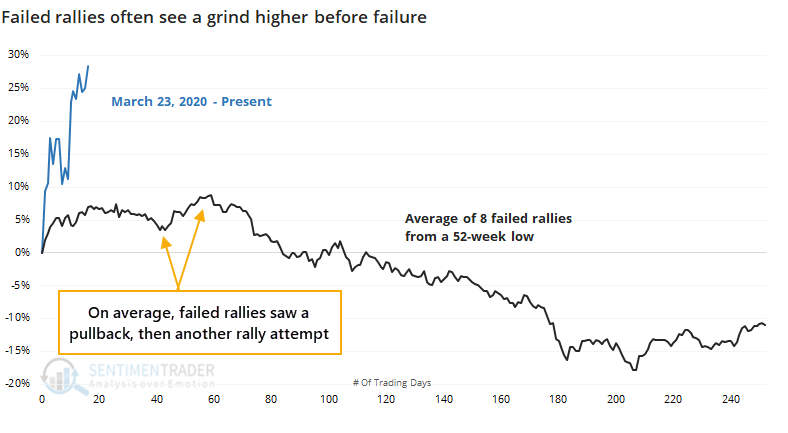
Even though these rallies ended up failing, it usually didn't happen right away. While the initial kick-off rally often paused right around now, there was another round of buying interest following the dip. This was the first real opportunity for buyers who didn't catch the falling knife, and missed out on the initial rebound.

It's interesting how rare it was to see the S&P roll over and head to new lows immediately, even during what ultimately proved to be failures.

Nothing is guaranteed, and we're in one of the most unique market environments in recorded history. If we can count on investor behavior repeating in a very general sense, then we should see buyers try to make another attempt following the first real pullback, even if we're due for a long-term slog and more protracted bear market.

Sorry, you don't have access to this report

Upgrade your subscription plan to get access
Go to Dasboard
PRODUCTS
SentimenTrader
Trading Tools
Indicators & Data API
‍
Strategies & Scanner
‍
Research Reports
FREE
RESOUrCES
Simple Backtest
Calculator
Simple Seasonality
Calculator
The Kelly Criterion
Calculator
Sentiment Geo Map
‍
Public Research Reports
‍
Pricing
Bundle pricing
‍
Announcements
‍
FAQ
COMPANY
‍
About
‍
In the News
‍
Testimonials
‍
Client Success Stories
CONTACT
‍
General Inquiries
‍
Media Inquiries
‍
Financial Professionals Inquiries
‍
© 2025 Sundial Capital Research Inc. All rights reserved.
Setsail Marketing
TermsPrivacyAffiliate Program
Risk Disclosure: Futures and forex trading contains substantial risk and is not for every investor. An investor could potentially lose all or more than the initial investment. Risk capital is money that can be lost without jeopardizing ones’ financial security or life style. Only risk capital should be used for trading and only those with sufficient risk capital should consider trading. Past performance is not necessarily indicative of future results.

Hypothetical Performance Disclosure: Hypothetical performance results have many inherent limitations, some of which are described below. No representation is being made that any account will or is likely to achieve profits or losses similar to those shown; in fact, there are frequently sharp differences between hypothetical performance results and the actual results subsequently achieved by any particular trading program. One of the limitations of hypothetical performance results is that they are generally prepared with the benefit of hindsight. In addition, hypothetical trading does not involve financial risk, and no hypothetical trading record can completely account for the impact of financial risk of actual trading. for example, the ability to withstand losses or to adhere to a particular trading program in spite of trading losses are material points which can also adversely affect actual trading results. There are numerous other factors related to the markets in general or to the implementation of any specific trading program which cannot be fully accounted for in the preparation of hypothetical performance results and all which can adversely affect trading results.

Testimonial Disclosure: Testimonials appearing on this website may not be representative of other clients or customers and is not a guarantee of future performance or success.